Article

Patterns of Change and Successional Transition in a 47-Year Period (1973–2020) in Rangelands of the Tamaulipan Highlands, Northeastern Mexico

by
Lucas Hernández-Hernández
,
Pedro Almaguer-Sierra
,
Ludivina Barrientos-Lozano
*,
Uriel Jeshua Sánchez-Reyes
,
Aurora Y. Rocha-Sánchez
and
Juan Flores-Gracia
Tecnológico Nacional de México-Instituto Tecnológico de Ciudad Victoria-División de Estudios de Posgrado e Investigación, Boulevard Emilio Portes Gil No. 1301, C.P. 87010 Ciudad Victoria, Tamaulipas, Mexico
*
Author to whom correspondence should be addressed.
Forests 2023, 14(4), 815; https://doi.org/10.3390/f14040815
Submission received: 23 March 2023 / Revised: 10 April 2023 / Accepted: 12 April 2023 / Published: 15 April 2023
(This article belongs to the Topic Forest Ecosystem Restoration)

Abstract

:
Rangelands in arid and semi-arid regions are the main source of livestock feed. The fragmentation of these ecosystems by continuous grazing gives rise to the modification of ecological processes, which alters the structure and functionality of plant communities. Therefore, the use of geographic information systems and the analysis of satellite images are important to monitor spatial changes and to evaluate these areas in the Tamaulipan Highlands of northeastern Mexico. This work aimed to evaluate the current state of the rangelands and to determine the percentage of modified areas as well as propose the time of permanence, succession, or recovery of five different areas destined for rangelands. For the analysis, Landsat satellite scenes from the period 1973–2020 were used: they were classified into four categories using segmentation and maximum likelihood analysis, as well as a cross-tabulation method to determine the degree of succession. An increase in rangelands was found in three of the five areas analyzed in the period from 1973 to 2020. As rangeland areas increase, the coverage of pine–oak forests, submontane–thorny scrub, and anthropogenic areas, decreases. The disturbance processes were not linear, and the increase in rangeland areas was greater in xerophilous scrub and secondary vegetation. This work is the first contribution that evaluates the changes in land use and cover in grazing areas compromised by continuous grazing in the Tamaulipan Highlands and Mexico. In addition, the results indicate the importance of performing studies based on the coexistence of wildlife and livestock as well as the interaction between soil degradation and plant diversity with the increase in rangelands.

Graphical Abstract

1. Introduction

Rangelands are soil or land areas with characteristics for supporting different types of vegetation, including scrub, grassland, “chaparral”, steppe, or prairie (treeless landscapes), which serve as a food source for both domestic herbivores and ungulates [1,2]. They are closely related to extensive grazing and are characterized by the type of vegetation and climate [3]. Globally, they include natural pastures, scrublands, savannahs, and some types of forests such as pine–oak forests [4], covering between 40 and 50% of the world’s land surface [5], and in Mexico, they occupy 58% of the territory [6,7]. Rangelands are considered dynamic systems influenced by multiple factors, such as climate, topography (parent rock, elevation), soil characteristics, overgrazing regimes, fire frequency, climate change, communication routes, the expansion of urbanization, agriculture, livestock, mining, tourism, and extraction [8,9,10,11]. In this regard, they contribute to the livelihood of between 1 and 2 billion people who live and depend directly on rangelands [12,13,14]. However, it is estimated that around 20% of these areas have been degraded worldwide [15], contributing to reduced productive capacity attributable to overgrazing and the expansion of crop areas [16], the climate change and fire regimes [10], as well as unsustainable management by farmers [1].
The fragmentation of these ecosystems has resulted in a wide and heterogeneous number of serious implications, such as the decrease in livestock production [12] and the increase in undesirable, toxic, and unpleasant plant species for livestock [17]. Several species of plants have been reported, but those of the genus Lantana and Karwinskia stand out and cause serious economic damage to farmers in Mexico and the world [18,19]. The scarcity of forage species decreases dry matter production and soil compaction [20]. Ultimately, it results in the altered structure and functionality of plant communities, energy flow, and nutrient cycling [21], as well as increased global poverty [22]. To deal with these consequences, public policies and social programs have been created that benefit park rangers and other inhabitants [23], although most have not been successful and have proven to be socially and/or ecologically unfeasible due to the high economy or poor application [24,25]. Therefore, the sources of its decline, its ecological and social impact, as well as the transformation toward other land uses and their sustainable management, must begin to be evaluated from a multifactorial approach [13].
In this sense, the studies that evaluate the recovery processes of plant communities, as well as the effects of these alterations on fauna [26], become essential in rangeland areas. In addition, it is interesting to know if the disturbance caused by cattle results in an arrested or progressing succession, or if continuous grazing results in a stable state different from that of the original community [27]. By recognizing the impacts of these changes on rangelands at the local level [28], it would be possible to assess carrying capacity, vegetation cover, and productivity in each area. As a result, the local communities in charge of the direct management of natural resources could implement better recovery and restoration strategies in the short, medium, and long term [29,30,31]. This can be achieved through observations of land cover changes over time and space [32]. In this sense, the analysis of satellite information through simple biophysical models has been used to evaluate the growth of vegetation [33]. Moreover, there are effective and recent methods, such as remote sensing, the implementation of geographic information, and the analysis of satellite images, which can be used to detect, quantify, and even predict temporal patterns of change in vegetation [34,35,36]. The availability and easy access to a large amount of geographic data and satellite images had facilitated a considerable increase in such analyses [37].
In Mexico, it is estimated that just over 54% of the national territory has a vegetation cover typical of arid and semi-arid zones, dominated by scrublands, grasslands, and transition areas from semi-arid to temperate environments [38,39]. However, they have a high level of degradation due to changes in land use [40], and more than 1000 km2 per year in the last four decades have undergone processes of secondary succession [41]. Therefore, it is of great importance to carry out constant investigation and monitoring, since species with a high level of endemism converge in the country, which constitutes a diversification center for botanical families such as the Cactaceae, Crassulaceae, and Agavaceae [42,43]. Particularly in northeastern Mexico, the Tamaulipan Highlands (TH) represents a geographical province in which rangelands are composed mainly of xerophytic scrub, which is commonly used to feed cattle in extensive grazing [44]. Moreover, prolonged droughts and overgrazing have led its inhabitants to increase cultivation activities, resulting in the fragmentation of this habitat [45]. Therefore, the TH represents a model ecosystem to monitor the erosion of rangelands; hence, we hypothesize that the percentage of grazing area increased during the period of 1973 to 2020 and that a high degree of succession exists between temporal stages. The objectives of this work were: (1) to evaluate the current state of the rangeland according to different temporal stages based on Landsat scenes over a period of 47 years, and (2) to propose the time of permanence, succession, or recovery of the rangeland.

2. Materials and Methods

2.1. Description of the Study Area

The state of Tamaulipas has 43 municipalities grouped into six regions, each one with geographical, cultural, and economic characteristics [46]. The Tamaulipan Highlands (TH) region is in the southwest of the state and is integrated by five municipalities: Jaumave, Palmillas, Miquihuana, Bustamante, and Tula, bordered to the south by the state of San Luis Potosí and to the northwest by Nuevo León and San Luis Potosí (Figure 1).
The TH occupies an area of 8518 km2 embedded in the Eastern Sierra Madre (58%), covering part of the “El Cielo” Biosphere Reserve and the “Altas Cumbres” Natural Protected Area, both in the municipality of Jaumave. Its elevational range varies between 400 and 3400 m above sea level (masl), and there is also a hydrological region [47,48]. The prevailing climate is arid–temperate with annual average temperatures of between 12 °C and 18 °C, with February being the coldest month with values between −3 °C and 18 °C, while the highest temperatures average 22 °C in May. The average precipitation of the driest month is 40 mm, with maximum values of 280–350 mm (43%–55%) from May to September, and a percentage of interannual rainfall of 5 to 10% [49]. The climatic variations and its geographical position have originated 14 types of vegetation among these temperate forests (pine forest, oak forest, pine–oak forest, and oak–pine forest), xeric scrub (crasicaule scrub, microphyll desert scrub, and rosetophyllous desert scrub), submontane scrub, tascate forest, natural grassland, halophilic grassland, tropical vegetation (low deciduous forest and low subdeciduous forest), and cloud forest [50,51]. These characteristics have mainly allowed the extensive exploitation (extensive grazing) of goats in the TH, resulting in 96% of its land cover with livestock capacity being used for goat farming, thus being the state region with the highest production potential for this species [52,53]. Goat production is an agricultural subsistence activity for rural producers with limited resources, representing the main livestock monetary activity in the desert and semi-desert areas [54,55]. In this regard, Tamaulipas has a head of around 275,563 goats [56] of which 72,942, in 2012, inhabited the TH [57], hence the economic importance of the study area.
In addition, the TH is recognized for its great biological importance: the origin of multiple endemic species [58], the diversification of botanical families such as Cactaceae, Crassulaceae, and Agavaceae [42,43], being part of the migratory route of the monarch butterfly (Danaus plexippus) [59], and an isolated distribution area of the Mexican endangered species (NOM-059-SEMARNAT) green macaw (Ara militaris) [60]. Social and cultural factors are also of transcendence for the study area: the Tula municipality is considered a “Magic Town” for its architecture and for being the oldest town in Tamaulipas, over 400 years old; it also has the denomination as the origin for producing distilled Agave beverages. Palmillas and Bustamante stand out for their old haciendas and cobbled streets, while Miquihuana is characterized by its pine–oak forests and the highest altitude areas in Tamaulipas (3400 masl), giving rise to landscapes of cold and snowfall in winter, resulting in the existence of a high-end ecotourism municipality [61,62]. However, it is important to highlight that despite this, the TH is the region with the highest poverty rate in Tamaulipas, impacting 73% of its inhabitants (57,387), with Bustamante and Miquihuana having the highest rates of poverty and marginalization in Mexico, which results in immediate dependence on ecosystem services [63,64].

2.2. Data Acquisition and Preprocessing

According to the Rural Development Support Centers, the Rural Development District, and diagnoses of extensionists, goats are the predominant livestock activity in the TH. A good number of communities are committed to this activity, for example, (1) the Ejido San Rafael in Tula, (2) El Llano y Anexas in Bustamante, (3) La Peña in Miquihuana, (4) San Antonio in Jaumave, and (5) San Vicente in Palmillas. These five localities were selected for the analyses in this study (Figure 1), and Landsat satellite scenes of eight temporal stages were used for each locality. Orthorectified scenes from 1973, 1980, 1986, 2000, 2005, and 2009 were downloaded from the Global Land Survey project; these were selected based on spatial, temporal, spectral, and radiometric resolutions, which represent a suggested period for the analysis of land cover and change [65] at the Global Land Cover Facility website [66]; the 2016 and 2020 scenes were obtained as a Landsat 8 OLI/TIRS C1 Level-1 dataset from the USGS Global Visualization Viewer online site [67,68]. As far as possible, scenes from the same period were selected to minimize the effect of seasonality on the vegetation. The delimitation of each locality in the Landsat scenes was conducted using ENVI 5.0 (version 5.0, Boulder, CO, USA) [69]. Different geographical extensions were considered because each Ejido occupies a different land use area, considered “communal land”: San Rafael with 126.8 km2 (140,896 pixels), San Antonio with 45.5 km2 (50,496 pixels), La Peña with 39.1 km2 (43,512 pixels), El Llano y Anexas with 118.5 km2 (131,670 pixels), and San Vicente with 42.28 km2 (46,986 pixels) [70]. These localities represent the main areas of livestock activity and were selected according to the diagnoses of local extensionists [44]. The characteristics of each of the scenes are presented in Table 1.

2.3. Data Acquisition and Preprocessing

The method followed for the evaluation of changes in land use and land cover (LULC) and the estimation of successional time is thoroughly detailed in previous research [26]; some modifications were made, such as the choice of training fields based on the types of vegetation and the number of TH scenes analyzed. Procedures are briefly summarized here. First, we use a supervised segmentation with a zero-similarity tolerance value as an initial parameter: image pixels are automatically grouped based on differences in their spectral characteristics, so the resulting segments have a variable number of pixels and minimal overlap with respect to other segments [71]; then, 30 segments were selected as training fields for each one of the changes in LULC categories. These categories were established based on the descriptions of the land use and vegetation vectorial data sets published by the Mexican National Institute of Statistics and Geography (INEGI) and recent descriptions of vegetation types for the study area [50,51,72,73,74,75,76,77,78,79]; false color images, Google Earth imagery, and previous field knowledge of the localities were also considered in this delimitation.
Nine LULC categories were defined, although some differed among the five locations due to plant species composition and structure among the different types of vegetation. These categories are the following: xeric scrub (SX), submontane scrub (SS), bare soil (LB), agriculture (A), pine–oak forest (POF), secondary shrubby vegetation of pine–oak forest, and tascate forest (Table 2); only two of them, namely the xeric scrubland and the secondary shrubby vegetation, are considered as rangeland (see more details in the successional analysis). Selected training fields for each category were used to create its spectral signature with the corresponding Landsat bands (Table 1). A hard classification method was then conducted using the maximum likelihood algorithm (MAXLIKE) with the parameter of same probabilities for signatures. MAXLIKE stands out from other algorithms because it represents the intercorrelation between bands, incorporates information about the covariance between bands and its inherent variance, calculates the posterior probability of belonging to each class, where the probability is greater in the position of the middle class, and decreases in an elliptical pattern away from the mean [71]. The description and quantification of the LULC categories, and the patterns of change between pairs of years, were quantified as area/percent extension (km2) separately for each location. The above procedures were run on IDRISI Selva (version 17.0, Worcester, MA, USA).

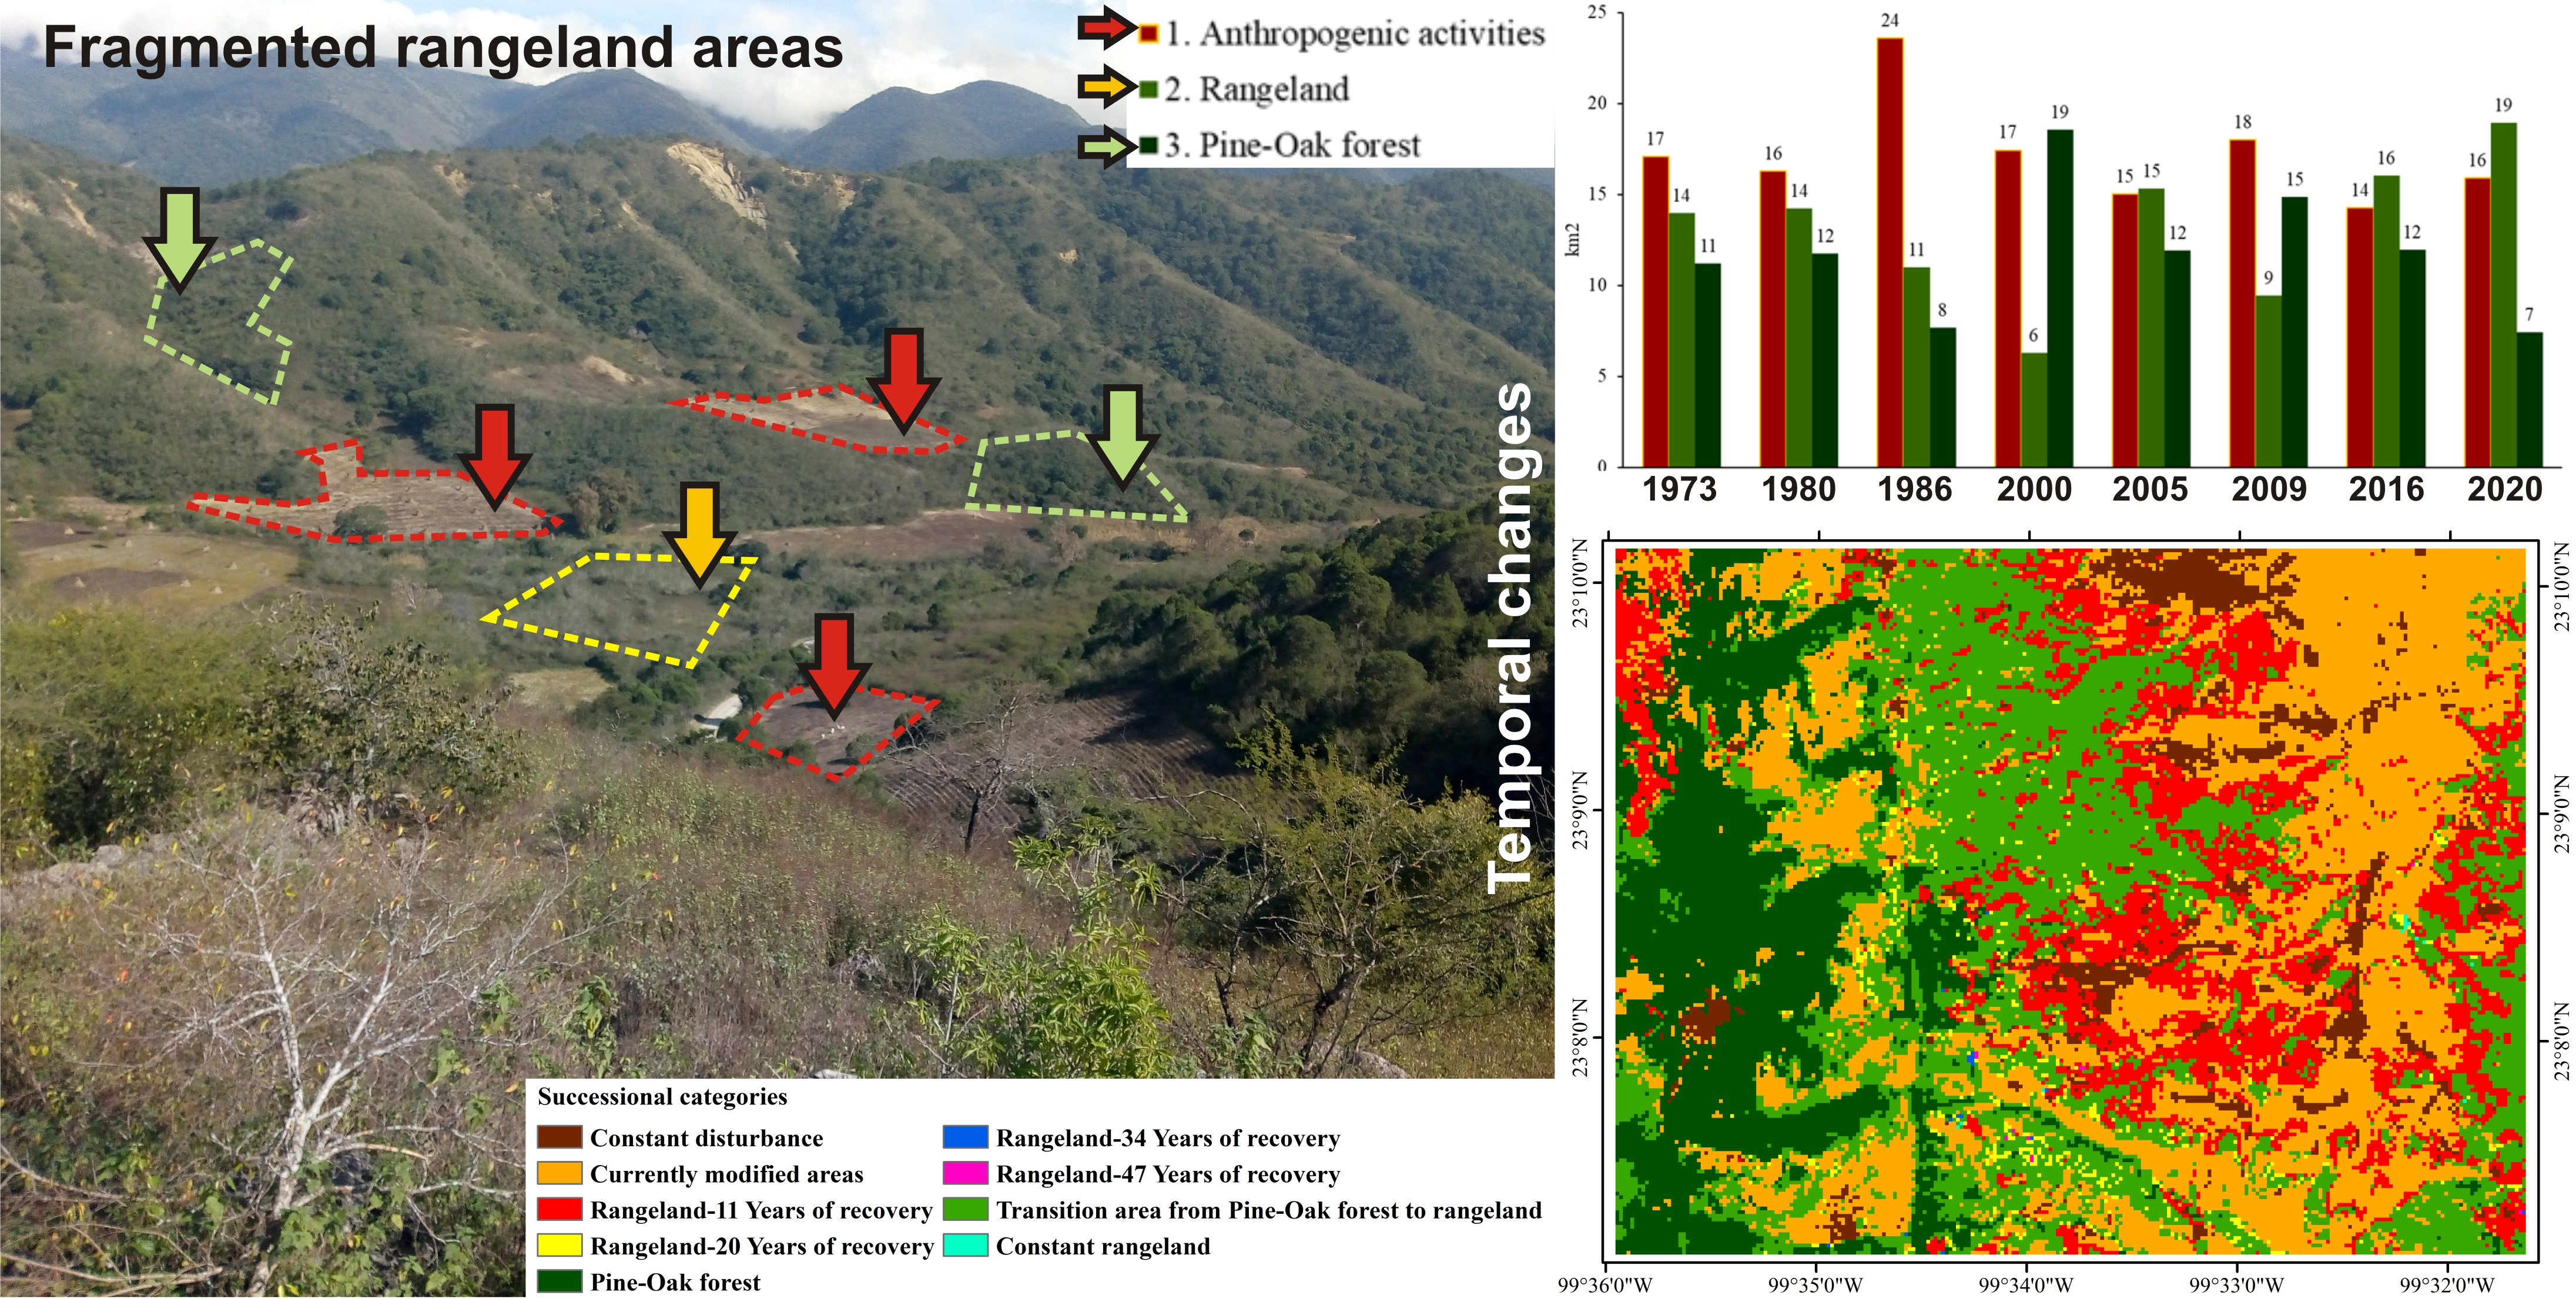
2.4. Succession Analysis

As indicated above, we used a previously established step-by-step method [26] to determine the approximate successional time based on a cross-tabulation, linking the transitional image of each pair of years with the following year, and repeating the process until complete (Figure 2); this process is described briefly here. As a first step, the LULC categories in each image were reclassified into only three categories: “anthropogenic activities” (Table 2, categories 3 and 4), “rangeland” (Table 2, categories 1 and 6), and a third one that was either “Submontane scrub”, “pine–oak forest”, or “tascate forest”, depending of the locality analyzed (Table 2, categories 2, 5, and 7). These three simplified categories were used to have a more precise and understandable analysis. The xeric scrub and the secondary vegetation of pine and oak forests were considered rangeland since it is known that the inhabitants use these areas more frequently for cattle grazing due to the abundance and availability of forage [39]. This resulted in new reclassified images, called here as “Simplified images” (Figure 2).
For the next step, we considered only the simplified images of 1973, 1986, 2000, 2009, and 2020. These were used to perform the cross-tabulation analysis, comparing the 1973 image with the 1986 image, resulting in an image of transition from the changes between the two years. This new file was compared to the simplified image of the year 2000, resulting in a new transition image. The procedure was repeated until all the temporal stages were linked (Figure 2), which originated a final transition image (Figure 2) with a variable number of total categories, since the patterns of change were different between locations (Table 3). The process is briefly described here.
The final transition image of each locality was reclassified into only nine categories of succession based on the persistence or transition of the LULC categories. The criteria for the designation of successional categories after the reclassification is described here.
  • Category 1. Constant disturbance: areas where anthropogenic activities persisted and remained unchanged during each of the five temporal stages up to 2020.
  • Category 2. Currently modified: areas without a permanent disturbance but with the presence of anthropogenic activities in 2020.
  • Category 3. Constant rangeland: areas of rangeland that remained unchanged during the five stages up to 2020.
  • Category 4. Rangeland—47 Years of succession: areas that were disturbed in 1973 but showed rangeland vegetation in 1986 and persisted up to 2020.
  • Category 5. Rangeland—34 Years of succession: areas that were disturbed in 1986 but showed rangeland vegetation in 2000 and persisted up to 2020.
  • Category 6. Rangeland—20 Years of succession: areas that were disturbed in 2000 but showed rangeland vegetation in 2009 and persisted up to 2020.
  • Category 7. Rangeland—11 Years of succession: areas that were disturbed in 2009 but showed rangeland vegetation in 2020.
  • Category 8: Transition area to rangeland: areas of submontane scrub, pine–oak forest, or tascate forest in 2009 that changed to rangeland in 2020.
  • Category 9: Submontane scrub/pine–oak forest/tascate forest: any area of these three categories that were present in 2020.
For each category, the area values (km2) and percentages were calculated. All of the above procedures were performed using IDRISI Selva (version 17.0, Worcester, MA, USA). Land cover and succession maps were generated in ArcGIS (version 10.9, Redlands, CA, USA) [80].

3. Results

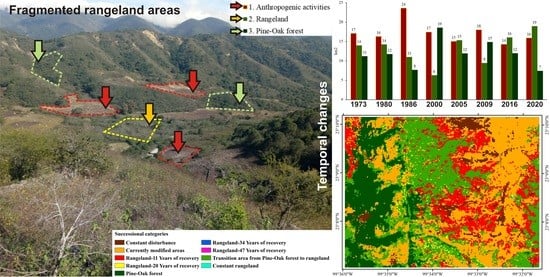
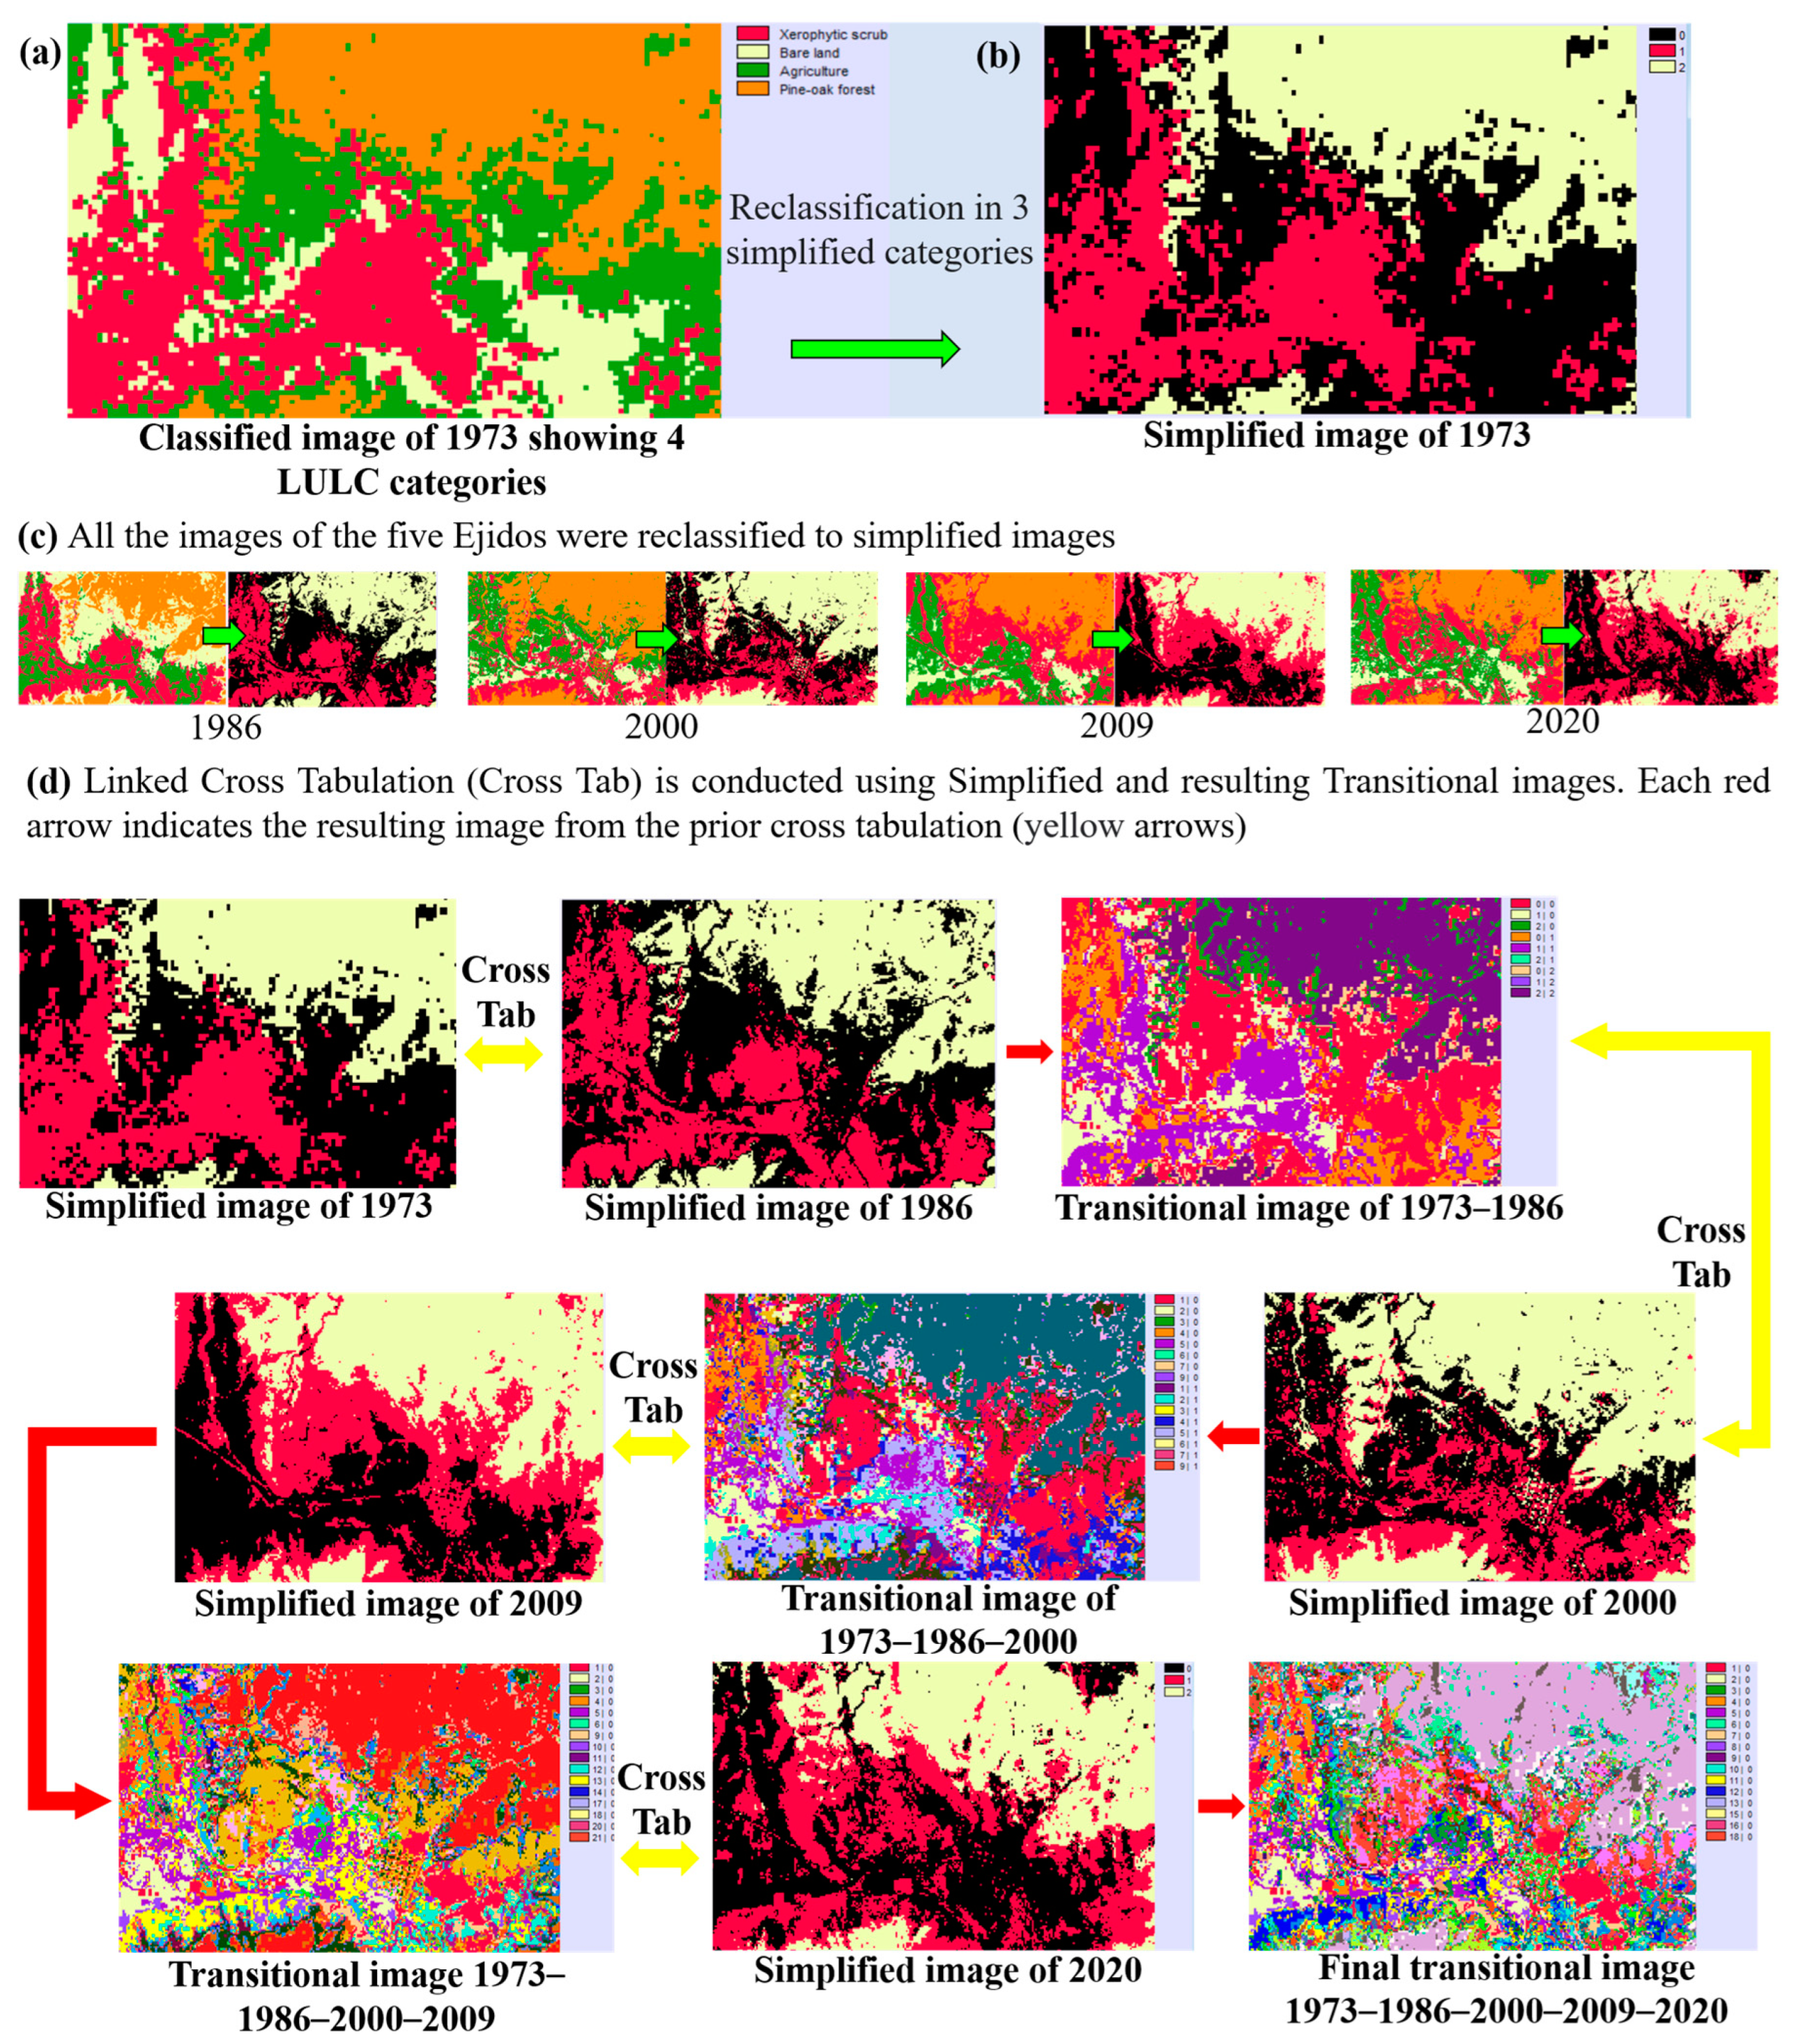
3.1. Changes in Land Use and Vegetation Cover in San Rafael, Tula, Tamaulipas

The soil cover in 1973 consisted of 42 km2 of anthropogenic activities (33%), 53 km2 of rangeland (42%), and 32 km2 of submontane scrub (25%). By the year 2020, the changes were notorious, since high percentages of transition from anthropogenic activities (9 km2, 7%) and submontane scrubland (20 km2, 15%) to rangelands were obtained, which occupied 81 km2 (64%) of the total area of 127 km2 (Figure 3, Appendix AFigure A1).
The analysis of the LULC change between each pair of years showed an increase in rangeland, which was constant from 2009 to 2020. Likewise, it is observed that the rangeland increased its coverage percentage to 52% from 2005–2009, representing coverage of 82 km2 (Figure 4e). However, 10% of rangeland areas showed a transition to anthropic activities (9%) and submontane scrub (1%) from 2000 to 2005 (Figure 4d).
The current succession category with the greatest coverage (27 km2) in the town of Tula was the 20-year-recovery rangeland, covering 54% of the total area (Figure 5). Only 12.8 km2 remain as constant rangeland and 18.7 km2 of submontane scrub were converted to rangeland; these transition areas increased from east to west, mainly away from anthropogenic activities (Figure 6). On the other hand, the constant disturbance persisted from 1973 in 19.9 km2, and was geographically close to the constant (Figure 6), while the submontane scrub represented 12.3 km2 (Figure 5).

3.2. Changes in Land Use and Vegetation Cover in San Antonio, Jaumave, Tamaulipas

The total coverage of land use for anthropic activities in 1973 was 18 km2 (39.60%), 19 km2 (41.73%) for rangeland, and 8 km2 (18.66%) for submontane scrub. After 47 years, anthropic activities decreased to 21.40% (10 km2), rangeland increased its coverage to 60.09% (27 km2), and the submontane scrub maintained a similar coverage area (8 km2, 18.49%) (Figure 7, Appendix AFigure A2).
The greatest contribution to the percentage of changes was in the comparison of 1980–1986 (Figure 8b): only 22% of the rangeland persisted until 1986, while 20% changed to anthropic activities and 19% to submontane scrubland; both occupied 61% of the total land cover of that year (45.4 km2). From this comparison of scenarios, the rangeland lost 8% in the 2016–2020 vs., 2009–2016 scenes (Figure 8g), which was displaced by anthropic activities and submontane scrub (4%).
The successional categories with the greatest rangeland recovery area were those of 11 and 47 years, with 5.4 and 4.9 km2 of extension, respectively. In total, the cover in a state of recovery represented 13.1 km2 (29.11%), while 5.1 km2 (11.33%) was constant rangeland, and 20.44% (9.2 km2) changed from submontane scrubland to rangeland (Figure 9); therefore, most of the polygon showed an irregular distribution, suggesting a noticeable null rotation of the rangeland (Figure 10). Until the year 2020, 8.88% (4.0 km2) of the land cover remained with a constant disturbance, and 5.8 km2 (12.88%) was modified by anthropic activities; submontane scrub vegetation represented 18.66% (8.4 km2) (Figure 9) and occupied isolated areas with most of its distribution to the northeast of the polygon (Figure 10).

3.3. Changes in Land Use and Vegetation Cover in La Peña, Miquihuana, Tamaulipas

In the 1973 period, anthropic activities covered a total area of 16 km2 (41.89%) in La Peña, followed by 12 km2 (31.83%) of pine–oak forest, and 10 km2 (26.27%) of rangeland. The changes for the year 2020 were not remarkable, since a similar coverage area persisted for the category of anthropic activities (15 km2 representing 37% of total area) and rangeland (12 km2, 30.41%). Interestingly, the pine–oak forest cover increased to 32.11% (13 km2) (Figure 11, Appendix AFigure A3).
Rangeland cover had a considerable increase from 2000 to 2005 (Figure 12d); 11% of this category persisted between years, while 17% of anthropic activities, and 11% of pine–oak forest showed a transition to rangeland in 2005. Together, this category represented a coverage of 15.63 km2 (39.92% of the total 39 km2) during that period. In comparison, a decrease to 30% of total coverage for rangeland coverage, was observed for 2016–2020 (Figure 12g).
According to the successional analysis, 7.3 km2 (18.71%) belonged to rangeland areas in a recovery stage, with the highest value (3.4 km2) observed in the 11-years category. Lower values were constant rangeland, only 0.6 km2 (1.53%), and 10.25% (4.0 km2) was modified from pine–oak forest to rangeland. By 2020, 2.1 km2 (5.38%) remained a constant disturbance, while 32.05% (12.5 km2) of the coverage was currently modified by anthropogenic activities. The land cover category with the largest area was the pine–oak forest with 12.6 km2 (32.30%) (Figure 13), which covered a greater proportion of land to the north and, to a lesser extent, to the south. It is important to point out that the anthropic activities and the rangeland were located on the rangeland plain. In addition, it was observed that anthropic activities and the rangeland were displacing areas of pine–oak forest (Figure 14, Appendix AFigure A3).

3.4. Changes in Land Use and Vegetation Cover in San Vicente, Palmillas, Tamaulipas

Anthropogenic activities in 1973 were the LULC category with the largest coverage, occupying 17 km2 (40.20% of the total area), followed by rangeland with 33.10% (14 km2) and the pine–oak forests with 26.70% (11 km2). In contrast, anthropogenic activities decreased in coverage for the 2020 period, remaining at 37.83% (16 km2). Likewise, rangeland considerably increased in area to 19 km2 (44.93%); however, the pine–oak forests lost 10% of coverage, remaining with 16.55% (7 km2) (Figure 15, Appendix AFigure A4).
The total coverage of rangeland had a considerable increase in the 2009–2016 period (Figure 16), where 13% of this vegetation persisted between both years. In addition, 13% of the areas with anthropogenic activities and 12% with pine–oak forests were converted into rangeland in the same period, with a total coverage of 16.05 km2 (38.0% of a total of 42 km2) (Figure 16g).
The current rangeland in the town of Palmillas was mainly integrated by areas with less succession time, being those that have not been disturbed since 2009 (6.78 km2), as well as by a considerable area of 11.57 km2 (27.36%) of pine–oak forest that became part of the rangeland (Figure 17 and Figure 18). The proportion of areas with different times of succession or persistent rangeland was very low, less than 1 km2. Regarding anthropic activities, 2.28 km2 (5.39%) remain under constant disturbance and 32% (13.62 km2) are currently modified in 2020. The actual coverage of the pine–oak forest was 7.44 km2 (17.59%) (Figure 17), concentrated to the west of the polygon and surrounded by transition areas to rangeland (Figure 18). In addition, anthropic activities are gaining ground toward the pine–oak forest vegetation (Figure 18, Appendix AFigure A4).

3.5. Changes in Land Use and Vegetation Cover in El Llano y Anexas, Bustamante, Tamaulipas

In 1973, the category of anthropic activities comprised 64 km2, representing more than 50% (54%) of the area of the polygon; rangeland covered 28 km2 (23.62%) and the cover of the tascate forest was 21.94% (26 km2). After 47 years (2020), anthropic activities maintained their coverage at 63 km2 (53.16%); however, rangeland increased its area to 38.81% (46 km2), while the tascate forest lost 65% of its coverage, leaving only 9 km2 (Figure 19, Appendix AFigure A5).
The main increase in rangeland cover occurred from 2000 to 2005 (Figure 20d), since 44% of the areas were covered by anthropic activities, and 9% of tascate forest changed to rangeland; only 9% of the original areas persisted between years. Thus, for this period, the rangeland had 62% of the total land cover (74 km2 of 119 km2) of this locality.
According to the successional analysis, 33.4 km2 (28.18%) of the area of the locality was represented by a recovery category of rangeland, being the areas with 11 years with the largest coverage (20.8 km2). Only 0.9 km2 (0.75%) was conserved as constant rangeland, and 9.62% (11.4 km2) changed from tascate forest to such category. In anthropogenic activities, 17.3 km2 (14.59%) persisted as a constant disturbance, and 38.90% (46.1 km2) were currently (2020) modified. The tascate forest remained with 7.84% (9.3 km2) of total cover (Figure 21), and its distribution appears fragmented due to the succession to rangeland. Anthropogenic areas and the rangeland were found throughout the polygon, although not following a clear geographical pattern (Figure 22, Appendix AFigure A5).

4. Discussion

4.1. Permanence, Succession, or Recovery of Rangeland Areas

In this study, we consider as rangeland, all areas with xeric scrub vegetation and secondary vegetation of pine–oak forest, since, for arid zones, these are the types of vegetation that most constitute rangeland areas [81]. Cultivated areas, urban areas, and areas without vegetation were considered anthropogenic areas. Similarly, pine–oak forest, tascate forest, and submontane scrub were identified as a forest category or vegetation with a canopy higher than the xerophytic scrub or secondary vegetation of pine–oak forest [82]. In this way, the presence of a disturbed area in a satellite image and its transition to a rangeland category in the next temporal stage suggests a recovery or successional process, which is useful to reconstruct the history of changes in the studied localities [83].
Currently, studies indicate that rangelands are going through a desertification process that in some areas varies from high to very high; however, it is also possible to identify levels of moderate-low susceptibility and safe areas [84]. In this sense, our study shows that the rangeland areas increased in general coverage over the years and that the anthropogenic areas decreased in the five localities, while the area of coverage for the tascate forest, the submontane scrub, and the pine–oak forest decreased in three locations, mainly due to a transition to rangeland. Such trends are contrary to our hypothesis; the reasons for our findings may be that the abandonment of crops and other areas is related to the recovery of the vegetation [85] and gives way to the development of thorny vegetation [86], which in this study was considered as rangeland. Likewise, the pine–oak forests in Mexico provide a source of goods and services for landowners, but are affected by overgrazing, pests, the mismanagement of rangelands, timber extraction, clearing for agricultural and livestock purposes, and fires. It is presumed that the fires are intentionally caused in the dry season of the year to stimulate the sprouting of grass to feed cattle that graze within the forests [87]. Based on this evidence, we assumed that the submontane scrubland and tascate forest, in our study localities, were primarily affected by overgrazing, logging, and clearing for livestock and agricultural purposes, which explains the increase in rangelands between years. On the other hand, we identified that the pine–oak forest increased its coverage in one site, which could have its origin in the implementation of reforestation programs with Pinus species in the locality since structural variables such as the height of trees and aerial biomass allowed the identification of the recovery of a reforested area after 14 years [88]. In addition, the development of ecotourism on this site allows the inhabitants to diversify activities and generate income since rural tourism boosts the local economy. Thus, government investment is necessary to take advantage of the interest of the population, retain migratory flows, and optimize the use of natural resources [89].
As for the submontane scrub, the rate of exploitation or pressure toward the trees is likely equal to that of recovery, so no increase in coverage is observed [90]. Consequently, the submontane scrub persisted between years because the locality has been the object of public regulation and planning programs for the use of rangelands for extensive cattle ranching [91]. This allows sustainability of the rangelands, since these programs exclude areas with strong pastoral pressure, and diversify activities that generate income and emigration of their inhabitants. Therefore, success in the good use and ordering of rangelands is synonymous with great commitment from the owners. An example has been documented in the state of Oaxaca, Mexico, where it was decided to parcel out the rangeland and provide equitable and rotating management on the properties belonging to this vegetation, which increased production, livestock inventories, and improvements in conditions [92]. Other experiments in Mexico have shown that exclusion in the communal rangelands has expressed a reduction in soil loss to below permissible levels, so it is suggested to leave or rest areas of 0.5 km2 distributed throughout the entire rangeland in accordance with the producers, and, subsequently, apply the rotational use of the resource [93]. Similar measures can be applied in other rangelands of Mexico to carry out sustainable management since we identified areas where the pressure toward the rangeland is evident. Supporting the above, it is recommended that areas with higher grazing pressure could be periodically reduced or eliminated, allowing populations of shrubs or succulent plants to flower, develop fruits, and form seeds, thus increasing the chances of vegetation regeneration [94].
Rotational grazing increases the number of species consumed by livestock; conversely, plant species within Gramineae, Compositae, Cactaceae, and Fabaceae are recognized as the most consumed by herbivores during continuous grazing [95]. In this study, it was possible to estimate the process of changes in rangelands over time and to identify areas of persistence or recovery. Therefore, our work supports the approach of having controlled grazing within the rangelands, which will allow adaptation of the stocking rate, the periods that the animals can remain in each area, as well as the characteristics and growth periods of the main forage species. Furthermore, identifying the degree of disturbance and recovery time of rangeland areas, as carried out here, supports the probabilistic model on susceptibility and sensitivity to desertification in different parts of the world [90,96]. In this sense, the areas within the evaluation sites that persisted as constant rangelands could be considered as minimally susceptible or conserved areas with a well-developed tree cover [97]. Field observations confirm that trees and shrubs, mainly of the genus Prosopis, provide an important source of food for livestock and sustenance for some families in the localities by harvesting the fruit [98], hence the need for the conservation and permanence of these areas. These succession and colonization processes of certain species are a function of time since dispersal characteristics differ between species depending on intrinsic reproductive strategy and motility patterns [99]. Therefore, it is recognized that future analyses are required within the study areas to characterize the vegetal composition of the successional patches as well as to determine their association with other environmental factors.

4.2. Successional Categories in Rangeland Areas

Several studies have demonstrated the degradation of rangelands caused by excessive or continuous grazing [10,100,101]. However, during the evaluation period, it was identified that the smallest rangeland area occurred in the year 2000 for most of the sites, and its coverage began to increase from 2005, although no linear trend was observed. Instead, we found that vegetation with the highest canopy and height, such as pine–oak forest, tascate forest, and submontane scrub, were declining in coverage, while rangeland areas that include xeric scrub and secondary vegetation increased; moreover, anthropogenic areas also tended to decline, giving rise to new rangeland areas. Indeed, studies at the local level indicated that communities with secondary vegetation, scrub, chaparral, or xerophytic scrub, considered in this study as rangeland, show a higher rate of increase in their area [26,102]. Knowing the changes in the vegetation cover over time in arid rangelands allows the monitoring of soil conditions and the identification of soil degradation processes [103]. These results may have their origin from shifting agriculture, in which any vegetal cover is cleared for the planting of basic crops until the soil loses its nutrients, then the land is abandoned allowing regeneration of the vegetation; after several years, the owners return and repeat the cycle [104]. In this sense, we observe that over time, there is no recovery of the original vegetation, but rather it remains as secondary vegetation or scrub. In Mexico, at the national level, there was an increase in the area occupied by secondary vegetation in the period 2000–2007, of which only 10% recovered as primary vegetation [105]; in the same way, the primary vegetation was only recovered in two localities of the Tamaulipan Highlands where it had been fragmented to grazing areas or anthropic activities. After the abandonment of agricultural land in arid zones, plant succession favors the dominance of species such as Prosopis glandulosa [106], or those resistant to the drastic soil conditions (cacti and woody legumes), which, although they are different from the primary vegetation, would increase the microheterogeneity of the soil and consequently the microsites of germination and establishment of new agriculture areas [107].
The general structure of arid ecosystems in the world is characterized mainly by a mosaic of patches composed of several species and immersed within a homogenous matrix, either bare soil or dominated by a single species [108]. The remnants of vegetation within these patches serve as a buffer for harsher abiotic conditions and benefit the establishment and development of seedlings [109]. Hence, the importance of the irregularities observed within the growing rangeland areas of the studied localities, which, although probably dominated by one species, contribute to the functioning of the ecosystem. In addition, open spaces generated in rangeland areas are replacing grasses with widely spaced thorny shrubs or bare soil [110,111] in which newly established species will prevail. On the other hand, the patches or mosaics formed over time in the study sites are transcendental since they would allow the recovery of other vegetation types. Such is the case for tascate forest and submontane scrub, which, according to analyses carried out, were the most affected categories.
Therefore, although fragmentation resulted in the development of more rangeland areas as mentioned above, it is also true that such phenomena would modify environmental conditions and ecosystem function by altering the hydrological regime, microclimate, and soil properties [112]. Likewise, the fragmentation of habitats into separate patches leads to the reduction in populations, exchanges, and migratory processes, as well as the loss or displacement of biodiversity [113,114,115]. Observed fragmentation in vegetation types over time is likely to have negative effects on threatened populations by modifying the species dynamics [116]. Changes in the original land cover are also reflected in the spatial structure of the landscape, such as the size, position, degree of isolation, or shape of the fragments [117,118], which is consistent with the results of our work. The degree of fragmentation and isolation of vegetation manifests demographic and genetic effects, which contribute to reducing the interaction of plants with their pollinators, generating microclimatic changes and reducing heterozygosity, ultimately affecting the viability of a population in the future [116]. Therefore, the coverage and succession analyses presented here could be an efficient tool to take urgent action and implement better management of the grazing areas of the Tamaulipan Highlands.
Undoubtedly, the areas evaluated in this study are in a clear fragmentation process and the trend is increasing. With the development of new rangeland areas, patches of original vegetation become smaller and more isolated. Invasive species arise as a problem for the conservation of native plants, so it is recommended to induce pollination in the original species [119]. Furthermore, it is important to increase the connection between fragments, as this can improve the chances of species survival over time [120]. Therefore, the research on changes in land use and successional categorization carried out here could be a model and an efficient tool for taking urgent action and better managing the grazing areas of the Tamaulipan Highlands. In addition, it is useful for the evaluation of the changes in the areas determined in the landscape and withstands scale, as suggested by some authors [121,122].

4.3. Use of Successional Categories as a Proposal for the Delimitation of Exclusion, Restoration, and Rotation Areas of Rangelands in the Tamaulipan Highlands

According to the observed results and the literature referred to in this work, the present study is expected to serve as evidence for the sustainable management of rangelands and as a basis for serious planning in the sustainable management of continuous grazing at the local and national levels. Through categorization and successional analysis, we found areas that persisted as constant rangelands for 47 years, while others had different recovery times, or even a transition process from other types of vegetation such as pine–oak, submontane scrub, or tascate forest. Our first suggestion is that these areas be excluded from grazing, as this approach has been shown to reduce soil losses [93,123]. In addition, grazing exclusion areas after 12 years favor rangelands restoration by increasing carbon and nitrogen content in both biomass and soil [124]. The size of the excluded area would depend on the result of the analysis, but mainly an initiative of the owners and the government, if the above is respected, seeking to restore the areas with the greatest vulnerability. These areas must be accompanied by ecological restoration practices such as the afforestation of native species with soil and moisture conservation works [125]. This could be achieved with plantations of multiple-use species, mainly forage, such as prickly pear (Opuntia sp.), Maguey (Agave sp.), and grasses for arid and semi-arid zones [126].
In this sense, it is recommended that areas destined for continuous grazing migrate to a rotational strategy, since rotational and resting grazing is considered to have ecological and socioeconomic benefits [127]; for example, better control, more uniform use of vegetation, and less selective grazing compared to continuous or traditional grazing. It results in the conservation of patches and desirable species, plant vigor could be maintained, increased abundance and cover of perennial species, and increased plant diversity [128]. It is necessary to note that on a larger scale, continuous grazing is concentrated near water bodies, which increases grazing pressure on vegetation patches that represent the initial stages of rangeland deterioration [101]. This is mentioned as there is research that contradicts the benefits of rotational grazing over continuous grazing [129].
Currently, global trends show a decrease in biodiversity, even with an increase in the number of protected areas [130], as well as a significant reduction in temperate and tropical forests, originating new areas of scrub and secondary vegetation [26], such as the findings of this work. With these arguments, we suggest, either at an experimental level or as public policies of local, state, and national governments, the rotational management of grazing in the rangelands of the Tamaulipan Highlands. This approach can be extended to Mexico and other countries as well since several studies in arid and semi-arid environments worldwide have shown positive results of rotational grazing on the effects of continuous grazing in terms of plant richness or diversity [131,132]. We consider that under the conditions related to the types of vegetation, types of soil, level of degradation, and/or fragmentation, the process toward the management of rangelands under rotational grazing can be initiated. Currently, technological tools have allowed us to know the history of land use and cover changes over time [133]; these could be used to locate areas with continuous grazing regimes and redistribute them. For this, it is important to prioritize the Mexican rangeland localities within natural, protected areas, followed by its surrounding sectors, and finally the areas without environmental protection but mostly degraded by continuous grazing. Likewise, it is suggested to start the rotation processes in the areas with the shortest recovery time and gradually continue with the locations with the longest recovery and succession time. Having control and governance of these areas in Mexico is of great importance, as it will be successful for the gradual restoration of the rangeland and its accompanying vegetation areas. The results of rotational grazing as a management alternative to continuous or traditional grazing seem promising for maintaining vegetation diversity in semi-arid systems [134]. Similar strategies are also relevant in areas with high rates of poverty and/or with low human well-being in which their inhabitants depend mainly on the services provided by ecosystems, thus increasing pressure on rangelands [63,64]. Based on the above and with the certainty that the analysis of satellite images sheds light on the approximate history of the succession or transition processes of the grazing areas, subject to continuous grazing, it is suggested to replicate the method in areas with the same productive approach. This will allow us to understand and compare the results and add to the proposal to bring rangeland to rotational and resting grazing, with exclusion areas.

5. Conclusions

The exposed results are a first approximation of the changes in land use and cover in the Tamaulipan Highlands, Mexico. The study sites are adjacent to protected natural areas, and as such, are of great importance due to their unique biodiversity, typical of ecosystems that harbor many endemism and the origin of species. Our results can be extrapolated to other areas of arid and semi-arid zones under continuous grazing cattle management. As the information is critical for the management of rangelands, we highlight an expansion in these areas and the modification of other native types of vegetation giving rise to scrub and secondary plant cover. The results aim to promote a rotational grazing system in the rangelands, seeking the coexistence of livestock and wildlife, especially in communities surrounding the protected natural areas and in regions with greater degradation and fragmentation.
It is of great importance to research the adaptation process of wildlife species with continuous grazing and the diversity of plants in the areas managed under this grazing system, as well as measuring susceptible areas and soil loss to help build a robust rotational grazing program at the local level and expand it. We suggest that the appropriation of the owners to the challenges faced by park rangers subjected to continuous grazing can be managed sustainably, under an individual–community approach, and create programs from the local to the regional, state, and national scales, where multiple socioeconomic and ecological benefits can be achieved. Since there is a great advance in the digital age, it is possible to bring these areas of knowledge closer to the owners and those in charge of the use and management of large rangeland areas through the implementation of mobile applications, using the variables presented here.
Finally, the materials and methods used in this work are easy to implement and replicate in other areas. In this way, it would be possible to carry out constant monitoring over time, to measure or evaluate the impact and effectiveness of different strategies developed for the conservation and sustainability of the areas destined for rangeland, without compromising the different types of vegetation.

Author Contributions

L.H.-H., P.A.-S. and U.J.S.-R. designed and built the study hypothesis, designed land use cover maps, and built the proposal for the management of rangelands under rotational grazing, an alternative to continuous grazing in the study areas. U.J.S.-R., L.B.-L. and A.Y.R.-S. assisted in the management of the different programs used for this work, as well as the delimitation of the topic and the development of the successional analysis methodology. L.B.-L., A.Y.R.-S. and J.F.-G. assisted with the methodological review and map validation and contributed to the writing and revision of the manuscript. All authors have read and agreed to the published version of the manuscript.

Funding

We are grateful to the Consejo Nacional de Ciencia y Tecnología (CONACYT), Mexico, which awarded a maintenance scholarship (No. 482904) to L.H.-H. to pursue doctoral studies. We appreciate the facilities provided by the Tecnológico Nacional de México, Instituto Tecnológico de Cd. Vic-toria for carrying out this work.

Data Availability Statement

The data presented in this study are available upon request from main author.

Conflicts of Interest

The authors declare no conflict of interest.

Appendix A

Figure A1. Land use coverage in 1973, 1980, 1986, 2000, 2005, 2009, 2016, and 2020, San Rafael, Tula, Tamaulipas, Mexico.
Forests 14 00815 g0a1
Figure A2. Land use coverage in 1973, 1980, 1986, 2000, 2005, 2009, 2016, and 2020, San Antonio, Jaumave, Tamaulipas, Mexico.
Forests 14 00815 g0a2
Figure A3. Land use coverage in 1973, 1980, 1986, 2000, 2005, 2009, 2016, and 2020, La Peña, Miquihuana, Tamaulipas, Mexico.
Forests 14 00815 g0a3
Figure A4. Land use coverage in 1973, 1980, 1986, 2000, 2005, 2009, 2016, and 2020, San Vicente, Palmillas, Tamaulipas, Mexico.
Forests 14 00815 g0a4
Figure A5. Land use coverage in 1973, 1980, 1986, 2000, 2005, 2009, 2016, and 2020, El Llano y Anexas, Bustamante, Tamaulipas, Mexico.
Forests 14 00815 g0a5

References

  1. Squires, V.R. People in rangelands: Their role and influence on rangeland utilization and sustainable management. In Range and Animal Sciences and Resources Management; Squires, V.R., Ed.; University of Adelaide: Adelaide, Australia, 2010; pp. 2–19. ISBN 978-1-84826-370-3. [Google Scholar]
  2. Heady, H.F.; Child, R.D. Rangeland Ecology and Management; Routledge: New York, NY, USA, 2019; pp. 1–12. ISBN 978-0-8133-3799-9. [Google Scholar]
  3. Instituto Nacional de Estadística, Geografía e Informática (INEGI). Guía Para La Interpretación de Cartografía: Edafología; Instituto Nacional de Estadística, Geografía e Informática: Aguascalientes, México, 2004; pp. 1–27. ISBN 970-13-4376-X.
  4. Holechek, J.L.; Pieper, R.D.; Herbel, C.H. Range Management Principles and Practices; Prentice Hall: Hoboken, NJ, USA, 1989; pp. 20–76. ISBN 978-0135014165. [Google Scholar]
  5. Mitchell, J.E. Rangeland resource trends in the United States: A technical document supporting the 2000 USDA Forest Service RPA Assessment. In General Technical Report RMRS-GTR-68, 68; US Department of Agriculture, Forest Service, Rocky Mountain Research Station: Fort Collins, CO, USA, 2000; pp. 11–24. [Google Scholar]
  6. Martínez-Rojas, A.; Torres-Torres, F. Suelo Agrícola En México: Retrospección y Prospectiva para La Seguridad Alimentaria. Realidad, Datos y Espacio. Rev. Intern. Estadísica Geogr. 2018, 9, 137–155. [Google Scholar]
  7. Instituto Nacional de Estadística y Geografía (INEGI). Encuesta Nacional Agropecuaria, 28 de Noviembre de 2014. Available online: https://www.inegi.org.mx/programas/ena/2014/ (accessed on 20 July 2022).
  8. Malhi, G.S.; Kaur, M.; Kaushik, P. Impact of Climate Change on Agriculture, and Its Mitigation Strategies: A Review. Sustainability 2021, 13, 1318. [Google Scholar] [CrossRef]
  9. Nellemann, C. GLOBIO-Global Methodology for Mapping Human Impacts on the Biosphere; UNEP: Nairobi, Kenia, 2001; pp. 13–24. ISBN 92-807-2051-1. [Google Scholar]
  10. Enríquez-Quiroz, J.F.; Esqueda-Esquivel, V.A.; Martínez-Méndez, D. Rehabilitación de praderas degradadas en el trópico de México. Rev. Mex. De Cienc. Pecu. 2021, 12, 243–260. [Google Scholar] [CrossRef]
  11. Siller-Clavel, P.; Badano, E.I.; Villarreal-Guerrero, F.; Prieto-Amparán, J.A.; Pinedo-Álvarez, A.; Corrales-Lerma, R.; Álvarez-Holguín, A.; Hernández-Quiroz, N.S. Distribution Patterns of Invasive Buffelgrass (Cenchrus ciliaris) in Mexico Estimated with Climate Niche Models under the Current and Future Climate. Plants 2022, 1, 1160. [Google Scholar] [CrossRef] [PubMed]
  12. AU-IBAR. Livestock Development Strategy for Africa (LiDeSA) 2015–2035; Department of Rural Economy and Agriculture: Nairobi, Kenya African Union, 2015; pp. 1–85. ISBN 978-9966-077-30-1.
  13. Sayre, N.F.; McAllister, R.R.; Bestelmeyer, B.T.; Moritz, M.; Turner, M.D. Earth Stewardship of Rangelands: Coping with Ecological, Economic, and Political Marginality. Front. Ecol. Environ. 2013, 11, 348–354. [Google Scholar] [CrossRef]
  14. Reid, R.S.; Fernández-Giménez, M.E.; Galvin, K.A. Dynamics and Resilience of Rangelands and Pastoral Peoples around the Globe. Annu. Rev. Environ. Resour. 2014, 39, 217–242. [Google Scholar] [CrossRef]
  15. Brunson, M. Unwanted No More: Land Use, Ecosystem Services, and Opportunities for Resilience in Human-Influenced Shrublands. Rangelands 2014, 36, 5–11. [Google Scholar] [CrossRef]
  16. Bounejmate, M.; Norton, B.E.; Khatib, A.; Bathikh, N.; Ghassali, F.; Mourid, M.; Mahyou, H. Partnership for understanding land use-cover change and reviving overgrazed rangeland in Mediterranean areas: ICARDA’s experience. In Réhabilitation des pâturages et des parcours en milieux méditerranéens, ed. Ferchichi, A. (comp.) and Ferchichi, A. (collab.), Zaragoza: CIHEAM. Cah. Options Méditerr. 2004, 62, 267–283. [Google Scholar]
  17. Dyksterhuis, E.J. Condition and management of rangeland based on quantitative ecology. J. Range Manag. 1949, 2, 104–115. [Google Scholar] [CrossRef]
  18. Francès, F.; Adam, A.; Castelló, A. A genetic method for diagnosing Lantana camara using a barcoding-based, genus specific, polymerase chain reaction. Gac. Int. Cienc. Forense 2014, 1, 11–15. [Google Scholar]
  19. Arreola-Nava, M.E.; Vázquez-Castellanos, J.L.; González-Castañeda, M.E. Geographical factors in the epidemiology of intoxication by Karwinskia (tullidora) in Mexico. Cad. Saúde Pública 2000, 16, 255–260. [Google Scholar] [CrossRef] [Green Version]
  20. Delgado-Padierna, A.Q. Análisis del Efecto al Pastoreo en Cuatro Unidades de Producción del Altiplano Potosino. Master’s Thesis, Universidad Autónoma de San Luis Potosí-Facultad de Agronomía y Veterinaria, San Luis Potosí, Mexico, 2022. [Google Scholar]
  21. CONAZA (Comisión Nacional de Zonas Áridas). Conservación y Uso Sustentable de Suelo y Agua. México. 19 de Enero de. 2015. Available online: https://www.gob.mx/conaza/documentos/reglas-de-operacion-2015-170664 (accessed on 20 January 2022).
  22. Rodrigo-Comino, J.; Salvia, R.; Egidi, G.; Salvati, L.; Giménez-Morera, A.; Quaranta, G. Desertification and Degradation Risks vs Poverty: A Key Topic in Mediterranean Europe. Geogr. Res. Lett. 2022, 48, 23–40. [Google Scholar] [CrossRef]
  23. Banks, T. Property rights reform in rangeland China: Dilemmas on the road to the household ranch. World Dev. 2003, 31, 2129–2142. [Google Scholar] [CrossRef]
  24. Scoones, I. Living with Uncertainty: New Directions for Pastoral Development in Africa; Intermediate Technology Publications: London, UK, 1993; pp. 1–32. ISBN 978 1 85339 2351. [Google Scholar]
  25. Niamir-Fuller, M. Managing Mobility in African Rangelands; Intermediate Technology Publications: London, UK, 1999; pp. 18–46. ISBN 1 85339 4734. [Google Scholar]
  26. Sánchez-Reyes, U.J.; Niño-Maldonado, S.; Barrientos-Lozano, L.; Treviño-Carreón, J. Assessment of Land Use-Cover Changes and Successional Stages of Vegetation in the Natural Protected Area Altas Cumbres, Northeast Mexico, Using Landsat Satellite Image. Remote Sens. 2017, 9, 712. [Google Scholar] [CrossRef] [Green Version]
  27. Silcock, J.L.; Fensham, R.J. Arid vegetation in disequilibrium with livestock grazing evidence from long-term exclosures. Austral Ecol. 2013, 38, 57–65. [Google Scholar] [CrossRef]
  28. Kaufmann, I.; Feldman, S.R.; Sacido, M.B. Efectos del pastoreo en riqueza florística, biomasa y cobertura de un pastizal de albardón, Argentina. Rev. Politécnica 2019, 29, 95–107. [Google Scholar] [CrossRef] [Green Version]
  29. Ünal, S.; Mutlu, Z.; Urla, O.; Hakan, Y.; Şahin, B. Evaluation and Determination of Rangeland Vegetation in Kayseri Province. Tarla Bitk. Merk. Araşt. Enst. Derg. 2013, 22, 86–95. [Google Scholar]
  30. Ulziibaatar, M.; Matsui, K. Herders’ Perceptions about Rangeland Degradation and Herd Management: A Case among Traditional and Non-Traditional Herders in Khentii Province of Mongolia. Sustainability 2021, 13, 7896. [Google Scholar] [CrossRef]
  31. Alcalá-Galván, C.H.; Barraza-Guardado, R.H.; Álvarez, F.A.; Rueda-Puente, E.O. Uso sustentable de agostaderos y el sistema vaca-cría en el Noroeste de México. Agron. Mesoam. 2018, 29, 433–447. [Google Scholar] [CrossRef]
  32. Sepúlveda-Varas, A.; Saavedra-Briones, P.; Esse, C. Análisis de cambio de cobertura y uso de suelo en una subcuenca preandina chilena. Herramienta para la sustentabilidad productiva de un territorio. Rev. De Geogr. Norte Gd. 2019, 72, 9–25. [Google Scholar] [CrossRef] [Green Version]
  33. Hernández-Clemente, R.; Hornero, A. Monitoreo y evaluación de la desertificación con teledetección. Ecosistemas 2021, 30, 2240. [Google Scholar] [CrossRef]
  34. Fan, F.; Weng, Q.; Wang, Y. Land use and land cover change in Guangzhou, China, from 1998 to 2003, based on Landsat TM/ETM+imagery. Sensors 2007, 7, 1323–1342. [Google Scholar] [CrossRef] [Green Version]
  35. Soffianian, A.; Madanian, M. Monitoring land cover changes in Isfahan Province, Iran using Landsat satellite data. Environ. Monit. Assess. 2015, 187, 543. [Google Scholar] [CrossRef] [PubMed]
  36. González, G.; Casas, V.; Castillo, E.; Ramírez, L. Evaluación de patrones temporales en la dinámica para el cambio de cobertura vegetal en zonas rurales tropicales durante el periodo 2013-2018. Caso de estudio Chaguaní-Colombia. Cuad. De Desarro. Rural. 2021, 18, 7. [Google Scholar] [CrossRef]
  37. Wondrade, N.; Dick, Ø.B.; Tveite, H. Gis based mapping of land cover changes utilizing multi-temporal remotely sensed image data in Lake Hawassa Watershed, Ethiopia. Environ. Monit. Assess. 2014, 186, 1765–1780. [Google Scholar] [CrossRef]
  38. Rzedowski, J. Vegetación potencial. IV.8.2. In Atlas Nacional de México. Volume 2. Escala 1: 4,000,000; Instituto de Geografía, Universidad Nacional Autónoma de México: México, D.F., Mexico, 1990. [Google Scholar]
  39. Cervantes, R.M.C. Plantas de importancia económica en las zonas áridas y semiáridas de México. In Anais do X Encontro de Geógrafos da América Latina; Instituto de Geografía-Universidad Nacional Autónoma de México: Ciudad de México, México, 2002; pp. 3388–3407. ISBN UNAM 970-32-0182-02. [Google Scholar]
  40. Arriaga, L. Implicaciones del cambio de uso de suelo en la biodiversidad de los matorrales xerófilos: Un enfoque multiescalar. Investig. Ambient. 2009, 1, 6–16. [Google Scholar]
  41. SNIARN (Sistema Nacional de Información Ambiental y de Recursos Naturales). Informe de la situación del medio ambiente en México. In Compendio de Estadísticas Ambientales; Secretaría de Medio Ambiente y Recursos Naturales: México, D.F., Mexico, 2005; pp. 39–59. [Google Scholar]
  42. Siqueira, J.O.; Carbone, C.M.A.; Curi, N.; Rosado, S.C.; Davide, A.C. Mycorrhizal colonization and mycotrophic growth of native woody species as related to successional groups in Southeastern Brazil. For. Ecol. Manag. 1998, 107, 241–252. [Google Scholar] [CrossRef]
  43. Miranda, F. Formas de Vida Vegetales y el Problema de la Delimitación de las Zonas Áridas de México; Instituto Mexicano de Recursos Naturales Renovables: Ciudad de México, México, 1955; pp. 105–143. [Google Scholar]
  44. García-Fernández, F.; Domínguez-Jardines, A.L. El Altiplano Tamaulipeco: Especialización Productiva y Desarrollo Socio-Económico; Universidad Autónoma de Tamaulipas: Ciudad Victoria, Tamaulipas, México, 2017; pp. 73–84. ISBN 978-607-8563-69-2. [Google Scholar]
  45. Echavarría-Cháirez, F.G.; Gutiérrez-Luna, R.; Ledesma-Rivera, R.I.; Bañuelos-Valenzuela, R.; Aguilera-Soto, J.I.; Serna-Pérez, A. Influence of small ruminant grazing systems in a semiarid range in the State of Zacatecas Mexico. I Native vegetation. Tec. Pec. Mex. 2006, 44, 203–217. [Google Scholar]
  46. INEGI. Anuario Estadístico y Geográfico por Entidad Federativa; Instituto Nacional de Estadística y Geografía: Ciudad de México, México, 2014; pp. 760–762. ISBN 978-607-739-3870.
  47. INEGI. Conjunto de Datos Vectoriales de la Serie Topográfica Escala 1:1,000,000; Dirección General de Geografía Instituto Nacional de Estadística y Geografía: Aguascalientes, México, 2000. [Google Scholar]
  48. INEGI-CONAGUA. Instituto Nacional de Estadística, Geografía e Informática (INEGI). In Continuo Nacional del Conjunto de Datos Geográficos de la carta Hidrológica de aguas Superficiales Escala 1:250 00, Serie 1.; CONAGUA. Organismo de Cuenca Golfo Norte; Dirección de infraestructura hidroagrícola Cuencas Hidrológicas: Ciudad de México, México, 2007. [Google Scholar]
  49. García, E. Modificaciones al Sistema de Clasificación Climática de Köppen, Quinta Edición; Instituto de Geografía, UNAM: Distrito Federal, México, 2004; pp. 13–90. ISBN 970-32-1010-4. [Google Scholar]
  50. INEGI. Datos Vectoriales de Uso de Suelo y Vegetación. Escala 1:250 000. Serie VI (Capa Unión), Escala: 1:250 000. Edición: 1; Instituto Nacional de Estadística y Geografía (INEGI): Aguascalientes, México, 2016.
  51. Treviño-Carreón, J.; Valiente-Banuet, A. La vegetación de Tamaulipas y sus principales asociaciones vegetales. In Biodiversidad Tamaulipeca; Barrientos-Lozano, L., Correa-Sandoval, A., Horta-Vega, J.V., García-Jiménez, J., Eds.; Dirección General de Educación Superior Tecnológica, Instituto Tecnológico de Ciudad Victoria: Ciudad Victoria, México, 2005; Volume 1, pp. 22–46. ISBN 968-5823-19-7. [Google Scholar]
  52. Estadística de Producción Ganadera. Available online: http://infosiap.siap.gob.mx/gobmx/datosAbiertos.php (accessed on 8 August 2022).
  53. INEGI. Anuario Estadístico y Geográfico de Tamaulipas; Instituto Nacional de Estadística y Geografía (INEGI): Aguascalientes City, México, 2017; pp. 1–60. [Google Scholar]
  54. Pinos-Rodríguez, J.M.; Gómez-Ruiz, W.J.; Aguirre-Rivera, J.R.; García-López, J.C.; Álvarez-Fuentes, G. Profitability of goat production in the Mexico highlands. Outlook Agric. 2015, 44, 223–233. [Google Scholar] [CrossRef]
  55. Alejandre, O.M.; Rubio-Tabares, E.; Perez-Eguía, E.; Zaragoza-Martínez, L.; Rodríguez-Galván, G. Los Recursos caprinos de México. En Biodiversidad Caprina Iberoamericana, Bogotá; Ediciones Universidad Cooperativa de Colombia: New York, NY, USA, 2016; pp. 95–107. [Google Scholar]
  56. SIAP. Población Ganadera-Información Sobre el Número de Animales Que se Crían en el País Con Fines de Producción, 22 de Julio de. 2022. Available online: https://www.gob.mx/siap/documentos/poblacion-ganadera-136762 (accessed on 20 August 2022).
  57. CSPCT. Plan Rector; Comité Sistema Producto Caprino de Tamaulipas: Ciudad Victoria, México, 2012; pp. 4–59.
  58. Molina-Guerra, V.M.; Mora-Olivo, A.; Alanís-Rodríguez, E.; Soto-Mata, B.; Patiño-Flores, A.M. Plantas Características del Matorral Espinoso Tamaulipeco en México; Universidad Autónoma de Nuevo León: Monterrey, México, 2019; pp. 1–30. ISBN 978-607-27-1168-6. [Google Scholar]
  59. SEMARNAP y CONAMP. Plan de Acción Para la Conservación de la Mariposa Monarca en México, 2018–2024; Secretaría de Medio Ambiente y Recursos Naturales y Comisión Nacional de Áreas Naturales Protegidas: Ciudad de México, México, 2018; pp. 38–43.
  60. Secretaría de Medio Ambiente y Recursos Naturales/Comisión Nacional de Áreas Naturales Protegidas. Programa de Acción Para la Conservación de la Especie: Guacamaya Verde (Ara Militaris); Oropeza-Hernández, P., Rendón-Hernández, E., Eds.; Gobierno de México: Ciudad de Mexico, México, 2012; pp. 1–28. [Google Scholar]
  61. De la Cruz-Rock, J.L.; Argüello-Zepeda, F.J.; Tello-Iturbe, A. Turismo y sustentabilidad en el Altiplano Tamaulipeco. In En Sociedad, Conflicto y Ambiente; Esqueda-Walle, R., Mendoza, L., Eds.; Desembocadura del Río Pánuco: Tamaulipas, México, 2009; pp. 143–166. ISBN 978-84-692-0011-7. [Google Scholar]
  62. Jacques-Hernández, C. Caracterización y usos de las especies de agave en Tamaulipas. El Reino Veg. Farmacol. Y Ter. 2009, 89, 91–100. [Google Scholar]
  63. INEGI. Censo de Población y Vivienda 2020. 18 de Marzo de. 2021. Available online: https://www.inegi.org.mx/programas/ccpv/2020/ (accessed on 5 August 2022).
  64. Diario Oficial de la Federación. Secretaria de Bienestar, Decreto Por el Que se Formula la Declaratoria de Las Zonas de Atención Prioritaria Para el Año 2022, México, 29 de noviembre de. 2021. Available online: https://www.gob.mx/cms/uploads/attachment/file/684340/Zonas_prioritarias_2022.pdf (accessed on 6 August 2022).
  65. Gutman, G.; Huang, C.; Chander, G.; Noojipady, P.; Masek, J.G. Assessment of the NASA–USGS Global Land Survey (GLS) datasets. Remote Sens. 2013, 134, 249–265. [Google Scholar] [CrossRef]
  66. Global Land Cover Facility (GLCF), Global Land Survey (GLS). 2021. Available online: http://www.landcover.org/data/gls/ (accessed on 15 May 2021).
  67. USGS Global Visualization Viewer (GLOVIS). United States Geological Survey Earth Resources Observation Systems. 2021. Available online: http://glovis.usgs.gov/ (accessed on 25 May 2021).
  68. USGS. Landsat 8 (L8) Data Users Handbook Version 2.0. In EROS, Sioux Falls, South Dakota.; 2020. Available online: https://landsat.usgs.gov/landsat-8-l8-data-users-handbook (accessed on 28 May 2021).
  69. ENVI. ENVI Version 5.0; Exelis Visual Information Solutions, Inc.: Boulder, CO, USA, 2012. [Google Scholar]
  70. Cámara de Diputados del, H. Congreso de la Unión. Ley Agraria; Diario Oficial de la Federación: Ciudad de México, México, 2022; pp. 1–56. [Google Scholar]
  71. Eastman, J.R. Idrisi Selva Tutorial. Manual Version 17; Clark Labs, Clark University: Worcester, MA, USA, 2012; pp. 177–220. [Google Scholar]
  72. INEGI. Uso Del Suelo y Vegetación, Escala 1:250,000, Serie I (Continuo Nacional); Instituto Nacional de Ecología (INE)—Dirección de Ordenamiento Ecológico General e Instituto Nacional de Estadística, Geografía e Informática (INEGI); INEGI: Aguascalientes, México, 1974.
  73. INEGI. Uso Del Suelo y Vegetación, Escala 1:250,000, Serie II (Continuo Nacional); Dirección General de Geografía, Instituto Nacional de Estadística, Geografía e Informática (INEGI): Aguascalientes, México, 1992.
  74. INEGI. Uso Del Suelo y Vegetación, Escala 1:250,000, Serie II (Continuo Nacional); Dirección General de Geografía, Instituto Nacional de Estadística, Geografía e Informática (INEGI): Aguascalientes, México, 1997.
  75. INEGI. Uso Del Suelo y Vegetación, Escala 1:250,000, Serie II (Continuo Nacional); Dirección General de Geografía, Instituto Nacional de Estadística, Geografía e Informática (INEGI): Aguascalientes, México, 2001.
  76. INEGI. Uso Del Suelo y Vegetación, Escala 1:250,000, Serie III (Continuo Nacional); Dirección General de Geografía, Instituto Nacional de Estadística, Geografía e Informática (INEGI): Aguascalientes, México, 2005.
  77. INEGI. Uso Del Suelo y Vegetación, Escala 1:250,000, Serie III (Continuo Nacional); Dirección General de Geografía, Instituto Nacional de Estadística, Geografía e Informática (INEGI): Aguascalientes, México, 2009.
  78. INEGI. Uso Del Suelo y Vegetación, Escala 1:250,000, Serie IV (Continuo Nacional); Dirección General de Geografía, Instituto Nacional de Estadística, Geografía e Informática (INEGI): Aguascalientes, México, 2017.
  79. INEGI. Uso Del Suelo y Vegetación, Escala 1:250,000, Serie IV (Continuo Nacional); Dirección General de Geografía, Instituto Nacional de Estadística, Geografía e Informática (INEGI): Aguascalientes, México, 2018.
  80. Esri. ArcGIS 10.2 for Desktop. 1999–2013 Esri Inc.; Environmental Systems Research Institute: Redlands, CA, USA, 2013. [Google Scholar]
  81. Hernández, M.H.; Goettsch, B.; Gómez-Hinostrosa, C.; Arita, T.H. Cactus species turnover and diversity along a latitudinal transect in the Chihuahuan Desert Region. Biodivers. Conserv. 2008, 17, 703–720. [Google Scholar] [CrossRef]
  82. Granados-Sánchez, D.; López-Ríos, G.F.; Hernández-García, M.A. Ecología y silvicultura en bosques templados. Rev. Chapingo Ser. Cienc. For. Ambiente. 2007, 13, 67–83. [Google Scholar]
  83. Allred, W.B.; Creutzburg, K.M.; Carlson, C.J.; Cole, J.C.; Dovichin, M.C.; Duniway, C.M.; Jones, O.M.; Maestas, D.J.; Naugle, E.D.; Nauman, W.T.; et al. Guiding principles for using satellite-derived maps in rangeland management. Rangelands 2022, 44, 78–86. [Google Scholar] [CrossRef]
  84. Djeddaoui, F.; Chadli, M.; Gloaguen, R. Desertification Susceptibility Mapping Using Logistic Regression Analysis in the Djelfa Area, Algeria. Remote Sens. 2017, 9, 1031. [Google Scholar] [CrossRef] [Green Version]
  85. Zermeño-Hernández, I.; Méndez-Toribio, M.; Siebe, C.; Benítez-Malvido, J.; Martínez-Ramos, M. Ecological disturbance regimes caused by agricultural land uses and their effects on tropical forest regeneration. Appl. Veg. Sci. 2015, 18, 443–455. [Google Scholar] [CrossRef]
  86. Burgos, A.; Maass, J.M. Vegetation change associated with land-use in tropical dry forest areas of western Mexico. Agric. Ecosyst. Environ. 2004, 104, 475–481. [Google Scholar] [CrossRef]
  87. Rzedowski, J. Vegetación de México 1ra. In Capítulo 4. Influencia del Hombre. Edición Digital; Comisión Nacional para el Conocimiento y Uso de la Biodiversidad: Ciudad de México, México, 2006; pp. 59–74. [Google Scholar]
  88. Ventura-Ríos, A.; Plascencia-Escalante, F.O.; Hernández-de la Rosa, P.; Ángeles-Pérez, G.; Aldrete, A. ¿Es la reforestación una estrategia para la rehabilitación de bosques de pino?: Una experiencia en el centro de México. Bosque 2017, 38, 55–66. [Google Scholar] [CrossRef] [Green Version]
  89. Sánchez, J.; Ramírez-Valverde, B. El turismo rural como complemento al desarrollo territorial rural en zonas indígenas de México. Scripta Nova. Rev. Elect. Geogr. Cienc. Soc. 2007, 11, 1–16. [Google Scholar]
  90. Chapa-Bezanilla, D.; Sosa-Ramírez, J.; Alba-Ávila, A. Estudio multitemporal de fragmentación de los bosques en la Sierra Fría, Aguascalientes, México. Madera Y Bosques 2008, 14, 37–51. [Google Scholar] [CrossRef]
  91. Guerrero-García, B.; Pereznegron-Pereznegron, R. Evolución, prospectiva y administración de las zonas áridas de México (CONAZA). Bibl. Jurídica Del Inst. De Investig. Jurídicas De La UNAM 2017, 1, 443–472. [Google Scholar]
  92. Negrete-Sánchez, L.O.; Aguirre-Rivera, J.R.; Pinos-Rodríguez, J.M.; Reyes Hernández, H. Benefits of the parcellation of communal rangelands of the ejido El Castañón, Municipality Fourteen, San Luis Potosí, México: 1993-2013. Agrociencia 2016, 50, 511–532. [Google Scholar]
  93. Pérez-Serna, A.; Echavarria-Cháirez, F.G. Caracterización hidrológica de un agostadero comunal excluido al pastoreo en Zacatecas, México. I. Pérdidas de suelo. Rev. Mex. Cienc. Pecu. 2002, 40, 37–53. [Google Scholar]
  94. Riginos, C.; Hoffman, M.T. Changes in Population Biology of Two Succulent Shrubs along a Grazing Gradient. J. Appl. Ecol. 2003, 40, 615–625. [Google Scholar] [CrossRef]
  95. Echavarría-Cháirez, F.G.; Serna-Pérez, A.; Bañuelos-Valenzuela, R. Influencia del sistema de pastoreo con pequeños rumiantes en un agostadero del semiárido zacatecano: II. Cambios en el suelo. Rev. Mex. Cienc. Pecu. 2007, 45, 177–194. [Google Scholar]
  96. Oussedik, A.; Iftene, T.; Zegrar, A. Réalisation par télédétection de la carte d’Algérie de sensibilité à la désertification. Sécheresse 2003, 14, 195–201. [Google Scholar]
  97. Al-bukhari, A.; Hallett, S.; Brewer, T. A review of potential methods for monitoring rangeland degradation in Libya. Pastoralism 2018, 8, 1–14. [Google Scholar] [CrossRef]
  98. Salamani, M.; Kadi Hanafi, H.; Hirche, A.; Nedjraoui, D. Évaluation de la sensibililé à la désertification en Algérie. Rev. Ecol. 2013, 68, 71–84. [Google Scholar]
  99. Antoniadou, C.; Voultsiadou, E.; Chintiroglou, C.C. Succession and Colonization. Encycl. Ecol. 2019, 2, 369–378. [Google Scholar] [CrossRef]
  100. Han, J.G.; Zhang, Y.J.; Wang, C.J.; Bai, W.M.; Wang, Y.R.; Han, G.D.; Li, L.H. Rangeland degradation and restoration management in China. Rangel. J. 2008, 30, 233–239. [Google Scholar] [CrossRef] [Green Version]
  101. Fuls, E.R. Semi-arid and arid rangelands: A resource under siege due to patch-selective grazing. J. Arid Environ. 1992, 22, 191–193. [Google Scholar] [CrossRef]
  102. Lara-Requena, G.N.; Cámara-Artigas, R.; Casas-González, S. Análisis de los cambios de uso de suelo en la cuenca Guayalejo-Tamesí (Tamaulipas, México) en tres décadas de información digital. Mapping 2010, 143, 86–94. [Google Scholar]
  103. Pickup, G.; Chewings, V.H.; Nelson, D.J. Estimating changes in vegetation cover over time in arid rangelands using landsat MSS data. Remote Sens. Environ. 1993, 43, 243–263. [Google Scholar] [CrossRef]
  104. Nair, R.P.K. Agroforestería; Universidad Autónoma Chapingo: Chapingo, Estado de México, México, 1997; p. 543. [Google Scholar]
  105. Rosete-Vergés, F.A.; Pérez-Damián, J.L.; Villalobos-Delgado, M.; Navarro-Salas, E.N.; Salinas-Chávez, E.; Remond-Noa, R. El avance de la deforestación en México 1976–2007. Madera Y Bosques 2014, 20, 21–35. [Google Scholar] [CrossRef] [Green Version]
  106. Contreras-Cisneros, A.J. Efecto del Tiempo de Abandono de Terrenos Agrícolas en Las Reservas de Carbono Orgánico y Nitrógeno Total en Zonas Áridas. Master’s Thesis, Universidad Autónoma de Chapingo, Bermejillo, Durango, México, 2020. [Google Scholar]
  107. Montaña, C. The colonization of bare areas in two-phase mosaics of an arid ecosystem. J. Ecol. 1992, 80, 315–327. [Google Scholar] [CrossRef]
  108. Aguilar, M.R.; Sala, O.E. Patch structure, dynamics and implication for the functioning of arid ecosystems. TREE 1999, 14, 273–277. [Google Scholar] [CrossRef]
  109. Maestre, F.T.; Cortina, J.; Bautista, S.; Bellot, J.; Vallejo, R. Small-scale environmental heterogeneity and spatiotemporal dynamics of seedling establishment in a semiarid degraded ecosystem. Ecosystems 2003, 6, 630–643. [Google Scholar] [CrossRef]
  110. Bestelmeyer, B.T.; Trujillo, D.A.; Tugel, A.J.; Havstad, K.M. A multi-scale classification of vegetation dynamics in arid lands: What is the right scale for models, monitoring, and restoration? J. Arid Environ. 2005, 65, 296–318. [Google Scholar] [CrossRef]
  111. Browning, D.M.; Laliberte, A.S.; Rango, A. Temporal Dynamics of Shrub Proliferation: Linking Patches to Landscapes. Int. J. Geogr. Inf. Sci. 2011, 25, 913–930. [Google Scholar] [CrossRef]
  112. Forman, R.T.T. Land Mosaics, the Ecology of Landscapes and Regions; University Press: Cambridge, MA, USA, 1994; pp. 25–632. ISBN 0521 47462 0. [Google Scholar]
  113. Turner, I.M. Species loss in fragments of tropical rain forest: A review of the evidence. J. Appl. Ecol. 1996, 33, 200–209. [Google Scholar] [CrossRef]
  114. McIntyre, N.E. Effects of forest patch size on avian diversity. Landsc. Ecol. 1995, 10, 85–99. [Google Scholar] [CrossRef]
  115. Skole, D.; Tuker, C. Tropical deforestation and habitat fragmentation in the Amazon: Satellite data from 1978 to 1988. Science 1993, 260, 1905–1910. [Google Scholar] [CrossRef] [PubMed] [Green Version]
  116. Tomimatsu, H.; Ohara, M. Genetic diversity and local population structure of fragmented populations of Trillium camschatcense (Trilliaceae). Biol. Conserv. 2003, 109, 249–258. [Google Scholar] [CrossRef]
  117. Turner, M.; Gardner, R. Landscape ecology in theory and practice. Patterns and Process; Springer: New York, NY, USA, 2015; pp. 287–332. ISBN 978-1-4939-2793-7. [Google Scholar]
  118. Echeverria, C.; Coomes, D.; Salas, J.; Rey-Benayas, J.M.; Lara, A.; Newton, A. Rapid deforestation and fragmentation of Chilean temperate forests. Biol. Conserv. 2006, 130, 481–494. [Google Scholar] [CrossRef]
  119. Gigord, L.; Picot, F.; Shycoff, J. Effects of habitat fragmentation on Dombeya acutangula (Sterculiaceae), a native tree on La Réunion (Indian Ocean). Biol. Conserv. 1999, 88, 43–51. [Google Scholar] [CrossRef]
  120. Piessens, K.; Honnay, O.; Hermy, M. The role of fragment area and isolation in the conservation of heathland species. Biol. Conserv. 2005, 122, 61–69. [Google Scholar] [CrossRef]
  121. Lausch, A.; Hertzog, F. Applicability of landscape metrics for the monitoring of landscape change: Issues of scale, resolution and interpretability. Ecol. Indic. 2002, 2, 3–15. [Google Scholar] [CrossRef]
  122. Cayuela, L.; Rey-Benayas, J.M.; Echeverría, C. Clearance and fragmentation of tropical montane forests in the Highlands of Chiapas, Mexico (1975–2000). For. Ecol. Manag. 2006, 226, 208–218. [Google Scholar] [CrossRef]
  123. McCalla, G.R.; Blackburn, W.H.; Merrill, L.B. Effects of livestock grazing on sediment production, Edwards Plateau of Texas. J. Range Manag. 1984, 37, 291–294. [Google Scholar] [CrossRef]
  124. Chen, Y.; Li, Y.; Zhao, X.; Awada, T.; Shang, W.; Han, J. Effects of grazing exclusion on soil properties and on ecosystem carbon and nitrogen storage in a sandy rangeland of Inner Mongolia, Northern China. Environ. Manag. 2012, 50, 622–632. [Google Scholar] [CrossRef]
  125. Keenleyside, K.A.; Dudley, N.; Cairns, S.; Hall, C.M.; Stolton, S. Restauración Ecológica Para Áreas Protegidas: Principios, Directrices y Buenas Practices; UICN-CMAP: Gland, Switzerland, 2014; pp. 71–99. ISBN 978-2-8317-1678-7. [Google Scholar]
  126. Ramírez-Cervantes, M.C. Plantas de importancia económica en zonas áridas y semiáridas de México. In Proceedings of the Anais do X Encuentro de Geógrafos de América Latina, Universidad de São Paulo, São Paulo, Brazil, 20–26 March 2005; pp. 3388–3407. [Google Scholar]
  127. Teague, R.; Grant, B.; Wang, H.H. Assessing optimal configurations of multi paddock grazing strategies in tallgrass prairie using a simulation model. J. Environ. Manag. 2015, 150, 262–273. [Google Scholar] [CrossRef] [PubMed]
  128. Teague, R.; Provenza, F.; Kreuter, U.; Steffens, T.; Barnes, M. Multi-paddock grazing on rangelands: Why the perceptual dichotomy between research results and rancher experience? J. Environ. Manag. 2013, 128, 699–717. [Google Scholar] [CrossRef] [PubMed]
  129. Briske, D.D.; Derner, J.D.; Brown, J.R.; Fuhlendorf, S.D.; Teague, W.R.; Havstad, K.M.; Gillen, R.L.; Ash, A.J.; Willms, W.D. Rotational grazing on rangelands: Reconciliation of perception and experimental evidence. Rangel. Ecol. Manag. 2008, 61, 3–17. [Google Scholar] [CrossRef] [Green Version]
  130. Butchart, S.H.; Walpole, M.; Collen, B.; Van Strien, A.; Scharlemann, J.P.; Almond, R.E.; Baillie, J.E.; Bomhard, B.; Brown, C.; Bruno, J.; et al. Global biodiversity: Indicators of recent declines. Science 2010, 328, 1164–1168. [Google Scholar] [CrossRef] [PubMed]
  131. Chillo, V.; Ojeda, R.A.; Anand, M.; Reynolds, J.F. A novel approach to assess livestock management effects on biodiversity of drylands. Ecol. Indic. 2015, 50, 69–78. [Google Scholar] [CrossRef]
  132. Odadi, W.O.; Fargione, J.; Rubenstein, D.I. Vegetation, wildlife, and livestock responses to planned grazing management in an African pastoral landscape. Land Degrad. Dev. 2017, 28, 2030–2038. [Google Scholar] [CrossRef]
  133. Gaffney, R.; Augustine, D.J.; Kearney, S.P.; Porensky, L.M. Using Hyperspectral Imagery to Characterize Rangeland Vegetation Composition at Process-Relevant Scales. Remote Sens. 2021, 13, 4603. [Google Scholar] [CrossRef]
  134. McDonald, S.E.; Reid, N.; Smith, R.; Waters, C.M.; Hunter, J.; Rader, R. Rotational grazing management achieves similar plant diversity outcomes to areas managed for conservation in a semi-arid rangeland. Rangel. J. 2019, 41, 135–145. [Google Scholar] [CrossRef] [Green Version]
Figure 1. Location of the Tamaulipan Highlands (TH) in Tamaulipas, Mexico. (A) Location of Tamaulipas in Northeastern Mexico. (B) The geographical position of the TH in the state of Tamaulipas. (C) Study communities (Ejidos) in the TH and soil and vegetation cover: XS—xerophilous scrub; SVXS—secondary vegetation of xerophytic scrub; SS—submontane scrub; SVSS—secondary vegetation of submontane scrub; TF—temperate forest; SVTF—secondary vegetation of temperate forest; TAF—tascate forest; SVTAF—secondary vegetation of tascate forest; NG—natural grassland; MMF—mountain mesophyll forest; TV—tropical vegetation; SVTV—secondary vegetation of tropical vegetation; A—agriculture; W—water; and UA—urban area.
Forests 14 00815 g001
Figure 2. Summarized process for the delimitation of successional categories. (a) The first LULC image classified by MAXLIKE (b) is reclassified into three simplified categories: 0 (simplified category of anthropogenic activities), 1 (rangeland), and 2 (submontane scrubland, Pine–Oak forest or tascate forest, depending on the most appropriate for each Ejido). (c) Other LULC images are reclassified in the same way. (d) A cross-tabulation is made, comparing the simplified image of 1973 with that of 1986, which results in a change transition image for 1973–1986 with nine categories. This is compared to the following simplified image (2000), resulting in a new transition image. The process continues until a final transition image is obtained, from 1973–2020.
Forests 14 00815 g002
Figure 3. Land use coverage and changes in the study period, San Rafael, Tula, Tamaulipas, Mexico.
Forests 14 00815 g003
Figure 4. Percentage of changes in land cover in the scenes of (a) 1973–1980, (b) 1980–1986, (c) 1986–2000, (d) 2000–2005, (e) 2005–2009, (f) 2009–2016, and (g) 2016–2020, San Rafael, Tula, Tamaulipas, Mexico.
Forests 14 00815 g004
Figure 5. Represented Area (km2) for each category of land use coverage during the study period, San Rafael, Tula, Tamaulipas, Mexico.
Forests 14 00815 g005
Figure 6. Successional categories of coverage and change in land use, San Rafael, Tula, Tamaulipas, Mexico.
Forests 14 00815 g006
Figure 7. Land use coverage and changes in the study period, San Antonio, Jaumave, Tamaulipas, Mexico.
Forests 14 00815 g007
Figure 8. Percentage of land cover change in scenes from (a) 1973–1980, (b) 1980–1986, (c) 1986–2000, (d) 2000–2005, (e) 2005–2009, (f) 2009–2016, and (g) 2016–2020, San Antonio, Jaumave, Tamaulipas, Mexico.
Forests 14 00815 g008
Figure 9. Represented area (km2) for each category of land use coverage during the study period, San Antonio, Jaumave, Tamaulipas, Mexico.
Forests 14 00815 g009
Figure 10. Successive categories of coverage and changes in land use, San Antonio, Jaumave, Tamaulipas, Mexico.
Forests 14 00815 g010
Figure 11. Land use coverage and changes in the study period, La Peña, Miquihuana, Tamaulipas, Mexico.
Forests 14 00815 g011
Figure 12. Percentage of changes in land cover in the scenarios of (a) 1973–1980, (b) 1980–1986, (c) 1986–2000, (d) 2000–2005, (e) 2005–2009, (f) 2009–2016, and (g) 2016–2020, La Peña, Miquihuana, Tamaulipas, Mexico.
Forests 14 00815 g012
Figure 13. Represented area (km2) for each category of land use coverage during the study period, La Peña, Miquihuana, Tamaulipas, Mexico.
Forests 14 00815 g013
Figure 14. Successional categories of coverage and changes in land use, La Peña, Miquihuana, Tamaulipas, Mexico.
Forests 14 00815 g014
Figure 15. Land use coverage and changes in the study period, San Vicente, Palmillas, Tamaulipas, Mexico.
Forests 14 00815 g015
Figure 16. Percentage of land cover changes in scenes from (a) 1973–1980, (b) 1980–1986, (c) 1986–2000, (d) 2000–2005, (e) 2005–2009, (f) 2009–2016 and (g) 2016–2020, San Vicente, Palmillas, Tamaulipas, Mexico.
Forests 14 00815 g016
Figure 17. Represented area (km2) for each category of land use coverage during the study period, San Vicente, Palmillas, Tamaulipas, Mexico.
Forests 14 00815 g017
Figure 18. Successional coverage categories and changes in land use, San Vicente, Palmillas, Tamaulipas, Mexico.
Forests 14 00815 g018
Figure 19. Land use coverage and changes in the study period, El Llano y Anexas, Bustamante, Tamaulipas, Mexico.
Forests 14 00815 g019
Figure 20. Percentage of land cover changes in scenes from (a) 1973–1980, (b) 1980–1986, (c) 1986–2000, (d) 2000–2005, (e) 2005–2009, (f) 2009–2016, and (g) 2016–2020, El Llano y Anexas, Bustamante, Tamaulipas, Mexico.
Forests 14 00815 g020
Figure 21. Represented area (km2) for each category of land use coverage during the study period, El Llano y Anexas, Bustamante, Tamaulipas, Mexico.
Forests 14 00815 g021
Figure 22. Successional categories of coverage and changes in land use, El Llano y Anexas, Bustamante, Tamaulipas, Mexico.
Forests 14 00815 g022
Table 1. Characteristics of Landsat scenes and some parameters used for the analysis of changes in rangeland cover and land use in the Tamaulipan Highlands, Tamaulipas, Mexico.
YearSatelliteSensorLocation
Coordinate (Path/Row)
Date of SceneSpatial Resolution Bands for False Color ImageBands for Spectral Signature Extraction
1973Landsat 1MSS029/04410 May 197360 m1, 2, 31, 2, 3, 4, NDVI
1980Landsat 1MSS029/0449 October 198060 m1, 2, 31, 2, 3, 4, NDVI
1986Landsat 5TM027/04414 March 198630 m2, 3, 41, 2, 3, 4, 5, NDVI
2000Landsat 7ETM+027/0449 December 200030 m2, 3, 41, 2, 3, 4, 5, NDVI
2005Landsat 7ETM+027/0445 November 200530 m2, 3, 41, 2, 3, 4, 5, NDVI
2009Landsat 8ETM+027/04419 July 200930 m2, 3, 41, 2, 3, 4, 5, NDVI
2016Landsat 8OLI-TIRS027/0441 April 201630 m3, 4, 52, 3, 4, 5, 6, NDVI
2020Landsat 8OLI-TIRS027/04428 April 202030 m3, 4, 52, 3, 4, 5, 6, NDVI
Table 2. Land use/land cover categories (LULC) in the Tamaulipan Highlands, Tamaulipas, Mexico.
EjidoCategoryDescription
San Rafael (Tula), San Antonio (Jaumave), La Peña (Miquihuana), and El Llano y Anexas (Bustamante) 1. Xerophytic scrub Microphyllous desert scrub; rosetophyllous desert scrub; mezquital; and secondary scrub vegetation.
San Rafael (Tula) and San Antonio (Jaumave) 2. Submontane scrub Dense submontane scrub vegetation.
San Rafael (Tula), San Antonio (Jaumave), La Peña (Miquihuana), San Vicente (Palmillas), and El Llano y Anexas (Bustamante) 3. Bare land Urban and semi-urban areas; sparsely vegetated areas; rocks; dry rivers and tributaries without vegetation; bare soil areas; and roads and highways.
San Rafael (Tula), San Antonio (Jaumave), La Peña (Miquihuana), San Vicente (Palmillas), and El Llano y Anexas (Bustamante) 4. Agriculture Annual, semi-permanent, and permanent rain-fed agriculture; and induced grassland.
La Peña (Miquihuana) and San Vicente (Palmillas) 5. Pine–oak forest The dense vegetation of pine forests, oak forests, pine–oak forests, and oak–pine forests.
San Vicente (Palmillas) 6. Secondary shrubby vegetation of pine–oak forests Secondary vegetation of bushy size of pine–oak forests.
El Llano y Anexas (Bustamante) 7. Tascate forests The dense vegetation of coniferous trees (scale-shaped leaves) of the genus Juniperus.
Table 3. The number of categories resulting from the “transition image” for each Ejido of the Tamaulipan Highlands, Tamaulipas, Mexico.
Ejido1973 vs. 19861973–1986 vs. 20001973–1986–2000 vs. 20091973–1986–2000–2009 vs. 2020
  1. El Llano and Anexas-Bustamante92780222
  2. San Antonio-Jaumave92777193
  3. San Vicente-Palmillas92775188
  4. La Peña-Miquihuana92565148
  5. San Rafael-Tula92664130
Disclaimer/Publisher’s Note: The statements, opinions and data contained in all publications are solely those of the individual author(s) and contributor(s) and not of MDPI and/or the editor(s). MDPI and/or the editor(s) disclaim responsibility for any injury to people or property resulting from any ideas, methods, instructions or products referred to in the content.

