Review

Effect of Changes in Throughfall on Soil Respiration in Global Forest Ecosystems: A Meta-Analysis

1
State Key Laboratory of Atmospheric Boundary Layer Physics and Atmospheric Chemistry, Institute of Atmospheric Physics, Chinese Academy of Sciences, Beijing 100029, China
2
Department of Atmospheric Chemistry and Environmental Science, College of Earth and Planetary Sciences, University of Chinese Academy of Sciences, Beijing 100049, China
Forests 2023, 14(5), 1037; https://doi.org/10.3390/f14051037
Submission received: 19 April 2023 / Revised: 12 May 2023 / Accepted: 15 May 2023 / Published: 17 May 2023

Abstract

:
To date, there has been limited knowledge about how soil carbon dioxide (CO2) emissions from forest ecosystems at a global scale respond to the altered precipitation, and the key influencing mechanisms involved. Thirty-seven studies conducted under throughfall manipulation conditions in forest ecosystems around the globe were selected in this meta-analysis, with a total of 103 paired observations. Experimental categories such as climate types, forest types, soil texture, and the area size of changes in throughfall manipulation were included to qualify the responses of annual soil CO2 emissions to the altered throughfall. The responses of the annual soil CO2 emissions to the altered throughfall would be more sensitive in temperate forests than those in tropical and subtropical forests, probably due to the relatively long residence time of soil carbon (C) and the seasonal freeze–thaw events in temperate forests, as well as the relatively high concentration of non-structural carbohydrates in the belowground part of temperate terrestrial plants. A relatively large positive response of the soil CO2 emissions to the increased throughfall was observed in Mediterranean forests due to small precipitation during the growing season and mostly coarse-textured soils. Besides climate types, the sizes of the effect of the altered throughfall on the soil CO2 emissions (lnRCO2) varied with forest types and soil texture categories. Based on the regression analysis of the lnRCO2 values against the changes in throughfall, the annual soil CO2 emissions in forest ecosystems at a global scale would be increased by 6.9%, provided that the change in annual precipitation was increased by 10%. The results of structural equation modeling analysis indicate that fine root biomass and soil microbial biomass, along with the changes in annual precipitation, would substantially affect the altered throughfall-induced annual soil CO2 emissions in global forest ecosystems. The findings of this meta-analysis highlight that the measurement of soil respiration components, the priming effects of soil organic C decomposition, and C allocation between the aboveground and belowground parts of different tree species under the altered precipitation conditions, deserve more attention in the future.

1. Introduction

Forests cover about 31% of the world’s land area [1], and as the largest carbon (C) sink among terrestrial ecosystems, forest ecosystems account for more than 86% of the C pool in vegetation and more than 73% of the C pool in soil [2,3]. Because two-thirds of forest ecosystem respiration results from soil respiration [4,5,6], a small change in soil respiration due to climate changes, particularly in heterotrophic respiration, can even result in an important change in the C balance of forest ecosystems [5,7,8], probably leading to impacts on global C cycling, atmospheric carbon dioxide (CO2) concentration, and the climate system [9,10,11].
Because of climate change (especially global warming), air circulation and the hydrological cycle have largely been intensified, leading to rapid shifts in precipitation regimes across the globe. For example, global precipitation was estimated to increase by 7.4 ± 2.6% with each 1 °C increment in temperature over the period 1987–2006 [12]. The altered precipitation may directly and indirectly affect terrestrial C dynamics, and then ecosystem structure and function [13], which may influence interactions with other global change drivers (e.g., elevated CO2 and climate warming). Therefore, understanding the responses of soil C dynamics to precipitation changes is of key importance to accurately predict the rate and extent of climate change [14].
Soil respiration, a vital process of soil C dynamics, is strongly affected by soil water availability and its association with the activities of roots and microorganisms [5,8,11], which is closely related to changing precipitation patterns [15]. Normally, throughfall (TF) is much larger than stemflow as a component of total precipitation under the forest canopy, and the amount of TF input varies with the characteristics of precipitation and the structure of forest ecosystems, such as tree species compositions and stand density [16]. In recent decades, precipitation manipulation experiments via TF transferring have widely occurred in forest ecosystems in different climate zones around the globe. The TF reduction was reported to decrease soil respiration in some temperate and tropical forests [15,16,17,18,19,20,21,22], whereas elevated soil respiration was measured in some tropical forests [23,24,25] and in subtropical broadleaf forests [26,27,28,29]. In Mediterranean forests, soil CO2 emissions upon TF reduction were reported to be variable, whereas the emissions increased upon TF addition [30,31,32,33]. A previous meta-analysis showed that decreased precipitation across all terrestrial ecosystems reduced soil respiration by 12%, whereas increased precipitation increased soil respiration by 45% [34]. In spite of this, a doubling precipitation treatment did not affect soil respiration in a mixed subtropical coniferous and broadleaf forest [35]. The different direction and magnitude of the soil CO2 emissions’ responses to precipitation changes is likely due to the considerable spatial heterogeneity in edaphic conditions (e.g., soil organic matter content, texture, and bulk density) and biotic communities within and across forest ecosystems, as well as climate types [19,22,36,37,38,39,40]. However, to date, there has been limited knowledge available about whether the responses of CO2 emissions from forest soils to altered precipitation vary with climate types.
Soil CO2 emissions usually have a peak under moderate soil moisture conditions, and decrease when soil moisture becomes either relatively wetter or drier, especially in tropical forests [25,41,42,43]. Besides soil moisture, the changes in root activity and root biomass and soil microbial biomass C under altered precipitation conditions would have important effects on the precipitation-induced soil CO2 emissions from forest ecosystems [41,42,44,45]. Furthermore, soil texture, the aboveground litter layer of forest stands, and ambient temperature and humidity can substantially affect the changes in the soil water retention characteristics following a precipitation event, thus influencing CO2 emissions from forest soils [19,46]. Probably, the responses of the soil CO2 emissions from forest ecosystems to altered precipitation are dependent on experimental categories such as climate types, forest types, soil texture, and the area sizes of changes in TF manipulation. However, to date, limited knowledge has been available about how the annual soil CO2 emissions in forest ecosystems at a global scale respond to the altered precipitation among the different experimental categories, and the key influencing mechanisms involved.
Based on 103 previously published pairs of observation data from 37 throughfall manipulation field experiments in forest ecosystems at a global scale in recent decades, a meta-analysis was performed to (1) quantify the effect sizes on the altered TF-induced annual soil CO2 emissions (lnRCO2) among the different experimental categories, and (2) to find whether the lnRCO2 values vary with climate types, forest types, soil texture, and the area sizes of changes in TF manipulation, as well as the related mechanisms affecting the lnRCO2, by fully incorporating the results of nearly 60 references published previously. The third objective of this meta-analysis was to explore the dominant factors regulating the lnRCO2 values in global forest ecosystems under altered precipitation conditions.

2. Materials and Methods

2.1. Data Collection and Quality Control

Data on CO2 emissions from forest soils under throughfall manipulation conditions were collected by searching the published literature in the databases of ISI-Web of Science and Google Scholar, as well as the China National Knowledge Infrastructure, using combinations of keywords such as “throughfall” or “rainfall” or “precipitation” and “carbon dioxide” or “CO2” or “respiration” and “forest soil” in the topic field for the period between 1 January 1990 and 31 December 2021. Information was recorded relating to the nation, climate zone, forest type, annual precipitation, annual average air temperature, soil properties such as total organic C and total N, pH, bulk density, soil texture, the duration of measurement, and CO2 emission rate. For a few study cases where soil bulk density values were not available, these were estimated according to an equation developed by Post and Kwon [47]. Experimental datasets that met the following criteria were finally included in this review: (1) only field-based measurements covering at least one complete growing season or over the year; (2) studies including paired control and TF reduction or TF addition treatments, with at least three independent repeated observations per treatment; (3) field measurements with a combination of TF manipulation and other factors (e.g., warming and nitrogen deposition) were excluded, considering the fact that these factors altered soil properties and thus the soil CO2 emission; (4) the accessibility of cumulative CO2 emission data with experimental unit area. Based on these criteria, 37 studies conducted under TF manipulation conditions in forest ecosystems were selected from around the global (Table S1). Data were collected from the tables and figures of these selected studies. The data shown in figures were extracted using Getdata Graph Digitizer (version 2.26) (available at https://getdata-graph-digitizer.software.informer.com/, accessed on 10 March 2020). Either the mean or the experimental unit-level data were collected, depending on data availability, resulting in a total of 103 paired observations. Among them, 80 paired observations reported changes in the soil CO2 emissions upon TF reduction, and the rest reported those following TF addition. Besides the soil CO2 emission data, soil properties (e.g., moisture and temperature, pH, microbial biomass C, biomass of fine roots, exchangeable NH4-N and NO3-N contents, and dissolved organic C content) under TF manipulation conditions were collected, considering data availability from the literature, in order to study the causal relationships among the effect sizes on the soil CO2 emissions and soil properties under altered TF conditions.
Experimental conditions, such as climate type, forest type, soil texture, and area size of changes in TF manipulation, were also collected (Table S1). These data were then sorted into groups of experimental conditions and analyzed as categorical variables (Table 1). Climate types were classified into subtropical, tropical, temperate, Mediterranean, and boreal. Forest types were sorted into coniferous, broadleaf, and mixed forests. Soil texture was classified into three groups: fine (silt clay and clay), medium (silt clay loam, clay loam, silt loam, and loam), and coarse (sandy loam, sandy clay loam, loamy sand, and sand) soils. The area sizes of changes during TF manipulation were sorted into three groups: size 1 (≤5 m × 5 m), size 2 (>5 m × 5 m and <20 m × 20 m), and size 3 (≥20 m × 20 m). The numbers of paired observations within these experimental categories are shown in Table 1. These experimental categories were used to qualify the effect sizes of the soil CO2 emissions and soil properties, as mentioned afterwards.

2.2. Data Analysis

Based on previous paired observation data from TF manipulation field experiments in forest ecosystems at a global scale (Table S1), a meta-analysis was performed using the software MetaWin 2.1 [48], in order to compare the effect sizes of the altered TF-induced annual soil CO2 emissions across the experimental categories. Missing standard deviations of a few datasets were replaced by the average values of standard deviations of other groups of data using the software MetaWin 2.1. The natural log of the response ratio (lnRCO2), defined as the “effect size”, was used to assess the responses of the annual soil CO2 emissions to decreased or increased TF treatments using the following equation [49,50]:
LnR = ln (Xt/Xc)
where Xt and Xc are the means of annual soil CO2 emissions for the decreased or increased TF treatment and control groups, respectively.
The confidence interval (CI) of the effect size was generated using bootstrapping (999 iterations). The effect was considered significant if the 95% CI of the effect size did not exceed zero. To facilitate our explanation, the mean effect size (lnRCO2) was transformed back to the percentage change of the altered TF treatments using the following equation [50]:
(eLnR − 1) × 100%
The whole dataset was checked for homogeneity of variance and normalization of distribution with Levene’s test and the Kolmogorov–Smirnov test, respectively. The results show that the variance was homogeneous, and the distribution was normal (Figure 1). Differences in the LnRCO2 values among the experimental categories were assessed with analysis of variance (ANOVA) using the general linear model of the IBM SPSS Statistics 19 (IBM Corp., New York, NY, USA) (Table 2). When the ANOVA was significant, pairwise comparisons of means were undertaken using Duncan’s multiple range test. The LnRCO2 values of all paired observations in this meta-analysis were plotted against the percentage changes in TF and fitted with linear regressions. The effect sizes of soil properties under the altered TF conditions were calculated using similar methods to those mentioned, such as the lnRCO2. Here, the effect sizes of soil properties, such as soil moisture, fine root biomass, microbial biomass C, exchangeable NH4-N and NO3-N contents, dissolved organic C contents, and pH values (namely, lnRmoisture, lnRroots, lnRmbc, lnRNH4, lnRNO3, lnRDOC, and lnRpH) were assessed with ANOVA using the general linear model of the IBM SPSS Statistics 19 (IBM Corp., New York, NY, USA) (Table S2). Soil temperature data among the experimental categories were not included because of the lack of significant differences. The sizes of effects on the soil properties selected among the experimental categories are described with box plots.
The percentage changes in TF (ΔTP), lnRmoisture, lnRmbc, lnRroots, and lnRDOC) were selected as predictors to establish a priori SEM analyses to evaluate the direct and indirect effects of ΔTP, and the effect sizes of selected soil properties on the lnRCO2 values. Another SEM analysis was performed to investigate the direct and indirect effects of annual rainfall, annual mean air temperature, the ratio of soil total organic C to total N (SOCtoTN), and soil bulk density on the lnRCO2 values under the experimentally altered TF conditions (Table 1). The standardized total effects of selected variables on the lnRCO2 values have been explained. The overall goodness of fit for the SEM analysis was tested using the Chi-squared test and the root-mean-square error of approximation. The SEM analysis was conducted with the software AMOS 24 (SPSS Inc., Chicago, IL, USA).

3. Results

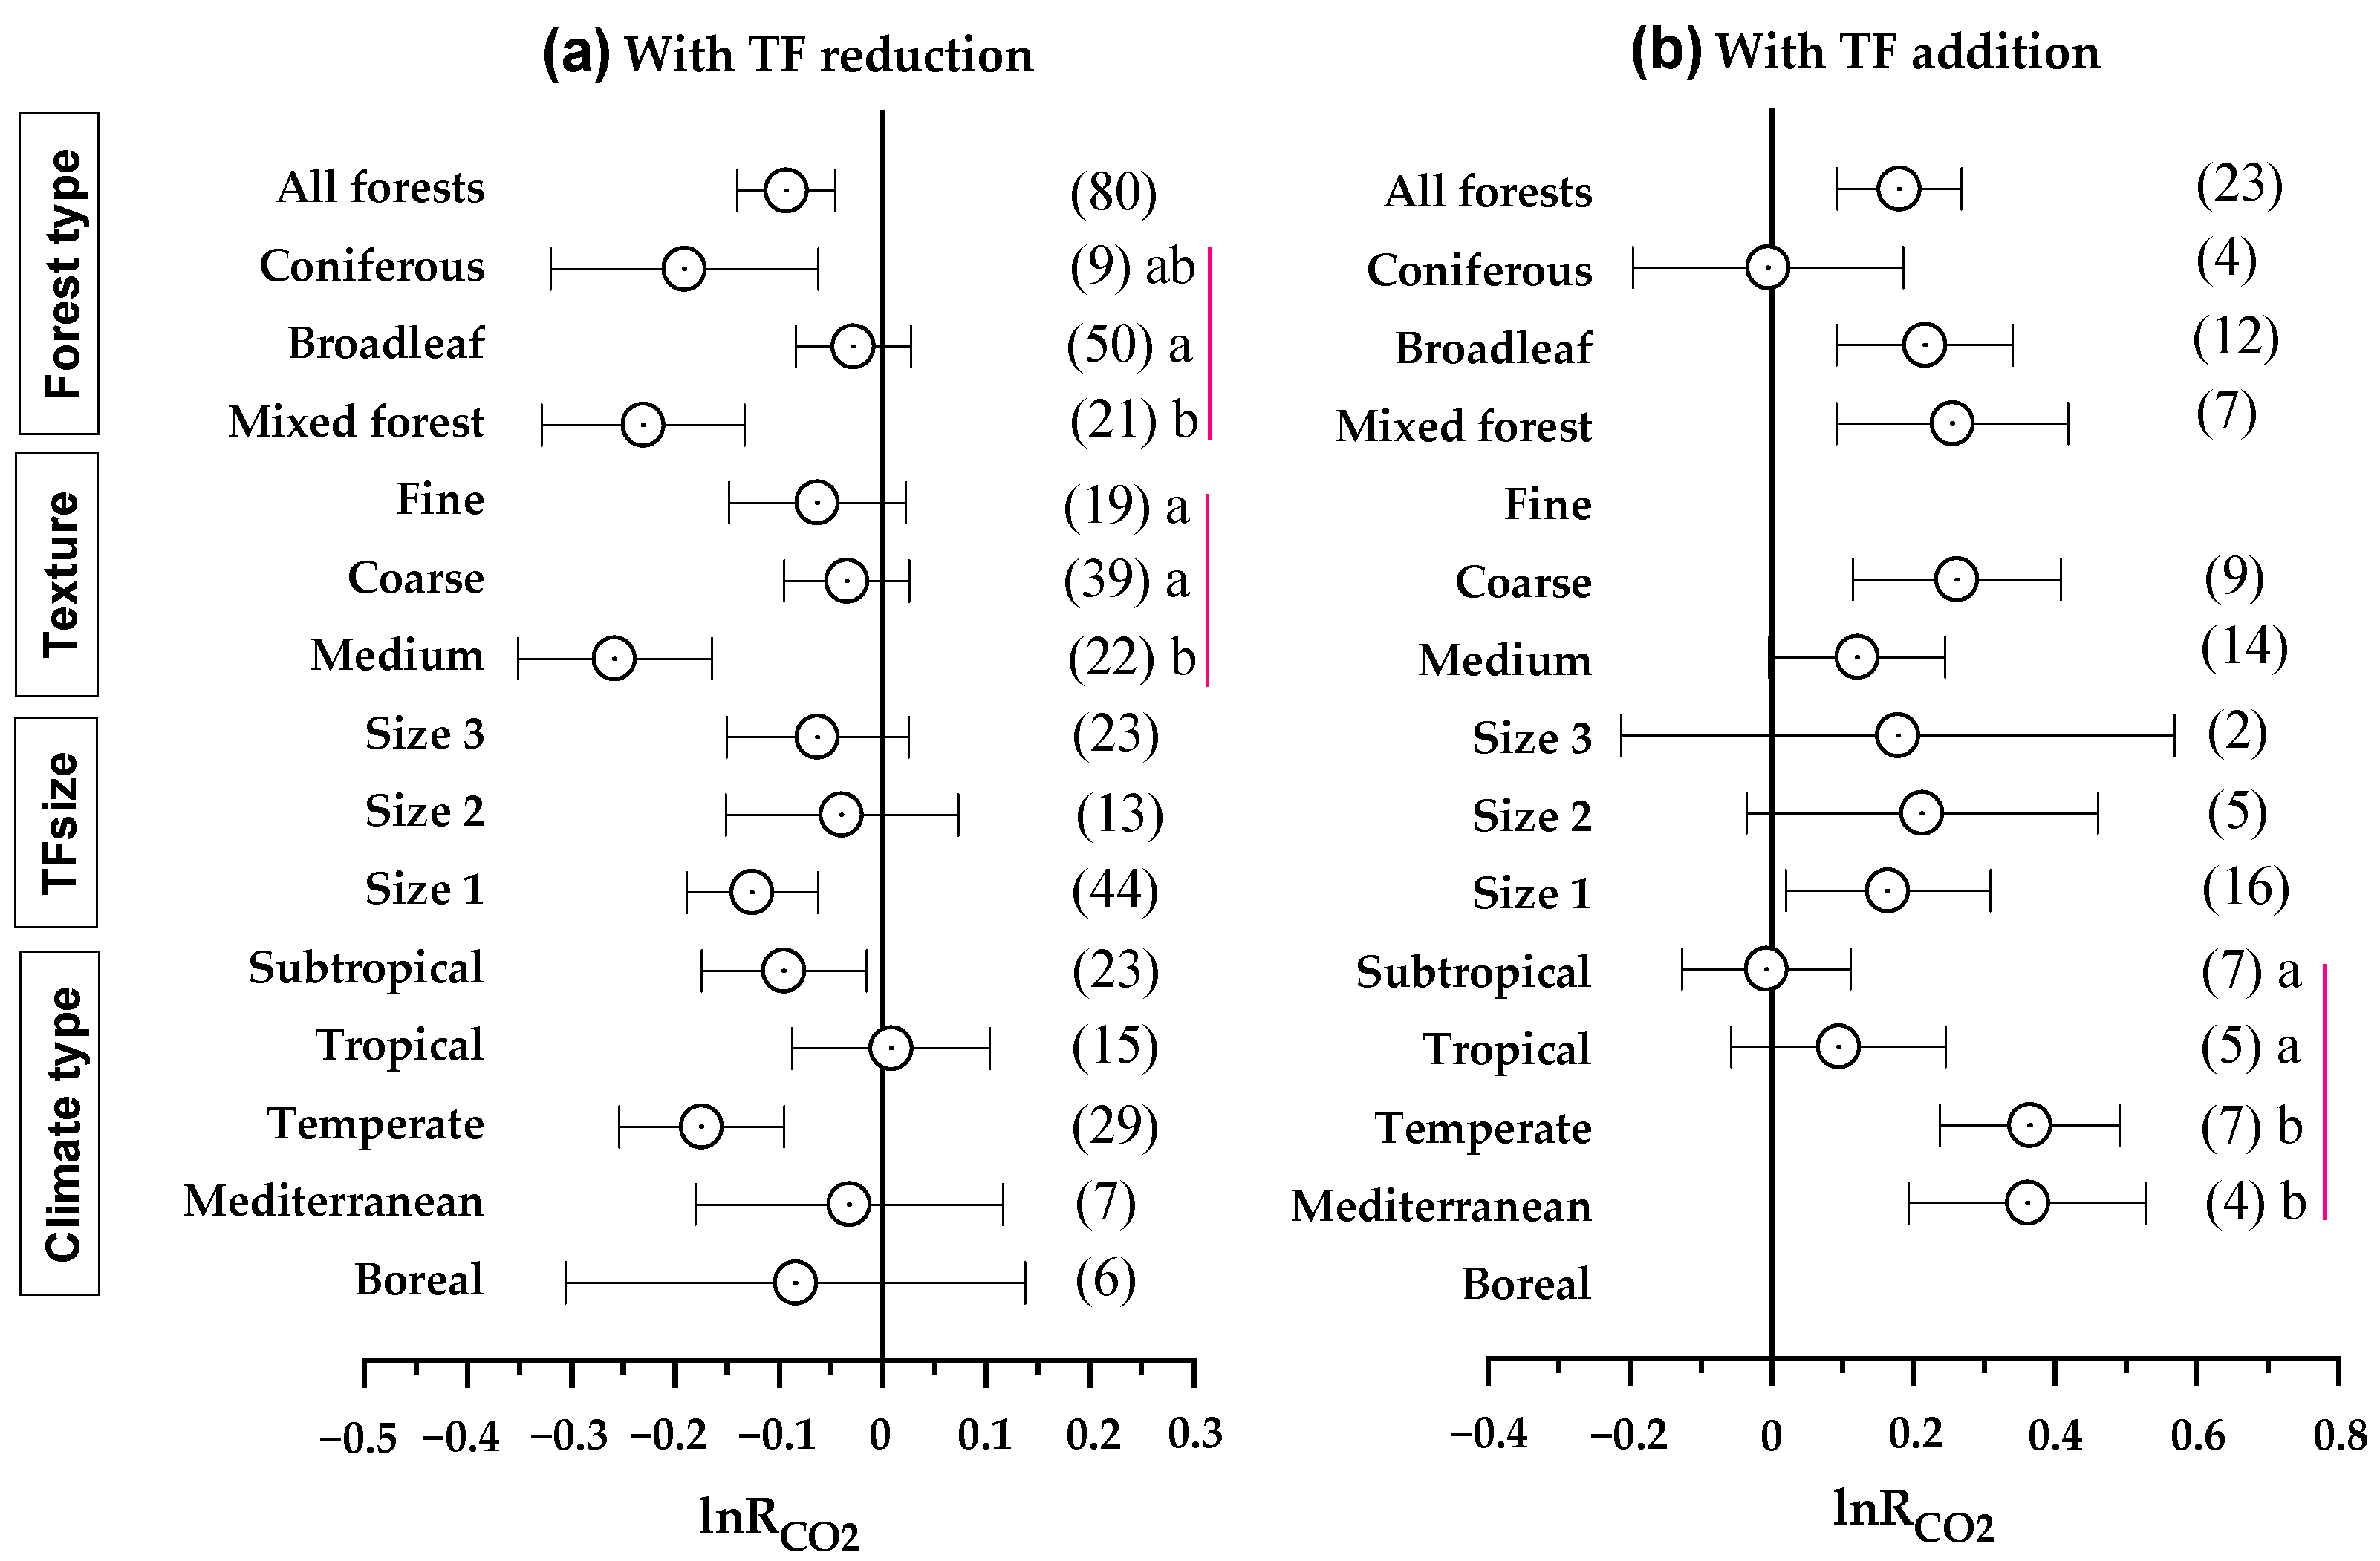
3.1. Overall Pattern of Soil CO2 Emission by TF Manipulation

The sizes of effects on the annual soil CO2 emissions (lnRCO2) in forest ecosystems under altered TF conditions at a global scale are shown in Figure 2. On average, decreased rainfall significantly depressed the annual soil CO2 emission by 8.8% (95% CI: −13.0% to −4.4%) (Figure 2a), while increased rainfall significantly increased the emissions by 19.7% (95% CI: 9.7% to 30.8%) (Figure 2b). Under decreased TF conditions, annual soil CO2 emissions in temperate and subtropical forests were significantly reduced by 16.0% and 9.1% (95% CI: −22.4% to −9.1% and −16.0% to −1.5%), respectively, whereas no significant changes in the soil CO2 emissions were observed in tropical, Mediterranean, and boreal forests (Figure 2a). Following the TF addition, annual soil CO2 emissions in temperate and Mediterranean forests were significantly increased by 43.9% and 43.4% (95% CI: 26.7% to 63.4% and 21.4% to 69.5%), respectively, whereas there were no significant changes in the soil CO2 emissions in subtropical and tropical forests (Figure 2b). Furthermore, the averages of the lnRCO2 values under increased TF conditions became larger in temperate and Mediterranean forests than those in tropical and subtropical forests (p < 0.05) (Figure 2b and Table 2). Overall, the responses of the annual soil CO2 emissions to the altered rainfall would be more sensitive in temperate forests than those in tropical and subtropical forests (Figure 2), and a relatively large positive response of the soil CO2 emissions to increased rainfall was observed in Mediterranean forests (Figure 2b).
Regardless of the experimental categories, the lnRCO2 values upon TF addition were on average larger than those upon TF reduction (p < 0.001) (Figure 1). There were significant effects of forest types on the lnRCO2 values upon TF reduction (Table 2). Under decreased TF conditions, the annual soil CO2 emissions in coniferous and mixed forests were, on average, significantly reduced by 17.4% and 20.6% (95% CI: −27.4% to −6.0% and −28.0% to −12.5%), respectively, whereas no significant changes in the soil CO2 emissions occurred in broadleaf forests (Figure 2a). Compared with the control, the averages of lnRCO2 values in broadleaf and mixed forests under increased TF conditions were significantly increased (p < 0.05), whereas no changes in the lnRCO2 values occurred in coniferous forests (Figure 2b), which indicates that the responses of the annual soil CO2 emissions to increased rainfall would be more sensitive in broadleaf and mixed forests than in coniferous forests.
Soil texture has a vital effect on the soil CO2 emission by regulating its biophysical properties. On average, decreased rainfall significantly depressed the CO2 emissions from medium-textured soils by 22.8% (95% CI: −29.7% to −15.2%), but it had no significant effects on either fine or coarse-textured soils (Figure 2a). Furthermore, the lnRCO2 values in medium-textured soils became on average much smaller than the values in coarse and fine-textured soils (p < 0.05) (Figure 2a and Table 2), suggesting that the responses of the CO2 emissions to decreased rainfall would be more sensitive in medium-textured soils. Contrary to those under decreased TF conditions, the CO2 emissions from coarse and medium-textured soils were on average increased by 29.9% and 12.8% (95% CI: 12.1% to 50.5% and –0.4% to 27.7%) under increased TF conditions, respectively, and a significant increase in the lnRCO2 values occurred in coarse-textured soils compared with the control (p < 0.05) (Figure 2b).
Regarding the TFsize category, there was, on average, generally a reduction in the lnRCO2 values upon TF reduction, and an increase in the values with increased TF (Figure 2). However, the differences in lnRCO2 values within the TFsize category are not significant (Table 2).

3.2. Relationship between lnRCO2 Values and Changes in Throughfall

The sizes of effect on the annual soil CO2 emissions and lnRCO2 values under altered TF conditions generally conformed to a normal distribution (p = 0.20), and the variance was homogeneous (p = 0.31 with Levene’s test) (Figure 3a). A 28% variation in the lnRCO2 values for the whole dataset can be explained by changes in throughfall (Figure 3b). Based on the linear regression of the lnRCO2 values against the changes in throughfall (Figure 3b), the annual soil CO2 emission in forest ecosystems at a global scale would be increased by 6.9%, provided that the change in annual rainfall was increased by 10%. Furthermore, the slope values of linear regressions within the soil texture category indicate that the largest response of CO2 emissions to the changes in annual rainfall across global forest ecosystems was shown by medium-textured soils (Figure 3b).

3.3. Effect of TF Manipulation on Soil Properties

The results of ANOVA on the sizes of effects on soil properties among the experimental categories are shown in Table S2. Under decreased TF conditions, the lnRmoisture values were significantly affected by the soil texture category (Table S2), with the smallest values shown by coarse-textured soils (p < 0.05) (Figure 4b). On average, the lnRmoisture values upon TF addition became larger in broadleaf forests than in mixed forests (p < 0.05) (Figure 4a). As regards the climate type categories, the lnRmoisture values upon TF addition were on average the largest in Mediterranean forests, whereas no significant differences arose within the experimental category (Figure 4c). The TFsize category did not significantly affect the lnRmoisture values across all selected forest stands (Table S2 and Figure 4d).
The lnRroots values upon TF reduction were significantly affected by the climate type category (Table S2). On average, the lnRroots values under the altered TF conditions were the largest in the coarse-textured soils among the soil texture category (Figure S1c). The lnRNH4 values upon TF addition were significantly influenced by the climate type, forest type, and soil texture categories, respectively (Table S2), and the values became negative in coarse-textured soils and positive in medium-textured soils, respectively (p < 0.01) (Figure S1b). The lnRmbc values upon TF reduction within the forest type category became negative on average, along with the smallest values seen in coniferous forests compared with the values in broadleaf forests and mixed forests (Figure S1a). Both lnRDOC and lnRpH values under decreased TF conditions were significantly affected by the climate type and soil texture categories, respectively, and the lnRpH values under increased TF conditions were significantly affected by the climate type category (Table S2).

3.4. Relationships between lnRCO2 Values and Environmental Variables

Figure 5 shows the relationships among the effect sizes on the soil CO2 emissions versus soil moisture, microbial biomass C, and fine root biomass across the whole available dataset. The results of linear regression analysis strongly indicate that the lnRCO2 values significantly increased with the increase in the lnRmoisture, lnRmbc, and lnRroots values in all selected forest ecosystems around the globe, respectively.
The SEM analysis was performed to investigate the causal relationships between the lnRCO2 values and environmental variables such as soil properties, fine root biomass, and hydrothermal conditions (Figure 6 and Figure 7). The annual mean air temperature, annual rainfall, the ratio of soil total organic C to total N (SOCtoTN), and bulk density could explain 18% of the variability in the lnRCO2 values under the altered TF conditions (Figure 6a), with a relatively large positive standardized total effect of annual mean air temperature and negative effects of bulk density and the SOCtoTN (Figure 6b). Considering the role of the effect sizes of soil properties in regulating the lnRCO2 values under altered TF conditions, the SEM analysis indicates that the percentage changes in throughfall (ΔTP), lnRmoisture, lnRroots, lnRmbc, and lnRDOC could explain 61% of the variability in the lnRCO2 values for the whole dataset (Figure 7a), with ΔTP and lnRroots as well as lnRmbc being the dominant factors in regulating the lnRCO2 (Figure 7b).

4. Discussion

4.1. Throughfall Effects on Forest Soil CO2 Emissions Vary with Climate Types

Global warming and land-use changes in the tropical region are predicted to result in drier conditions [51,52], which would affect soil CO2 emissions from tropical forests. In humid tropical forests of south America and southwest China, many studies have reported an increase in soil respiration after precipitation reduction [24,25,46,53]. However, in a moist tropical forest such as the Brazilian Amazon, soil respiration did not change after throughfall exclusion, mainly due to the counteracting effects of fine root death and consequent increased microbial activity [44]. Additionally, the different responses in wet tropical soils at various sites could be partly due to fluctuating redox conditions and the interaction between soil iron mineral dynamics and dissolved organic C [54]. In a seasonally dry tropical forest of southern China, the simulation of a delayed wet season for two months via TF reduction did not change monthly measured soil respiration, which could be attributed to the increased microbial biomass offsetting the reduction in fine root biomass [45]. In a tropical forest of Indonesia, the simulated drought reduced soil CO2 emission by 23% in the first 9 months and by 48% in the next 15.5 months, compared to the control, which was accompanied by significant reductions in both autotrophic and heterotrophic respiration [20,41]. The magnitude of the decrease in soil CO2 emissions in Indonesia was much greater than that in the soil CO2 emission observed in the eastern Amazon [19]. Furthermore, due to the differences in regular extended drought stress in tropical forests at various sites, the tropical forests in the eastern Amazon have developed deeper root systems than those in Southeast Asia [55,56,57]. A previous review documented a positive correlation between the length of dry season and rooting depth, and a negative correlation between annual precipitation and rooting depth in tropical forests [56]. In conclusion, the differences in the development of root systems of tropical forests and soil properties (e.g., microbial biomass, pH, dissolved organic C, and iron mineral dynamics) under fluctuating redox conditions most likely explain the above-mentioned different responses of the soil CO2 emissions to the decreased precipitation. Probably, the different responses of soil CO2 emissions to precipitation reduction in tropical forests at various sites lead to the apparently unchanged soil CO2 emissions under TF reduction conditions (Figure 2a).
Compared with those from tropical, Mediterranean, and boreal forests, soil CO2 emissions from subtropical and temperate forests became more sensitive to precipitation reduction (Figure 2a). Soil CO2 emissions from temperate and Mediterranean forests showed significant stimulation responses to the increased precipitation compared with those from subtropical and tropical forests (Figure 2b). The results indicate that the altered precipitation-induced soil CO2 emissions from forest ecosystems would vary with climate types. Compared with temperate, Mediterranean, subtropical, and tropical forests, there were a few field-paired observations showing soil CO2 emissions from boreal forests under TF reduction [36,58]. As shown in Figure 2a, soil CO2 emissions caused by TF reduction in boreal forests were not significantly different from the control. This is due to the changes in soil temperature and water availability in different boreal microtopography areas [36]. The boreal forests contain 16 of the world’s soil carbon [59], and the soil carbon mostly stored in the permafrost of boreal landscapes, especially in young forests with low density, is becoming more vulnerable to the shifts in precipitation and increases in temperature [60,61]. Due to the lack of field experimental data, more field-paired observations will be needed to further explore the changes in the precipitation-induced soil CO2 emissions of global boreal forests with different forest development stages, and the influencing mechanism involved.
A meta-analysis showed that soil respiration across all terrestrial ecosystems tends to be more sensitive to increased rainfall in more arid areas, and more responsive to decreased rainfall in more humid areas [62]. This result can partly support the stimulating responses of soil CO2 emissions to TF addition in Mediterranean forests (Figure 2b). In the Mediterranean climate zone, small precipitation during the growing season [32,63] and mostly coarse-textured soils [32,33] normally result in relatively large lnRCO2 values upon increased TF in Mediterranean forests than in tropical and subtropical forests (p < 0.05) (Figure 2b). Furthermore, following TF addition, an increase in soil nitrogen availability [17] and an increase in soil pH [45] under seasonally dry forest ecosystem conditions would increase the activity of soil microorganisms, probably resulting in increased soil CO2 emissions in Mediterranean forests, mostly with poor soil nutrients [33]. However, in tropical and subtropical forests, there were no significant differences in the lnRCO2 values upon TF addition (Figure 2b). This results from the relatively high annual precipitation, and the different responses of the development of root systems and soil properties (e.g., microbial biomass, pH, dissolved organic C, and iron mineral dynamics) to the varying soil moisture in tropical and subtropical forests at various sites around the globe [45,54,55,56,57].
To date, there has been no research reporting that the responses of annual soil CO2 emissions to the altered precipitation became more sensitive in temperate forests than in tropical and subtropical forests at a global scale (p < 0.05) (Figure 2). Here, the following three reasons would explain this hypothesis. The changes in precipitation regimes can alter both belowground and aboveground C allocation in forest ecosystems [44]. Compared with tropical and subtropical forest soils, the carbon stored in temperate forest soils normally has relatively long residence times [64], and it becomes more sensitive to climate changes, particularly in the non-growing season, probably due to the relatively high levels of soil pH and substrate availability [37,43,45,65]. Unlike tropical and subtropical forests, temperate forests are most likely to experience variations in soil freezing and thawing events annually, which can be strengthened by the reduction in winter snowfall against the background of warming [66]. The release of dissolved organic matter and inorganic nitrogen into the soil, and changes in the activities of soil enzymes following soil freeze–thaw events [67,68,69], would, to some extent, aggravate the altered precipitation-induced soil CO2 emissions from global temperate forests in the growing season. Compared with boreal, Mediterranean, and tropical terrestrial plants around the globe, a relatively high concentration of non-structural carbohydrates was found in the belowground part of temperate terrestrial plants [70]. This would partly account for the relatively high sensitivity of CO2 emissions from temperate forest soils to altered precipitation (Figure 2). Together with the results of all the throughfall manipulation experiments available, it can be reasonably concluded that the responses of annual soil CO2 emissions in forest ecosystems around the world to altered precipitation vary with climate types.

4.2. Throughfall Effects on Soil CO2 Emissions Vary with Forest Types and Soil Properties

The forest type, a vital part of the stand structure, can affect the variability in the properties of aboveground litter and belowground root biomass and distribution [56,71], which could in turn affect the responses of forest soil respiration to precipitation changes [17,45,72,73,74]. Soil CO2 emissions in coniferous forests appear to be insensitive to increased TF (Figure 2b) compared with the control, whereas the responses of the soil CO2 emissions to TF reduction are more negative in coniferous and mixed forests than in broadleaf forests (Figure 2a). Compared with the control, soil microbial biomass C concentrations under coniferous forests and mixed forests were significantly reduced upon TF reduction (p < 0.05), whereas no significant difference was observed under broadleaf forests (Figure S1a). This would partly account for the relatively high inhibition of CO2 emissions from coniferous forest soils and mixed forest soils upon TF reduction (Figure 2a). Taken together, the changes in the precipitation-induced soil CO2 emissions varied with forest types, via the differences in the development of root systems and the decomposition of aboveground litter [20,55,56,57], as well as soil microbial biomass and dissolved organic C dynamics under the altered precipitation conditions [17,22,37,39,72]. This would be further supported by the results of the SEM analysis in this study (Figure 7).
Precipitation changes can influence forest ecosystems via dissolved organic matter (DOM) leaching [22,24,75]. When the ambient precipitation is high, the amount of DOM leached from broadleaf tree leaf litter normally becomes larger than that from coniferous tree leaf litter in temperate, subtropical, and boreal forests [76,77,78], and broadleaf trees show relatively larger litter-derived DOM biodegradation than coniferous trees [76,79]. The differences in litter decay under broadleaf and coniferous trees, and the associated litter-derived DOM dynamics [77,79,80], would, to some extent, explain the relatively large soil CO2 emission response in broadleaf forests compared to that in coniferous forests following TF addition (Figure 2b). Besides DOM input into the soil, changes in precipitation regimes can normally alter both aboveground and belowground C allocations in forest ecosystems [44]. Under drought conditions, terrestrial plants can allocate more photosynthate to fine roots, while directing less C to aboveground growth, and this phenomenon might become more prevalent in coniferous forests than that in broadleaf forests, probably due to the relatively low non-structural carbohydrate (NSC) concentrations in conifer tree roots [70,81,82]. This would partly explain why soil CO2 emissions in broadleaf forests have become insensitive to TF reductions (Figure 2a). Additionally, compared with broadleaf trees, coniferous trees in boreal, temperate, and subtropical forests showed more drought vulnerability, especially in spring, mainly due to the low water-holding capacity and high NSC concentrations in conifer needles, and the poor water transport system in conifer foliage [70,83,84]. This would, to some extent, result in the significantly negative responses of soil CO2 emissions to TF reductions in coniferous forests (Figure 2a).
Regardless of TF addition or TF reduction, the soil CO2 emissions under broadleaf and coniferous mixed forests showed significant differences compared with the control (Figure 2). Litter mixtures of coniferous and broadleaf tree leaves have been reported to decompose faster than single-species leaf litter [85]. The differences in litter decay in coniferous and broadleaf mixed forests, and variations in soil biotic and abiotic properties (e.g., pH, substrate availability, fine root biomass, microbial biomass, and microbial community), as well as different C allocation patterns in the aboveground and belowground parts of mixed forests [70,76,86,87], would result in the significant responses of soil CO2 emissions to altered precipitation. Although forest type may be uniform within the same site, significant differences in plant species can arise between different sites, which would affect the C allocation between the aboveground and belowground parts of plants, the changes in soil properties, and soil respiration under the altered precipitation conditions. Therefore, plant species should be included as a variable in future studies seeking to explore the mechanisms affecting lnRCO2 values (Figure 8).
Soil texture can normally influence the growth of plant roots and the activity of soil microorganisms, especially upon rewetting, mainly via the plant–soil water relationship characteristics and soil aeration, thus affecting soil respiration [88,89]. The smallest negative response of soil exchangeable NH4-N content (lnRNH4) and the largest positive response of fine root biomass (lnRroots) following TF addition (Figure S1b,c) contribute to the largest CO2 emission responses of coarse-textured soils (Figure 2b). On average, decreased throughfall increased fine root biomass by 4.4% and decreased soil microbial biomass C by 5.9% in the whole dataset, while increased throughfall reduced fine root biomass by 5.4% and increased soil microbial biomass C by 5.0% (Figure 8). Whether throughfall increases or decreases, the changes in soil moisture would affect fine root biomass and soil microbial biomass C mainly via the regulation of oxygen and the translocation of nutrients in the soil, and thus soil respiration (Figure 8). In a subtropical forest, it was reported that the variations in soil respiration responses to doubling annual precipitation were consistent with the changes in fine root biomass and soil microbial biomass [72]. In humid tropical forests, many studies have indicated that increased soil respiration following precipitation reduction results from enhanced soil microbial activity [24,46,53]. In the eastern Amazonia Basin, a decrease in precipitation was reported to decrease the rates of root growth and increase the amount of dead fine roots and soil nitrogen availability, which may affect soil respiration [17,19,20]. In subtropical and temperate forests, soil respiration was reported to be strongly correlated with fine root biomass [28,73]. The SEM analysis showed that the effect sizes of fine root biomass, soil microbial biomass and dissolved organic C content (e.g., lnRroots, lnRmbc and lnRDOC) played a substantial role in regulating annual soil CO2 emissions under the altered TF conditions (Figure 7). The changes in soil microbial biomass C and fine root biomass upon altered precipitation would affect soil heterotrophic and autotrophic respiration [28,73,74], which is likely related to the changes in the lnRCO2 values among the experimental categories. To date, only 10 paired observation data points are available showing the responses of soil heterotrophic respiration and autotrophic respiration to decreased precipitation in temperate (n = 7) and subtropical broadleaf forests (n = 3) [21,28,73,74,90,91]. On average, annual soil autotrophic respiration upon decreased precipitation was increased by 33.4% (95% CI: −24.0% to 134.1%) in temperate forests, while it was decreased by 54.0% (95% CI: −79.7% to 4.2%) in subtropical forests. Contary to soil autotrophic respiration, annual soil heterotrophic respiration in temperate and subtropical forests upon decreased precipitation was, on average, reduced by 5.9% (95% CI: −16.3% to 5.7%) and 8.8% (95% CI: −23.0% to 8.1%), respectively. The few paired observation data indicate that soil autotrophic respiration in forest ecosystems would become more sensitive to drought than soil heterotrophic respiration. Due to the scarcity of observation data, heterotrophic respiration and total soil respiration were not separated in this meta-analysis. Although some explanations involving the lnRCO2 are provided above, future studies should focus on the measurements of soil respiration components, the priming effects of soil organic C decomposition, and C allocation between the aboveground and belowground parts of different tree species under altered precipitation conditions, which is useful for further understanding changes in the lnRCO2 values and the key mechanisms involved (Figure 8).

5. Conclusions and Future Perspectives

Based on a review and data analysis of TF manipulation experiments in forest ecosystems around the globe, the variations in the altered precipitation-induced soil CO2 emissions could vary with climate types, types of forests, and soil texture. Soil CO2 emissions from temperate forests are more sensitive to altered precipitation than those from subtropical and tropical forests, and Mediterranean forests show a relatively large increase in soil CO2 emissions upon increased rainfall. More importantly, the differences in the precipitation-induced annual soil CO2 emission responses across different climate types can be partly masked by the natural interannual variability in rainfall. To effectively predict the effects of, and feedbacks to, climate change in forest ecosystems, a multi-year observation database is needed to understand the effects of changes in annual rainfall on soil CO2 emissions from forest ecosystems, especially from tropical/subtropical and temperate forests [22,23]. In recent years, soil microorganism parameters such as microbial biomass have been effectively incorporated into soil C cycling-related models, such as Millennial and MIMICS models [92,93], to predict soil C dynamics in terrestrial ecosystems under future climate change scenarios. Based on the findings of this meta-analysis, both soil microbial biomass C and fine root biomass could be considered as the main factors in regulating the lnRCO2 under altered precipitation conditions, which should be incorporated into some terrestrial microbial-mediated C cycling models to reasonably predict the altered precipitation-induced soil CO2 emissions from forest ecosystems over large scales. Over the past few decades, pulse-labeling experiments and the measurement of stable carbon isotopes have been widely carried out to study the C allocation in tree and soil compartments, and between forest ecosystems and the atmosphere [94,95,96,97]. To fully extend our understanding of the altered precipitation-induced soil CO2 emissions in forest ecosystems, and the key influencing mechanisms involved, the measurement of soil respiration components (e.g., autotrophic and heterotrophic respiration), the priming effects of soil organic C decomposition, and C allocation between the aboveground and belowground parts of different tree species under altered precipitation conditions (e.g., drought and rewetting) should be given more attention in the future [66,98,99].

Supplementary Materials

The following supporting information can be downloaded at: https://www.mdpi.com/article/10.3390/f14051037/s1, Table S1: Main message of studies looking at various forest stand sites around the globe; Table S2: Results of analysis variance (ANOVA) on the effects of experimental categories on the effect sizes of soil moisture (lnRmoisture), fine root biomass (lnRroots), microbial biomass (lnRmbc), KCl-exchangeable ammonium-N content (lnRNH4), KCl-exchangeable nitrate-N content (lnRNO3), dissolved organic carbon content (lnRDOC), and pH values (lnRpH) for the whole dataset; Figure S1: Box plots of sizes of effects on soil microbial biomass C (lnRmbc) (a), exchangeable ammonium-N content (lnRNH4) (b), and biomass of fine roots (lnRroots) (c) by forest type and soil texture categories. References [100,101,102,103,104,105,106,107,108,109,110] are cited in the Supplementary Materials.

Funding

This research was funded by the National Natural Science Foundation of China (grant number 41175133, 41775163, 41975121 and 42275130).

Data Availability Statement

The datasets analyzed during the current study are available from the corresponding author on reasonable request.

Acknowledgments

The authors would like to thank all the researchers for the data used in this meta-analysis. The authors sincerely thank the anonymous reviewers for their insightful comments and suggestions on how to improve this manuscript.

Conflicts of Interest

The authors declare no conflict of interest.

References

  1. FAO. Global Forest Resources Assessment 2015: How Are the World’s Forests Changing? Food and Agriculture Organization of the United Nations: Rome, Italy, 2015. [Google Scholar]
  2. Cathcart, J.F.; Kline, J.D.; Tilton, D.M. Carbon storage and Oregon’s land-use planning program. J. For. 2007, 105, 167–172. [Google Scholar]
  3. Zaehle, S.; Bondeau, A.; Carter, T.R.; Cramer, W.; Erhard, M.; Prentice, I.C.; Reginster, I.; Rounsevell, M.D.A.; Sitch, S.; Smith, B.; et al. Projected changes in terrestrial carbon storage in Europe under climate and land-use change, 1990–2100. Ecosystems 2007, 10, 380–401. [Google Scholar] [CrossRef]
  4. Law, B.E.; Ryan, M.G.; Anthoni, P.M. Seasonal and annual respiration of a ponderosa pine ecosystem. Glob. Chang. Biol. 1999, 5, 169–182. [Google Scholar] [CrossRef]
  5. Janssens, I.A.; Lankreijer, H.; Matteucci, G.; Kowalski, A.S.; Buchmann, N.; Epron, D.; Pilegaard, K.; Kutsch, W.; Longdoz, B.; Grunwald, T.; et al. Productivity overshadows temperature in determining soil and ecosystem respiration across European forests. Glob. Chang. Biol. 2001, 7, 269–278. [Google Scholar] [CrossRef]
  6. Bolstad, P.V.; Davis, K.J.; Martin, J.; Cook, B.D.; Wang, W. Component and whole-system respiration fluxes in northern deciduous forests. Tree Physiol. 2004, 24, 493–504. [Google Scholar] [CrossRef]
  7. Cox, P.M.; Betts, R.A.; Jones, C.D.; Spall, S.A.; Totterdell, I.J. Acceleration of global warming due to carbon-cycle feedbacks in a coupled climate model. Nature 2000, 408, 184–187. [Google Scholar] [CrossRef]
  8. Valentini, R.; Matteucci, G.; Dolman, A.J.; Schulze, E.D.; Rebmann, C.; Moors, E.J.; Granier, A.; Gross, P.; Jensen, N.O.; Pilegaard, K.; et al. Respiration as the main determinant of carbon balance in European forests. Nature 2000, 404, 861–865. [Google Scholar] [CrossRef]
  9. Lal, R.; Kimble, J.; Levine, E.; Stewart, B. Soils and Global Change; CRC Press: Boca Raton, FL, USA, 1995. [Google Scholar]
  10. Schimel, D.S.; House, J.I.; Hibbard, K.A.; Bousquet, P.; Ciais, P.; Peylin, P.; Braswell, B.H.; Apps, M.J.; Baker, D.; Bondeau, A.; et al. Recent patterns and mechanisms of carbon exchange by terrestrial ecosystems. Nature 2001, 414, 169–172. [Google Scholar] [CrossRef]
  11. Bond-Lamberty, B.; Bailey, V.L.; Chen, M.; Gough, C.M.; Vargas, R. Globally rising soil heterotrophic respiration over recent decades. Nature 2018, 560, 80–83. [Google Scholar] [CrossRef]
  12. Wentz, F.J.; Ricciardulli, L.; Hilburn, K.; Mears, C. How much more rain will global warming bring? Science 2007, 317, 233–235. [Google Scholar] [CrossRef]
  13. Zhou, X.; Zhou, L.; Nie, Y.; Fu, Y.; Du, Z.; Shao, J.; Zheng, Z.; Wang, X. Similar responses of soil carbon storage to drought and irrigation in terrestrial ecosystems but with contrasting mechanisms: A meta-analysis. Agric. Ecosyst. Environ. 2016, 228, 70–81. [Google Scholar] [CrossRef]
  14. Houghton, R.A. Balancing the global carbon budget. Annu. Rev. Earth Planet. Sci. 2007, 35, 313–347. [Google Scholar] [CrossRef]
  15. Schindlbacher, A.; Wunderlich, S.; Borken, W.; Kitzler, B.; Zechmeister-Boltenstern, S.; Jandl, R. Soil respiration under climate change: Prolonged summer drought offsets soil warming effects. Glob. Chang. Biol. 2012, 18, 2270–2279. [Google Scholar] [CrossRef]
  16. Mazza, G.; Amorini, E.; Cutini, A.; Manetti, M.C. The influence of thinning on rainfall interception by Pinus pinea L. in Mediterranean coastal stands (Castel Fusano-Rome). Ann. For. Sci. 2011, 68, 1323–1332. [Google Scholar] [CrossRef]
  17. Cattânio, J.; Davidson, E.; Nepstad, D.; Verchot, L.; Ackerman, I. Unexpected results of a pilot throughfall exclusion experiment on soil emissions of CO2, CH4, N2O, and NO in eastern Amazonia. Biol. Fertil. Soils 2002, 36, 102–108. [Google Scholar]
  18. Borken, W.; Savage, K.; Davidson, E.A.; Trumbore, S.E. Effects of experimental drought on soil respiration and radiocarbon efflux from a temperate forest soil. Glob. Chang. Biol. 2006, 12, 177–193. [Google Scholar] [CrossRef]
  19. Sotta, E.D.; Veldkamp, E.; Schwendenmann, L.; Guimarães, B.R.; Paixão, R.K.; Lourdes, M.D.; Ruivo, P.; Costa, A.C.L.D.; Meir, P. Effects of an induced drought on the soil CO2 production and soil CO2 efflux in an eastern Amazonian rainforest, Brazil. Glob. Chang. Biol. 2007, 13, 2218–2229. [Google Scholar] [CrossRef]
  20. van Straaten, O.; Veldkamp, E.; Corre, M.D. Simulated drought reduces soil CO2 efflux and production in a tropical forest in Sulawesi, Indonesia. Ecosphere 2011, 2, 119. [Google Scholar] [CrossRef]
  21. Hinko-Najera, N.; Fest, B.; Livesley, S.J.; Arndt, S.K. Reduced throughfall decreases autotrophic respiration, but not heterotrophic respiration in a dry temperate broadleaved evergreen forest. Agric. For. Meteorol. 2015, 200, 66–77. [Google Scholar] [CrossRef]
  22. Xu, X.K.; Duan, C.T.; Wu, H.H.; Luo, X.B.; Han, L. Effects of changes in throughfall on soil GHG fluxes under a mature temperate forest, northeastern China. J. Environ. Manag. 2021, 294, 112950. [Google Scholar] [CrossRef]
  23. Davidson, E.A.; Nepstad, D.C.; Ishida, F.Y.; Brando, P.M. Effects of an experimental drought and recovery on soil emissions of carbon dioxide, methane, nitrous oxide, and nitric oxide in a moist tropical forest. Glob. Chang. Biol. 2008, 14, 2582–2590. [Google Scholar] [CrossRef]
  24. Cleveland, C.C.; Wieder, W.R.; Reed, S.C.; Townsend, A.R. Experimental drought in a tropical rain forest increases soil carbon dioxide losses to the atmosphere. Ecology 2010, 91, 2313–2323. [Google Scholar] [CrossRef]
  25. Zhang, X.; Zhang, Y.P.; Sha, L.Q.; Wu, C.S.; Tan, Z.H.; Song, Q.H.; Liu, Y.T.; Dong, L.Y. Effects of continuous drought stress on soil respiration in a tropical rainforest in southwest China. Plant Soil 2015, 394, 343–353. [Google Scholar] [CrossRef]
  26. Zhou, S.X.; Huang, C.D.; Xiang, Y.B.; Xiao, Y.X.; Tang, J.D.; Han, B.H. Effects of throughfall exclusion on soil respiration in natural evergreen broadleaved forest in rainy area of Western China. Chin. J. Appl. Environ. Biol. 2016, 22, 499–504. [Google Scholar]
  27. Xiang, Y.B.; Huang, C.D.; Hu, T.X.; Tu, L.H.; Zhou, S.X.; Xiao, Y.X.; Gao, B.D. Effects of simulated nitrogen deposition and precipitation changes on soil respiration in an evergreen broadleaved forest in the rainy area of western China. Acta Ecol. Sin. 2016, 36, 5227–5235. [Google Scholar]
  28. Liu, Y.C.; Liu, S.R.; Wan, S.Q.; Wang, J.X.; Luan, J.W.; Wang, H. Differential responses of soil respiration to soil warming and experimental reduction in a transitional oak forest in central China. Agric. For. Meteorol. 2016, 226–227, 186–198. [Google Scholar] [CrossRef]
  29. Chen, L.; Liu, S.R.; Zeng, J.; Wang, H.; Lu, L.H. Effect of precipitation reduction on soil greenhouse gas emission in Castanopsis hystrix and Pinus massoniana plantations. J. Cent. South Univ. For. Tech. 2019, 39, 86–92. [Google Scholar]
  30. Joffre, R.; Qurcival, J.M.; Rambal, S.; Rocheteau, A. The Key-role of topsoil moisture on CO2 efflux from a Mediterranean Quercus ilex forest. Annu. For. Sci. 2003, 60, 519–526. [Google Scholar] [CrossRef]
  31. Mission, L.; Rocheteau, A.; Rambal, S.; Ourcival, J.M.; Limousin, J.M.; Rodriguez, R. Functional changes in the control of carbon fluxes after 3 years of increased drought in a Mediterranean evergreen forest? Glob. Chang. Biol. 2010, 16, 2461–2475. [Google Scholar] [CrossRef]
  32. Cotrufo, M.F.; Alberti, G.; Inglima, I.; Marjanovic, H.; LeCain, D.; Zaldei, A.; Peressotti, A.; Miglietta, F. Decreased summer drought affects plant productivity and soil carbon dynamics in a Mediterranean woodland. Biogeosciences 2011, 8, 2729. [Google Scholar] [CrossRef]
  33. Shvaleva, A.; Lobo-do-Vale, R.; Cruz, C.; Castaldi, S.; Rosa, A.P.; Chaves, M.M.; Pereira, J.S. Soil-atmosphere greenhouse gases (CO2, CH4 and N2O) exchange in evergreen oak woodland in southern Portugal. Plant Soil Environ. 2011, 57, 471–477. [Google Scholar] [CrossRef]
  34. Wu, Z.; Dijkstra, P.; Koch, G.W.; Penuelas, J.; Hungate, B.A. Responses of terrestrial ecosystems to temperature and precipitation change: A meta-analysis of experimental manipulation. Glob. Chang. Biol. 2011, 17, 927–942. [Google Scholar] [CrossRef]
  35. Deng, Q.; Hui, D.; Zhang, D.; Zhou, G.; Liu, J.; Liu, S.; Chu, G.; Li, J. Effects of precipitation increase on soil respiration: A three-year field experiment in subtropical forests in China. PLoS ONE 2012, 7, e41493. [Google Scholar] [CrossRef]
  36. Billings, S.A.; Richter, D.D.; Yarie, J. Soil carbon dioxide fluxes and profile concentrations in two boreal forests. Can. J. For. Res. 1998, 28, 1773–1783. [Google Scholar] [CrossRef]
  37. Xu, X.K.; Han, L.; Wang, Y.S.; Inubushi, K. Influence of vegetation types and soil properties on microbial biomass carbon and metabolic quotients in temperate volcanic and tropical forest soils. Soil Sci. Plant Nutr. 2007, 53, 430–440. [Google Scholar] [CrossRef]
  38. Wood, T.E.; Silver, W.L. Strong spatial variability in trace gas dynamics following experimental drought in a humid tropical forest. Glob. Biogeochem. Cycles 2012, 26, GB3005. [Google Scholar] [CrossRef]
  39. Xu, X.K.; Luo, X.B. Effect of wetting intensity on soil GHG fluxes and microbial biomass under a temperate forest floor during dry season. Geoderma 2012, 170, 118–126. [Google Scholar] [CrossRef]
  40. Fender, A.C.; Gansert, D.; Jungkunst, H.F.; Fiedler, S.; Beyer, F.; Schützenmeister, K.; Thiele, B.; Valtanen, K.; Polle, A.; Leuschner, C. Root-induced tree species effects on the source/sink strength for greenhouse gases (CH4, N2O and CO2) of a temperate deciduous forest soil. Soil Biol. Biochem. 2013, 57, 587–597. [Google Scholar] [CrossRef]
  41. van Straaten, O.; Veldkamp, E.; Kohler, M.; Anas, I. Spatial and temporal effects of drought on soil CO2 efflux in a cacao agroforestry system in Sulawesi, Indonesia. Biogeosciences 2010, 7, 1223–1235. [Google Scholar] [CrossRef]
  42. Suseela, V.; Dukes, J.S. The responses of soil and rhizosphere respiration to simulated climatic changes vary by season. Ecology 2013, 94, 403–413. [Google Scholar] [CrossRef]
  43. Bréchet, L.M.; Lopez-Sangil, L.; George, C.; Birkett, A.J.; Baxendale, C.; Trujillo, B.C.; Sayer, E.J. Distinct responses of soil respiration to experimental litter manipulation in temperate woodland and tropical forest. Ecol. Evol. 2018, 8, 3787–3796. [Google Scholar] [CrossRef]
  44. Davidson, E.A.; Ishida, F.Y.; Nepstad, D.C. Effects of an experimental drought on soil emissions of carbon dioxide, methane, nitrous oxide, and nitric oxide in a moist tropical forest. Glob. Chang. Biol. 2004, 10, 718–730. [Google Scholar] [CrossRef]
  45. Yu, S.Q.; Mo, Q.F.; Chen, Y.Q.; Li, Y.W.; Li, Y.X.; Zou, B.; Xia, H.P.; Jun, W.; Li, Z.A.; Wang, F.M. Effects of seasonal precipitation change on soil respiration processes in a seasonally dry tropical forest. Ecol. Evol. 2020, 10, 467–479. [Google Scholar] [CrossRef]
  46. Wood, T.E.; Detto, M.; Silver, W.L. Sensitivity of soil respiration to variability in soil moisture and temperature in a humid tropical forest. PLoS ONE 2013, 8, e80965. [Google Scholar] [CrossRef]
  47. Post, W.M.; Kwon, K.C. Soil carbon sequestration and land-use change: Processes and potential. Glob. Chang. Biol. 2000, 6, 317–327. [Google Scholar] [CrossRef]
  48. Rosenberg, M.S.; Adams, D.C.; Gurevitch, J. MetaWin: Statistical Software for Meta-Analysis, Version 2; Sinauer Associates: Sunderland, MA, USA, 1999. [Google Scholar]
  49. Liu, L.; Estiarte, M.; Peñuelas, J. Soil moisture as the key factor of atmospheric CH4 uptake in forest soils under environmental change. Geoderma 2019, 355, 113920. [Google Scholar] [CrossRef]
  50. Li, L.F.; Zheng, Z.Z.; Wang, W.J.; Biederman, J.A.; Xu, X.L.; Ran, Q.W.; Qian, R.Y.; Xu, C.; Zhang, B.; Wang, F.; et al. Terrestrial N2O emissions and related functional genes under climate changes: A global meta-analysis. Glob. Chang. Biol. 2020, 26, 931–943. [Google Scholar] [CrossRef]
  51. Nepstad, D.C.; Veríssimo, A.; Alencar, A.; Nobre, C.; Lima, E.; Lefebvre, P.; Schlesinger, P.; Potter, C.; Moutinho, P.; Mendoza, E.; et al. Large-scale impoverishment of Amazonian forests by logging and fire. Nature 1999, 398, 505–508. [Google Scholar] [CrossRef]
  52. Costa, M.H.; Foley, J.A. Combined effects of deforestation and doubled atmospheric CO2 concentrations on the climate of Amazonia. J. Clim. 2000, 13, 18–34. [Google Scholar] [CrossRef]
  53. Waring, B.G.; Hawkes, C.V. Short-term precipitation exclusion alters microbial responses to soil moisture in a wet tropical forest. Microb. Ecol. 2015, 69, 843–854. [Google Scholar] [CrossRef]
  54. Bhattacharyya, A.; Campbell, A.N.; Tfaily, M.M.; Lin, Y.; Kukkadapu, R.K.; Silver, W.L.; Nico, P.S.; Pett-Ridge, J. Redox fluctuations control the coupled cycling of iron and carbon in tropical forest soils. Environ. Sci. Technol. 2018, 52, 14129–14139. [Google Scholar] [CrossRef] [PubMed]
  55. Nepstad, D.C.; Decarvalho, C.R.; Davidson, E.A.; Jipp, P.H.; Lefebvre, P.A.; Negreiros, G.H.; Dasilva, E.D.; Stone, T.A.; Trumbore, S.E.; Vieira, S. The role of deep roots in the hydrological and carbon cycles of Amazonian forests and pastures. Nature 1994, 372, 666–669. [Google Scholar] [CrossRef]
  56. Schenk, H.J.; Jackson, R.B. The global biogeography of roots. Ecol. Monogr. 2002, 72, 311–328. [Google Scholar] [CrossRef]
  57. Hertel, D.; Moser, G.; Culmsee, H.; Erasmi, S.; Horna, V.; Schuldt, B.; Leuschner, C. Below- and above-ground biomass and net primary production in a paleotropical natural forest (Sulawesi, Indonesia) as compared to neotropical forests. For. Ecol. Manag. 2009, 258, 1904–1912. [Google Scholar] [CrossRef]
  58. Martins, C.S.C.; Nazaries, L.; Delgado-Baquerizo, M.; Macdonald, C.A.; Anderson, I.C.; Hobbie, S.E.; Venterea, R.T.; Reich, P.B.; Singh, B.K. Identifying environmental drivers of greenhouse gas emissions under warming and reduced rainfall in boreal-temperate forests. Funct. Ecol. 2017, 31, 2356–2368. [Google Scholar] [CrossRef]
  59. Post, W.M.; Emanuel, W.R.; Zinke, P.J.; Stangenberger, A.G. Soil carbon pools and world life zones. Nature 1982, 298, 156–159. [Google Scholar] [CrossRef]
  60. Thom, D.; Golivets, M.; Edling, L.; Meigs, G.W.; Gourevitvh, D.J.; Sonter, L.J.; Galford, G.L.; Keeton, W.S. The climate sensitivity of carbon, timber, and species richness covaries with forest age in boreal-temperate North America. Glob. Chang. Biol. 2019, 25, 2446–2458. [Google Scholar] [CrossRef]
  61. Stuenzi, S.; Boike, J.; Gädeke, A.; Herzschuh, U.; Kruse, S.; Pestryakova, L.A.; Westermann, S.; Langer, M. Sensitivity of ecosystem-protected permafrost under changing boreal forest structures. Environ. Res. Lett. 2021, 16, 084045. [Google Scholar] [CrossRef]
  62. Liu, L.; Wang, X.; Lajeunesse, M.J.; Miao, G.; Piao, S.; Wan, S.; Wu, Y.; Wang, Z.; Yang, S.; Li, P. A cross-biome synthesis of soil respiration and its determinants under simulated precipitation changes. Glob. Chang. Biol. 2016, 22, 1394–1405. [Google Scholar] [CrossRef]
  63. Darenova, E.; Čater, M. Different structure of sessile oak stands affects soil moisture and soil CO2 efflux. For. Sci. 2018, 64, 340–348. [Google Scholar]
  64. Amundson, R. The carbon budget in soils. Annu. Rev. Earth Planet. Sci. 2001, 29, 535–562. [Google Scholar] [CrossRef]
  65. Hayakawa, C.; Funakawa, S.; Fujii, K.; Kadono, A.; Kosaki, T. Effects of climatic and soil properties on cellulose decomposition rates in temperate and tropical forests. Biol. Fertil. Soils 2014, 50, 633–643. [Google Scholar] [CrossRef]
  66. Xu, X.K. Effect of freeze-thaw disturbance on soil C and N dynamics and GHG fluxes of East Asia forests: Review and future perspectives. Soil Sci. Plant Nutr. 2022, 68, 15–26. [Google Scholar] [CrossRef]
  67. Xu, X.K.; Duan, C.T.; Wu, H.H.; Li, T.S.; Cheng, W.G. Effect of intensity and duration of freezing on soil microbial biomass, extactable C and N pools, and N2O and CO2 emissions from forest soils in cold temperate region. Sci. China Earth Sci. 2016, 59, 156–169. [Google Scholar] [CrossRef]
  68. Wu, H.H.; Xu, X.K.; Cheng, W.G.; Han, L. Dissolved organic matter and inorganic N jointly regulate greenhouse gases fluxes from forest soils with different moistures during a freeze-thaw period. Soil Sci. Plant Nutr. 2020, 66, 163–176. [Google Scholar] [CrossRef]
  69. Wu, H.H.; Xu, X.K.; Fu, P.Q.; Cheng, W.G.; Fu, C.S. Responses of soil WEOM quantity and quality to freeze-thaw and litter manipulation with contrasting soil water content: A laboratory experiment. Catena 2021, 198, 105058. [Google Scholar] [CrossRef]
  70. Martínez-Vilalta, J.; Sala, A.; Asensio, D.; Galiano, L.; Hoch, G.; Palacio, S.; Piper, F.I.; Lloret, F. Dynamics of non-structural carbohydrates in terrestrial plants: A global synthesis. Ecol. Monogr. 2016, 86, 495–516. [Google Scholar] [CrossRef]
  71. Harteveld, M.; Hertel, D.; Wiens, M.; Leuschner, C. Spatial and temporal variability of fine root abundance and growth in tropical moist forests and agroforestry systems (Sulawesi, Indonesia). Ecotropica 2007, 13, 111–120. [Google Scholar]
  72. Jiang, H.; Deng, Q.; Zhou, G.; Hui, D.; Zhang, D.; Liu, S.; Chu, G.; Li, J. Responses of soil respiration and its temperature/moisture sensitivity to precipitation in three subtropical forests in southern China. Biogeosciences 2013, 10, 3963–3982. [Google Scholar] [CrossRef]
  73. Huang, S.D.; Ye, G.F.; Lin, J.; Chen, K.T.; Xu, X.; Ruan, H.H.; Tan, F.L.; Chen, H.Y.H. Autotrophic and heterotrophic soil respiration responds asymmetrically to drought in a subtropical forest in the Southeast China. Soil Biol. Biochem. 2018, 123, 242–249. [Google Scholar] [CrossRef]
  74. Zhang, J.L.; Liu, S.R.; Liu, C.J.; Wang, H.; Luan, J.W.; Liu, X.J.; Guo, X.W.; Niu, B.L. Different mechanisms underlying divergent responses of autotrophic and heterotrophic respiration to long-term throughfall reduction in a warm-temperate oak forest. For. Ecosyst. 2021, 8, 41. [Google Scholar] [CrossRef]
  75. Deng, Q.; Zhang, D.; Han, X.; Chu, G.; Zhang, Q.; Hui, D. Changing rainfall frequency rather than drought rapidly alters annual soil respiration in a tropical forest. Soil Biol. Biochem. 2018, 121, 8–15. [Google Scholar] [CrossRef]
  76. Kiikkilä, O.; Kitunen, V.; Spetz, P.; Smolander, A. Characterization of dissolved organic matter in decomposing Norway spruce and silver birch litter. Eur. J. Soil Sci. 2012, 63, 476–486. [Google Scholar] [CrossRef]
  77. Hensgens, G.; Lechtenfeld, O.J.; Guillemette, F.; Laudon, H.; Berggren, M. Impacts of litter decay on organic leachate composition and reactivity. Biogeochemistry 2020, 154, 99–117. [Google Scholar] [CrossRef]
  78. Xu, J.W.; Ji, J.H.; Hu, D.N.; Zheng, Z.; Mao, R. Tree fresh leaf- and twig-leached dissolved organic matter quantity and biodegradability in subtropical plantations in China. Forests 2022, 13, 833. [Google Scholar] [CrossRef]
  79. Wu, P.P.; Ding, Y.D.; Li, S.L.; Sun, X.X.; Zhang, Y.; Mao, R. Carbon, nitrogen and phosphorus stoichiometry controls interspecific patterns of leaf litter-derived dissolved organic matter biodegradation in subtropical plantations of China. iForest 2021, 14, 80–85. [Google Scholar] [CrossRef]
  80. Xu, X.K.; Yin, L.; Duan, C.T.; Jing, Y.S. Effect of N addition, moisture, and temperature on soil microbial respiration and microbial biomass in forest soil at different stages of litter decomposition. J. Soils Sediments 2016, 16, 1421–1439. [Google Scholar] [CrossRef]
  81. Oberhuber, W.; Gruber, A.; Lethaus, G.; Winkler, A.; Wieser, G. Stem gridling indicates prioritized carbon allocation to the root system at the expense of radial stem growth in Norway spruce under drought conditions. Environ. Exp. Bot. 2017, 138, 109–118. [Google Scholar] [CrossRef]
  82. Smith, M.G.; Miller, R.E.; Arndt, S.K.; Kasel, S.; Bennett, L.T. Whole-tree distribution and temporal variation of non-structural carbohydrates in broadleaf evergreen trees. Tree Physiol. 2018, 38, 570–581. [Google Scholar] [CrossRef]
  83. Peltier, D.M.P.; Ogle, K. Legacies of more frequent drought in ponderosa pine across the western United States. Glob. Chang. Biol. 2019, 25, 3803–3816. [Google Scholar] [CrossRef]
  84. Li, S.L.; Xu, J.W.; Ding, Y.D.; Mao, R. Litter water-holding and water-loss characteristics of trees and ferns in the water conservation forests at the middle reaches of the Gan River. J. Soil Water Conserv. 2021, 35, 170–176. [Google Scholar]
  85. Gartner, T.B.; Cardon, Z.G. Decomposition dynamics in mixed-species leaf litter. Oikos 2004, 104, 230–246. [Google Scholar] [CrossRef]
  86. Rousk, J.; Brookes, P.C.; Bääth, E. Investigating the mechanisms for the opposing pH relationships of fungal and bacterial growth in soil. Soil Biol. Biochem. 2010, 42, 926–934. [Google Scholar] [CrossRef]
  87. Smolander, A.; Kitunen, V. Comparison of tree species effects on microbial C and N transformations and dissolved organic matter properties in boreal forest floors. Appl. Soil Ecol. 2011, 49, 224–233. [Google Scholar] [CrossRef]
  88. Bouma, T.J.; Bryla, D.R. On the assessment of root and soil respiration for soils of different textures: Interactions with soil moisture contents and soil CO2 concentrations. Plant Soil 2000, 227, 215–221. [Google Scholar] [CrossRef]
  89. Dilustro, J.J.; Collins, B.; Duncan, L.; Crawford, C. Moisture and soil texture effects on soil CO2 efflux components in southeastern mixed pine forests. For. Ecol. Manag. 2005, 204, 85–95. [Google Scholar] [CrossRef]
  90. Wang, Y.; Liu, S.R.; Luan, J.W.; Chen, C.; Cai, C.J.; Zhou, F.; Di, Y.P.; Gao, X.M. Nitrogen addition exacerbates the negative effect of throughfall reduction on soil respiration in a Bamboo Forest. Forests 2021, 12, 724. [Google Scholar] [CrossRef]
  91. Lu, H.B.; Liu, S.R.; Wang, H.; Luan, J.W.; Schindlbacher, A.; Liu, Y.C.; Wang, Y. Experimental throughfall reduction barely affects soil carbon dynamics in a warm-temperate oak forest, central China. Sci. Rep. 2017, 7, 15099. [Google Scholar] [CrossRef]
  92. Abramoff, R.; Xu, X.F.; Hartman, M.; O’Brien, S.; Feng, W.T.; Davidson, E.; Finzi, A.C.; Moorhead, D.; Schimel, J.; Torn, M. The Millennial model: In search of measurable pools and transformations for modeling soil carbon in the new century. Biogeochemistry 2018, 137, 51–71. [Google Scholar] [CrossRef]
  93. Zhang, H.C.; Goll, D.S.; Wang, Y.P.; Ciais, P.; Wieder, W.R.; Abramoff, R.; Haung, Y.Y.; Guenet, B.; Preschner, A.K.; Rossel, R.A.V.; et al. Microbial dynamics and soil physicochemical properties explain large-scale variations in soil organic carbon. Glob. Chang. Biol. 2020, 26, 2668–2685. [Google Scholar] [CrossRef]
  94. Epron, D.; Bahn, M.; Derrien, D.; Lattanzi, F.A.; Pumpanen, J.; Gessler, A.; Högberg, P.; Maillard, P.; Dannoura, M.; Gérant, D.; et al. Pulse-labelling trees to study carbon allocation dynamics: A review of methods, current knowledge and future prospects. Tree Physiol. 2012, 32, 776–798. [Google Scholar] [CrossRef]
  95. McCarroll, D.; Whitney, M.; Young, G.H.F.; Loader, N.J.; Gagen, M.H. A simple stable carbon isotope method for investigating changes in the use of recent versus old carbon in oak. Tree Physiol. 2017, 37, 1021–1027. [Google Scholar] [CrossRef]
  96. Diao, H.Y.; Wang, A.Z.; Yuan, F.H.; Guan, D.X.; Dai, G.H.; Wu, J.B. Environmental effects on carbon isotope discrimination from assimilation to respiration in a coniferous and broadleaf-leaved mixed forest of Northeast China. Forests 2020, 11, 1156. [Google Scholar] [CrossRef]
  97. Wen, T.; Qu, Y.X.; Lu, K.L.; Guan, C.; Zhao, C.M. Combining tree-ring width and carbon isotope data to investigate stem carbon allocation in an evergreen coniferous species. Agric. For. Meteorol. 2022, 316, 108845. [Google Scholar] [CrossRef]
  98. Trumbore, S. Age of soil organic matter and soil respiration: Radiocarbon constraints on belowground C dynamics. Ecol. Appl. 2000, 10, 399–411. [Google Scholar] [CrossRef]
  99. Moyes, A.B.; Gaines, S.J.; Siegwolf, R.T.W.; Bowling, D.R. Diffusive fractionation complicates isotopic partitioning of autotrphic and heterotrophic sources of soil respiration. Plant Cell Environ. 2010, 33, 1804–1819. [Google Scholar] [CrossRef]
  100. Dařenová, E.; Crabbe, R.A.; Knott, R.; Uherková, B.; Kadavý, J. Effect of coppicing, thinning and throughfall reduction on soil water content and soil CO2 efflux in a sessile oak forest. Silva Fennica 2018, 52, 9927. [Google Scholar] [CrossRef]
  101. Muhr, J.; Borken, W. Delayed recovery of soil respiration after wetting of dry soil further reduced C losses from a Norway spruce forest soil. J. Geophys. Res. 2009, 114, G04023. [Google Scholar] [CrossRef]
  102. Borken, W.; Davidson, E.A.; Savage, K.; Sundquist, E.T.; Steudler, P. Effect of summer throughfall exclusion, summer drought, and winter snow cover on methane fluxes in a temperate forest soil. Soil Biol. Biochem. 2006, 38, 1388–1395. [Google Scholar] [CrossRef]
  103. Liu, Y.C.; Shang, Q.; Wang, L.; Tian, Y.; Ju, Y.X.; Gan, J.B. Responses of soil respiration to changing precipitation regimes in an oak forest at a climate transitional zone. Acta Ecol. Sin. 2016, 36, 8054–8061. [Google Scholar]
  104. Peng, X.H.; Xu, X.F.; Han, H.R.; Cheng, X.Q.; Cai, M.K.; Bai, Y.C. Effects of throughfall exclusion on soil respiration in Larix principis-rupprechtii plantation. Ecol. Environ. Sci. 2017, 26, 1310–1316. [Google Scholar]
  105. Vasconcelos, S.S.; Zarin, D.J.; Capanu, M.; Littell, R.; Davidson, E.A.; Ishida, F.Y.; Santos, E.B.; Araújo, M.M.; Aragão, D.V.; Rangel-Vasconcelos, L.G.T.; et al. Moisture and substrate availability constrain soil trace gas fluxes in an eastern Amazonian regrowth forest. Global Biogeochem. Cycle 2004, 18, GB2009. [Google Scholar] [CrossRef]
  106. Bréchet, L.; Courtois, E.A.; Saint-Germain, T.; Janssens, I.A.; Asensio, D.; Ramirez-Rojas, I.; Soong, J.L.; Langenhove, L.V.; Verbruggen, E.; Stahl, C. Disentangling drought and nutrient effects on soil carbon dioxide and methane fluxes in a tropical forest. Front. Environ. Sci. 2019, 7, 180. [Google Scholar] [CrossRef]
  107. Xu, J. Response of Soil Carbon Processes to Throughfall Exclusion in Two Subtropical Plantations in Southern China. Ph.D. Thesis, Chinese Academy of Forestry, Beijing, China, 2014. [Google Scholar]
  108. Liu, W.; Wang, L.H.; Fu, R.; Zhou, S.X.; Liu, L.; Wu, X.H.; Huang, C.D. Effects of precipitation increase on soil respiration of a Pinus yunnanensis plantation in a dry river valley area. Acta Ecol. Sin. 2017, 37, 1391–1400. [Google Scholar]
  109. Li, S.J. Effects of Precipitation Exclusion on Soil Microbial Community Structure and Greenhouse Gas Fluxes in a Natural Castanopsis carlesii Forest. Master’s Thesis, Fujian Normal University, Fuzhou, China, 2018. [Google Scholar]
  110. Ju, H. The Characteristic of Soil Activated Carbon and Nitrogen and Greenhouse Gas Fluxes of the Different Types of Forests in Shennongjia. Ph.D. Thesis, Inner Mongolia Agricultural University, Hohhot, China, 2016. [Google Scholar]
Figure 1. Box normal plots of the lnRCO2 values of TF reduction and TF addition treatments across all experimental categories. Boxes and horizontal lines and circles within boxes represent interquartile ranges, as well as median and mean values, respectively. Differences in the means of the lnRCO2 values between TF reduction and TF addition were assessed by t-test statistics. ***, p < 0.001. At the a = 0.05 level, the data on TF reduction and TF addition were significant when drawn from a normally distributed population, respectively.
Forests 14 01037 g001
Figure 2. Effect sizes of TF reduction (a) and TF addition (b) treatments on the annual CO2 emissions from forest soils (lnRCO2) among the experimental categories. The number of paired observations is shown in parenthesis, and the results of ANOVA are provided in Table 2. Different letters next to red lines indicate statistical differences among the experimental categories at the a = 0.05 level. Error bars represent 95% confidence intervals (CI) of the lnRCO2 values based on normal distribution, and the effect was considered significant if the 95% CI of the effect size did not exceed zero. TFsize represents the size of throughfall manipulation in area, and sizes 1–3 are explained in Table 1. Soil texture categories are documented in Table 1.
Forests 14 01037 g002
Figure 3. Frequency distribution of effect sizes on the annual soil CO2 emission (lnRCO2) (a) and the relationship between the lnRCO2 values and the changes in throughfall (b) for the whole dataset. The linear regression of the lnRCO2 values against the changes in throughfall for the whole dataset is shown in (b). Dashed lines represent upper and lower 95% confidence intervals, respectively. Linear regression equations of the lnRCO2 values against the changes in throughfall for coarse, fine, medium-textured soils, and all soils are respectively shown in (b).
Forests 14 01037 g003
Figure 4. Box plots of sizes of effects on soil moisture (lnRmoisture) by forest type (a), soil texture (b), climate type (c), and TFsize (d) categories. The number of paired observations in brackets is shown according to relevant information from some studies. In (b), different small letters close to boxes represent statistical differences of the lnRmoisture values upon TF reduction among the soil texture categories. In (a,b), different capital letters close to boxes represent statistical differences in the lnRmoisture values upon TF addition among the forest type and soil texture categories, respectively. Boxes and vertical lines and circles within boxes represent interquartile ranges (IQRs), as well as median and mean values, respectively. Right and left whiskers represent 75 percentiles plus 1.5 IQR and 25 percentiles minus 1.5 IQR, respectively.
Forests 14 01037 g004
Figure 5. Relationships of the effect sizes on the soil CO2 emissions (lnRCO2) against the sizes of effects on soil moisture (lnRmoisture) (a), soil microbial biomass C (lnRmbc) (b), and fine root biomass (lnRroots) (c) across the whole available dataset. Shaded area represents the upper and lower 95% confidence intervals, respectively.
Forests 14 01037 g005
Figure 6. Structural equation modeling analysis explaining the direct and indirect effects of annual rainfall, annual mean air temperature (Annual temp), the ratio of soil total organic C to total N (SOCtoTN), and soil bulk density on the lnRCO2 values under the experimental altered throughfall conditions (a), and their standardized total effects on the lnRCO2 values (b). Single-headed arrows show the hypothesized direction of causation. Dashed and solid arrows show negative and positive relationships, respectively. The width of arrows is in proportion to the intensity of the relationship. The numbers close to the arrows are the standardized path coefficients, and the R2 values show the proportions of variations interpreted by relationships with other variables. χ2 stands for Chi-square, CFI for comparative fit index, and RMSEA for root-mean-square error of approximation. df and p represent degrees of freedom and probability level, respectively. Significant differences are indicated as *, p ≤ 0.05; **, p ≤ 0.01; and ***, p ≤ 0.001.
Forests 14 01037 g006
Figure 7. Structural equation modeling analysis of causal relationships among the percentage changes in throughfall (ΔTP), lnRCO2, lnRmoisture, lnRroots, lnRmbc, and lnRDOC (a), and their standardized total effects on the lnRCO2 values (b). Single-headed arrows show the hypothesized direction of causation. Dashed and solid arrows show negative and positive relationships, respectively. The width of arrows is in proportion to the intensity of the relationship. The numbers close to the arrows are the standardized path coefficients, and R2 values show the proportion of variations interpreted by relationships with other variables. χ2 stands for Chi-square, CFI for comparative fit index, and RMSEA for root-mean-square error of approximation. df and p represent degrees of freedom and probability level, respectively. Significant differences are indicated as *, p ≤ 0.05; ***, p ≤ 0.001.
Forests 14 01037 g007
Figure 8. Conceptual model illustrating the potential effects of changes in throughfall on the soil CO2 emission and future studies upon altered precipitation for understanding the lnRCO2. Data in parenthesis represent the average percentage change of the altered throughfall treatments for each of the variables selected. Dotted and solid arrows show negative and positive effects, respectively. *, significant at the a = 0.05 level because the 95% CI of the effect size did not exceed zero.
Forests 14 01037 g008
Table 1. Amount of data analyzed when evaluating the lnRCO2 values under different experimental conditions and the statistical analysis methods.
Experimental CategoriesSpecific Conditions (Number of Paired Observation Data Points) aMethods of Statistical Analysis
Climate conditionsClimate types (103): Boreal (6), Mediterranean (11), Temperate (36), Tropical (20), and Subtropical (30)Analysis of variance (ANOVA)
Annual rainfall (103): 493 to 3528 mmStructural equation modeling (SEM)
Annual mean air temperature (103): −3.5 to 28.0 °CSEM
Forest typesConiferous (13), Broadleaf (62), and Mixed forest (28)ANOVA
Soil propertiesTexture (103) b: Fine (19), Medium (36), and Coarse (48)ANOVA
pH (103): 3.2 to 7.5SEM
SOC (103): 1.4 to 83.0 g C kg−1SEM
TN (103): 0.1 to 11.3 g N kg−1SEM
Ratio of SOC to TN (103): 5.8 to 44.7SEM
Bulk density (103): 0.5 to 1.6 g cm−3SEM
TFsize cSizes (103): Size 1 (≤5 m × 5 m) (60), Size 2 (>5 m × 5 m and <20 m × 20 m) (18), and Size 3 (≥20 m × 20 m) (25)ANOVA
a The amount of data differed across conditions according to data availability within the literature. b Fine (silt clay and clay), Medium (silt clay loam, clay loam, silt loam, and loam), and Coarse (sandy loam, sandy clay loam, loamy sand, and sand). c TFsize, the size of throughfall manipulation in area across the different experiments.
Table 2. Results of ANOVA on the effects of the experimental categories on the lnRCO2 values for the whole dataset.
Experimental CategoriesEffectslnRCO2 Upon TF ReductionlnRCO2 Upon TF Addition
F Valuesp ValuesF Valuesp Values
Climate conditionsClimate types1.4390.23010.2610.000
Annual rainfallNA a NA
Annual mean air temperatureNA NA
Forest typesForest types7.9550.0011.8190.188
Soil propertiesTexture13.6160.0000.6070.444
pHNA NA
SOCNA NA
TNNA NA
Ratio of SOC to TNNA NA
Bulk densityNA NA
TFsizeSizes0.7750.4640.0310.970
a Not applicable as structural equation modeling analyses were conducted.
Disclaimer/Publisher’s Note: The statements, opinions and data contained in all publications are solely those of the individual author(s) and contributor(s) and not of MDPI and/or the editor(s). MDPI and/or the editor(s) disclaim responsibility for any injury to people or property resulting from any ideas, methods, instructions or products referred to in the content.

