Article

Correlation between Changes in Soil Properties and Microbial Diversity Driven by Different Management in Artificial Chinese Fir (Cunninghamia lanceolata (Lamb.) Hook.) Plantations

1
College of Forestry, Fujian Agriculture and Forestry University, Fuzhou 350002, China
2
State Forestry and Grassland Administration Engineering Research Center of Chinese Fir, Fuzhou 350002, China
3
Key Laboratory for Forest Adversity Physiological Ecology and Molecular Biology, Fuzhou 350002, China
4
College of Computer and Information Science, Fujian Agriculture and Forestry University, Fuzhou 350002, China
*
Author to whom correspondence should be addressed.
These authors contributed equally to this work.
Forests 2023, 14(5), 877; https://doi.org/10.3390/f14050877
Submission received: 6 February 2023 / Revised: 3 April 2023 / Accepted: 5 April 2023 / Published: 25 April 2023
(This article belongs to the Section Forest Ecology and Management)

Abstract

:
Successive planting is the main pattern for cultivating Chinese fir (Cunninghamia. lanceolata (Lamb.) Hook.). However, the influence of this management has not been totally investigated, especially with respect to the changes in the soil microbial community and the relationship to soil properties. This study investigated the physical and chemical properties of the soil, its enzyme activities, and its microbial diversity in three adjoining plantations managed with different successive planting models (long-term continuous growth without harvest, M1; single harvest cutting followed by the construction of a pure plantation, M2; and double harvest cutting followed by the construction of a mixed plantation, M3) to evaluate the impact of these forest management practices. In most soil layers, M1 was observed to have significantly higher content of Na and Al ions, as well as more polyphenol oxidase (PPO) activity, and M2 had a significantly higher field moisture capacity (FMC) and content of Mg ions, while M3 had significantly higher urease (URE) activity. Changes in the totals of N (TN) and C (TC), alongside the availability of P (AP), C/P, N/P, URE, sucrose (SUC), and PPO values, correlated significantly with bacterial diversity, whereas the dynamics of total K (TK), Na, C/P, N/P, and PPO levels were significantly related to fungal diversity. Among the models, soil bacterial genera, including Burkholderia–Caballeronia–Paraburkholderia, Acidothermus, and Paenibacillus, were mostly affected by TN, TC, AP, organic matter (OM), C/N, C/P, N/P, SUC, and the performance of URE. The distribution of fungal genera in different models showed significant differences. Talaromyces, Trichoderma, and Aspergillus were relatively abundant in M1, while Umbelopsis and Saitozyma exhibited more adaptation in M3. These results illustrated better soil properties and higher abundance of microbial diversity in M1 and M3, and furthermore, demonstrated the strategic benefit of both prolonging the rotation period and of creating mixed artificial plantations to maintain diversity. This study improves the understanding of the impact of a successive planting strategy in C. lanceolata plantation sustainability.

1. Introduction

Forest resources have been used throughout the history of human development [1,2]. When the output of natural forests was unable to satisfy the requirements of social development, they were rapidly transformed into artificial plantations [3]. In a sense, artificial plantations origininated to fulfill human needs.
Chinese fir (Cunninghamia lanceolata (Lamb.) Hook.) is an important, fast-growing timber species in southern China [4,5] and has been cultivated for thousands of years. Long-term plantations acquired a fixed pattern: A monoculture forest, multi-generation successive plantings on the same site, and intensive management. Highly efficient timber production is supported by this pattern [6], which allows the plantations to play an essential role in social and economic development [7]. C. lanceolata has the largest proportion of the timber supply market in China, accounting for over 25% [8].
However, the negative impacts of this successive pattern are also obvious. The ecosystem formed by successive generations of C. lanceolata leads to excessive consumption of soil nutritive elements [9]. After a certain length of time, the seedlings will not receive enough nutrients owing to soil impoverishment [10]. C. lanceolata has also been proved to secrete autotoxic secondary metabolites from its roots [11]. Successive planting leads to these substances accumulating continuously in the soil [12], inhibiting the growth of soil microorganisms. Dead leaves will cling to branches for years, or even decades, rather than fall. This prevents the return of nutrients to the soil as the leaves do not decay and decompose rapidly. Additionally, the simple ecosystem structure and low level of diversity resulting from pure afforestation leads to a decline in self-regulation [13,14,15]. The high frequency of human interference, and especially successive plantings, negatively influences the soil properties of C. lanceolata plantation ecosystems to a considerable extent.
Researchers have now realized the disadvantages of this traditional pattern, as well as the negative effect on a sustainable economy, and many improvements and adjustments have been proposed. These include different combinations of manual fertilization to restore plantation soil nutrients [16,17]; thinning to improve the environment of the forest ecosystem [18]; mixing with other species that are prone to defoliation or have different nutrient-absorbing preferences to compensate for the deficiencies in soil nutrient cycling [19,20]; and prolonging the utilization cycle to form a natural-like plantation ecosystem through its ability to self-regulate [21]. These various management types have different principles and objectives. Methods that focus on the artificial replenishment of soil nutrients and the expansion of forest space are more in line with the economic needs of short-cycle planting for rapid timber production. However, building a mixed forest or natural-like plantation can enrich the biodiversity of plantations, which is more suitable for large-scale timber cultivation. Therefore, these improved management strategies are effective in correcting the defects of the traditional successive pattern [16,19].
However, more attention has also been paid to the changes in the soil microbial community structure. Microbes rely on the environment provided by the soil and plants and the effects of various functional activities [22,23]. A healthful forest environment usually means rich microbial diversity in the soil. In contrast, environmental conditions non-conducive to the growth of trees are often reflected in the decline of the microbial community [24]. Wu et al. [25] reported that successive rotations caused a degenerated soil microbial community structure and catabolic activity in C. lanceolata plantations, and this highlighted the disharmonious relationship occurring in patterns of high levels of artificial interference. Soil in the forest is the basic element for the ecosystem [26,27]. It combines multiple ecologic functions and provides the survival substrate for biological communities [28]. Changes in soil nutrients, such as NH4+-N, NO3-N, available phosphorus, and dissolved organic carbon [29,30] caused by successive planting are considered to be appropriate regulators for degenerated C. lanceolata plantations. However, most of this research has focused on soil nutrients and is insufficient for a deep understanding of the correlation between soil properties and microbial diversity.
In this study, three adjacent C. lanceolata artificial plantation sites with different managements were selected to evaluate the influence of forest management history on soil nutrient concentrations and the soil microbial community structure. The results of this study may provide a reference for more appropriate management of C. lanceolata plantations.

2. Methods and Materials

2.1. Overview of the Survey Area

This study was conducted on a C. lanceolata plantation site belonging to Laizhou Experimental Center of Yangkou State Forest Farm, Yanping District, Nanping City, Fujian Province, China (118°11′–118°17′ E, 26°40′–26°65′ N, Supplementary Figure S1) with three management models. The Experimental Center is located in the hilly gap between the Wuyi and Daiyun Mountains, where the altitude ranges from 445 to 850 m, and the slope ranges from 25° to 35°. The study site belongs to the mountainous region of southern China. The soil in this region is red, developed from shale, and has a pH value ranging from 4.0 to 5.0 Furthermore, the soil layer of the study site was deep and fertile. The climate of this region is subtropical monsoon with abundant rainfall (the annual mean relative humidity is 79% and the annual mean precipitation is 1663.9 mm) and sufficient light (annual mean sunshine duration is 3423.2 h, annual mean temperature is about 24.6 °C to 28.9 °C).
The whole plantation site was planted with hardwoods before 1960. In March 1961 this site was re-established as a monoculture artificial plantation of C. lanceolata at an initial density of 3000 individuals/ha. Subsequently, the completed site was subdivided into three different models of forest management. The first model (M1), which covers 7.81 ha, was managed relatively conservatively and has not been harvested since it was planted in 1961. The current density of this 60-year-old stand, however, has decreased to 1100 individuals/ha because of long-term illegal logging. The second model (M2) is adjacent to M1 and has an area of 15.15 ha. In 1980, wood from this model was harvested, and the C. lanceolata was replanted in 1981. The initial density of M2 was similar to that of M1 and was also affected by illegal logging. The density of M2 was currently only about 1200 individuals/ha. The third model (M3), which is adjacent to M2, covers 6.43 ha. Before 2000 it experienced the same management measures as M2. In March 2001, a mixed forest of C. lanceolata and Masson pine (Pinus massoniana Lamb.) was planted at a ratio of 6:4, respectively, to replace the C. lanceolata that was planted in 1981 and harvested in 2000. The mixed forest in M3 had an initial density of 2500 individuals/ha, with thinning at an intensity of 30% in 2015. However, it was actually based on a case study of pseudo-duplicated samples, considering that there was no real duplication in different sampling sites and the single sampling time.

2.2. Sample Plot Setting and Forest Stand Growth Survey

Three 20 × 20 m sample plots were set in each of the three models of forest management in September 2020, a total of nine plots. The growth indexes included tree height, diameter at breast height (DBH), clear bole height, and crown diameter, and these were examined for each individual in each sampling plots (Supplementary Table S1).

2.3. Soil Sample Collection

Three vertical soil profiles were set in different slope positions on each sample plot. Soil samples were collected from four layers (0–10 cm, 10–20 cm, 20–30 cm, and 30–40 cm) in each vertical profile. The study used 100 cm3 cutting rings for the determination of physical properties, while samples used for the detection of chemical properties and soil enzyme activities were stored in sealed bags, and then stored at −20 °C. To investigate the soil microbial community, soil samples from different depths of each plot were mixed at equal mass to represent the plot’s microbial profile. Then these soil samples from nine plots (three duplications per model) were stored at −80 °C.

2.4. Investigation of Physical and Chemical Properties and the Enzyme Activities of Soil Samples

The physical properties of the soil, including soil saturation capacity (SSC), field moisture capacity (FMC), capillary moisture capacity (CMC), capillary porosity (CP), non-capillary porosity (NCP), soil total porosity (STP), soil aeration (SA), and soil bulk density (SBD) were examined following Pan’s report [31].
To analyze the chemical properties, the samples were air-dried; inclusions were removed, and the soil was ground before being filtered through a 0.149 mm sieve. The filtered soil was divided into 0.1 g samples and digested following the perchloric acid method [32]. The full-metal ion content was identified with the Inductively Coupled Plasma-Atomic Emission Spectrometer (ICP-AES, PE optima 8000, Waltham, MA, USA). The carbon dioxide-free water method was used to measure pH values. The total P (TP) content was detected using the sodium hydroxide extraction and molybdenum–antimony anti-colorimetric method. Available P (AP) contents were detected using the ammonium fluoride and hydrochloric acid extraction and the molybdenum–antimony anti-colorimetric methods [33]. Available K (AK) contents were detected using ammonium acetate extraction, and the atomic absorption spectrophotometer analysis method. The total C (TC) and N (TN) contents were detected with the Automatic Carbon & Nitrogen Analyzer (Elemental Analyzer Vario ELIII, Hanau, Germany).
The activities of polyphenol oxidase (PPO), acid phosphatase (ACP), catalase (CAT), urease (URE), and sucrose (SUC) were assessed by the relevant soil activity kits (Comin Biotechnology Co., Ltd., Suzhou, China).
For the replicate sampling of small units caused by the particularity of the sampling site, the physical and chemical properties of the soil and its enzyme activities were analyzed by the Mann--Whitney test, using SPSS v22.0.0.0 software. The pairwise comparison of a single parameter on three different models in the same soil layer was calculated to investigate whether there was a significant difference (p < 0.05).

2.5. Soil Microbial Community Diversity Analysis

The ITS sequence and 16S rDNA created by the high-throughput sequencing method were used to examine microbial characteristics. Total soil DNA was extracted using HiPure Soil DNA Kits (Magen, Guangzhou, China) according to the manufacturer’s protocols, followed by an examination using agarose gel electrophoresis. The qualified DNA was diluted to 5 ng × μL−1 and immediately transmitted to GENE DENOVO Biotechnology Co., Ltd. (Guangzhou, China) under carbon dioxide ice freezing for sequencing. The process of amplification, library construction, and sequencing follows.
The ITS2 regions and 16S rDNA were amplified with specific primers containing a barcode. The PCR amplification procedure was initial denaturation at 95 °C for 2 min, denaturation at 98 °C for 10 s, annealing at 62 °C for 30 s, and extension at 68 °C for 30 s. The above steps were carried out for 27 cycles, immediately followed by final extension at 68 °C for 10 min. The amplified products were purified and recovered by electrophoresis on 2% agarose gel. The purified products from each plot were then pooled in equimolar and paired-end sequenced on an Illumina HiSeq 2500 platform (Illumina, San Diego, CA, USA).
To get high-quality clean reads, raw reads were further filtered according to the following rules, using FASTP v.0.18.0 software [34]:
(1)
Removing reads containing more than 10% of unknown uncleotides (N);
(2)
Removing reads containing less than 50% of bases with quality (Q-value) >20.
Parid-end clean reads were merged as raw tags using FLASH v.1.2.11 [35] with a minimum overlap of 10 bp and mismatch error rates of 2%. Noisy sequences of raw tags were filtered under specific conditions [36] to obtain high-quality clean tags. The filtering conditions are as follows:
(1)
Break raw tags from the first low-quality base site where the number of bases in the continuous low-quality value (the default quality threshold is ≤3) reaches the set length (the default length is 3 bp);
(2)
Then, filter tags whose continuous high-quality base length is less than 75% of the tag length.
The clean tags were clustered into operational taxonomic units (OTUs) of ≥97% similarity using UPARSE v9.2.64 [37] pipeline. All chimeric tags sequences were removed using the UCHIME algorithm [38] and effective tags were finally obtained for further analysis. The tag sequence with highest abundance was selected as the representative sequence within each cluster.

2.6. Taxonomy Annotation and Community Composition, Diversity, Function and Environmental Factor Analysis

The representative OTU sequences were classified into organisms by a native Bayesian model using an RDP classifier v2.2 based on the SILVA database v138.1 [39] or ITS2 database version update_2015 [40], with the confidence threshold of 0.8.
The abundance statistics of each taxonomy was visualized using Krona v2.6 [41]. Between groups, Venn analysis was performed in an R project VennDiagram package v1.6.16 to identify unique and common genera. Species comparison between/among groups was calculated in an R project Vegan package v2.5.3 [42]. Biomarker features in each group were screened by LEfSe software v1.0 [43]. A ternary plot of species abundance was plotted using R ggtern package v3.1.0.
In alpha diversity analysis, Chao1, Ace, Shannon, Simpson, Good’s coverage, and Pielou’s evenness index were calculated in QIIME v1.9.1 [44] based on the OUT sequences. The PD-whole tree index was calculated in the Picante v1.8.2. OTU rarefaction curve, and rank abundance curves were plotted in the R project ggplot2 package v2.2.1. In the beta diversity analysis, sequence alignment was performed using Muscle v3.8.31 and a phylogenetic tree was constructed using FastTree v2.1, and then weighted and unweighted unifrac distance matrices were generated by the GuniFrac package v1.0 in R project [45]. The Jaccard and Bray--Curtis distance matrix was calculated in R project Vegan package v2.5.3. Principal component analysis (PCA), multivariate statistical techniques, and statistical analysis of Welch’s t-test, the Wilcoxon rank test, Tukey’s HSD test, the Kruskal-Wallis H test, and the Adonis and Anosim test were also generated in this package.
The KEGG pathway analysis of the OTUs was inferred using Tax4Fun v1.0 [46]. Microbiome phenotypes of bacteria were classified using BugBase. The Functional Annotation of Prokaryotic Taxa (FAPROTAX) database and associated software v1.0 were used for generating the ecological functional profiles of bacteria [47]. The Functional group (guild) of Fungi was inferred using FUNGuild v1.0.
Canonical correspondence analysis (CCA), variation partition analysis (VPA), the mantel test, and the envfit test were executed in the R project Vegan package v2.5.3 to clarify the influence of environmental factors on community composition. The Pearson correlation coefficient between environmental factors and species was calculated in R project Psych package v1.8.4.

3. Results

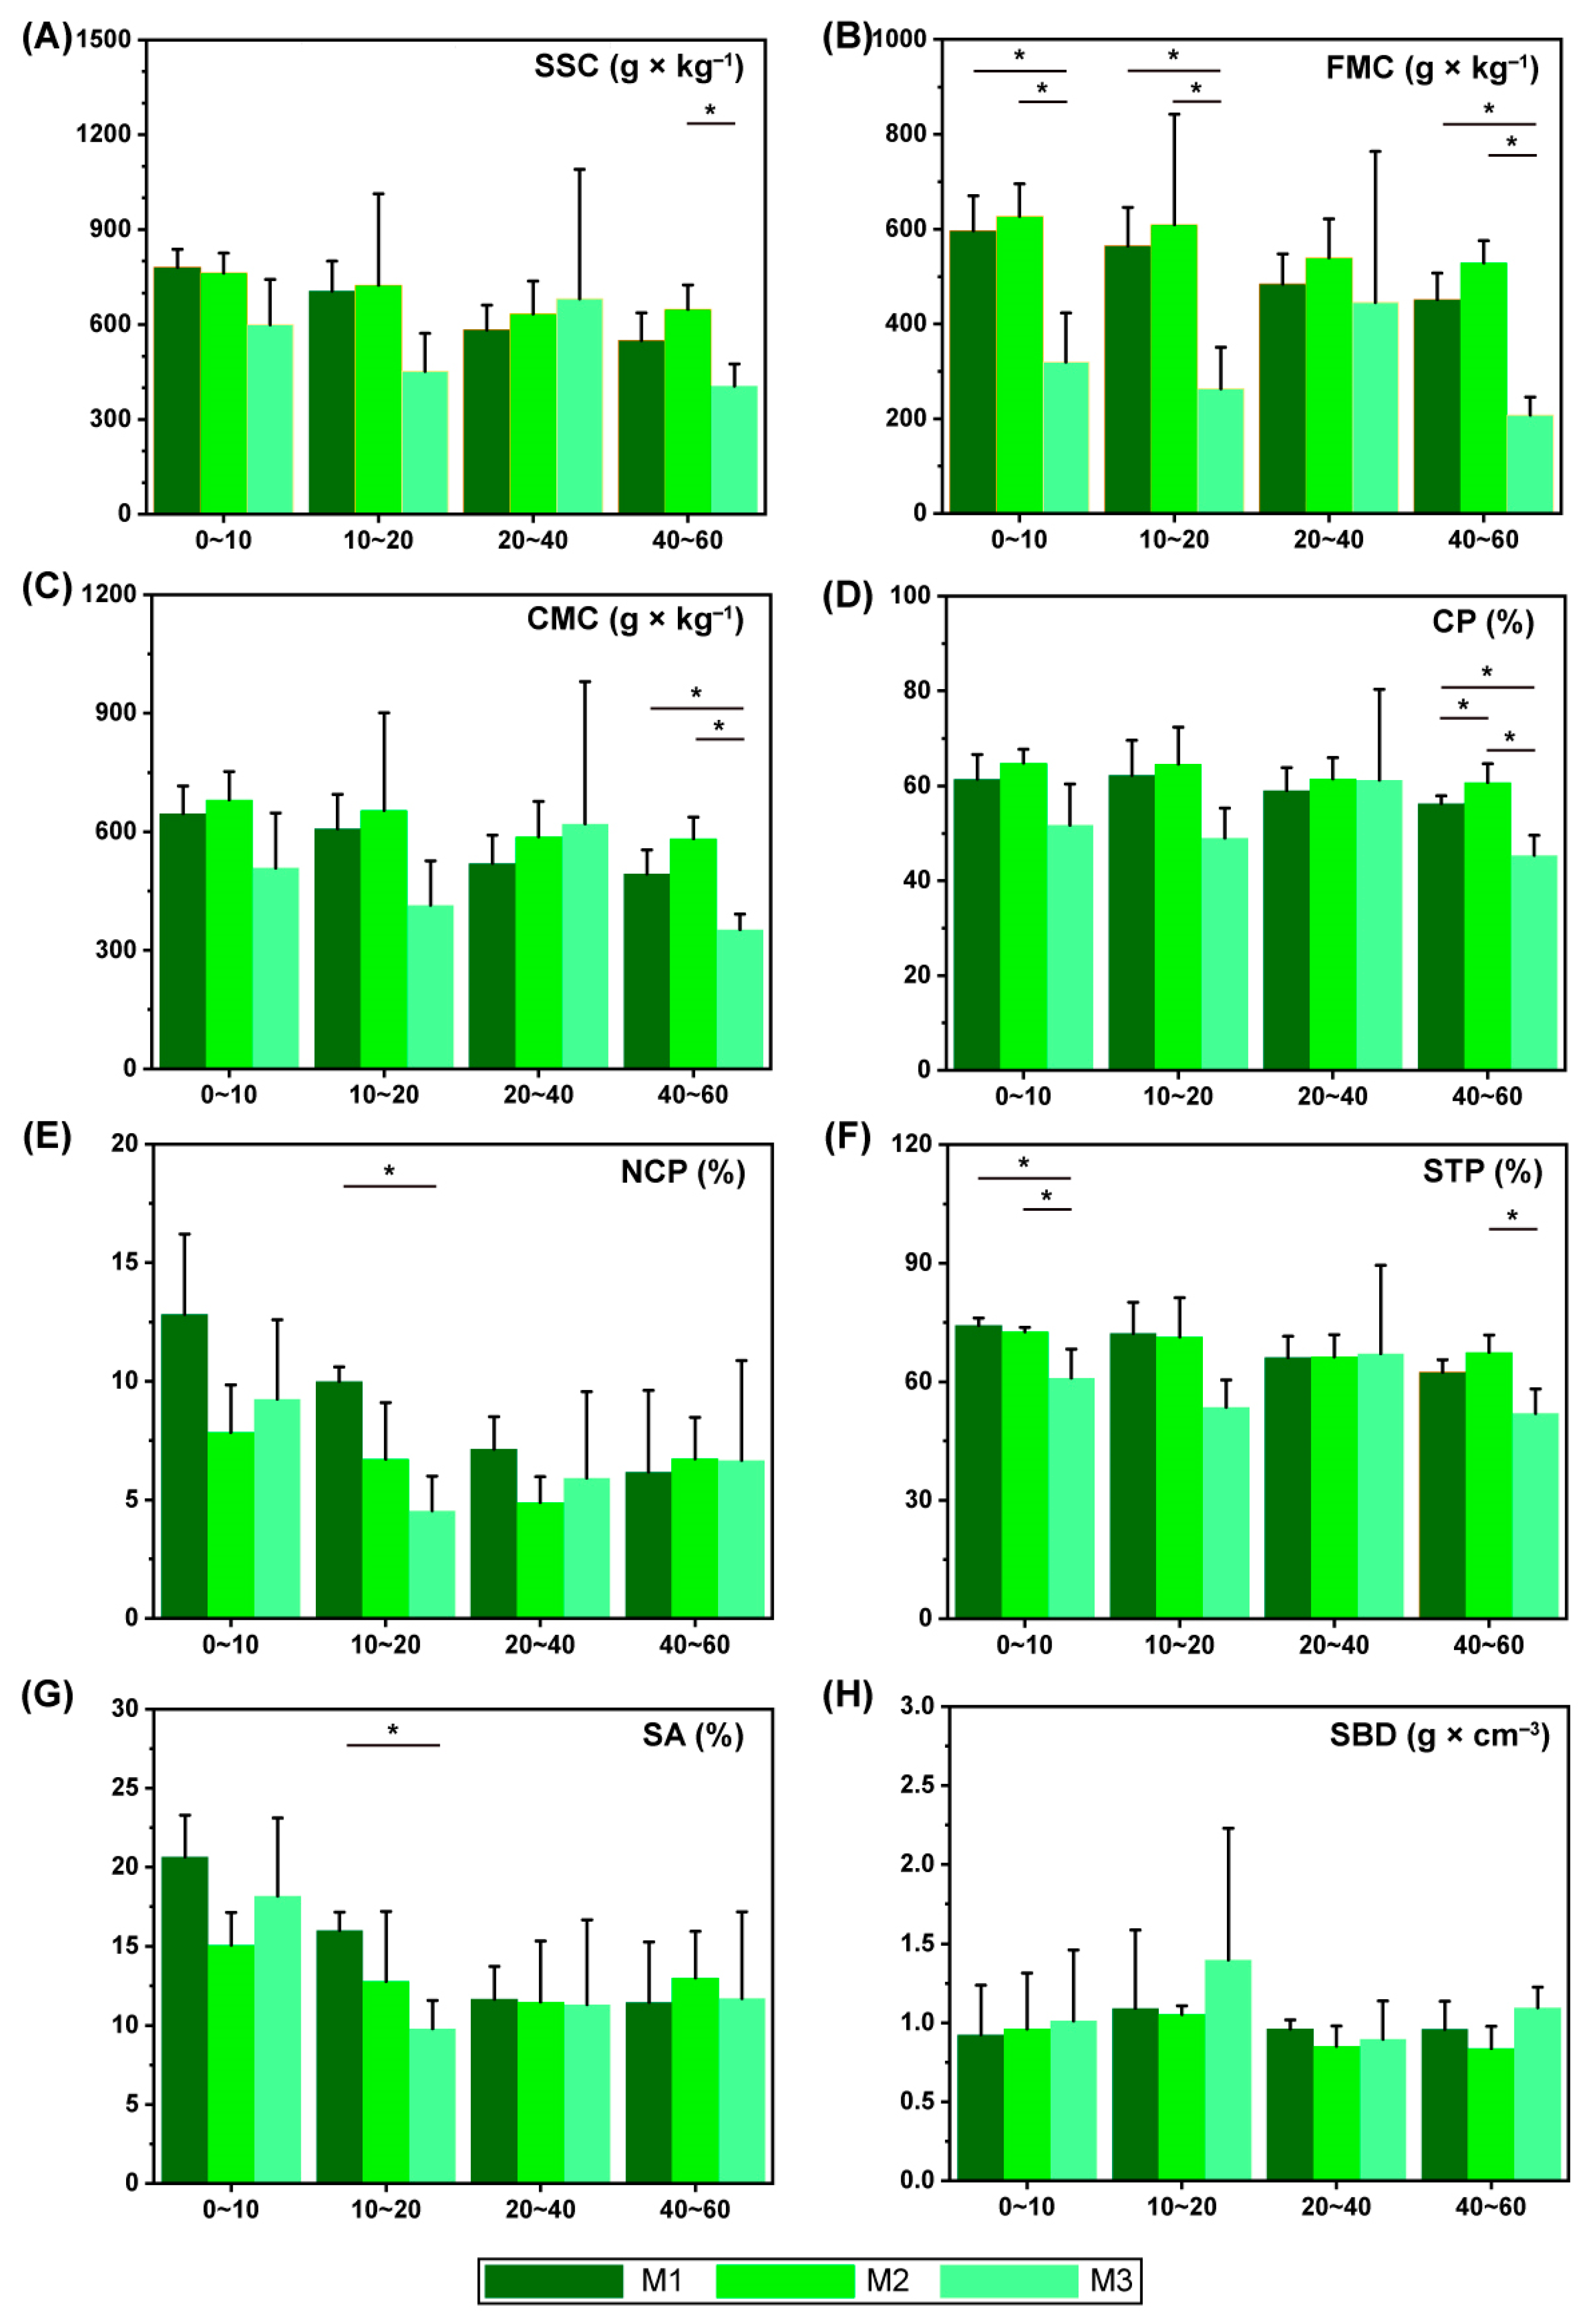
3.1. Effect of Different Models on Soil Physical Status Changes

To measure the change in the soil-water-holding capacity caused by different models, SSC, FMC, and CMC values were analyzed (Figure 1A–C). In general, the soil-water- holding capacities of M2 were greater than those of the other two models in all layers. The results revealed many significant superiorities (p < 0.05), including SSC in the 40–60 cm layer (M2 = 648.22 ± 77.36 g × kg−1), compared with M3 (405.66 ± 69.27 g × kg−1); FMC in 0–10 (M2 = 626.79 ± 68.37 g × kg−1), 10–20 (M2 = 6.9.11 ± 233.42 g × kg−1), and 40–60 cm (M2 = 528.82 ± 46.49 g × kg−1) layers compared with M1 (596.79 ± 73.15 g × kg−1 in 0–10 cm layer, 564.49 ± 81.64 g × kg−1 in 10–20 cm layer, and 451.77 ± 55.02 g × kg−1 in 40–60 cm layer), and M3 (319.23 ± 103.90 g × kg−1 in 0–10 cm layer, 263.04 ± 87.80 g × kg−1 in 10–20 cm layer, and 207.78 ± 37.90 g × kg−1 in 40–60 cm layer); and CMC in the 40–60 cm layer (M2 = 582.50 ± 54.85 g × kg−1) compared with M1 (493.45 ± 60.91 g × kg−1) and M3 (352.53 ± 39.40 g × kg−1).
Among the three models, CP values in the 40–60 cm layer were found to be significantly (p < 0.05) differently expressed, with M2 showing the highest level (60.70% ± 3.96%) and M3 performing at the lowest level (45.36% ± 4.23%, Figure 1D). The NCP of M1 in 10–20 cm (12.82% ± 3.39%) was significantly higher (p < 0.05) than in M3 (9.25% ± 3.34%, Figure 1E). The STP level of M3 (60.95% ± 7.33%) was also found to be significantly lower (p < 0.05) than that of M1 (74.25% ± 1.86%) and M2 (72.65% ± 1.15%) in the 0–10 cm layer, and lower than M2 in the 40–60 cm layer (Figure 1F). The results of SA measurement (Figure 1G) showed a similar trend in variation (in the 10–20 cm layer, M1 = 16.01% ± 1.15% and M3 = 9.79% ± 1.80%) to NCP. There was no significant difference in SBD among the samples of different models.

3.2. Effect of Different Models on Soil Nutrient Content Changes

Examination of differences in soil pH showed that the pH values of M1 were relatively higher, especially in the 10–20 cm layer. This approached a significant level (M1 = 4.37 ± 0.05, M2 = 4.19 ± 0.06, and M3 = 4.15 ± 0.08). In the 20–40 cm layer, the pH of M2 (4.34 ± 0.07) was close to that of M1 (4.32 ± 0.03), and the values of both models were significantly higher (p < 0.05) than that of M3 (4.11 ± 0.12, Figure 2A).
The Al, Na, and Mg ion contents varied considerably among the different models. In the layer below 10 cm, the greatest Al content was detected in M1 (68.32 ± 1.44 g × kg−1), followed by M3 (61.67 ± 12.35 g × kg−1), and both of these increased with depth. In contrast, change in M2 showed an opposite trend (Figure 2B). The difference in Na ion contents among the models was very clear. It showed an upward, downward, and fluctuating trend with soil depth in M1, M2, and M3, respectively. Most samples exhibited significant differences (p < 0.05) within groups (Figure 2C). Generally, M1 had a higher content of Mg ions in the shallow soil layers, while M2 showed significantly higher content in the deep layers (Figure 2D). The levels of Fe (Figure 2E) and Ca (Figure 2F) ions were not observed to be significantly different.
After changes were made in the experimental models, differences in soil TN, TC, and OM contents were not obvious. However, they all decreased with depth (Figure 3A–C). The only significant difference found (p < 0.05) appeared in TN in the 0–10 cm layer between M1 (3.57 ± 0.28 g × kg−1) and M3 (2.39 ± 0.60 g × kg−1). A similar situation occurred when the AK, AP, TK, and TP contents were detected: they did not vary markedly either (Figure 3D–G). The ratios of C/N, C/P, and N/P were also stable (Figure 3H–J). Therefore, the effects of different models on these primary nutrients were probably low.

3.3. Effect of Different Models on Soil Enzyme Activities Changes

PPO activity showed similar trends among different layers. In M2 (24.26 ± 0.11 mg × d−1 × g−1, 25.39 ± 1.75 mg × d−1 × g−1, 26.41 ± 3.24 mg × d−1 × g−1, and 22.42 ± 1.86 mg × d−1 × g−1 with increase in depth) and M3 (23.07 ± 1.59 mg × d−1 × g−1, 22.86 ± 0.71 mg × d−1 × g−1, 22.64 ± 0.94 mg × d−1 × g−1, and 22.46 ± 1.39 mg × d−1 × g−1 with increase in depth), the activity values were assessed to be at very close levels and significantly lower than in almost every layer of M1 (30.67 ± 2.54 mg × d−1 × g−1, 29.49 ± 2.85 mg × d−1 × g−1, 29.23 ± 4.17 mg × d−1 × g−1, and 27.95 ± 2.59 mg × d−1 × g−1 with increase in depth, Figure 4A).
Another enzyme with a clear distinction was URE. It showed a characteristic of decreasing with depth. M2 had the lowest URE activity level (433.48 ± 49.63 μg × d−1 × g−1, 370.81 ± 31.85 μg × d−1 × g−1, 219.98 ± 35.72 μg × d−1 × g−1, and 173.88 ± 49.82 μg × d−1 × g−1 with increase in depth) among the three models. In the 0–10 cm layer, M1 had the highest activity (754.71 ± 53.50 μg × d−1 × g−1); nevertheless, it became considerably inactivated in the deeper layers, and was surpassed by values in M3 (Figure 4B).
The activities of CAT increased in the soil layers below 20–40 cm, especially in M2 and M3. Significant differences (p < 0.05) were recorded between M2 (38.36 ± 3.69 μmol × d−1 × g−1) and M3 (30.21 ± 2.07 μmol × d−1 × g−1) in the 0–10 cm layer, M1 (26.96 ± 4.87 μmol × d−1 × g−1), and M3 (51.37 ± 7.41 μmol × d−1 × g−1) in the 20–40 cm layer, and between M1 (28.89 ± 5.29 μmol × d−1 × g−1) and M2 (43.79 ± 3.41 μmol × d−1 × g−1) in the 40–60 cm layer (Figure 4C).
In contrast, the activities of SUC were relatively high in the shallow soil layer. Activity levels of M1 (0.12 ± 0.03 μg × d−1 × g−1) and M2 (0.25 ± 0.11 μg × d−1 × g−1) exhibited significant (p < 0.05) differences (Figure 4D). The ACP activities were unchanged with/within the groups (Figure 4E).

3.4. Diversity, Function, and Correlation with Environmental Factors of Soil Bacteria

In detecting soil bacteria based on 16S rDNA sequencing, the average number of sequences in the sample was found to be 78,564 after removing the low-quality sequences. All sequences were classified into OTUs according to the standard of 97% similarity. A total of 64,375 OTUs was obtained with an average per sample of 1788; sequencing coverage was 99%.
Sequence coverage and specific diversity assessment of the soil bacterial populations among the models were estimated (Figure 5A). The Goods coverage, which can be used to describe the truthfulness of the sequencing results, was calculated as 0.99 in all three models. This illustrated that the sequencing results reflected the real species abundance and population size almost completely. The three models also had equal levels of Simpson’s index values (0.96 ± 0.01); however, the Shannon index value in M1 (7.21 ± 0.08) was higher than in M2 (7.17 ± 0.04) or M3 (7.18 ± 0.03), implying a more complex community. In contrast, both the Ace (2196.51 ± 66.05) and Chao (2114.43 ± 55.91) values of M2 performed at the highest level, reflecting their relatively better species richness. The PD-whole-tree index, which was used to evaluate the strength of lineage diversity according to the OTU sequence phylogenetic relationship, also showed the highest level in M2 (174.60 ± 10.96). Overall, the M1 and M2 ecosystems performed better in species richness and diversity.
Burkholderia–Caballeronia–Paraburkholderia (total of 237,354 OTUs and 8% of bacteria), Acidothermus (total of 76,343 OTUs and 3% of bacteria), Paenibacillus (total of 71,180 OTUs and 3% of bacteria, Supplementary Figure S2), and seven other genera of bacteria with the highest abundance occupied dominant positions in the plots (Supplementary Figure S3). Their distribution in the ternary diagram (Figure 5B) was relatively concentrated, indicating the lower differences in relative abundance among these models. There were 108 differentially expressed bacteria shared by all three models; and seven, nine, and ten endemic bacteria were found in M1, M2, and M3, respectively (Figure 5C). This suggested a high coessential level of composition over the converted models (Supplementary Figure S4).
Differences in soil bacterial function required further examination, and Figure 5D shows the top 20 significantly enriched KEGG pathways. Soil bacteria in those models performed a clear functional bias. Only one pathway, the synthesis and degradation of ketone bodies, was found with a high enriched level in M1, while the bacterial chemotaxis pathway appeared in M2. Another 18 pathways, including biosynthesis of ansamycins; biosynthesis of vancomycin group antibiotics; and valine, leucine and isoleucine biosynthesis were strongly enriched in M3. This indicated that soil bacteria in M3 may have higher functional diversity.
Results of a redundancy analysis (RDA, Figure 6A and Supplementary Table S2) showed that the common interpretation of RDA1 and RDA 2 was 85.07%. The activities of SUC (p < 0.01), URE (p < 0.01), and PPO (p = 0.01); TC (p < 0.01), TN (p = 0.01), and AP (p = 0.02) contents; and the ratios of C/P (p < 0.01) and N/P (p < 0.01) were significantly correlated with the variation in soil bacteria. The PPO activity showed the highest explanatory value (12.03%). This represented the coincidence between the changes in environmental factors and bacterial diversity and was followed by URE activity (11.07%, Figure 6B). In addition, the correlations between the changes in the 20 genera with the highest abundance and the soil properties are shown in Figure 6C. These genera were clustered into four clades. Clade B consisted of six genera, including Acidothermus, Candidatus_Solibacter, and Acidibacter, and clade D consisted of Paenibacillus and HSB_OF53-F07. Both of the clades were significantly correlated with TN, TC, AP, and OM contents; ratios of C/N, C/P, and N/P; and activities of both SUC and URE. However, clade B was positive while clade D was negative. The other two clades (A and C) exhibited a similar (but slighter) positive/negative correlation, compared with the clades mentioned above. Burkholderia–Caballeronia–Paraburkholderia, which exhibited the highest relative abundance, was found to have a significant positive correlation only with PPO activity.

3.5. Diversity, Function, and Correlation to Environmental Factors of Soil Fungi

The average number of sequences in the sample was 121,164 after screening out the low-quality sequences. The similarity threshold of OTU classification was set at 97%, and finally produced 31,319 entries. The average OTUs of each sample were 846, and the coverage was higher than 99%.
Compared with the soil bacteria, fungi differed more clearly in abundance within the models (Figure 7A). The Simpson (M1 = 0.95 ± 0.01, M2 = 0.94 ± 0.03, and M3 = 0.93 ± 0.03) and Shannon (M1 = 7.21 ± 0.08, M2 = 7.17 ± 0.04, and M3 = 7.18 ± 0.03) indexes did not demonstrate conspicuous variation within groups. The change in Chao and Ace values had a similar trend, and the order from high to low level was M2 (Chao = 1071.96 ± 77.68, and Ace = 1086.07 ± 72.26), M3 (Chao = 1066.22 ± 34.72, and Ace = 1078.47 ± 29.90), and M1 (Chao = 1044.65 ± 23.31, and Ace = 1049.94 ± 27.91). The PD-whole-tree difference was the most observable. It had a greater level in M3 (307.27 ± 7.61), a medial but discrete level in M2 (296.48 ± 21.33), and a relatively low level in M1 (289.14 ± 2.92), indicating that ecosystems such as M3 seemed beneficial to the improvement in fungal diversity from a phylogenetic viewpoint.
The distribution of the ten fungi with the highest relative abundance was seen to be more dispersed (Supplementary Figure S3). Dots in Figure 7B indicated that Talaromyces (total of 170,327 OTUs and 4% of fungi), Trichodema (total of 112,272 OTUs and 3% of fungi), and Aspergillus (total of 147,359 OTUs and 3% of fungi) were observed closer to the M1 pole in the ternary phase diagram, indicating their larger population sizes and dominant competitive positions. Similarly, Saitozyma (total of 151,292 OTUs and 4% of fungi) and Umbelopsis (total of 40,678 OTUs and 0.9% of fungi) also constituted the dominant fungal populations in M3. However, Mortierella (total of 52,413 OTUs and 1% of fungi, Supplementary Figure S2) showed less difference in the proportion of distribution between M1 and M3. In addition, these plots also contained more endemic fungi than soil bacteria. More endemic fungi were detected (M1 = 37, M2 = 41, and M3 = 44), while 96 genera were found to be common among them (Figure 7C; Supplementary Figure S5).
The functional enrichment analysis of soil fungi (Figure 7D) revealed an opposite result to that shown in Figure 6c. Among the 20 functional KEGG pathway entries with highest abundance, a large part was found to be highly expressed in M1, such as glycolysis III (from glucose), the Calvin-Benson-Bassham cycle, and coenzyme A biosynthesis I. Five entries were enriched in M2, including L-arginine biosynthesis I (via L-ornithine), gluconeogenesis I, and L-ornithine biosynthesis. In M3, only two entries, L-methionine biosynthesis III and L-leucine degradation I, were displayed. Overall, the distribution of functional enrichment showed a moderate trend, suggesting that the functional diversity of the fungal community might decrease with the reconstruction of the artificial plantation.
Five environmental factors, Na (p = 0.03) and TK (p = 0.04) contents, N/P (p < 0.01) and C/P (p = 0.02) ratio, and PPO activity (p < 0.01), correlated significantly with the divergence in fungi based on the RDA result (Figure 8A and Supplementary Table S2). The variation trend in the fungal diversity in different models could mainly be explained by the C/P (10.29%) and N/P (10.81%) ratios; TK content (8.69%); and PPO (7.34%) and URE (5.81%) activities (Figure 8B). The cluster results (Figure 8C) showed two major clades. The clade of Aspergillus and Trichoderma (clade A), which abounded in M1, positively correlated with C/P and N/P ratios, AK and TK contents, PPO activity, and NCP and CP levels. The other major clade (B) divided into four subclades. Their correlative factors were observed separately and positively. Umbelopsis and Saitozyma, which had high relative abundance levels in M3, exhibited a negative correlation to soil pH value and a positive correlation to SBD level.

4. Discussion

4.1. Soil Properties Change after Conversion of the Artificial Plantation Ecosystem

When an artificial plantation ecosystem is transformed, vegetation on the surface will be damaged, further changing soil properties. The continuous increase in demand for timber supplies has led to the pursuit of fast-growing timber, resulting in a shortened growth cycle. Soil physical properties are mainly composed of solid [48], gaseous [49], and liquid [50] particles. Only when they are well combined can the soil exhibit the most favorable physical properties for plant growth. This study found that, with the increase in conversion after harvest, soil water-holding capacity first increased and then decreased; in particular, it was significantly greater in M2 and lower in M3 (Figure 1). These suggested that M2 may be more conducive to soil water conservation and retention, and a mature root system or a high degree of litter humus in M3 may impact the soil particles. These findings indicate that rotation clear logging at appropriate time periods should be beneficial to the enhancement in soil water-holding capacity, while excessive disturbance would inhibit it [51,52]. A rotation of more than 20 years may be suggested for C. lanceolata. A possible explanation for changes in water-holding capacity may be the squeezing effect of artificial interference on non-capillary porosity. Extrusion, when appropriate intensity is applied, may change large pores to smaller (capillary) pores, thus enhancing the capillary force on soil water and avoiding its loss to the deeper layer, which is hard for roots to reach [53].
With respect to soil nutrient content performance, the differences in the models were mainly reflected in the metal nutrients such as Na, Al, and Mg ions (Figure 2), while the changes in the primary nutrients were not significant (Figure 3). These results contrast with previous research [29,30], and the mixed management in the multiple conversion model may reflect this difference.
Soil PPO is mainly derived from biochemical release via soil microbial activities, root secretions, and the decomposition of plant or animal residues [54,55]. The M1 model had a longer growth and development period, producing a more mature ecosystem, abundant understory vegetation or litter, and vigorous root activity. All these factors further elevated the level of PPO activity. URE is considered a soil microorganism secretory product, which hydrolyzes the organic compound urea into ammonium nitrogen and converts soil nutrients into the appropriate forms required by plants [56]. As organic matter content in soil rises, URE activity has also been reported to increase [57,58].

4.2. Role of Manual Intervention in Succession of the Soil Microorganism Population Structure

The abundance, diversity, and functional bias of bacteria or fungi in the different models showed a visible divergence (Figure 5B,C, and Supplementary Figure S3). Most of the relatively abundant bacteria have been found to promote the availability of soil nutrients or limit the survival of other microorganisms by secreting secondary metabolites [50,59,60,61]. For example, autotoxic ginsenosides of P. notoginseng can recruit Burkholderia–Caballeronia–Paraburkholderia in rhizosphere soil. This plays a detoxification role by degrading the ginsenosides and inhibits Ilyonectira destructans, a root rot pathogen [62]. The successive planting of Cunninghamia lanceolata has also been confirmed to promote autotoxicity [63]. Burkholderia has been considered a pathogen in many reports [64], including a paper that focused on harmful microbial change in a C. lanceolata plantation [30]. Those authors believed that successive planting would lead to an accumulation of Burkholderia and limit the growth of managed timbers. However, the abundant Burkholderia found in the long-term model of forest management in this study challenges this conclusion, and further research is clearly needed. Nevertheless, more metabolically related functions with a high level of difference and confidence were enriched in M3 (Figure 6C), showing the superior functional diversity of successive planting. Mixed plantings of C. lanceolata and Pinus. massoniana should be effective in stimulating soil bacterial functional diversity.
Fungi, however, behaved quite differently from bacteria. More endemic fungal genera were found in different models (Figure 7C), and the distribution of relative abundance was more skewed (Figure 7B). Ascomycota and Basidiomycota, fungi with broad ecological niches, constituted the domain community in each model (Supplementary Figure S3). They are considered the major mediator of lignin degradation in forest ecosystems [65]. Talaromyces, Trichoderma, and Aspergillus of Ascomycota were relatively abundant genera in the M1 model, whereas Saitozyma of Basidiomycota and Umbelopsis of Mucoromycota were highly distributed in M3. Nutrient cycling and soil properties after artificial harvest and replanting may lead to this difference. In long-term management without a harvest model, more accumulation of litter is found, for which more specific lignin decomposers is demanded. The humification ability of Talaromyces is emphasized here, and this agrees with previous research [66]. Talaromyces has also been reported as intertwining soil particles into large, stable fungus–soil spherical granules [67], coordinating some bacteria to improve the circulation of soil gases and water exchange, promoting oxidation, hydroxylation, and epoxidation in soil; and finally enhancing the soil trophic structure and promoting plant growth [68,69]. In addition, the influence of these abundant fungi is reflected in the mediation of the soil microbial communities. These fungi also release special secondary metabolites [41,70,71], affect host secretion [72], or recruit soil antibiotics such as Penicillium [73], and further reform the rhizosphere-beneficial microbes involved in suppression and adaption. Compared with M1, more roots remained in the soil of M3, which experienced vigorous manual intervention, providing more suitable living conditions for saprotrophic fungi. Umbelopsis is a typical fungal genus that can live on rotten woody substrates. Its ability to degrade and reduce toxicity through its endocrine activity [74] allows it to clean up the environment [75]. It not only produces quantities of terpene metabolites [76] that have the same or similar components as the host, but also modifies the exudation from the host to promote the production of highly oxygenated schitiriterpenoids/schinortriterpenoids [77]. Saitozyma has also been reported to have the ability to convert plant-derived lignocellulose into biochemical substances [78].

4.3. Correlation between Soil Properties and Microbial Composition

Diversity, abundance, and evenness of soil microorganisms have also been influenced in different models. Primary nutrients were found to be involved in the formation of the microbial community (Figure 6 and Figure 8), as well as the URE and PPO activities. The decomposition products of URE, ammonia and carbonic acid, are involved in soil nitrogen and carbon cycling, and affect pH regulation as well. Phenol accumulation in successive C. lanceolata plantations requires a high level of PPO for detoxification, so the activities of PPO and URE are related to the nutrient supply and suitability of the living environment for soil microbes. Cui et al. [79] reported that a high ratio of soil C/N indicated the presence of large amounts of lignin and polyphenols in the soil, and this is more conducive to the growth and reproduction of fungi, supporting this deduction.
Previous studies also suggested that soil pH was an important factor in microbial community structure [80]. However, this effect did not appear to be significant in this study. The geographical condition of the sampling site determined that the soil pH value was relatively acidic [81,82]. In the present study, artificial disturbance seems to have little influence on the changes in soil pH value, which negates its decisive role.
In conclusion, the effects of successive strategies on soil microbial community structure succession and diversity formation are comprehensive, with multiple factors. However, the importance of soil enzyme activities should probably be paid more attention. Their levels are shaped by plant roots and soil microbial communities in the plantation [60], and further influence soil nutrients via their functions in the circulation of ecosystem materials [57]. Moreover, variations in soil microbial diversity caused by models may ultimately be reflected in those functions.

4.4. Limitation and Suggession for Sustainable C. lanceolata Plantation Management

Factors in artificial plantation ecosystems are closely related. The biological characteristics of the main timber species and the physical and chemical properties of the soil can shape the differentiation of both microbial communities and functional types. As the most important woody species in China, C. lanceolata always experiences clearcutting, repeated planting on the same sites, and other radical approaches to achieve efficient utilization and economic returns. Whenever these measures are implemented, the population structure of soil microbes will be reconstructed.
According to the present data, the diversity in artificial C. lanceolata plantation ecosystems cannot be maintained under the high-intensity successive and pure plantation reconstructive method. Extending the rotation period or building mixed forests may be appropriate solutions that promote sustainability.
However, the flaws in this research are obvious. First, although the sampling site is in a complete land, then divided into three plots using different management practices, different environmental factors such as the soil and microclimate characteristics of the plots cannot be ruled out. With the long periodic forests, these assessments currently can only be made under limited conditions including the single point in time sampling method, and further limit the ability to apply these findings broadly to management practices in this region of China. Moreover, the replication did not address different areas, in view of the difficulty of searching for similar forests managed the same way. This lack of a basis of comparison may lead to the possibility that the conclusions might not fully represent the general rule of those models. In view of this, the available findings were recommended conservatively. Better experimental designs and longer observations are expected in the future to confirm and complete this recommendation.

5. Conclusions

The present study provided an overview of the correlation between soil properties and microbial diversity changes in an artificial C. lanceolata plantation in different management-practiced models. By comparing changes in soil properties and microbial diversity in these models, the effects of artificial management on environmental factors were clarified. The contents of Na, Mg, and Al ions were significantly different in these models, and the trends with soil depth were not similar. On the contrary, the assessment of the effects of plantation conversion on primary nutrients was probably low. Higher PPO and URE activity levels were found both in long-term continuous growing without a harvest model and a two-time main harvest followed by the construction of a mixed plantation model. The dynamics of URE and PPO and changes in primary nutrients were found to have a significant correlation with microbial diversity. Fungi, but not bacteria, showed a bias toward greater distribution among models, and this matched the characteristics of the ecosystems. Finally, when the positive effects of a high level of artificial plantation biodiversity on economic and ecological benefits are considered, long-term management and the construction of mixed forests were proposed to be the more appropriate and applicable models for C. lanceolata sustainability. Although the experimental design and sampling time were limited, the results could provide reference for the construction and improvement of C. lanceolata plantations.

Supplementary Materials

The following are available online at https://www.mdpi.com/article/10.3390/f14050877/s1, Supplementary Table S1. Growth information of Cunninghamia lanceolata in the sampling sites. Supplementary Table S2. Results of redundancy analysis. Supplementary Figure S1. Geographic position of the sampling sites. Supplementary Figure S2. Krona analysis showing the proportions of the microbe genera. A phylogenetic tree from phylum to genus level and the community composition of the soil bacteria (A) and fungi (B) are shown in the pie chart based on the Krona analysis. The number before the genus name represents the proportion of this genus in all samples based on OTUs statistics. Supplementary Figure S3. Major microbial composition. Microbes with highest relative abundance are shown in each sub-figure including phylum level of bacteria (A) and fungi (B), and genus level of bacteria (C) and fungi (D). The stacked colored areas represent the relative abundance level of the corresponding genus. Supplementary Figure S4. Bacterial Lefse cladogram. Differentially expressed bacteria and their phylogenetic relationship are shown in the pie chart. The colored background represents the distribution in the corresponding model. The histogram with different colors represents the log10LDA score, which is used to evaluate the differential expression level. Supplementary Figure S5. Fungal Lefse cladogram. Differentially expressed fungi and their phylogenetic relationship are shown in the pie chart. The colored background represents the distribution in the corresponding model. The histogram with different colors represents the log10LDA score, which is used to evaluate the differential expression level.

Author Contributions

Conceptualization, G.C. and Y.C.; methodology, Y.Y. and G.C.; validation, L.D., Y.Y. and S.X.; formal analysis, L.W. and L.D.; investigation, Y.C. and L.W.; Resources, S.X.; data curation, C.W., X.Q. and L.D.; writing—original draft preparation, L.W. and S.X.; writing—review and editing, Y.C.; visualization, C.W.; project administration, G.C.; Funding acquisition, G.C. All authors have read and agreed to the published version of the manuscript.

Funding

This research was funded by the Forestry Peak Discipline Construction Project of Fujian Agriculture and Forestry University, China (72202200205) and the National Key Research and Development Program of China (2021YFD2201302).

Data Availability Statement

The data presented in this study are available in supplementary files.

Acknowledgments

Authors are grateful to Yangkou State Forest Farm for assisting in sampling, Guangzhou Genedenovo Biotechnology Co., Ltd. for assisting in sequencing.

Conflicts of Interest

The authors declared no conflict of interest.

References

  1. Giles-Vernick, T. Leaving a person behind: History, personhood, and struggles over forest resources in the Sangha Basin of Equatorial Africa. Int. J. Afr. Hist. Stud. 1999, 32, 311–338. [Google Scholar] [CrossRef] [PubMed]
  2. Neale, D.B.; Kremer, A. Forest tree genomics: Growing resources and applications. Nat. Rev. Genet. 2011, 12, 111–122. [Google Scholar] [CrossRef] [PubMed]
  3. Li, Y.; Li, M.; Li, X.; Liu, Z.; Ming, A.; Lan, H.; Ye, S. The Abundance and Structure of Deadwood: A Comparison of Mixed and Thinned Chinese Fir Plantations. Front. Plant Sci. 2021, 12, 614695. [Google Scholar] [CrossRef]
  4. Huang, H.-H.; Xu, L.-L.; Tong, Z.-K.; Lin, E.-P.; Liu, Q.-P.; Cheng, L.-J.; Zhu, M.-Y. De novo characterization of the Chinese fir (Cunninghamia lanceolata) transcriptome and analysis of candidate genes involved in cellulose and lignin biosynthesis. BMC Genom. 2012, 13, 648. [Google Scholar] [CrossRef] [PubMed]
  5. Zeng, Y.; Wu, H.; Ouyang, S.; Chen, L.; Fang, X.; Peng, C.; Liu, S.; Xiao, W.; Xiang, W. Ecosystem service multifunctionality of Chinese fir plantations differing in stand age and implications for sustainable management. Sci. Total Environ. 2021, 788, 147791. [Google Scholar] [CrossRef] [PubMed]
  6. Jiang, Y.; Zhang, X.; Chhin, S.; Zhang, J. A Bimodal Pattern and Age-Related Growth of Intra-Annual Wood Cell Development of Chinese Fir in Subtropical China. Front. Plant Sci. 2021, 12, 757438. [Google Scholar] [CrossRef]
  7. Zeng, Q.; Yu, X.; Wei, N.; Wu, Z.; Liu, Q.; Chen, N.; Zhao, W. Effect of Impregnation with Natural Shellac Polymer on the Mechanical Properties of Fast-Growing Chinese Fir. Polymers 2022, 14, 3871. [Google Scholar] [CrossRef]
  8. Cui, H.O.; Liu, M. Analysis on the results of the 9th national forest inventory. J. West China For. Sci. 2020, 49, 90–95, (Chinese with English Abstract). [Google Scholar] [CrossRef]
  9. Wang, Q.; Wang, J.; Li, Y.; Chen, D.; Ao, J.; Zhou, W.; Shen, D.; Li, Q.; Huang, Z.; Jiang, Y. Influence of nitrogen and phosphorus additions on N2-fixation activity, abundance, and composition of diazotrophic communities in a Chinese fir plantation. Sci. Total Environ. 2018, 619–620, 1530–1537. [Google Scholar] [CrossRef]
  10. Li, R.; Yu, D.; Zhang, Y.; Han, J.; Zhang, W.; Yang, Q.; Gessler, A.; Li, M.-H.; Xu, M.; Guan, X.; et al. Investment of needle nitrogen to photosynthesis controls the nonlinear productivity response of young Chinese fir trees to nitrogen deposition. Sci. Total Environ. 2022, 840, 156537. [Google Scholar] [CrossRef]
  11. Yang, W.D.; Liu, J.S.; Li, H.Y.; Zhang, X.L.; Qi, Y.Z. Inhibition of the growth of Alexandrium tamarense by algicidal substances in Chinese fir (Cunninghamia lanceolata). Bull. Environ. Contam. Toxicol. 2009, 83, 537–541. [Google Scholar] [CrossRef]
  12. Huang, Z.; Liao, L.; Wang, S.; Lui, Y. Dynamics of phenolics content of Chinese fir stump-roots and the rhizosphere soil and it’s allelopathy. J. Appl. Ecol. 2000, 11, 190–192, (Chinese with English Abstract). [Google Scholar]
  13. Pachepsky, E.; Taylor, T.; Jones, S. Mutualism promotes diversity and stability in a simple artificial ecosystem. Artif. Life 2002, 8, 5–24. [Google Scholar] [CrossRef] [PubMed]
  14. Jennings, S.; Melin, F.; Blanchard, J.L.; Forster, R.M.; Dulvy, N.K.; Wilson, R.W. Global-scale predictions of community and ecosystem properties from simple ecological theory. Proc. Biol. Sci. R. Soc. 2008, 275, 1375–1383. [Google Scholar] [CrossRef]
  15. Fauteux, D.; Stien, A.; Yoccoz, N.G.; Fuglei, E.; Ims, R.A. Climate variability and density-dependent population dynamics: Lessons from a simple High Arctic ecosystem. Proc. Natl. Acad. Sci. USA 2021, 118, e2106635118. [Google Scholar] [CrossRef]
  16. Bai, Y.; Chen, S.; Shi, S.; Qi, M.; Liu, X.; Wang, H.; Wang, Y.; Jiang, C. Effects of different management approaches on the stoichiometric characteristics of soil C, N, and P in a mature Chinese fir plantation. Sci. Total Environ. 2020, 723, 137868. [Google Scholar] [CrossRef] [PubMed]
  17. Liu, X.; He, L.; Zhang, X.; Kong, D.; Chen, Z.; Lin, J.; Wang, C. Bioremediation of petroleum-contaminated saline soil by Acinetobacter baumannii and Talaromyces sp. and functional potential analysis using metagenomic sequencing. Environ. Pollut. 2022, 311, 119970. [Google Scholar] [CrossRef] [PubMed]
  18. Xu, X.; Wang, X.; Hu, Y.; Wang, P.; Saeed, S.; Sun, Y. Short-term effects of thinning on the development and communities of understory vegetation of Chinese fir plantations in Southeastern China. PeerJ 2020, 8, e8536. [Google Scholar] [CrossRef]
  19. Peng, C.; Song, Y.; Li, C.; Mei, T.; Wu, Z.; Shi, Y.; Zhou, Y.; Zhou, G. Growing in Mixed Stands Increased Leaf Photosynthesis and Physiological Stress Resistance in Moso Bamboo and Mature Chinese Fir Plantations. Front. Plant Sci. 2021, 12, 649204. [Google Scholar] [CrossRef]
  20. Li, J.; Li, L.; Arif, M.; Ding, D.; Hu, X.; Zheng, J.; Yuan, Z.; Li, C. Artificial Plantation Responses to Periodic Submergence in Massive Dam and Reservoir Riparian Zones: Changes in Soil Properties and Bacterial Community Characteristics. Biology 2021, 10, 819. [Google Scholar] [CrossRef]
  21. Xiang, W.; Xu, L.; Lei, P.; Ouyang, S.; Deng, X.; Chen, L.; Zeng, Y.; Hu, Y.; Zhao, Z.; Wu, H.; et al. Rotation age extension synergistically increases ecosystem carbon storage and timber production of Chinese fir plantations in southern China. J. Environ. Manag. 2022, 317, 115426. [Google Scholar] [CrossRef]
  22. Gentile, J.M.; Pluymers, D.; Plewa, M.J. Promutagen activation as a function of growth curve dynamics in the plant cell/microbe coincubation assay. Mutat. Res. 1986, 173, 181–185. [Google Scholar] [CrossRef] [PubMed]
  23. Crawford, J.; Deacon, L.; Grinev, D.; Harris, J.; Ritz, K.; Singh, B.; Young, I. Microbial diversity affects self-organization of the soil-microbe system with consequences for function. J. R. Soc. Interface 2012, 9, 1302–1310. [Google Scholar] [CrossRef] [PubMed]
  24. Ishida, K.; Noutoshi, Y. The function of the plant cell wall in plant-microbe interactions. Plant Physiol. Biochem. 2022, 192, 273–284. [Google Scholar] [CrossRef] [PubMed]
  25. Wu, Z.; Li, J.; Zheng, J.; Liu, J.; Liu, S.; Lin, W.; Wu, C. Soil microbial community structure and catabolic activity are significantly degenerated in successive rotations of Chinese fir plantations. Sci. Rep. 2017, 7, 6691. [Google Scholar] [CrossRef]
  26. Seifert, J. Intensity of nitrification in soil as a function of time and soil moisture. Folia Microbiol. 1973, 18, 386–389. [Google Scholar] [CrossRef]
  27. Gleeson, D.; Mathes, F.; Farrell, M.; Leopold, M. Environmental drivers of soil microbial community structure and function at the Avon River Critical Zone Observatory. Sci. Total Environ. 2016, 571, 1407–1418. [Google Scholar] [CrossRef]
  28. Bobul’ska, L.; Espindola, S.P.; Coelho, M.A.; Ferreira, A.S. Impact of land use on soil function and bacterial community in the Brazilian savanna. An. Acad. Bras. Cienc. 2021, 93, e20201906. [Google Scholar] [CrossRef]
  29. Liu, X.; Wang, Y.; Liu, Y.; Chen, H.; Hu, Y. Response of Bacterial and Fungal Soil Communities to Chinese Fir (Cunninghamia lanceolate) Long-Term Monoculture Plantations. Front. Microbiol. 2020, 11, 181. [Google Scholar] [CrossRef]
  30. Chen, J.; Deng, Z.; Jiang, Z.; Sun, J.; Meng, F.; Zuo, X.; Wu, L.; Cao, G.; Cao, S. Variations of rhizosphere and bulk soil microbial community in successive planting of Chinese fir (Cunninghamia lanceolata). Front. Plant Sci. 2022, 13, 954777. [Google Scholar] [CrossRef]
  31. Pan, B.; Xing, B.; Tao, S.; Liu, W.; Lin, X.; Xiao, Y.; Dai, H.; Zhang, X.; Zhang, Y.; Yuan, H. Effect of physical forms of soil organic matter on phenanthrene sorption. Chemosphere 2007, 68, 1262–1269. [Google Scholar] [CrossRef] [PubMed]
  32. Luo, X.; Wang, M.K.; Hu, G.; Weng, B. Seasonal Change in Microbial Diversity and Its Relationship with Soil Chemical Properties in an Orchard. PLoS ONE 2019, 14, e0215556. [Google Scholar] [CrossRef] [PubMed]
  33. Namaghi, H.H.; Karami, G.H.; Saadat, S. A study on chemical properties of groundwater and soil in ophiolitic rocks in Firuzabad, east of Shahrood, Iran: With emphasis to heavy metal contamination. Environ. Monit. Assess. 2011, 174, 573–583. [Google Scholar] [CrossRef] [PubMed]
  34. Chen, S.; Zhou, Y.; Chen, Y.; Gu, J. Fastp: An ultra-fast all-in-one FASTQ preprocessor. Bioinformatics 2018, 34, i884–i890. [Google Scholar] [CrossRef]
  35. Magoc, T.; Salzberg, S.L. FLASH: Fast length adjustment of short reads to improve genome assemblies. Bioinformatics 2011, 27, 2957–2963. [Google Scholar] [CrossRef]
  36. Bokulich, N.A.; Subramanian, S.; Faith, J.J.; Gevers, D.; Gordon, J.I.; Knight, R.; Mills, D.A.; Caporaso, J.G. Quality-filtering vastly improves diversity estimates from Illumina amplicon sequencing. Nat. Methods 2013, 10, 57–59. [Google Scholar] [CrossRef] [PubMed]
  37. Edgar, R.C.; Haas, B.J.; Clemente, J.C.; Quince, C.; Knight, R. UCHIME improves sensitivity and speed of chimera detection. Bioinformatics 2011, 27, 2194–2200. [Google Scholar] [CrossRef] [PubMed]
  38. Edgar, R.C. UPARSE: Highly accurate OTU sequences from microbial amplicon reads. Nat. Methods 2013, 10, 996–998. [Google Scholar] [CrossRef]
  39. Pruesse, E.; Quast, C.; Knittel, K.; Fuchs, B.M.; Ludwig, W.; Peplies, J.; Glöckner, F.O. SILVA: A comprehensive online resource for quality checked and aligned ribosomal RNA sequence data compatible with ARB. Nucleic Acids Res. 2007, 35, 7188–7196. [Google Scholar] [CrossRef]
  40. Ankenbrand, M.J.; Keller, A.; Wolf, M.; Schultz, J.; Forster, F. ITS2 Database V: Twice as Much. Mol. Biol. Evol. 2015, 32, 3030–3032. [Google Scholar] [CrossRef]
  41. Qadir, M.; Hussain, A.; Shah, M.; Hamayun, M.; Iqbal, A.; Nadia. Enhancement of chromate phytoremediation and soil reclamation potential of Brassica campestris L. by Aspergillus niger. Environ. Sci. Pollut. Res. Int. 2022, 30, 9471–9482. [Google Scholar] [CrossRef]
  42. Oksanen, J.; Blanchet, F.G.; Friendly, M.; Kindt, R.; Legendre, P.; McGlinn, D.; Minchin, P.R.; O’Hara, R.B.; Simpson, G.L.; Solymos, P.; et al. Vegan: Community Ecology Package. R Package Version 2.4-3. 2017. Available online: http://cran.r-project.org (accessed on 1 January 2016).
  43. Segata, N.; Izard, J.; Waldron, L.; Gevers, D.; Miropolsky, L.; Garrett, W.S.; Huttenhower, C. Metagenomic biomarker discovery and explanation. Genome Biol. 2011, 12, R60. [Google Scholar] [CrossRef]
  44. Caporaso, J.G.; Kuczynski, J.; Stombaugh, J.; Bittinger, K.; Bushman, F.D.; Costello, E.K.; Fierer, N.; Gonzalez Peña, A.; Goodrich, J.K.; Gordon, J.I.; et al. QIIME allows analysis of high-throughput community sequencing data. Nat. Methods 2010, 7, 335–336. [Google Scholar] [CrossRef]
  45. Lozupone, C.; Knight, R. UniFrac: A new phylogenetic method for comparing microbial communities. Appl. Environ. Microbiol. 2005, 71, 8228–8235. [Google Scholar] [CrossRef]
  46. Asshauer, K.P.; Wemheuer, B.; Daniel, R.; Meinicke, P. Tax4Fun: Predicting functional profiles from metagenomic 16S rRNA data. Bioinformatics 2015, 31, 2882–2884. [Google Scholar] [CrossRef] [PubMed]
  47. Louca, S.; Parfrey, L.W.; Doebeli, M. Decoupling function and taxonomy in the global ocean microbiome. Science 2016, 353, 1272–1277. [Google Scholar] [CrossRef] [PubMed]
  48. Aylin Kasa, N.; Sel, S.; Ozkan, B.C.; Bakirdere, S. Determination of palladium in soil samples by slotted quartz tube-flame atomic absorption spectrophotometry after vortex-assisted ligandless preconcentration with magnetic nanoparticle-based dispersive solid-phase microextraction. Environ. Monit. Assess. 2019, 191, 692. [Google Scholar] [CrossRef] [PubMed]
  49. Elmi, A.A.; Astatkie, T.; Madramootoo, C.; Gordon, R.; Burton, D. Assessment of denitrification gaseous end-products in the soil profile under two water table management practices using repeated measures analysis. J. Environ. Qual. 2005, 34, 446–454. [Google Scholar] [CrossRef] [PubMed]
  50. Aihemaiti, A.; Gao, Y.; Liu, L.; Yang, G.; Han, S.; Jiang, J. Effects of liquid digestate on the valence state of vanadium in plant and soil and microbial community response. Environ. Pollut. 2020, 265, 114916. [Google Scholar] [CrossRef] [PubMed]
  51. Taylor, C.; Blair, D.; Keith, H.; Lindenmayer, D. Modelling water yields in response to logging and Representative Climate Futures. Sci. Total Environ. 2019, 688, 890–902. [Google Scholar] [CrossRef]
  52. Yuan, Y.; Zhao, Z.; Niu, S.; Bai, Z. The reclaimed coal mine ecosystem diverges from the surrounding ecosystem and reaches a new self-sustaining state after 20-23 years of succession in the Loess Plateau area, China. Sci. Total Environ. 2020, 727, 138739. [Google Scholar] [CrossRef]
  53. Yang, X.J.; Deng, Y.Y.; Duan, L.D. Research on Restoration of Soil Moisture Regulation Function in the Harvested Chinese Fir Plantation after Reforestation. For. Res. 2016, 29, 261–267, (Chinese with English abstract). [Google Scholar] [CrossRef]
  54. Kaiser, C.; Koranda, M.; Kitzler, B.; Fuchslueger, L.; Schnecker, J.; Schweiger, P.; Rasche, F.; Zechmeister-Boltenstern, S.; Sessitsch, A.; Richter, A. Belowground carbon allocation by trees drives seasonal patterns of extracellular enzyme activities by altering microbial community composition in a beech forest soil. New Phytol. 2010, 187, 843–858. [Google Scholar] [CrossRef]
  55. Luo, X.; Hou, E.; Zang, X.; Zhang, L.; Yi, Y.; Wen, D. Effects of elevated atmospheric CO2 and nitrogen deposition on leaf litter and soil carbon degrading enzyme activities in a Cd-contaminated environment: A mesocosm study. Sci. Total Environ. 2019, 671, 157–164. [Google Scholar] [CrossRef]
  56. Kuscu, I.S.K. Changing of soil properties and urease-catalase enzyme activity depending on plant type and shading. Environ. Monit. Assess. 2019, 191, 178. [Google Scholar] [CrossRef] [PubMed]
  57. Guo, H.; Yao, J.; Cai, M.; Qian, Y.; Guo, Y.; Richnow, H.H.; Blake, R.E.; Doni, S.; Ceccanti, B. Effects of petroleum contamination on soil microbial numbers, metabolic activity and urease activity. Chemosphere 2012, 87, 1273–1280. [Google Scholar] [CrossRef] [PubMed]
  58. An, S.S.; Huang, Y.M.; Zheng, F.L. Urease Activity in the Loess Hilly Grassland Soil and its Relationship to Soil Property. Acta Agrestia Sin. 2005, 13, 233–237, (Chinese with English Abstract). [Google Scholar]
  59. Tsai, S.H.; Chen, Y.T.; Yang, Y.L.; Lee, B.Y.; Huang, C.J.; Chen, C.Y. The Potential Biocontrol Agent Paenibacillus polymyxa TP3 Produces Fusaricidin-Type Compounds Involved in the Antagonism Against Gray Mold Pathogen Botrytis cinerea. Phytopathology 2002, 112, 775–783. [Google Scholar] [CrossRef]
  60. Wang, C.; Huang, Y.; Yang, X.; Xue, W.; Zhang, X.; Zhang, Y.; Pang, J.; Liu, Y.; Liu, Z. Burkholderia sp. Y4 inhibits cadmium accumulation in rice by increasing essential nutrient uptake and preferentially absorbing cadmium. Chemosphere 2020, 252, 126603. [Google Scholar] [CrossRef]
  61. Hengge, N.N.; Mallinson, S.J.B.; Pason, P.; Lunin, V.V.; Alahuhta, M.; Chung, D.; Himmel, M.E.; Westpheling, J.; Bomble, Y.J. Characterization of the Biomass Degrading Enzyme GuxA from Acidothermus cellulolyticus. Int. J. Mol. Sci. 2022, 23, 6070. [Google Scholar] [CrossRef]
  62. Luo, L.; Wang, L.; Deng, L.; Mei, X.; Liu, Y.; Huang, H.; Du, F.; Zhu, S.; Yang, M. Enrichment of Burkholderia in the Rhizosphere by Autotoxic Ginsenosides to Alleviate Negative Plant-Soil Feedback. Microbiol. Spectr. 2021, 9, e0140021. [Google Scholar] [CrossRef]
  63. Kong, C.H.; Chen, L.C.; Xu, X.H.; Wang, P.; Wang, S.L. Allelochemicals and activities in a replanted Chinese fir (Cunninghamia lanceolata (Lamb.) Hook) tree ecosystem. J. Agric. Food Chem. 2008, 56, 11734–11739. [Google Scholar] [CrossRef]
  64. Alsowayeh, N.; Albutti, A. Designing a novel chimeric multi-epitope vaccine against Burkholderia pseudomallei, a causative agent of melioidosis. Front. Med. 2022, 9, 945938. [Google Scholar] [CrossRef]
  65. Haq, F.U.; Imran, M.; Saleem, S.; Waheed, Y. Antibacterial Activity of Different Extracts of Ascomata of Morchella conica and M. esculenta (Ascomycota) against Salmonella Species. Int. J. Med. Mushrooms 2022, 24, 85–95. [Google Scholar] [CrossRef]
  66. Xu, Z.; Ma, L.; Zhao, B.; Li, Y.; Chen, Y.; Deng, Y.; Wang, Y. Humification process enhancement through relative abundance promotion of Talaromyces and Coprinopsis by inoculated Phanerochaete chrysosporium during the secondary fermentation of composting. Environ. Sci. Pollut. Res. Int. 2022, 30, 9060–9065. [Google Scholar] [CrossRef]
  67. Shi, J.; Yang, S.; Yu, L.; Fu, B.; Liu, H. The pelletization characteristics of the filamentous fungi Talaromyces flavus S1 in sludge and the improvement for sludge dewatering. Acta Sci. Circumstantiae 2017, 37, 3672–3678. [Google Scholar]
  68. Sun, X.-R.; Xu, M.-Y.; Kong, W.-L.; Wu, F.; Zhang, Y.; Xie, X.-L.; Li, D.-W.; Wu, X.-Q. Fine Identification and Classification of a Novel Beneficial Talaromyces Fungal Species from Masson Pine Rhizosphere Soil. J. Fungi 2022, 8, 155. [Google Scholar] [CrossRef]
  69. Liu, M.; Gan, B.; Li, Q.; Xiao, W.; Song, X. Effects of Nitrogen and Phosphorus Addition on Soil Extracellular Enzyme Activity and Stoichiometry in Chinese Fir (Cunninghamia lanceolata) Forests. Front. Plant Sci. 2022, 13, 834184. [Google Scholar] [CrossRef]
  70. Nord, C.; Levenfors, J.J.; Bjerketorp, J.; Guss, B.; Oberg, B.; Brogerg, A. Tetramic acid based alkaloids from Aspergillus amoenus Roberg strain UP197 - antibiotic properties and new pyranterreones. Nat. Prod. Res. 2022, 36, 967–973. [Google Scholar] [CrossRef]
  71. Li, Y.; Shao, J.; Fu, Y.; Chen, Y.; Wang, H.; Xu, Z.; Feng, H.; Xun, W.; Liu, Y.; Zhang, N.; et al. The volatile cedrene from Trichoderma guizhouense modulates Arabidopsis root development through auxin transport and signalling. Plant Cell Environ. 2022, 45, 969–984. [Google Scholar] [CrossRef]
  72. Agbessenou, A.; Akutse, K.S.; Yusuf, A.A.; Khamis, F.M. The Endophyte Trichoderma asperellum M2RT4 Induces the Systemic Release of Methyl Salicylate and (Z)-jasmone in Tomato Plant Affecting Host Location and Herbivory of Tuta absoluta. Front. Plant Sci. 2022, 13, 860309. [Google Scholar] [CrossRef]
  73. Tian, Y.H.; Peng, H.Y.; Wang, D.H.; Li, X.F.; He, B.L.; Gao, K.X. Biocontrol potential of Talaromyces purpurogenus and its regulation on soil microbial community. Chin. J. Appl. Ecol. 2020, 31, 3255–3266, (Chinese with English abstract). [Google Scholar] [CrossRef]
  74. Janicki, T.; Krupinski, M.; Dlugonski, J. Degradation and toxicity reduction of the endocrine disruptors nonylphenol, 4-tert-octylphenol and 4-cumylphenol by the non-ligninolytic fungus Umbelopsis isabellina. Bioresour. Technol. 2016, 200, 223–229. [Google Scholar] [CrossRef]
  75. Nykiel-Szymanska, J.; Stolarek, P.; Bernat, P. Elimination and detoxification of 2,4-D by Umbelopsis isabellina with the involvement of cytochrome P450. Environ. Sci. Pollut. Res. Int. 2018, 25, 2738–2743. [Google Scholar] [CrossRef]
  76. Wang, L.; Qin, D.; Zhang, K.; Huang, Q.; Liu, S.; Han, M.J.; Dong, J.Y. Metabolites from the co-culture of nigranoic acid and Umbelopsis dimorpha SWUKD3.1410, an endophytic fungus from Kadsura angustifolia. Nat. Prod. Res. 2017, 31, 1414–1421. [Google Scholar] [CrossRef]
  77. Qin, D.; Wang, L.; Han, M.; Wang, J.; Song, H.; Yan, X.; Duan, X.; Dong, J. Effects of an Endophytic Fungus Umbelopsis dimorpha on the Secondary Metabolites of Host-Plant Kadsura angustifolia. Front. Microbiol. 2018, 9, 2845. [Google Scholar] [CrossRef]
  78. Aliyu, H.; Gorte, O.; Neumann, A.; Ochsenreither, K. Global Transcriptome Profile of the Oleaginous Yeast Saitozyma podzolica DSM 27192 Cultivated in Glucose and Xylose. J. Fungi 2021, 7, 758. [Google Scholar] [CrossRef]
  79. Cui, J.; Zhu, Z.K.; Xu, X.L.; Liu, S.; Ge, T. Carbon and nitrogen recycling from microbial necromass to cope with C:N stoichiometric imbalance by priming. Soil Biol. Biochem. 2020, 142, 107720. [Google Scholar] [CrossRef]
  80. Zhang, T.; Wang, N.F.; Liu, H.Y.; Zhang, Y.Q.; Yu, L.Y. Soil pH is a Key Determinant of Soil Fungal Community Composition in the Ny-Ålesund Region, Svalbard (High Arctic). Front. Mocrobiol. 2016, 7, 227. [Google Scholar] [CrossRef]
  81. Fu, H.; Ding, D.; Sui, Y.; Zhang, H.; Hu, N.; Li, F.; Dai, Z.; Li, G.; Ye, Y.; Wang, Y. Transport of uranium(VI) in red soil in South China: Influence of initial pH and carbonate concentration. Environ. Sci. Pollut. Res. Int. 2019, 26, 37125–37136. [Google Scholar] [CrossRef]
  82. Shen, Y.; Zhang, Z.; Xue, Y. Study on the new dynamics and driving factors of soil pH in the red soil, hilly region of South China. Environ. Monit. Assess. 2021, 193, 304. [Google Scholar] [CrossRef]
Figure 1. Comparison of soil physical properties in different soil layers. (A) Performance of soil saturation capacity (SSC) of the three models in different soil layers. (B) Performance of field moisture capacity (FMC). (C) Performance of capillary moisture capacity (CMC). (D) Performance of capillary porosity (CP). (E) Performance of non-capillary porosity (NCP). (F) Performance of soil total porosity (STP). (G) Performance of soil aeration (SA). (H) Performance of soil bulk density (SBD). The horizontal axis indicates the depth of soil in centimeters. Two columns connected by a horizontal line with an asterisk above indicate significant differences (p < 0.05) between them.
Forests 14 00877 g001
Figure 2. Comparison of soil pH value and metal nutrient contents in different soil layers. (A) Differences in soil pH values of the three models in different soil layers. The same symbols in all panels in this figure have the same meaning. (B) Differences in soil Al ion contents. (C) Differences in soil Na ion contents. (D) Differences in soil Mg ion contents. (E) Differences in soil Fe ion contents. (F) Differences in soil Ca ion contents. The horizontal axis indicates the depth of soil in centimeters. Two columns connected by a horizontal line with an asterisk above indicates significant differences (p < 0.05) between them.
Forests 14 00877 g002
Figure 3. Comparison of soil primary nutrient contents in different soil layers. (A) Differences in total soil nitrogen (TN) contents in the three models in different soil layers. The horizontal axis indicates the depth of soil in centimeters. The same symbols in all panels in this figure have the same meaning. (B) Differences in total soil carbon (TC) contents. (C) Differences in soil organic matter (OM) contents. (D) Differences in soil’s available potassium (AK) contents. (E) Differences in available phosphorus (AP) contents. (F) Differences in soil’s total potassium (TK) contents. (G) Differences in soil’s total phosphorus (TP) contents. (H) Differences in soil’s carbon and nitrogen contents ratio (C/N). (I) Differences in soil’s carbon and phosphorus contents ratio (C/P). (J) Differences in soil’s nitrogen and phosphorus contents ratio (N/P). The horizontal axis indicates the depth of soil in centimeters. Two columns connected by a horizontal line with an asterisk above indicates significant differences (p < 0.05) between them.
Forests 14 00877 g003
Figure 4. Comparison of soil enzyme activities in different soil layers. (A) Comparison of polyphenol oxidase (PPO) activities in the three models in different soil layers. The horizontal axis indicates the depth of soil in centimeters. The same symbols in all panels in this figure have the same meaning. (B) Comparison of urease (URE) activities. (C) Comparison of catalase (CAT) activities. (D) Comparison of sucrose (SUC) activities. (E) Comparison of acid phosphatase (ACP) activities. The horizontal axis indicates the depth of soil in centimeters. Two columns connected by a horizontal line with an asterisk above indicates significant differences (p < 0.05) between them.
Forests 14 00877 g004
Figure 5. Soil bacterial diversity and functional enrichment. (A) Comparison of the diversity levels among the three models. The performance of OTUs, sequencing truthfulness (good coverage), diversity level (Simpson, Shannon, and PD-whole tree), and richness value (Ace and Chao) are shown in the histogram. (B) Ternary diagram for the distribution of soil bacteria relative abundance in different models. Different-colored dots represented the top ten bacterial genera with highest relative abundances. Their size represented the average abundance of the genera in the three models, and their locations were composed of the relative abundance proportion of the genera in the three models. The closer the dot was to the marked angle, the higher the proportion of this genera in the corresponding model. (C) Venn diagram showing the general quantities of the common/unique bacteria via marking numbers on the overlapping/non-overlapping parts. (D) Heat map of the soil bacterial function. Twenty functional pathways with the highest enriched level, which can be distinguished by the cell color, are shown.
Forests 14 00877 g005
Figure 6. Correlative analysis between soil properties and bacterial diversity at genus level. (A) Result of redundancy analysis (RDA). The red lines represent the regression direction and degree of the corresponding environmental factors. Only the factors with an envfit p value less than 0.05 are shown. (B) Histogram of the explanatory analysis. The height of the column indicates the explanatory level to which the corresponding environmental factors elucidate the difference in bacterial diversity. (C) Heatmap of the correlation between soil properties and top 20 highest relative abundant bacterial genera. Red cells represent a positive correlation, while blue cells represent a negative correlation. An asterisk in the cell indicates the significance level. One asterisk means the correlation between the corresponding factors performed significantly (p < 0.05), while three asterisks mean high significance (p < 0.01).
Forests 14 00877 g006
Figure 7. Soil fungal diversity and functional enrichment. (A) Comparison of the diversity levels among the three models. Performance of OTUs, sequencing truthfulness (good coverage), diversity level (Simpson, Shannon, and PD-whole tree), and richness value (Ace and Chao) are shown in the histogram. (B) Ternary diagram for the distribution of the relative abundance of soil fungi in different models. Different-colored dots represented the top 10 fungal genera with the highest relative abundances. Their size represented the average abundance of the genera in the three models, and their locations were composed of the relative abundance proportion of the genera in the three models. The closer the dot is to the marked angle, the higher the proportion of these genera in the corresponding model. (C) Venn diagram showing general quantities of the common/unique fungi via marking numbers on the overlapping/non-overlapping parts. (D) Heat map of the soil fungal function. Twenty functional pathways with the highest enriched level, which can be distinguished by the cell color, are shown.
Forests 14 00877 g007
Figure 8. Correlative analysis between soil properties and fungal diversity at genus level. (A) Result of redundancy analysis (RDA). The red lines represent the regression direction and degree of the corresponding environmental factors. Only the factors with an envfit p value less than 0.05 are shown. (B) Histogram of the explanatory analysis. The height of the column indicates the explanatory level to which the corresponding environmental factors explain the difference in fungal diversity. (C) Heatmap of the correlation between soil properties and top 20 highest relative abundant fungal genera. Red cells represent a positive correlation, while blue cells represent a negative correlation. Asterisks in the cell represent the significance level. One asterisk means the correlation between the corresponding factors performed significantly (p < 0.05), and three asterisks means a high significance (p < 0.01).
Forests 14 00877 g008
Disclaimer/Publisher’s Note: The statements, opinions and data contained in all publications are solely those of the individual author(s) and contributor(s) and not of MDPI and/or the editor(s). MDPI and/or the editor(s) disclaim responsibility for any injury to people or property resulting from any ideas, methods, instructions or products referred to in the content.

