Article

Influence of Natural and Man-Made Forests on Community Assembly and Species, Functional, and Soil Microbial Diversity

1
School of Agronomy and Life Sciences, Kunming University, Kunming 650214, China
2
Yunnan Key Laboratory for Plateau Mountain Ecology and Restoration of Degraded Environments, School of Ecology and Environmental Sciences, Yunnan University, Kunming 650091, China
3
Yunnan International Cooperative Center of Plateau Lake Ecological Restoration and Watershed Management & Yunnan Think Tank of Ecological Civilization, Kunming 650091, China
*
Author to whom correspondence should be addressed.
Forests 2023, 14(5), 888; https://doi.org/10.3390/f14050888
Submission received: 1 April 2023 / Revised: 23 April 2023 / Accepted: 24 April 2023 / Published: 26 April 2023
(This article belongs to the Topic Forest Ecosystem Restoration)

Abstract

:
Although an increasing amount of attention is being paid to how human activities alter plant communities, little is known about the consequences of these changes on species’ assemblages and biodiversity patterns. Using three forest types (a Pinus yunnanensis man-made forest; Eucalyptus smithii man-made forest; and natural secondary forest) in mid-Yunnan, China, we investigated the distribution patterns of species and traits and analyzed diversity patterns and relationships, including those between species diversity, functional diversity, and soil microbial diversity. We found that species co-occurrence patterns in the Pinus yunnanensis man-made forest and natural secondary forest were non-random. The specific leaf area in the Eucalyptus smithii man-made forest and leaf nitrogen concentration in the Pinus yunnanensis man-made forest were both over-dispersed according to the mean Euclidean neighbor distance in the trait space. The natural secondary forest had higher values of species diversity, functional diversity, community-weighted means, and soil microbial diversity than the man-made forest types did. An overall low covariation between species diversity and community-weighted means suggested that the coexistence of many species does not necessarily support functional differentiation among these species. Variance partitioning revealed that soil microbial diversity was mainly regulated by community-weighted means. In conclusion, our results suggest that the naturally recovering forest was better than man-made plantations based on biodiversity patterns.

1. Introduction

The overall goal of forest management is to maintain ecosystem services. The challenges to forest management have been exacerbated in recent decades as a result of multiple sources of pressure on forest ecosystems [1,2]. Effective ecological restoration is regarded as the most effective way to improve degraded sites or ecosystems [3,4]. However, current restoration strategies rely mainly on monospecific vegetation restoration, which leads to poor-efficiency ecosystem functions [5,6]. For example, the appearance of man-made Eucalyptus and Pinus forests after deforestation is common due to the fast growth of these trees in southern and southwestern China and the fact that they are considered the main vegetation restoration type in China [4]. However, the ecological impact of man-made forests compared to that of natural restoration has been regarded as a controversial topic globally. Some studies reported that man-made forests favor the regeneration and growth of underground species, accelerating community succession and ecological restoration [7]. On the contrary, many studies have found that man-made forests exhaust soil resources and lead to soil degradation [8,9]. Therefore, it is necessary to assess the ecological consequences of human-dominated ecosystem change.
Biodiversity, as an important role in maintain ecosystem functions and stability, has been considered an important criterion of successful ecological restoration. Variations in the distribution of organisms and patterns in the dispersion of plant species traits remain a fundamental issue in community ecology [10,11]. The two process categories of filtering and differentiation can be used to categorize ecological assembly rules [11]. Ecological filtering, which operates at the species level, assumes that coexisting species are more similar to one another than predicted by chance because environmental factors act as a filter, allowing only a small subset of species to survive [12]. On the other hand, through limiting similarity principles, biotic interactions are also in charge of reducing species richness at a small scale [13]. Trait dispersion can refer to some measures of a trait’s overall spread within a given unit of space or the evenness of trait spacing among co-occurring species [14]. For simplicity, we will refer to these patterns as trait dispersion. Ecological filtering occurs when only certain trait states are compatible with life in a specific habitat, resulting in under-dispersion. Ecological differentiation occurs when a species’ competition for environmental resources results in over-dispersion [14]. Despite the growing interest in assembly rules, little is known about how they change in natural and man-made communities.
Functional diversity (FD) describes the distribution of species in a functional trait space [15]. Moreover, the community-weighted means (CWMs) of some traits define the dominant functional trait value of a community [16] and are closely related to the mass ratio hypothesis, which proposes that functional traits primarily determine ecosystem processes and functioning [17]. Thus, FD and CWM, together with species diversity, are widely regarded as key diversity indices describing community structural and functional attributes. Several studies have found differences in species diversity and the FD or CWM of restored vegetation in various climates and land-cover types [18,19,20]; however, the relationship between species and functional diversity in ecosystems, which has significant implications for ecological restoration and management, is still not clear.
The soil microbial community is crucial for soil properties and processes and plays an important role in soil biogeochemical cycles [21,22]. In addition to soil physicochemical parameters, plant characteristics including plant community type and plant functional attributes can influence soil microbial community composition [23,24,25]. Fu et al. [26] demonstrated that site characteristics and tree species identity were more crucial in shaping the soil microbial community composition than tree species diversity was. Although earlier research in the subtropical plateau region of Southwest China has demonstrated that various vegetation restoration techniques affect plant community composition, soil nutrients, and ecosystem functions [27,28,29], how soil microbial communities respond to the difference in community functional characteristics in this region is still unclear.
In this study, we selected three forest types (PF, a Pinus yunnanensis man-made forest; EF, a Eucalyptus smithii man-made forest; and NSF, a natural secondary forest) to investigate differences in community assembly, species diversity, functional diversity, and soil microbial community diversity between natural and man-made forests. Our objectives were (1) to analyze the distribution patterns in three forest types at the species and trait levels, (2) to determine the effects of different forest types on species diversity, functional diversity, and soil microbial community diversity, and (3) to quantify the relationships among diversity indices.

2. Materials and Methods
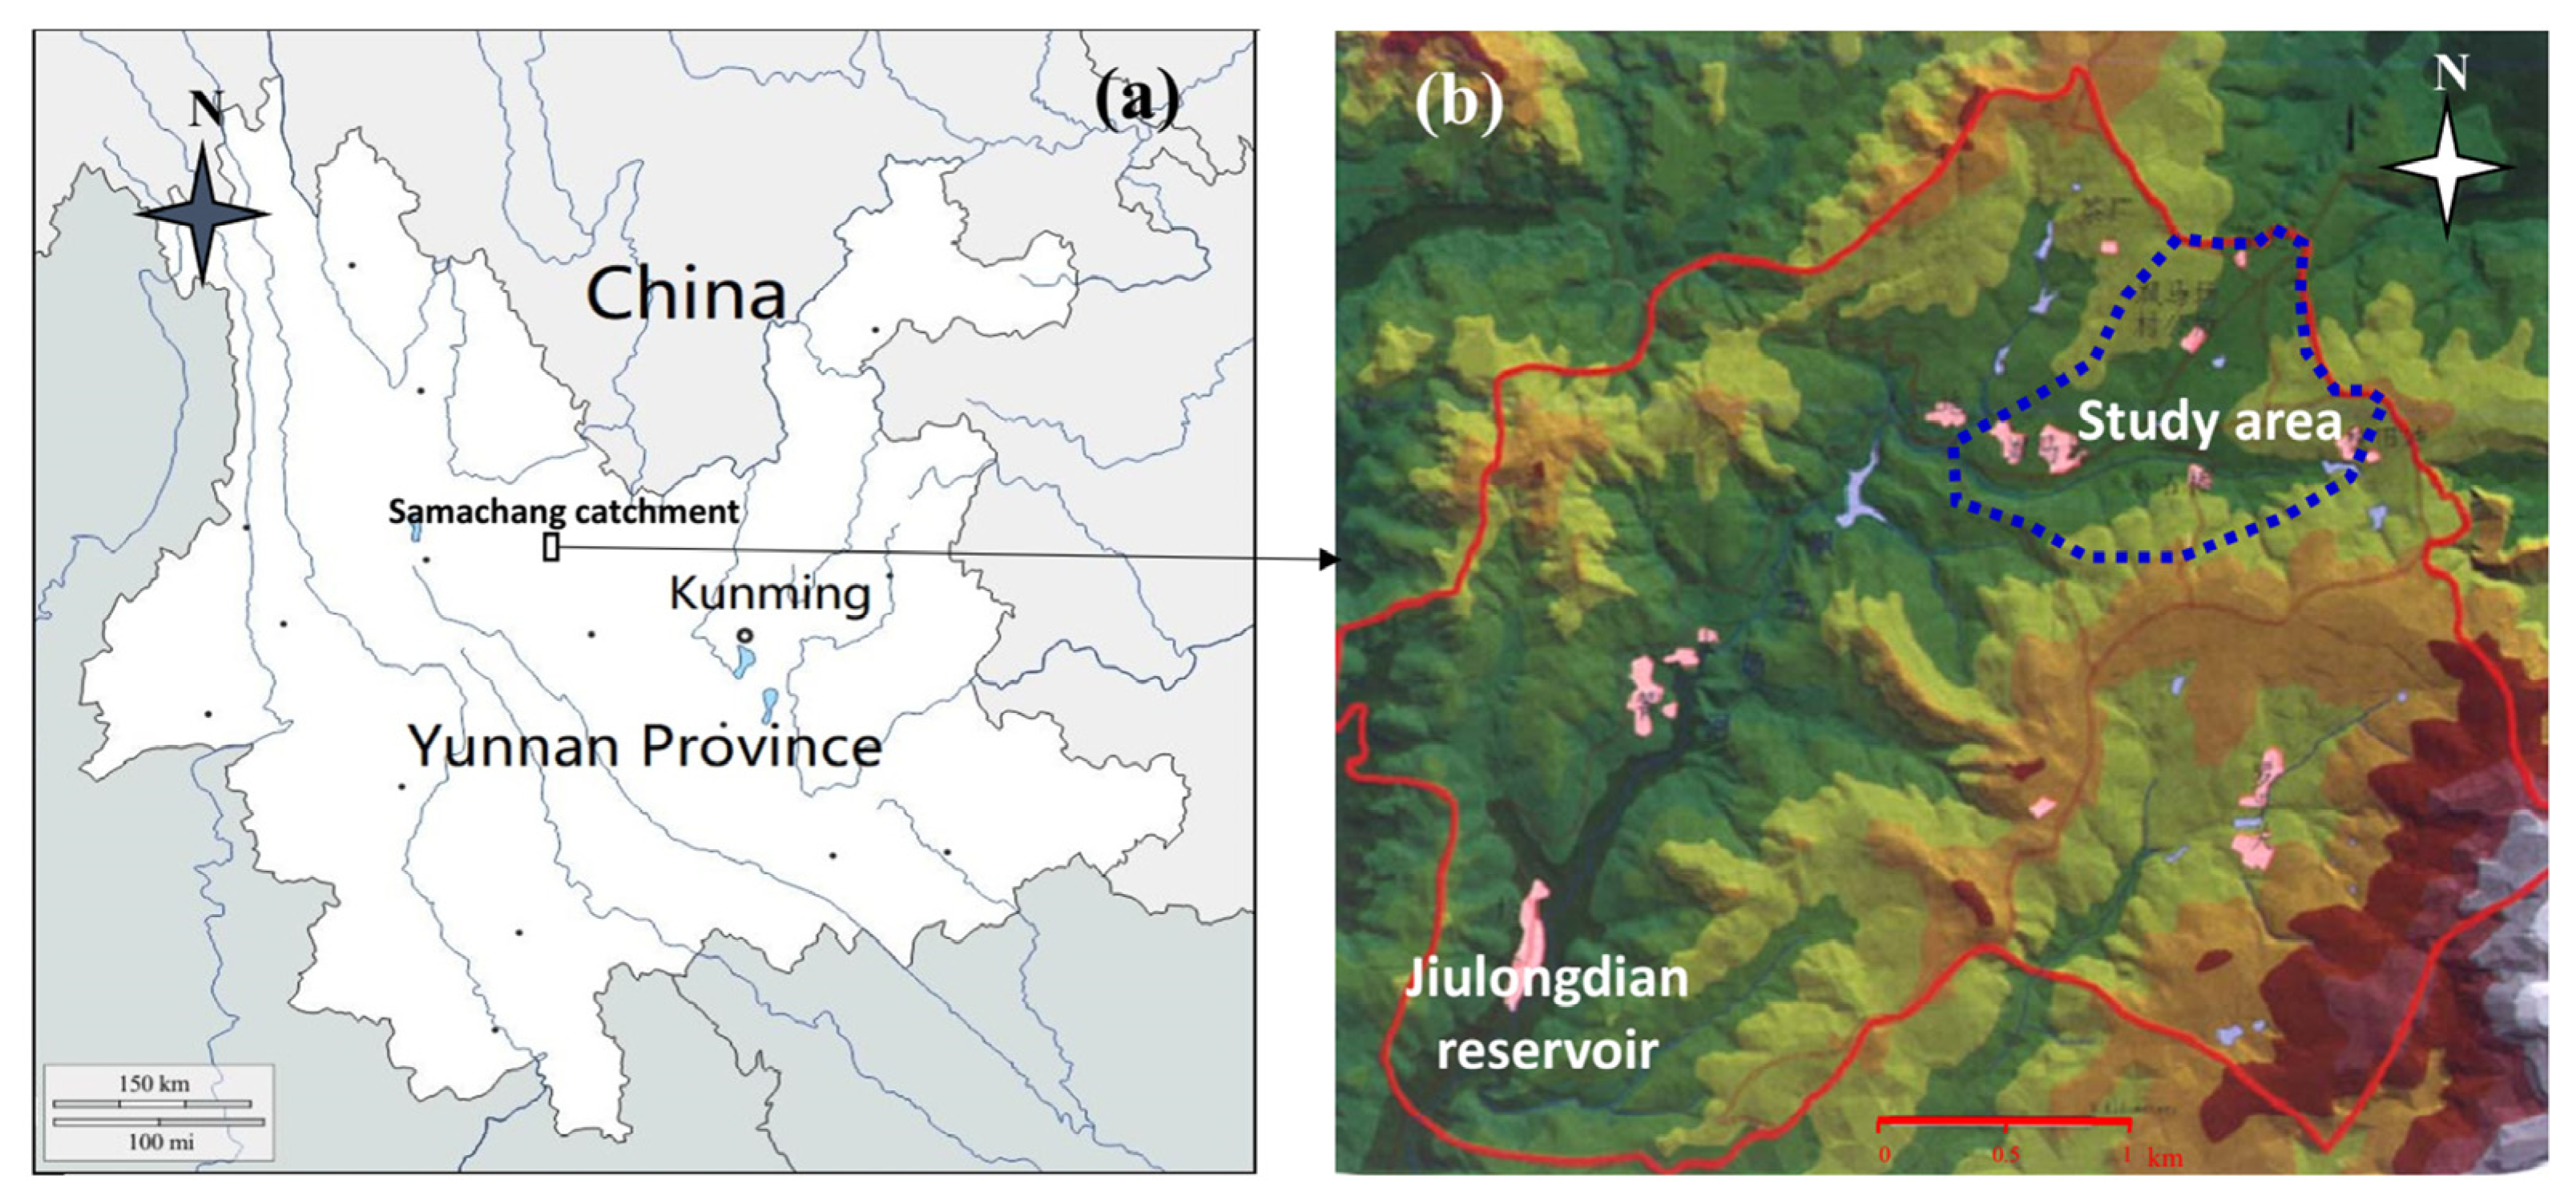
2.1. Study Site

Field work was carried out at the ecological observation station at the Samachang catchment (Figure 1), Mouding County (25°24′09″ N; 101°28′18″ E), approximately 200 km west of Kunming, the capital of Yunnan Province in China. The area has an average annual rainfall of 846 mm (it is in the mid-subtropical climate zone), and the rainy season lasts from May to October each year. The annual average temperature is 16 °C. The soils of the area are Cambisols (FAO/UNESCO classifications). The original vegetation was a subtropical evergreen broad-leaved forest, which has almost completely disappeared. In this area, we selected three forest restoration types: (1) a P. yunnanensis (native species) forest (PF) with a history of aerial planting on abandoned sites and a number of P. yunnanensis seedlings established after reforestation; (2) a E. smithii (introduced species) forest (EF) plantation planted on an abandoned field in 1991 with subsequent forest reservation; (3) and a natural secondary forest (NSF) dominated by Cyclobalanopsis glaucoldes and Keteleerla evekyniana, with a history of clear cutting, followed by a period of 30–35 years of uninterrupted forest restoration. Details of the plant community composition and structure characteristics are shown in Fu et al. [9,26].

2.2. Data Sampling Procedure

2.2.1. Plant Community Investigation and Species Diversity

In the study area, we randomly selected 10 plots (10 × 10 m) in each community type as observation samples. The space between plots was greater than 100 m to prevent spatial autocorrelation. On each sampling date, we collected two sets of data: each species was recorded as present (1) or absent (0) within each plot and was used in the analysis of co-occurrence and trait dispersion patterns. In the resulting matrix, each row represented a different species, and each column represented a different sample. The second dataset consisted of species abundance data, which were calculated based on the basal area in the synthetic inventory and used to assess the functional diversity of the plots. In the analyses, 32 species found in the 29 plots (i.e., observation plots) were used in the present matrix and trait matrix. Species diversity indices, including species richness (S), Shannon-Wiener diversity (H), and species evenness (E), were calculated using FDiversity software [30].

2.2.2. Community Functional Characteristics

Functional diversity was assessed on the basis of ecosystem functions of interest, e.g., plant growth and colonization, ecosystem productivity, nutrient cycling, and vegetation regeneration and succession. It was necessary to choose several traits that reflect these functions of interest but that are easily measurable. Following these criteria, five functional traits were selected: (1) leaf dry matter content (LDMC), which is an approximation of leaf issue density that is related to the potential relative growth rate and productivity [17,31]; (2) specific leaf area (SLA), which represents the light-intercepting area of a leaf per unit dry mass and is related to the net assimilation rate and nutrient cycling [14,29]; (3) plant height (H), which is associated with competitive vigor and plant fecundity [31,32]; (4) leaf nitrogen concentration (LNC), which is closely correlated with the maximum photosynthetic rate and nutritional quality [31]; and (5) seed mass, which is related to seed dispersion and seedling dynamics [31,32]. Functional traits were measured following standardized protocols [31]. Finally, functional richness (FRic), functional evenness (FEve), functional divergence (FDiv), Rao entropy, functional dispersion (FDis), and CWM were selected to indicate the functional characteristics of the three forests. The species diversity and all the indices of community’s functional attributes were calculated using FDiversity software [30].

2.2.3. Soil Microbial Community

Five soil cores (0–10 cm) were randomly taken in each plot. These cores were pooled and sieved (with a 2 mm mesh). The mixed sample was freeze-dried and then phospholipid fatty acid analysis was used to compare the biomass and composition of soil microbial community.The PLFAs were extracted from 4 g of soil with a chloroform:methanol:phosphate buffer mixture following the procedure described by Frostegård et al. [33]. The abundance of individual PLFAs, including bacteria, fungi, actinomycetes, arbuscular mycorrhizal fungi, and protozoa, was calculated, and then the Shannon-Wiener index (H), species richness index (S), and Pielou evenness index (J) were used to assess soil microbial diversity.

2.3. Data Analysis

2.3.1. Statistical Analyses of Co-Occurrence and Trait Dispersion

Randomization tests of null models using the Monte Carlo simulation were performed to understand species co-occurrence and plant trait dispersion patterns [11]. All the randomization tests of species co-occurrence were performed using Ecosim software [34], while all the analyses of trait dispersion were executed using Nellie: Ecological Null Models for PC [35].
To analyze the species co-occurrence pattern, we constructed presence–absence matrices for each sample. In such a matrix, the entries represent the absence (0) or presence (1) of a particular species in a particular sample. The observed data were compared to 10,000 randomizations in which the row sums (number of species counted) remained constant and the columns (species presence) were equiprobable. The checkerboard score (C-score) and variance ratio (V-ratio) were used to examine the randomization of species co-occurrence. Values of the C-score indicate species separation (association) [36], and the V-ratio is used to determine whether or not interactions constrain species richness [37]. We may anticipate that there is more species segregation in the observed communities than in the randomized communities if a community is shaped by interspecific rivalry. The observed V ratio is predicted to be lower in the observed communities than in the random communities if interactions constrain species richness [38].
Similarly to species association, trait dispersion was analyzed, but the comparison across samples was based on the position of the species in the trait space [11]. A total of 5000 randomizations were used for each Monte Carlo run. The mean nearest neighbor Euclidean distance (mNND) and minimum spanning tree (MST) were used to define the trait space volume [35]. The mNND measures species packing by the mean Euclidean distance of every species to its nearest neighbor in the trait space, so small values of mNND denote dense species packing. MST measures the total niche volume occupied by the shortest total Euclidean connection between species in a trait space. Weiher and Keddy predicted that the dispersion of traits will be suggestive of the degree to which these traits represent functional niche separation (over-dispersion) and a contraction of trait variation (under-dispersion) [39].

2.3.2. Analyses of the Relationship between Species Diversity and Functional Diversity

Species diversity, FD, and CWM values for the different forest types were compared using a one-way ANOVA and an LSD test. The relationship between species diversity and CWM was first analyzed using redundancy analysis (RDA), and then linear regressions were performed for each trait. In the regressions, we allowed the intercept values to float to determine whether or not the relationships between species diversity and CWM were positive. We then used t tests to determine if the slopes differed statistically from those generated by the null pseudo-community. Slope parameters that do not differ statistically indicate a slow saturation of functional diversity. To create each null pseudo-community (for each trait), we generated null datasets using EcoSim software. Randomization only reshuffles the CWM values, which is sufficient to scramble the pattern with respect to the species diversity values. The null hypothesis is that variation in the y variable is unrelated to that in the x variable. EcoSim provides a very simple regression test for continuous x and y variables. It fits a standard linear regression to the data and then uses randomization to test the null hypothesis that the slope, intercept, or correlation coefficient equals 0. In the regressions, we log10-transformed the CWM values to ensure that the assumptions of the linear regression were not violated.
To determine if relationships between species diversity and CWM differed among the three forest types, we transformed the species richness data to intercept the x axis at the grand mean number of species per plot, i.e., 10 species. We did this by subtracting 10 from each plot’s species count. Additionally, we then reran our regression analysis with floating intercepts to generate predicted values for each trait. The predicted values were the mean values of the CWM in a plot with 10 species. Using the predicted values, we ran ANOVAs for each trait. We ran analyses for a fixed number of species because the mean species count per plot in the different habitats did not differ significantly (9.5 ± 2.5, 10.4 ± 2.1 and 9.1 ± 2.3). This indicates that the differences in relationships among the forests are due to functional traits but not species patterns and that comparison at a fixed number of species is appropriate. A more detailed description of this analysis is given in Mayfield et al. [40].

2.3.3. Relationships between Soil Microbial Diversity and Species/Functional Diversity

Spearman correlations were first used to analyze relationships between soil microbial diversity and species/functional diversity. To quantify the relative importance of species diversity, FD, and CWMs to soil microbial community diversity, a variance partitioning analysis was performed in R v3.6.1 to illustrate the explanatory power of three matrices including species diversity, FD, and CWMs with anova.cca function [41].

3. Results

3.1. Species Co-Occurrence and Trait Dispersion

With the fixed equiprobable null model algorithm, the C-score in the simulated matrices were significantly greater than those in the observed matrices, for both PF and NSF, suggesting that species segregation occurred less in the observed community than that expected to occur by chance. The V-ratio was higher in the observations compared to the randomizations in both PF and NSF (Table 1). This suggests that variation in species richness was lower in the randomizations compared to that in the observed species matrix.
Analyses of each individual trait revealed a significant over-dispersion of SLA among species in EP and LNC in PF when the trait space was calculated as the mean Euclidean neighbor distance (mNND) (SLA: P = 0.0003; LNC: P = 0.0001). All trait dispersion values among species did not differ from what was expected by chance using the minimum spanning tree (MST).

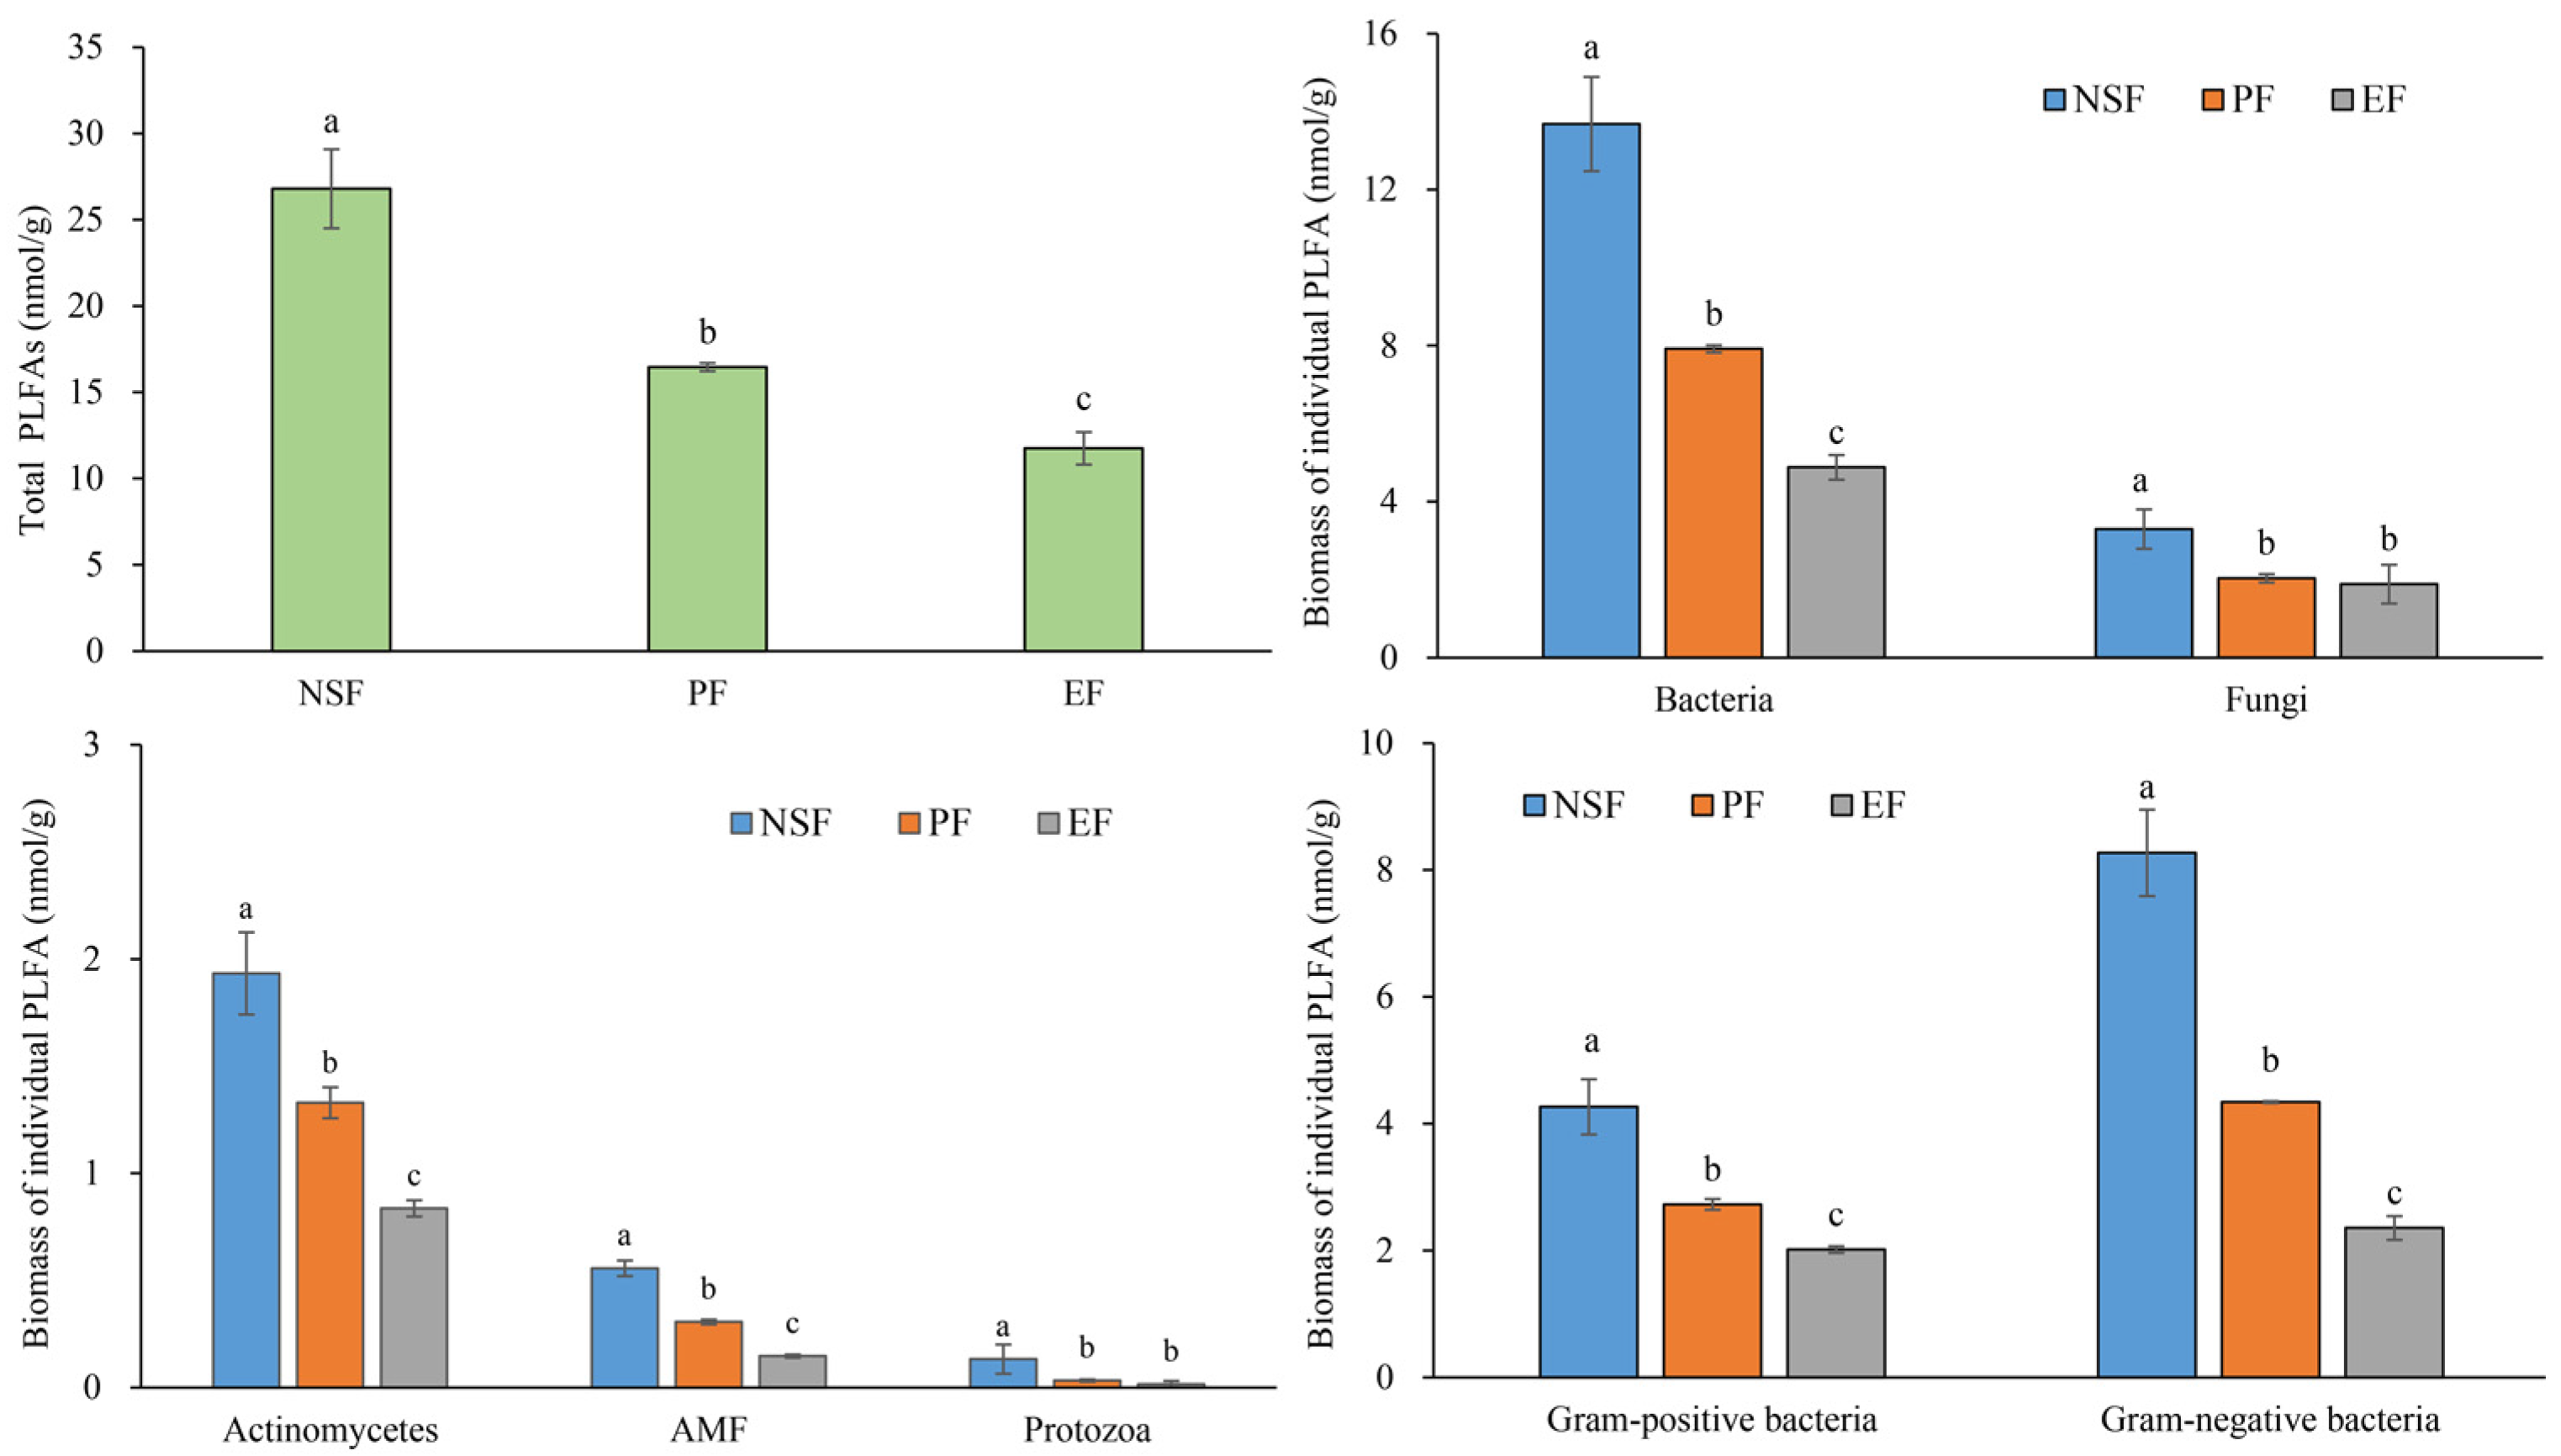
3.2. Species Richness, Functional Diversity, and Soil Microbial Diversity

The natural secondary forest displayed significantly higher values of species diversity (H and E) and FD (FRic, FDis, and Rao). There was no significant difference for species richness and FEve between the PF and EF. For CWMs, the PF had the highest CWM-SLA value and the lowest CWM-LDMC. The CWM-H indices showed significant differences among the forest types. The values of FDiv, CWM-LNC, and CWM-H in the EP were obviously higher than those in other forests (Table 2).
Results of soil microbial diversity showed that microbial species richness in the NSF was significantly higher than that in the man-made forests (PF and EF). There was no significant difference for the Shannon–Wiener index and Pielou evenness of the soil microbial community among the three forest types (Table 2). The total PLFAs and all the biomass of individual PLFA were significantly higher in soil of the NSF than in soil of the PF and EF (Figure 2), suggesting there was a higher soil microbial biomass in the natural forest compared to the man-made forests. Meanwhile, the significantly higher biomasses of the total PLFAs and individual PLFA in soil were also found in the PF compared to the EF except for fungi and protozoa (Figure 2).

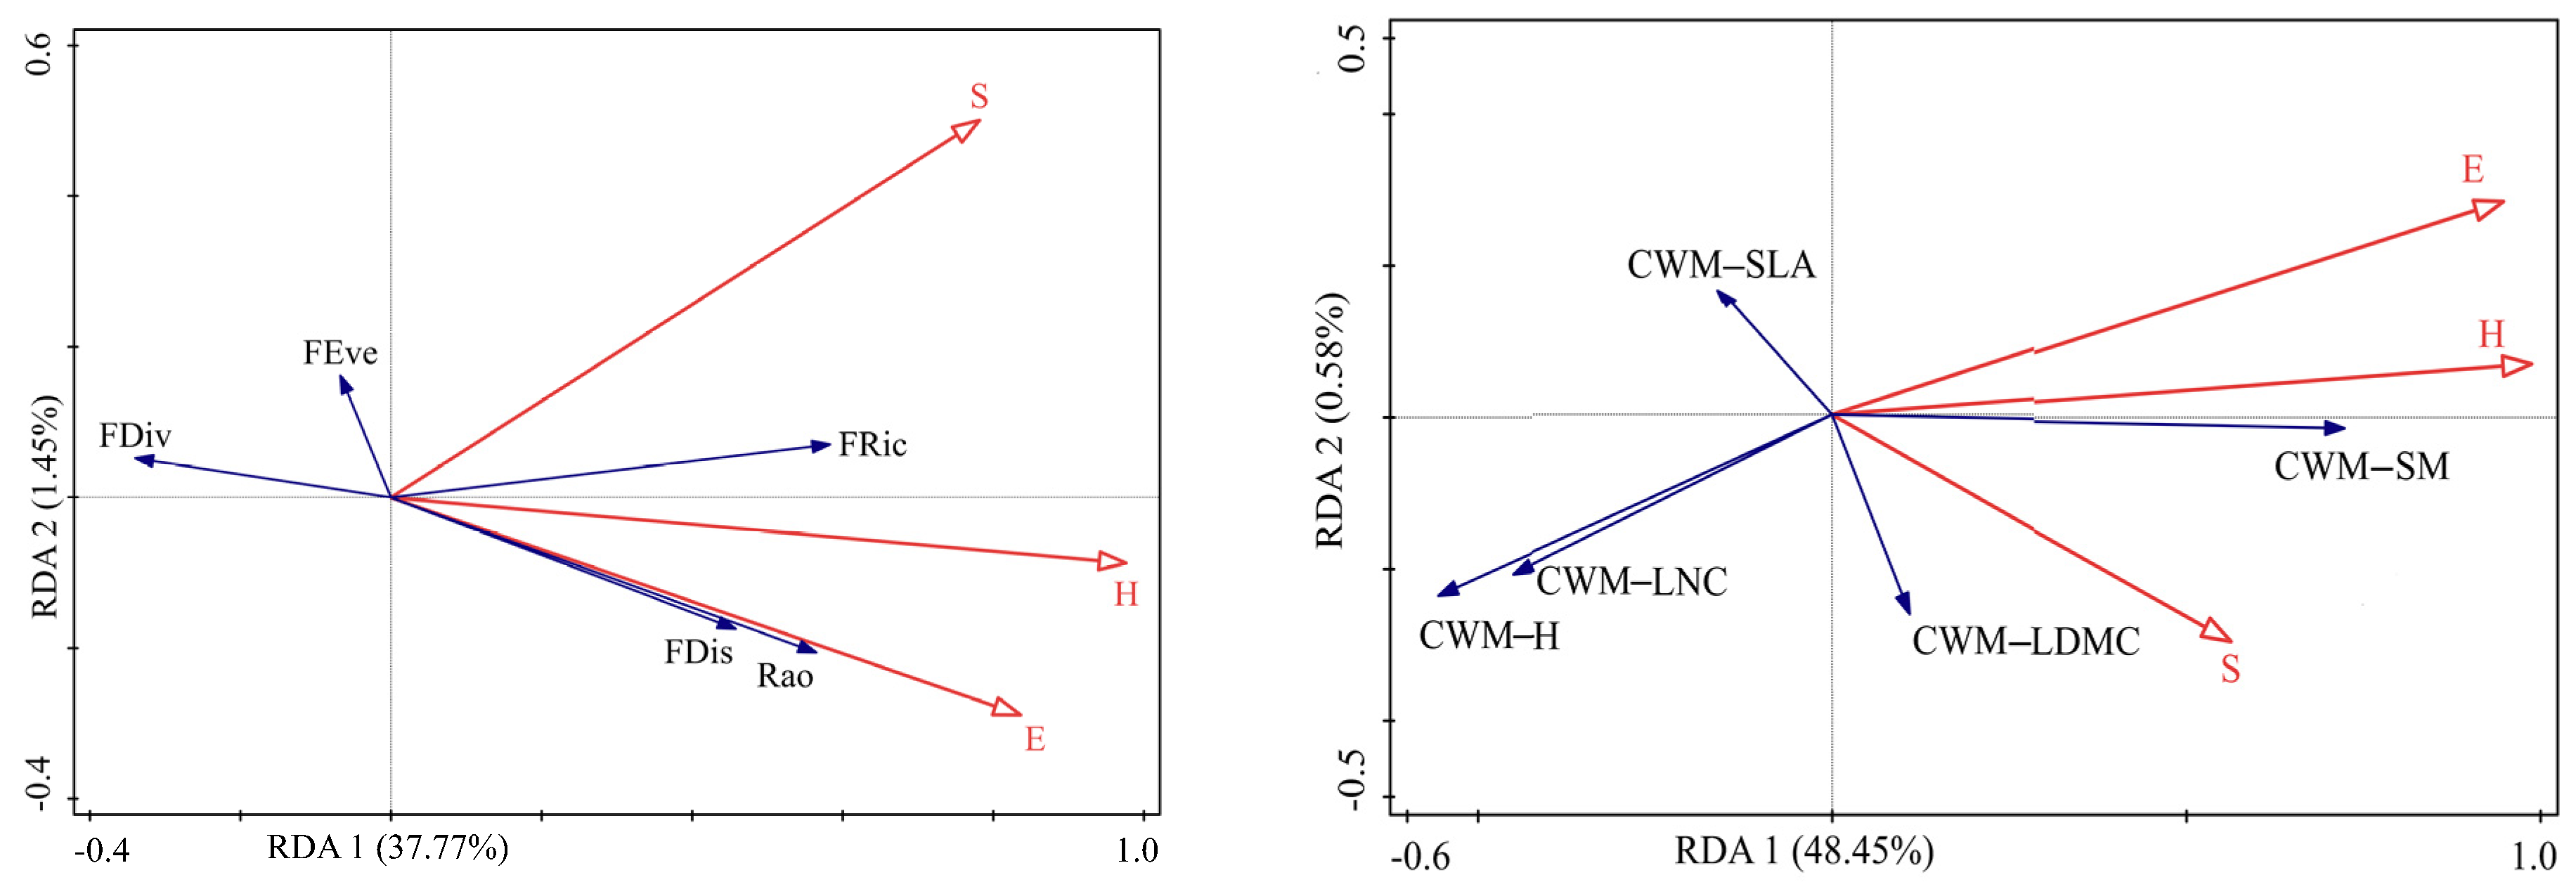
3.3. Relationships among Species Diversity, Functional Diversity, CWMs, and Soil Microbial Diversity

We found that relationships between species richness and CWM were vegetation type-dependent. There were significant slope values in the EF (for all traits except LDMC) and NSF (for all traits) and insignificant slope values in the PF (for all traits) (Table 3). All traits have positive linear species diversity relationships. Despite the consistently positive relationships, regressions for EF and NSF had slope parameters that differed statistically from zero (Table 3), indicating a rapid accumulation of functional diversity per added species. SLA in the PF fits the model poorly, so it was difficult to determine whether or not CWM exhibits a rapid addition with added species. Other traits fit the model well for three forest types. For all traits except LDMC, there was a higher CWM value per added species in the EF (Table 3).
The relationships between species richness, functional diversity, and CWMs are shown in Figure 3. Overall, the RDA results showed that the first two axes explained 34.22% of the FDs variance and 49.03% of the CWMs. For FD indices, species diversity (H, E, and S) was significantly correlated with FRic, Rao entropy, and FDis. For CWMs, we found that species diversity was closely and positively related to CWM-SM (Figure 3).
The redundancy analysis results showed that soil microbial community composition and diversity were significantly linked to species diversity (H and E), FDs (Rao entropy, FRic, and FDis), and the CWMs of SM, LNC, and H (Figure 4). The results of variation partitioning showed that species diversity and community functional attributes (FD and CWM) cooperatively explained a 93.65% variation in the soil microbial diversity across three restoration types, with species diversity, FD, and CWM alone explaining 13.17%, 8.85%, and 57.26% of the variation, respectively.

4. Discussion

4.1. Community Assembly at the Species and Trait Levels

The results of the analysis of the species co-occurrence pattern and species variability (V-ratio) indicate that ecological processes other than interspecific competition structure species coexistence and richness in these two vegetation types. The same result has been reported in several other studies on subtropical forests [42,43]. For example, the results of the analysis of the species co-occurrence pattern in the subtropical evergreen broadleaf forest in China indicated that habitat filtering influences distribution and regeneration patterns [43]. A possible explanation for this difference in species co-occurrence might be the different ecological processes that determine community structures in different habitats. In the PF, soil nutrients are poor due to severe soil and water loss in the wet season; thus, only some infertile and drought-tolerant species survive and grow [9]. High canopy density is one of the prominent characteristics of the habitats in the NSF, so shade-tolerant species might be able to establish themselves and survive [26]. It should also be noted that the species in these communities were unsaturated compared with those in the local climax communities. Thus, habitat filtering may play an important role in structuring communities. However, the EP and PF, as man-made forests, showed different species co-occurrence patterns. The habitats in the EP and PF are very similar, i.e., both experience severe soil and water loss [28]. However, the PF displayed a non-random pattern, while the EP did not. This randomness in the EP may be principally due to the biological characteristics of E. smithii and the site’s resource characteristics. There were a few species in the understory, and most species were in the early stage of migration and settlement because E. smithii, as an introduced species, has relatively strong allelopathic effects on other species and a higher growth ability in infertile habitats [27]. Thus, a non-random pattern of species co-occurrence was observed in the EF.
Using functional traits as a base could be another way to understand species coexistence processes. Several traits have been suggested as functional markers in the establishment and functioning of ecosystems [17]. Similarity between plant functional traits and aggregation patterns in a subtropical forest has been reported by Zhang et al. [44]. However, we found that only SLA in the EP and LNC in the PF were over-dispersed according to the mNND in this study. Over-dispersion of the mNND means that coexisting species might show some form of limiting similarity and that the examined traits of the coexisting species will not be saturated. Co-occurrent species in man-made forests with high SLA or LNC tend to have high growth rates, and thus intrerspecies competition for the utilization of resources may play a vital role in community assembly [8,44]. In addition, our results are not consistent with the results of the co-occurrence analysis, indicating that different assembly rules operate at different scales. Some studies have found that species co-occurrence patterns and community assembly are scale-dependent [44,45]. Thus, the central question for further research is no longer which assembly rule is operating but which rule has the strongest influence on the community structure given a certain scale of observation. Meanwhile, multi-scale study of species relationships can better predict species co-occurrence patterns. Another possible explanation for the discrepancy between species and trait levels might be the selection of traits. In the process of trait selection, we may have missed evidence of habitat filtering because we only used some interesting functional traits. Although we do not clearly understand the real reasons for the discrepancy, the results support the view that two assembly rules are not mutually exclusive and can operate simultaneously at the same or at different scales.

4.2. Difference in the Diversity Index between Natural and Man-Made Forests

Understanding species and functional diversity patterns in different ecosystems and how they are altered by humans is a critical step. In subtropical areas, there is an increasing amount of concern that man-made forests will dramatically alter the composition and functioning of ecosystems [28,46]. Our results show that man-made forests decrease species diversity (S, H, and E) and FD (FRic, FDis, and Rao entropy). Our results are consistent with other findings that taxonomic and functional diversity were influenced by different community restoration types or land use in different climatic zones [47,48]. Moreover, the CWMs of functional traits showed trait-specific responses among the three forest types.
In subtropical regions of China, the native fast-growing species P. yunnanensis is generally considered a pioneer of the succession stage of evergreen broad-leafed climax forests and can enhance succession and the development of species diversity [23]. Another fast-growing species, E. smithii, has strong allelopathic effects on other species and often impedes succession [49]. In contrast, tree species mixtures are characterized by varying attributes, including fast growth, slow growth, shade intolerance and shade tolerance [46]. Therefore, lower species diversity was found in the man-made forests (PF and EF) than in the NSF.
The composition of species with different habits in the NSF led to an increase in FD. A higher FRic value in the NSF indicated that more available niches were occupied in the community, thus enhancing species diversity [15]. The higher values of Rao and FDis in the NSF suggested greater niche differentiation, indicating the occurrence of contrasting leaf strategies [12]. The lower FRic, FDis, and Rao in the man-made forests suggested that more empty niches were available for species settlement and that ecological niche differentiation for existing species was relatively low.
In the present study, the CWMs for every trait displayed significant changes between the natural and man-made forests. Interspecific variation, intraspecific variation, or a mix of the two may be responsible for these alterations [17]. However, as previously demonstrated for some traits, intraspecific variability in the trait values of the dominant species was significantly smaller than interspecific variability [17,27]. Therefore, changes in the CWM may primarily be due to a community composition of common species with different trait values.
Soil microbial species richness in the NSF was significantly higher than that in the man-made forests (PF and EF). This result, in line with those of other studies, showed that soil microbial community composition is influenced by plant community types and plant functional traits [24,25,50]. The greater soil microbial richness in the NSF can be attributed to both the replacement of species and changes in the habitat’s conditions. The replacement of species with readily decomposable litter by those with more recalcitrant leaf litter can stimulate the growth in microbial biomass [51]. Moreover, most species in the NSF are strongly ectomycorrhizal or arbuscular mycorrhizal, such as plants belonging to the genera Cyclobalanopsis, Quercus, Pinus, and Keteleerla [52]. The reduced environmental disturbance in the NSF may also enhance the growth of microorganisms [53]. In contrast, the lower soil microbial richness in the man-made forests was due to the relatively low species diversity and poor soil resources.

4.3. Relationship between Species Diversity and Functional Diversity

Our study showed an overall low covariation between species and the CWM in the PF and NSF. This finding is in line with results reported by Mayfield et al. [40], suggesting that the mechanisms supporting the coexistence of many species do not necessarily support functional differentiation among these species. Meanwhile, the relationship between species and functional diversity depends strongly on the underlying mechanism acting to promote species coexistence [40]. When habitat filtering is the main driver of limitations on species richness, the coexisting species are functionally redundant, and their functional diversity tends to be relatively low. Conversely, when competition is the main driver of limitations in species richness, the coexisting species tend to be functionally complementary to prevent high levels of redundancy [54]. In other words, the slopes of the relationships between the changes in species richness and functional diversity depend on the assembly rules. In our study, the slopes of the relationships between the changes in species richness and CWMs based on plant height, leaf nitrogen concentration, and seed mass were higher in the EF than they were in the PF and NSF. The main reason for this pattern is that habitat filtering regulates species assemblies in the PF and NSF.

4.4. Relative Contributions of Species and Functional Diversity to Soil Microbial Diversity

Although significant correlations were found between soil microbial diversity and species diversity and FD, the CWM of traits made a greater contribution to soil microbial diversity. A previous study in the same area reported that the CWMs of plant functional traits are the most important factors in regulating soil microbial community characteristics [24,25]. The selected functional traits (such as LDMC, SLA, and LNC) are proxies for litter quality and decomposition capacity. Greater leaf quality and a quicker rate of litter decomposition are represented by higher values of SLA or LNC in man-made forests, which may result in a decline in SOC and soil microbial community diversity [26]. These findings also give support to the mass ratio hypothesis and imply that the functional characteristics of dominating species are the main determinants of soil microbial diversity. Several studies have found that dominant plant traits account for changes in soil ecosystem functioning, which is consistent with our findings. For example, Garnier et al. suggested using functional markers such as SLA, LDMC, and LNC to evaluate the effects of community changes on aboveground net primary productivity, litter decomposition, and soil nutrients [17]. Changes in soil microbial community composition and diversity are influenced by plant properties and soil physicochemical factors [21,22]. Although Fu et al. demonstrated that the combined effect of tree species identity and soil properties had a greater effect on the regulation of the soil microbial community structure than tree species diversity did across land restoration types in this region [23], the relative contributions of soil properties and functional diversity to the soil microbial community between natural and man-made forests need further investigation and evaluation.

5. Conclusions

Our results suggest that ecological processes structure species coexistence and richness in these two vegetation types at the species scale. However, trait dispersion displayed different assembly rules at the trait scale. These results indicate that ecological processes and interspecific competition are not mutually exclusive and can operate simultaneously. The man-made forests (Pinus yunnanensis forest and Eucalyptus smithii forest) and natural secondary forest displayed significantly different patterns of species coexistence, functional attributes, and soil microbial diversity. The natural secondary forest had higher species diversity, functional diversity, community-weighted means, and soil microbial diversity than the man-made forest did. An overall low covariation between species diversity and the community-weighted mean suggested that the coexistence of many species does not necessarily support functional differentiation among these species. Moreover, variance partitioning revealed that soil microbial diversity was mainly regulated by the community-weighted mean. On the whole, our results indicate that natural forests were better than man-made plantations based on biodiversity patterns.

Author Contributions

Conceptualization, X.W. and D.F.; methodology, X.W.; validation, All authors; formal analysis, C.S. and X.M.; investigation, data curation; resources, L.H., X.M.; data curation, X.W. and D.F.; writing—original draft preparation, X.W.; writing—review and editing, D.F.; visualization, All authors; supervision, D.F.; project administration, D.F.; funding acquisition, D.F. All authors have read and agreed to the published version of the manuscript.

Funding

This research was funded by the Special Basic Cooperative Programs of Yunnan Provincial Undergraduate Universities’ Association (202101BA070001-154), the National Natural Science Foundation of China (42267051), Yunnan Fundamental Research Projects (202301AS070038), and Undergraduate Training Program on Innovation and Entrepreneurship (S202211393056).

Data Availability Statement

Not applicable.

Conflicts of Interest

The authors declare no conflict of interest.

References

  1. Doran, J.W.; Zeiss, M.R. Soil Health and Sustainability: Managing the Biotic Component of Soil Quality. Appl. Soil Ecol. 2000, 15, 3–11. [Google Scholar] [CrossRef]
  2. Vörösmarty, C.J.; McIntyre, P.B.; Gessner, M.O.; Dudgeon, D.; Prusevich, A.; Green, P.; Glidden, S.; Bunn, S.E.; Sullivan, C.A.; Liermann, C.R.; et al. Global Threats to Human Water Security and River Biodiversity. Nature 2010, 467, 555–561. [Google Scholar] [CrossRef]
  3. Cerdà, A.; Lucas-Borja, M.E.; Franch-Pardo, I.; Úbeda, X.; Novara, A.; López-Vicente, M.; Popović, Z.; Pulido, M. The Role of Plant Species on Runoff and Soil Erosion in a Mediterranean Shrubland. Sci. Total Environ. 2021, 799, 149218. [Google Scholar] [CrossRef]
  4. Fu, D.; Wu, X.; Duan, C.; Chadwick, D.R.; Jones, D.L. Response of Soil Phosphorus Fractions and Fluxes to Different Vegetation Restoration Types in a Subtropical Mountain Ecosystem. CATENA 2020, 193, 104663. [Google Scholar] [CrossRef]
  5. Tang, C.Q.; Hou, X.; Gao, K.; Xia, T.; Duan, C.; Fu, D. Man-Made versus Natural Forests in Mid-Yunnan, Southwestern China. Mt. Res. Dev. 2007, 27, 242–249. [Google Scholar] [CrossRef]
  6. Cao, S.; Chen, L.; Yu, X. Impact of China’s Grain for Green Project on the Landscape of Vulnerable Arid and Semi-arid Agricultural Regions: A Case Study in Northern Shaanxi Province. J. Appl. Ecol. 2009, 46, 536–543. [Google Scholar] [CrossRef]
  7. Geldenhuys, C.J. Native Forest Regeneration in Pine and Eucalypt Plantations in Northern Province, South Africa. For. Ecol. Manag. 1997, 99, 101–115. [Google Scholar] [CrossRef]
  8. Fu, D.; Wu, X.; Huang, N.; Duan, C. Effects of the Invasive Herb Ageratina Adenophora on Understory Plant Communities and Tree Seedling Growth in Pinus yunnanensis Forests in Yunnan, China. J. For. Res. 2018, 23, 112–119. [Google Scholar] [CrossRef]
  9. Widyati, E.; Nuroniah, H.S.; Tata, H.L.; Mindawati, N.; Lisnawati, Y.; Abdulah, L.; Lelana, N.E.; Octavia, D.; Prameswari, D.; Rachmat, H.H. Soil Degradation Due to Conversion from Natural to Plantation Forests in Indonesia. Forests 2022, 13, 1913. [Google Scholar] [CrossRef]
  10. Dupré, C.; Ehrlén, J. Habitat Configuration, Species Traits and Plant Distributions. J. Ecol. 2002, 90, 796–805. [Google Scholar] [CrossRef]
  11. Weiher, E.; Clarke, G.D.P.; Keddy, P.A. Community Assembly Rules, Morphological Dispersion, and the Coexistence of Plant Species. Oikos 1998, 81, 309–322. [Google Scholar] [CrossRef]
  12. Zobel, M. The Relative of Species Pools in Determining Plant Species Richness: An Alternative Explanation of Species Coexistence? Trends Ecol. Evol. 1997, 12, 266–269. [Google Scholar] [CrossRef]
  13. MacArthur, R.; Levins, R. The limiting Similarity Convergence and Divergence of Coexisting Species. Am. Nat. 1967, 101, 377–385. [Google Scholar] [CrossRef]
  14. Schamp, B.S.; Chau, J.; Aarssen, L.W. Dispersion of Traits Related to Competitive Ability in an Old-field Plant Community. J. Ecol. 2008, 96, 204–212. [Google Scholar] [CrossRef]
  15. Mason, N.W.H.; Mouillot, D.; Lee, W.G.; Wilson, J.B. Functional Richness, Functional Evenness and Functional Divergence: The Primary Components of Functional Diversity. Oikos 2005, 111, 112–118. [Google Scholar] [CrossRef]
  16. Lavorel, S.; Grigulis, K.; McIntyre, S.; Williams, N.S.G.; Garden, D.; Dorrough, J.; Berman, S.; Quétier, F.; Thébault, A.; Bonis, A. Assessing Functional Diversity in the Field–Methodology Matters! Funct. Ecol. 2008, 22, 134–147. [Google Scholar] [CrossRef]
  17. Garnier, E.; Cortez, J.; Billès, G.; Navas, M.-L.; Roumet, C.; Debussche, M.; Laurent, G.; Blanchard, A.; Aubry, D.; Bellmann, A.; et al. Plant Functional Markers Capture Ecosystem Properties during Secondary Succession. Ecology 2004, 85, 2630–2637. [Google Scholar] [CrossRef]
  18. Strahan, R.T.; Sánchez Meador, A.J.; Huffman, D.W.; Laughlin, D.C. Shifts in Community-level Traits and Functional Diversity in a Mixed Conifer Forest: A Legacy of Land-use Change. J. Appl. Ecol. 2016, 53, 1755–1765. [Google Scholar] [CrossRef]
  19. Liu, Z.; Li, Z.; Castro, D.M.P.; Tan, X.; Jiang, X.; Meng, X.; Ge, Y.; Xie, Z. Effects of Different Types of Land-Use on Taxonomic and Functional Diversity of Benthic Macroinvertebrates in a Subtropical River Network. Environ. Sci. Pollut. Res. 2021, 28, 44339–44353. [Google Scholar] [CrossRef]
  20. Laughlin, D.C.; Strahan, R.T.; Moore, M.M.; Fulé, P.Z.; Huffman, D.W.; Covington, W.W. The Hierarchy of Predictability in Ecological Restoration: Are Vegetation Structure and Functional Diversity More Predictable than Community Composition? J. Appl. Ecol. 2017, 54, 1058–1069. [Google Scholar] [CrossRef]
  21. Khlifa, R.; Paquette, A.; Messier, C.; Reich, P.B.; Munson, A.D. Do Temperate Tree Species Diversity and Identity Influence Soil Microbial Community Function and Composition? Ecol. Evol. 2017, 7, 7965–7974. [Google Scholar] [CrossRef] [PubMed]
  22. Wardle, D.A.; Bardgett, R.D.; Klironomos, J.N.; Setälä, H.; van der Putten, W.H.; Wall, D.H. Ecological Linkages Between Aboveground and Belowground Biota. Science 2004, 304, 1629–1633. [Google Scholar] [CrossRef] [PubMed]
  23. Bauhus, J.; Paré, D.; Côté, L. Effects of Tree Species, Stand Age and Soil Type on Soil Microbial Biomass and Its Activity in a Southern Boreal Forest. Soil Biol. Biochem. 1998, 30, 1077–1089. [Google Scholar] [CrossRef]
  24. de Vries, F.T.; Manning, P.; Tallowin, J.R.B.; Mortimer, S.R.; Pilgrim, E.S.; Harrison, K.A.; Hobbs, P.J.; Quirk, H.; Shipley, B.; Cornelissen, J.H.C.; et al. Abiotic Drivers and Plant Traits Explain Landscape-Scale Patterns in Soil Microbial Communities. Ecol. Lett. 2012, 15, 1230–1239. [Google Scholar] [CrossRef] [PubMed]
  25. Pei, Z.; Eichenberg, D.; Bruelheide, H.; Kröber, W.; Kühn, P.; Li, Y.; von Oheimb, G.; Purschke, O.; Scholten, T.; Buscot, F.; et al. Soil and Tree Species Traits Both Shape Soil Microbial Communities during Early Growth of Chinese Subtropical Forests. Soil Biol. Biochem. 2016, 96, 180–190. [Google Scholar] [CrossRef]
  26. Fu, D.; Wu, X.; Duan, C.; Smith, A.R.; Jones, D.L. Traits of Dominant Species and Soil Properties Co-Regulate Soil Microbial Communities across Land Restoration Types in a Subtropical Plateau Region of Southwest China. Ecol. Eng. 2020, 153, 105897. [Google Scholar] [CrossRef]
  27. Fu, D.; Duan, C.; Hou, X.; Xia, T.; Gao, K. Patterns and Relationships of Plant Traits, Community Structural Attributes, and Eco-Hydrological Functions during a Subtropical Secondary Succession in Central Yunnan (Southwest China). Arch. Biol. Sci. 2009, 61, 741–749. [Google Scholar] [CrossRef]
  28. Fu, D.; Wu, X.; Duan, C.; Guan, Q.; Huang, N. Changes in Functional Structure Characteristics Mediate Ecosystem Functions during Human-Induced Land-Cover Alteration: A Case Study in Southwest China. J. Soil Water Conserv. 2018, 73, 461–468. [Google Scholar] [CrossRef]
  29. Hou, X.; Duan, C.; Tang, C.Q.; Fu, D. Nutrient Relocation, Hydrological Functions, and Soil Chemistry in Plantations as Compared to Natural Forests in Central Yunnan, China. Ecol. Res. 2010, 25, 139–148. [Google Scholar] [CrossRef]
  30. Casanoves, F.; Pla, L.; Di Rienzo, J.A.; Díaz, S. FDiversity: A Software Package for the Integrated Analysis of Functional Diversity. Methods Ecol. Evol. 2011, 2, 233–237. [Google Scholar] [CrossRef]
  31. Cornelissen, J.H.C.; Lavorel, S.; Garnier, E.; Díaz, S.; Buchmann, N.; Gurvich, D.E.; Reich, P.B.; ter Steege, H.; Morgan, H.D.; van der Heijden, M.G.A.; et al. A Handbook of Protocols for Standardised and Easy Measurement of Plant Functional Traits Worldwide. Aust. J. Bot. 2003, 51, 335–380. [Google Scholar] [CrossRef]
  32. Vile, D.; Shipley, B.; Garnier, E. A Structural Equation Model to Integrate Changes in Functional Strategies during Old-Field Succession. Ecology 2006, 87, 504–517. [Google Scholar] [CrossRef]
  33. Frostegård, Å.; Tunlid, A.; Bååth, E. Phospholipid Fatty Acid Composition, Biomass, and Activity of Microbial Communities from Two Soil Types Experimentally Exposed to Different Heavy Metals. Appl. Environ. Microbiol. 1993, 59, 3605–3617. [Google Scholar] [CrossRef] [PubMed]
  34. Gotelli, N.J. EcoSim: Null Models Software for Ecology. Version 7. Acquired Intelligence Inc. and Kesey-Bear. 2009. Available online: http//garyentsminger.com/ecosim.htm (accessed on 31 January 2015).
  35. Swenson, T.W.E.; Weiher, E. Nellie: Null Models for the PC; University of Wisconsin Eau-Claire: Eau Claire, WI, USA, 2000. [Google Scholar]
  36. Stone, L.; Roberts, A. The Checkerboard Score and Species Distributions. Oecologia 1990, 85, 74–79. [Google Scholar] [CrossRef]
  37. Schluter, D. A Variance Test for Detecting Species Associations, with Some Example Applications. Ecology 1984, 65, 998–1005. [Google Scholar] [CrossRef]
  38. Gotelli, N.J. Null Model Analysis of Species Co-occurrence Patterns. Ecology 2000, 81, 2606–2621. [Google Scholar] [CrossRef]
  39. Weiher, E.; Keddy, P.A. Assembly Rules, Null Models, and Trait Dispersion: New Questions from Old Patterns. Oikos 1995, 74, 159–164. [Google Scholar] [CrossRef]
  40. Mayfield, M.M.; Boni, M.F.; Daily, G.C.; Ackerly, D. Species and Functional Diversity of Native and Human-dominated Plant Communities. Ecology 2005, 86, 2365–2372. [Google Scholar] [CrossRef]
  41. R Core Team. R: A Language and Environment for Statistical Computing; R Foundation for Statistical Computing: Vienna, Austria, 2017. [Google Scholar]
  42. Bar-Massada, A.; Yang, Q.; Shen, G.; Wang, X. Tree Species Co-occurrence Patterns Change across Grains: Insights from a Subtropical Forest. Ecosphere 2018, 9, e02213. [Google Scholar] [CrossRef]
  43. Tian, K.; Chen, L.; Mi, X.; Ma, K.P.; Chen, J.H. The Effect of Habitat Filtering on Tree Seedling Distribution in a Subtropical Evergreen Broadleaf Forest in China. Chin. Sci. Bull. 2013, 58, 3561–3569. [Google Scholar]
  44. Zhang, B.; Lu, X.; Jiang, J.; DeAngelis, D.L.; Fu, Z.; Zhang, J. Similarity of Plant Functional Traits and Aggregation Pattern in a Subtropical Forest. Ecol. Evol. 2017, 7, 4086–4098. [Google Scholar] [CrossRef] [PubMed]
  45. Zhang, J.; Hao, Z.; Song, B.; Li, B.; Wang, X.; Ye, J. Fine-Scale Species Co-Occurrence Patterns in an Old-Growth Temperate Forest. For. Ecol. Manag. 2009, 257, 2115–2120. [Google Scholar] [CrossRef]
  46. Tang, C.Q.; Zhao, M.-H.; Li, X.-S.; Ohsawa, M.; Ou, X.-K. Secondary Succession of Plant Communities in a Subtropical Mountainous Region of SW China. Ecol. Res. 2010, 25, 149–161. [Google Scholar] [CrossRef]
  47. Ibsen, P.C.; Borowy, D.; Rochford, M.; Swan, C.M.; Jenerette, G.D. Influence of Climate and Management on Patterns of Taxonomic and Functional Diversity of Recreational Park Vegetation. Front. Ecol. Evol. 2020, 8, 501502. [Google Scholar] [CrossRef]
  48. Dai, X.; Chen, C.; Li, Z.; Wang, X. Taxonomic, Phylogenetic, and Functional Diversity of Ferns at Three Differently Disturbed Sites in Longnan County, China. Diversity 2020, 12, 135. [Google Scholar] [CrossRef]
  49. Zhang, C.; Li, X.; Chen, Y.; Zhao, J.; Wan, S.; Lin, Y.; Fu, S. Effects of Eucalyptus Litter and Roots on the Establishment of Native Tree Species in Eucalyptus Plantations in South China. For. Ecol. Manag. 2016, 375, 76–83. [Google Scholar] [CrossRef]
  50. Fu, D.; Wu, X.; Qiu, Q.; Duan, C.; Jones, D.L. Seasonal Variations in Soil Microbial Communities under Different Land Restoration Types in a Subtropical Mountains Region, Southwest China. Appl. Soil Ecol. 2020, 153, 103634. [Google Scholar] [CrossRef]
  51. Yannikos, N.; Leinweber, P.; Helgason, B.L.; Baum, C.; Walley, F.L.; Rees, K.C.J. Van Impact of Populus Trees on the Composition of Organic Matter and the Soil Microbial Community in Orthic Gray Luvisols in Saskatchewan (Canada). Soil Biol. Biochem. 2014, 70, 5–11. [Google Scholar] [CrossRef]
  52. Tedersoo, L.; Brundrett, M.C. Evolution of Ectomycorrhizal Symbiosis in Plants. In Biogeography of Mycorrhizal Symbiosis; Tedersoo, L., Ed.; Springer International Publishing: Cham, Switzerland, 2017; pp. 407–467. ISBN 978-3-319-56363-3. [Google Scholar]
  53. Strickland, M.S.; Rousk, J. Considering Fungal:Bacterial Dominance in Soils–Methods, Controls, and Ecosystem Implications. Soil Biol. Biochem. 2010, 42, 1385–1395. [Google Scholar] [CrossRef]
  54. Fukami, T.; Martijn Bezemer, T.; Mortimer, S.R.; van der Putten, W.H. Species Divergence and Trait Convergence in Experimental Plant Community Assembly. Ecol. Lett. 2005, 8, 1283–1290. [Google Scholar] [CrossRef]
Figure 1. The study area map. (a) location of the study area, (b) catchment of the study area. Red solid wire frame and blue dotted wire frame indicate the catchment area and study area, respectively.
Forests 14 00888 g001
Figure 2. Total phospholipid fatty acid (PLFA) concentration and the biomass of soil microbial groups under different forest types. Different letters represent significant differences at the 0.05 level among three forest types. NSF: natural secondary forest; PF: Pinus yunnanensis forest; EF: Eucalyptus smithii forest.
Forests 14 00888 g002
Figure 3. Redundancy analysis (RDA) of species diversity (S, H, and E) and functional attributes (FD and CWM) in three vegetation restoration types. S: species richness; H: Shannon–Wiener index; E: species evenness; FRic: functional richness; FEve: functional evenness; FDiv: functional divergence; FDis: functional dispersion; Rao: Rao entropy; CWM: community-weighted mean; LDMC: leaf dry matter content; SLA: specific leaf area; H: height; LNC: leaf nitrogen concentration; SM: seed mass. The blue and red arrows represent functional attributes indices and species diversity indices, respectively.
Forests 14 00888 g003
Figure 4. Redundancy analysis (RDA) of soil microbial community attributes (composition and diversity), vegetation species diversity (S, H, and E) and functional attributes (functional diversity and community-weighted means) in three vegetation restoration types. J (microbial), H (microbial), and S (microbial) represent the Pielou evenness index, Shannon–Wiener index, and richness index of the soil microbial community, respectively. S: species richness; H: Shannon–Wiener index; E: species evenness; J: Pielou evenness; FRic: functional richness; FEve: functional evenness; FDiv: functional divergence; FDis: functional dispersion; Rao: Rao entropy; CWM: community-weighted mean; LDMC: leaf dry matter content; SLA: specific leaf area; H: height; LNC: leaf nitrogen concentration; SM: seed mass.
Forests 14 00888 g004
Table 1. Co-occurrence patterns (C-score and V-ratio) of three vegetation types using fixed equiprobable null models and two co-occurrence indices.
Null ModelObserved IndexMean of Simulated IndicesSESp
C-score
Pinus yunnanensis forest4.465.1−1.830.045
Eucalyptus smithii forest5.075.25−0.510.722
 Natural secondary forest5.577.33−3.750.000
V-ratio
Pinus yunnanensis forest1.820.992.300.026
Eucalyptus smithii forest1.221.000.590.272
 Natural secondary forest2.551.004.300.000
Significant p values are in bold. p: tail probability that the observed index is more or less than that expected by chance; SES: standardized size effect, calculated as observed index—mean (simulated indices)/standard deviation (simulated indices).
Table 2. Species diversity, functional diversity, community-weighted means of traits, and soil microbial composition diversity in three restoration types.
Diversity IndicesNSFPFEF
Species diversity indices
 Species richness (S) 10.50 ± 2.27 a9.50 ± 2.46 a9.11 ± 2.32 a
 Shannon-Wiener index (H)1.44 ± 0.27 a1.15 ± 0.29 b0.95 ± 0.20 b
 Species evenness (E)0.62 ± 0.09 a0.51 ± 0.12 b0.43 ± 0.04 b
Functional diversity indices
 Functional richness (FRic) §17.41 ± 1.29 a11.42 ± 2.68 b13.61 ± 3.59 b
 Functional evenness (FEve)0.45 ± 0.11 a0.50 ± 0.11 a0.51 ± 0.12 a
 Functional divergence (FDiv)0.44 ± 0.18 b0.47 ± 0.10 b0.79 ± 0.25 a
 Functional dispersion (FDis) §5.97 ± 0.30 a3.97 ± 0.54 b4.50 ± 0.55 b
 Rao entropy §12.52 ± 0.60 a8.82 ± 1.26 b9.98 ± 1.64 b
Community-weighted means (CWM)
 CWM-LDMC410.4 ± 14.3 a329.2 ± 9.1 b419.4 ± 6.57 a
 CWM-SLA7.96 ± 1.01 b16.10 ± 1.89 a7.34 ± 1.15 b
 CWM-H6.74 ± 1.47 b5.51 ± 0.58 c18.28 ± 1.06 a
 CWM-LNC9.14 ± 0.19 b8.78 ± 0.55 b13.64 ± 0.69 a
 CWM-SM632.1 ± 86.9 a40.7 ± 27.2 b42.1 ± 61.5 b
Soil microbial composition diversity
 Shannon-Wiener index (H)3.81 ± 0.75 a3.81 ± 0.716 a3.78 ± 0.71 a
 Species richness (S)48.50 ± 1.71 a43.67 ± 1.70 b42.67 ± 1.80 b
 Pielou evenness (J)0.98 ± 0.18 a1.01 ± 0.19 a1.01 ± 0.19 a
§: values that have been transformed by the natural logarithm; dissimilar letters indicate significant differences at the 0.05 level after a one-way ANOVA. NSF: natural secondary forest; PF: Pinus yunnanensis forest; EF: Eucalyptus smithii forest. LDMC: leaf dry matter content; SLA: specific leaf area; H: height; LNC: leaf nitrogen concentration; SM: seed mass.
Table 3. Results of relationship analysis between community-weighted mean and species richness using linear regressions when intercept values were allowed to float.
TraitsForest TypesModelObserved CWM §Predicted CWM §
aR2
LDMCPF0.0180.148−0.57−0.55 c ± 0.044
EF0.0110.203−0.39−0.44 b ± 0.027
NSF0.025 *0.375−0.25−0.28 a ± 0.053
SLAPF0.0060.004−0.78−0.49 b ± 0.014
EF0.030 **0.819−0.40−0.45 b ± 0.068
NSF0.0480.294−0.23−0.29 a ± 0.103
HPF0.0150.112−0.49−0.42 b ± 0.037
EF0.029 **0.906−0.36−0.39 b ± 0.063
NSF0.022 *0.401−0.31−0.32 a ± 0.046
LNCPF0.0050.018−0.60−0.53 ns ± 0.013
EF0.087 **0.908−0.45−0.60 ns ± 0.201
NSF0.037 *0.365−0.59−0.59 ns ± 0.079
SMPF0.0080.031−0.47−0.33 b ± 0.020
EF0.031 **0.903−0.36−0.39 c ± 0.070
NSF0.025 *0.401−0.18−0.19 a ± 0.053
§: values that have been transformed by the natural logarithm; * and **: slope parameters (a) that significantly differed with the null pseudocommunity at the 0.05 and 0.01 levels, respectively. Different letters indicate that predicted functional diversity results between different forest types are significantly different at the 0.05 level; ns, non-significance; NSF: natural secondary forest; PF: Pinus yunnanensis forest; EF: Eucalyptus smithii forest. LDMC: leaf dry matter content; SLA: specific leaf area; H: height; LNC: leaf nitrogen concentration; SM: seed mass.
Disclaimer/Publisher’s Note: The statements, opinions and data contained in all publications are solely those of the individual author(s) and contributor(s) and not of MDPI and/or the editor(s). MDPI and/or the editor(s) disclaim responsibility for any injury to people or property resulting from any ideas, methods, instructions or products referred to in the content.

