Article

Exploring a New O3 Index as a Proxy for the Avoidance/Tolerance Capacity of Forest Species to Tolerate O3 Injury

by
Jacopo Manzini
1,2,
Yasutomo Hoshika
1,3,*,
Barbara Baesso Moura
1,4 and
Elena Paoletti
1,3
1
Institute of Research on Terrestrial Ecosystems (IRET), National Research Council of Italy (CNR), Via Madonna del Piano 10, 50019 Sesto Fiorentino, Italy
2
DAGRI, Department of Agriculture, Food, Environment and Forestry, University of Florence, Piazzale delle Cascine, 18, 50144 Firenze, Italy
3
ITINERIS, Italian Integrated Environmental Research Infrastructures Systems, Tito Scalo, 85050 Potenza, Italy
4
NBFC, National Biodiversity Future Center, 90133 Palermo, Italy
*
Author to whom correspondence should be addressed.
Forests 2023, 14(5), 901; https://doi.org/10.3390/f14050901
Submission received: 31 March 2023 / Revised: 14 April 2023 / Accepted: 21 April 2023 / Published: 27 April 2023
(This article belongs to the Special Issue Effects of Abiotic Stress on Tree Physiology and Ecology)

Abstract

:
Tropospheric ozone (O3) is a detrimental air pollutant causing phytotoxic effects. Several O3 indices are used to assess the risk for vegetation, e.g., the exposure-based AOT40 (accumulated ozone exposure over a threshold of 40 ppb) and the stomatal-flux based POD1 (Phytotoxic Ozone Dose above a threshold of 1 nmol m−2 s−1). Leaf Mass per Area (LMA) is recommended as a simple index to explain the plant tolerance capacity to O3. We therefore tested a new species-specific O3 index (Leaf Index Flux—LIF: calculated as stomatal O3 flux/LMA) as a proxy of the avoidance/tolerance capacity against O3 stress according to datasets of visible foliar injury (VFI) in forest monitoring and a manipulative Free-Air Controlled Exposure (FACE) experiment. For the forest monitoring, AOT40, POD1, and LIF were calculated from hourly O3, soil moisture, and meteorological measurements at nine Italian forest sites over the period 2018–2022. The results were tested for correlation with the O3 VFI annually surveyed at the same sites along the forest edge (LESS) or inside the forest (ITP) and expressed as relative frequency of symptomatic species in the LESS (SS_LESS) and Plant Injury Index per tree in the plot (PII_ITP). Based on VFI occurrence at ITP and LESS, Fagus sylvatica was considered the most O3-sensitive species, whereas conifers (Pinus pinea and Picea abies) and other deciduous/evergreen broadleaf (Quercus petraea, Q. cerris, Q. ilex, and Phyllirea latifolia) showed rare and no O3 VFI. Shrub species such as Rubus spp. and Vaccinium myrtillus were O3-sensitive, as they showed VFI along the LESS. AOT40 did not show significant correlations with the VFI parameters, POD1 increased with increasing SS_LESS (p = 0.005, r = 0.37) and PII_ITP (p < 0.001, r = 0.53), and LIF showed an even higher correlation with SS%_LESS (p < 0.001, r = 0.63) and PII_ITP (p < 0.001, r = 0.87). In the FACE experiment, PII was investigated for five deciduous and three evergreen tree species following one growing season of exposure to ambient and above-ambient O3 levels (PII_FACE). Moreover, PII_FACE resulted better correlated with LIF (r = 0.67, p < 0.001) than with POD1 (r = 0.58, p = 0.003) and AOT40 (r = 0.35, p = 0.09). Therefore, LIF is recommended as a promising index for evaluating O3 VFI on forest woody species and stresses high O3 risk potential for forest species with high stomatal conductance and thin leaves.

1. Introduction

Ground-level ozone (O3) is a secondary air pollutant arising from the interaction among solar radiation, high temperature, and its precursors (CH4, NOx, CO, and Volatile Organic Compounds) emitted by natural and anthropogenic sources [1,2]. Although a decrease in precursors’ emissions led to a reduction of O3 mean concentrations in North America, Europe, and Asia [3,4], an increase linked with high temperature is predicted in the near future due to climate change [5], reaching 50–55 ppb in Europe by the end of the 21st century [6,7]. In particular, Southern European countries are among the most affected areas due to the local climatic conditions, such as a hot and dry summer, that favor O3 photochemical formation in the troposphere [8].
Ozone is a significant abiotic stressor for plants, affecting their health and vitality [9]. Furthermore, as O3 concentrations tend to be higher in rural and semi-rural areas than in cities [10], forests are highly threatened, and their essential ecosystem services, such as carbon sequestration [11] and biodiversity preservation [12], might be affected.
Ozone is absorbed by trees through stomata and stimulates the formation of Reactive Oxygen Species (ROS) [13]. Its phytotoxicity promotes the decline of photosynthesis and the alteration of stomatal physiology [14,15], leading to a reduction in growth [16] and productivity [17,18]. Furthermore, specific O3-visible foliar injuries (O3 VFI), such as typical chlorosis, black spots, and interveinal necrosis, due to the oxidation of leaf tissues [19,20,21,22], have been detected in various tree species across forest sites and can be used as a biological indicator to assess O3 impacts on vegetation in the field [23]. Moreover, O3 monitoring in forests is crucial, and several indices were developed to probe forest responses to this pollutant. Currently, the European directive for forest protection from O3 (EU Directive 2008/50/EC) [24] is based on AOT40 (accumulated ozone exposure over a threshold of 40 ppb), an exposure-based index that accumulates the hourly concentrations of O3 exceeding the threshold of 40 ppb over daylight hours during the growing season. However, the damages caused by O3 are mainly related to its stomatal flux rather than its atmospheric concentration [25]. Hence, the National Emission Ceilings (NEC) Directive, within the framework of the Convention on Long-range Transboundary Air Pollution (CLRTAP), recently decided to include the Phytotoxic Ozone Dose (PODY) to assess O3 impact on plant ecosystems [26]. PODY is a flux-based index that estimates stomatal O3 uptake during the growing season above a threshold Y of potential phytotoxicity [22] and considers species-specific stomatal conductance responses to environmental conditions.
Nevertheless, other foliar structural traits beyond stomatal conductance, such as leaf morphology, may play a prominent role in O3 sensitivity [20]. In particular, species with thick and dense leaves, such as Mediterranean evergreens, are stated to be more resistant to biotic and abiotic stressors [27]. Feng et al. [28] suggested that Leaf Mass per Area (LMA) could explain O3 sensitivity variation among plant species. In fact, thick leaves have a relatively low mesophyll surface area exposed to O3 [29] and cellular defense substrates per unit of stomatal O3 flux increase with increasing LMA, as reported in spruce, pine, and larch trees [30].
Therefore, in the present study, we proposed a simple index called Leaf Index Flux (LIF) to weigh stomatal O3 flux by LMA and correlate with O3 VFI better than POD1 or AOT40.
To provide realistic evidence and a proper species-specific examination, VFI was assessed both in the field, i.e., along Light Exposed Sampling Sites (LESS) of the forest edge or inside the forest plots (ITP), and in an O3 Free-Air Controlled Exposure (FACE) facility.
Our aim was to verify whether LIF was well correlated with O3 VFI under field and semi-controlled conditions and thus can be used as a proxy to assess O3 VFI in forests. In addition, we tested which forest species were more O3-sensitive when evaluated by applying LIF.

2. Materials and Methods

2.1. Forest Monitoring Network

The evaluation occurred from 2018 to 2022 in nine Italian forest sites belonging to a European monitoring network (MOTTLES—MOnitoring ozone injury for seTTing new critical LevelS) (Table 1). The sites covered distinct geographical areas of Italy and represent the Alpine, Continental, and Mediterranean biomes. The dominant forest species were conifers (Pinus pinea L. and Picea abies L.), deciduous broadleaf trees (Fagus sylvatica L., Quercus petraea (Matt.) Liebl., and Q. cerris L.), and evergreen broadleaf trees (Q. ilex L. and Phyllirea latifolia L.).
The ozone concentrations and meteorological parameters were monitored at field stations powered by photovoltaic panels and placed in open fields (OFD) near the forest cover in each site [25]. In detail, O3 concentrations were measured in real time by an active monitor (Model 106–L, 2B Technologies, Inc., Boulder, CO, USA), while the environmental variables recorded by specific sensors (DeltaOHM, Selvazzano Dentro, Italy) were air temperature (T), relative humidity (RH), solar radiation (photosynthetic active radiation: PAR), precipitation (rainfall), wind direction, and speed. Each sensor was installed 2 m above the ground. Hourly average data were recorded and transmitted remotely via GPRS connection. In case of signal absence, data were stored in data loggers (Campbell Scientific, Logan, UT, USA; Loughborough, UK) and subsequently downloaded manually. Maintenance and calibration were periodically performed every year. The soil water content (SWC) was measured within the forest plots (ITP), using sensors (Campbell Scientific, Logan, UT, USA; Loughborough, UK) randomly placed at a depth of 10 cm.

2.2. Ozone FACE Facility

A new-generation tridimensional O3 FACE facility located in Sesto Fiorentino (43°48′59″ N, 11°12′01″ E, 55 m a.s.l.) was used to artificially fumigate potted plants by O3. Further details about the facility are reported in Paoletti et al. [31]. Three evergreen (Arbutus unedo L., Phillyrea angustifolia L., and Pinus pinea L.) and five deciduous species (Sorbus aucuparia L., Alnus glutinosa (L.) Gaertn., Vaccinium myrtillus L., Populus maximowiczii Henry X P. × berolinensis Dippel, and Populus x euramericana I-214) were exposed to three O3 levels (Ambient Air, 1.5 × Ambient Air, and 2.0 × Ambient Air) during the growing season and well-watered every day to maintain field capacity. Hourly average data related to environmental parameters (T, RH, PAR, and wind) were recorded during the experimental period of each year by a Watchdog station (Mod. 2000; Spectrum Technology, Inc., Aurora, IL, USA) placed at 2.5 m above ground level.

2.3. Calculation of O3 Indices: AOT40, POD1 and LIF

The accumulated ozone exposure over a threshold of 40 ppb (AOT40; ppb h) was calculated by summing all hourly average O3 concentrations exceeding the threshold of 40 ppb during daylight hours (shortwave solar radiation > 50 W m−2) from the beginning of the growing season to the time of the VFI survey, according to the following formula:
AOT 40   ppb · h = i = 1 n max O 3 i 40 ,   0 · Δ t
This index assumes that vegetation does not suffer damage with O3 concentrations lower than 40 ppb (AOT40 = 0) and that, during the night, the stomata are closed and prevent the entry of O3. The critical level for forest protection based on accumulated ozone exposure over a threshold of 40 ppb (AOT40) is 5000 ppb h, corresponding to a 5% reduction in tree biomass [32] (CLRTAP, 2017).
Regarding the Phytotoxic Ozone Dose (PODY), the following formula was used to carry out the calculation:
POD Y   ( mmol   m 2 )   = i = 1 n F st , i Y · Δ t
where Fst represents the hourly stomatal O3 flux, n is the number of hours for the period considered, and ∆t = 1 h. We considered a Y threshold of 1 nmol O3 m−2 s−1 (POD1), as suggested by the UNECE Mapping Manual of CLRTAP [32].
Finally, the Leaf Index Flux (LIF) was calculated as the ratio between species-specific POD1 and Leaf Mass per Area (LMA) and was expressed in mmol O3 g−1:
Leaf   Index   Flux   ( LIF ) = POD 1 LMA
The Leaf Index Flux was calculated ex novo for the forest sites (LESS and ITP) and by using published data [33] for the species subjected to artificial fumigation with O3 in the FACE facility.

2.4. Stomatal O3 Flux Modelling

The hourly stomatal O3 flux Fst (nmol m−2 s−1), considered in the POD1 calculation, was obtained as follows:
F st = O 3 · 1 R b + R c · g s t o g s t o + g e x t
where [O3] is the hourly O3 concentration (ppb), Rb is the boundary layer resistance (s m−1), Rc is the leaf surface resistance (s m−1), gsto is the stomatal conductance (mmol O3 m−2 s−1), and gext is the cuticular conductance (m s−1). In detail, Rb = 1.3 × 150 × (Ld/u)0.5, where Ld is the leaf size; and u is the wind speed, expressed in m s−1.
The stomatal conductance (gsto) estimation was based on the multiplicative model described by Jarvis [34] and modified by CLRTAP [32] according to the following equation [15]:
gsto = gmax × fphen × flight × max {fmin, (ftemp × fVPD × fSWC)}
where gmax represents the maximum stomatal conductance, while fphen, flight, ftemp, fVPD, and fswc are functions that indicate the variation of gsto in relation to phenology, photosynthetic active radiation (PAR, μmol m−2 s−1), air temperature (T, °C), vapor pressure deficit (VPD, kPa) and soil moisture (SWC, m3 m−3), respectively. Finally, fmin represents the minimum stomatal conductance. The functions used are detailed below.
f l i g h t = 1 exp light a · PAR
where lighta is a dimensionless coefficient for curvature of stomatal conductance response to PAR.
f t e m p = T T min T opt T min T max T T max T opt T max T opt T opt - T min
where Tmax, Tmin, and Topt are the maximum, minimum, and optimal temperatures for the stomata opening, respectively.
f V P D = min 1 ,   max f m i n , 1 f m i n · VPD min VPD VPD min VPD max + f m i n
where VPDmin and VPDmax are, respectively, the vapor pressure deficit to reach the minimum and maximum stomatal opening.
f S W C = min 1 ,   max f m i n , 1 f m i n SWC WP FC WP + f m i n
where SWC is soil moisture, WP is the wilting point, and FC is the field capacity obtained from Anav et al. [35]. Finally, fphen was set equal to 1 during the growing season. The start of the growing season was based on a phenological model in the forest [25] and by direct observations in the FACE experiment. The end of the accumulation window was the time of the VFI survey.
We applied the species-specific stomatal conductance model parameters in the target species reported in our previous papers [15,23,36] and the CLRTAP mapping manual [32]. The applied parameters are listed in Supplementary Table S1.

2.5. Calculation of Leaf Mass per Area (LMA)

To assess the species-specific LMA, five leaf discs of 0.8 cm in diameter were obtained by a leaf punch (Fujiwara Scientific Company Co., Ltd., Tokyo, Japan) for each sampled light-exposed leaf (n = 5 leaves × 3 plants per site for MOTTLES sites, for 3 leaves × 1 to 2 plants per plot × 3 replicated plots × 2 to 3 O3 levels for the FACE experiments). The leaf discs were oven-dried at 70 °C for 72 h and weighed by an analytical balance (Sartorius, Goettingen, Germany). The projected needle area of the samples was assessed by Easy Leaf Area application [37]. The LMA, expressed in g m−2, was finally calculated as the ratio between dry biomass and area.

2.6. Surveys of O3 Visible Foliar Injury

As suggested by the ICP Forests Manual for O3 injury assessment [38], in the MOTTLES sites, O3 VFI was determined along the LESS and inside the forest (ITP), i.e., at around 600 m from the OFD. Every year, at the end of the growing season, a team of two expert evaluators carried out an estimate of O3 VFI (interveinal black/reddish necrosis in the upper leaf surfaces, [38]) at each LESS and ITP forest site (Supplementary Figure S1). The evaluation was performed on current-year light-exposed leaves/needles. The ozone VFIs were validated for each species based either on the literature or on one-year exposure in the O3 FACE facility [23]. Concerning LESS, a forest edge of 50 m in length and 1 m in depth was examined. The area was divided into 25 adjacent and non-overlapping quadrates of 2 m2 each, randomly excluding 5 quadrates, as Schaub et al. [38] suggested. The plant species were cataloged in each quadrate, and the presence/absence of O3 VFI was recorded. For each species in the LESS, the following relative frequency of symptomatic species was calculated:
SS _ LESS = number   of   LESS   quadrates   with   symptomatic   species   total   number   of   LESS   quadrates   where   the   target   species   is   present   ×   100
Within each ITP, sampling was performed on five randomly selected trees belonging to the dominant species. Depending on the species, 5 branches exposed to the light, with at least 30 leaves or needles, were evaluated. The Plant Injury Index (PII) was obtained by combining the percentage of injured leaves per shoot (LA) and the percentage of injured leaf surface per symptomatic leaf (AA), as suggested by Paoletti et al. [39]. Finally, an average was made for the five branches, thus obtaining an average percentage value of O3 VFI per tree (PII_ITP).
PII _ ITP = LA   ×   AA 100
The Plant Injury Index was assessed in light-exposed leaves that were grown during the season, as well as for the plants in the O3 FACE facility (PII_FACE) in September, except for Alnus glutinosa and Vaccinium myrtillus, for which the PII was assessed in July (Supplementary Figure S1).

2.7. Statistical Analyses

For the MOTTLES datasets, only forest sites with at least 75% validated data of hourly environmental parameters and O3 concentrations were considered. POD1, AOT40, and LIF were related to SS_LESS and PII_ITP for each site, or to PII_FACE for the FACE facility. Normal distribution was tested with the Lilliefors test (Kolmogorov–Smirnov). The significance (p < 0.05) of the linear regression lines was verified using the Pearson’s correlation coefficient (r). Moreover, we performed a one-way ANOVA to assess if O3 significantly affected species-specific LMA values during the FACE experiment. Statistical analyses were conducted with MS Excel (Microsoft ®).

3. Results

3.1. Meteorological Conditions and Ozone Concentrations

3.1.1. MOTTLES Sites

The highest daily mean O3 concentration was detected in Abruzzo (ABR1) and was equal to 52.13 ppb during the period considered (2018–2022, Table 2). The lowest values were recorded in Castelporziano (CPZ1, CPZ2, and CPZ3), corresponding to 29.58 ppb. The highest average daily mean temperature (16.30 °C) was recorded in Castelporziano, while the lowest was in TRE1 (5.25 °C). Moreover, the daily mean photosynthetically active radiation was higher in Castelporziano (412.73 μmol m−2 s−1), but the lower value was at PIE1 (305.80 μmol m−2 s−1). The relative humidity and soil water content showed the highest values at VEN1 (86.80% and 40.38%, respectively), while the lowest values of VPD were found at VEN1 (0.17 kPa), followed by TRE1 (0.29 kPa), PIE1 (0.31 kPa) and ABR1 (0.31 kPa). Finally, the wettest sites were PIE1 and VEN1, with an average of more than 1700 mm of annual rainfall.

3.1.2. FACE Experiments

Table 3 shows the daily means of meteorological data and O3 concentrations in the FACE experiments. The highest temperature and VPD were recorded in 2017 (24.50 °C and 1.89 kPa, respectively), while the lowest ones occurred in 2020 (22.10 °C and 1.31 kPa, respectively). The relative humidity showed the highest value in 2020 (61.80%) and the lowest one in 2017 (47.60%). The photosynthetically active radiation was always higher than 500 μmol m−2 s−1 (maximum value 578 μmol m−2 s−1 in 2016), except in 2020 (PAR = 475 μmol m−2 s−1). Regarding O3, the Ambient Air concentration was in a range of 35–40 ppb for the reference years (2016–2020).

3.2. Leaf Mass per Area

3.2.1. MOTTLES Sites

The highest LMA values were found for the conifers Picea abies (262.10 g m−2) and Pinus pinea (192.47 g m−2; Supplementary Table S2). Among the deciduous trees, Fagus sylvatica showed the lowest values (between 50.42 and 67.01 g m−2), while the evergreens Quercus ilex (142.65 g m−2) and Phillyrea latifolia (144.64 g m−2) showed the highest values. For LESS species, Rubus spp. and Vaccinium myrtillus LMA ranged from 55 to 78 and from 35 to 56 g m−2, respectively.

3.2.2. FACE Experiments

As confirmed in the MOTTLES sites, evergreen species showed a relatively high LMA value relative to deciduous species (Supplementary Table S3). The lowest LMA values were found in a fast-growing deciduous species, Alnus glutinosa (approximately 48 g m−2). For most of the species, O3 did not significantly affect LMA values, except for Oxford poplar clone (Populus maximowiczii Henry × P. berolinensis Dippel) in 2016 (one-way ANOVA, p = 0.047) and Phillyrea angustifolia in 2018 (one-way ANOVA, p = 0.025).

3.3. Ozone Visible Foliar Injury at LESS, ITP and FACE

At the MOTTLES sites, Fagus sylvatica showed O3 VFI within the LESS during all the years at VEN1, PIE1, and ABR1 (Table 4). Within all the LESS quadrates, O3 VFI was found in F. sylvatica leaves at PIE1 in both 2020 and 2021, and at VEN1 in 2022 (SS_LESS = 100%). High frequencies for this species (70–90%) were also found at VEN1 in 2019, 2020, and 2021, while the lowest percentages (20–47%) were recorded at ABR1. Concerning Rubus spp., SS_LESS = 100% was quantified at CPZ3 during 2020. On the contrary, for 2021 and 2022, no plants of Rubus spp. showed O3 VFI at CPZ3 (SS_LESS = 0%). Injured Rubus plants were also found at LAZ1, PIE1, and EMI1 with SS_LESS equal to 64.2 and 66.6% in 2022 for the latter two sites, respectively. Injured Vaccinium myrtillus was observed in the LESS of PIE1 (in 2018, 2021, and 2022) and TRE1 (period 2019-2022). In particular, SS%_LESS increased from 2019 to 2022 at TRE1, passing from 44 to 100%, while O3 VFI was found at PIE1 (66.6%) only in 2022. No dominant species in the LESS (P. pinea, P. abies, Q. petraea, Q. cerris, and P. latifolia) showed O3 VFI, except for P. abies (SS_LESS = 16.6%) in 2022, at TRE1. Regarding ITP, O3 VFI was found only in Fagus sylvatica, Pinus pinea, and Picea abies (Table 5). The highest value of PII_ITP for F. sylvatica was 8.90% at VEN1 in 2020, while the lowest value (0.30%) was recorded at ABR1 in the same year. Pinus pinea showed an O3 foliar injury at CPZ3 only in 2018, with a PII_ITP equal to 0.44%, while Picea abies at TRE1 showed a PII_ITP of 0.32%. The other dominant species, such as Quercus petraea, Q. ilex, Q. cerris, and Phyllirea latifolia did not show O3 VFI during the ITP surveys in any year.
At the FACE, a relatively high PII was shown in deciduous species (Table 6). The PII increased with increasing O3 levels. The highest PII was shown in Sorbus aucuparia exposed to 2.0 × Ambient Air O3 treatment, which was more than 11%. On the other hand, evergreen species showed a very low PII (e.g., P. pinea and P. angustifolia showed PII_FACE = 0).

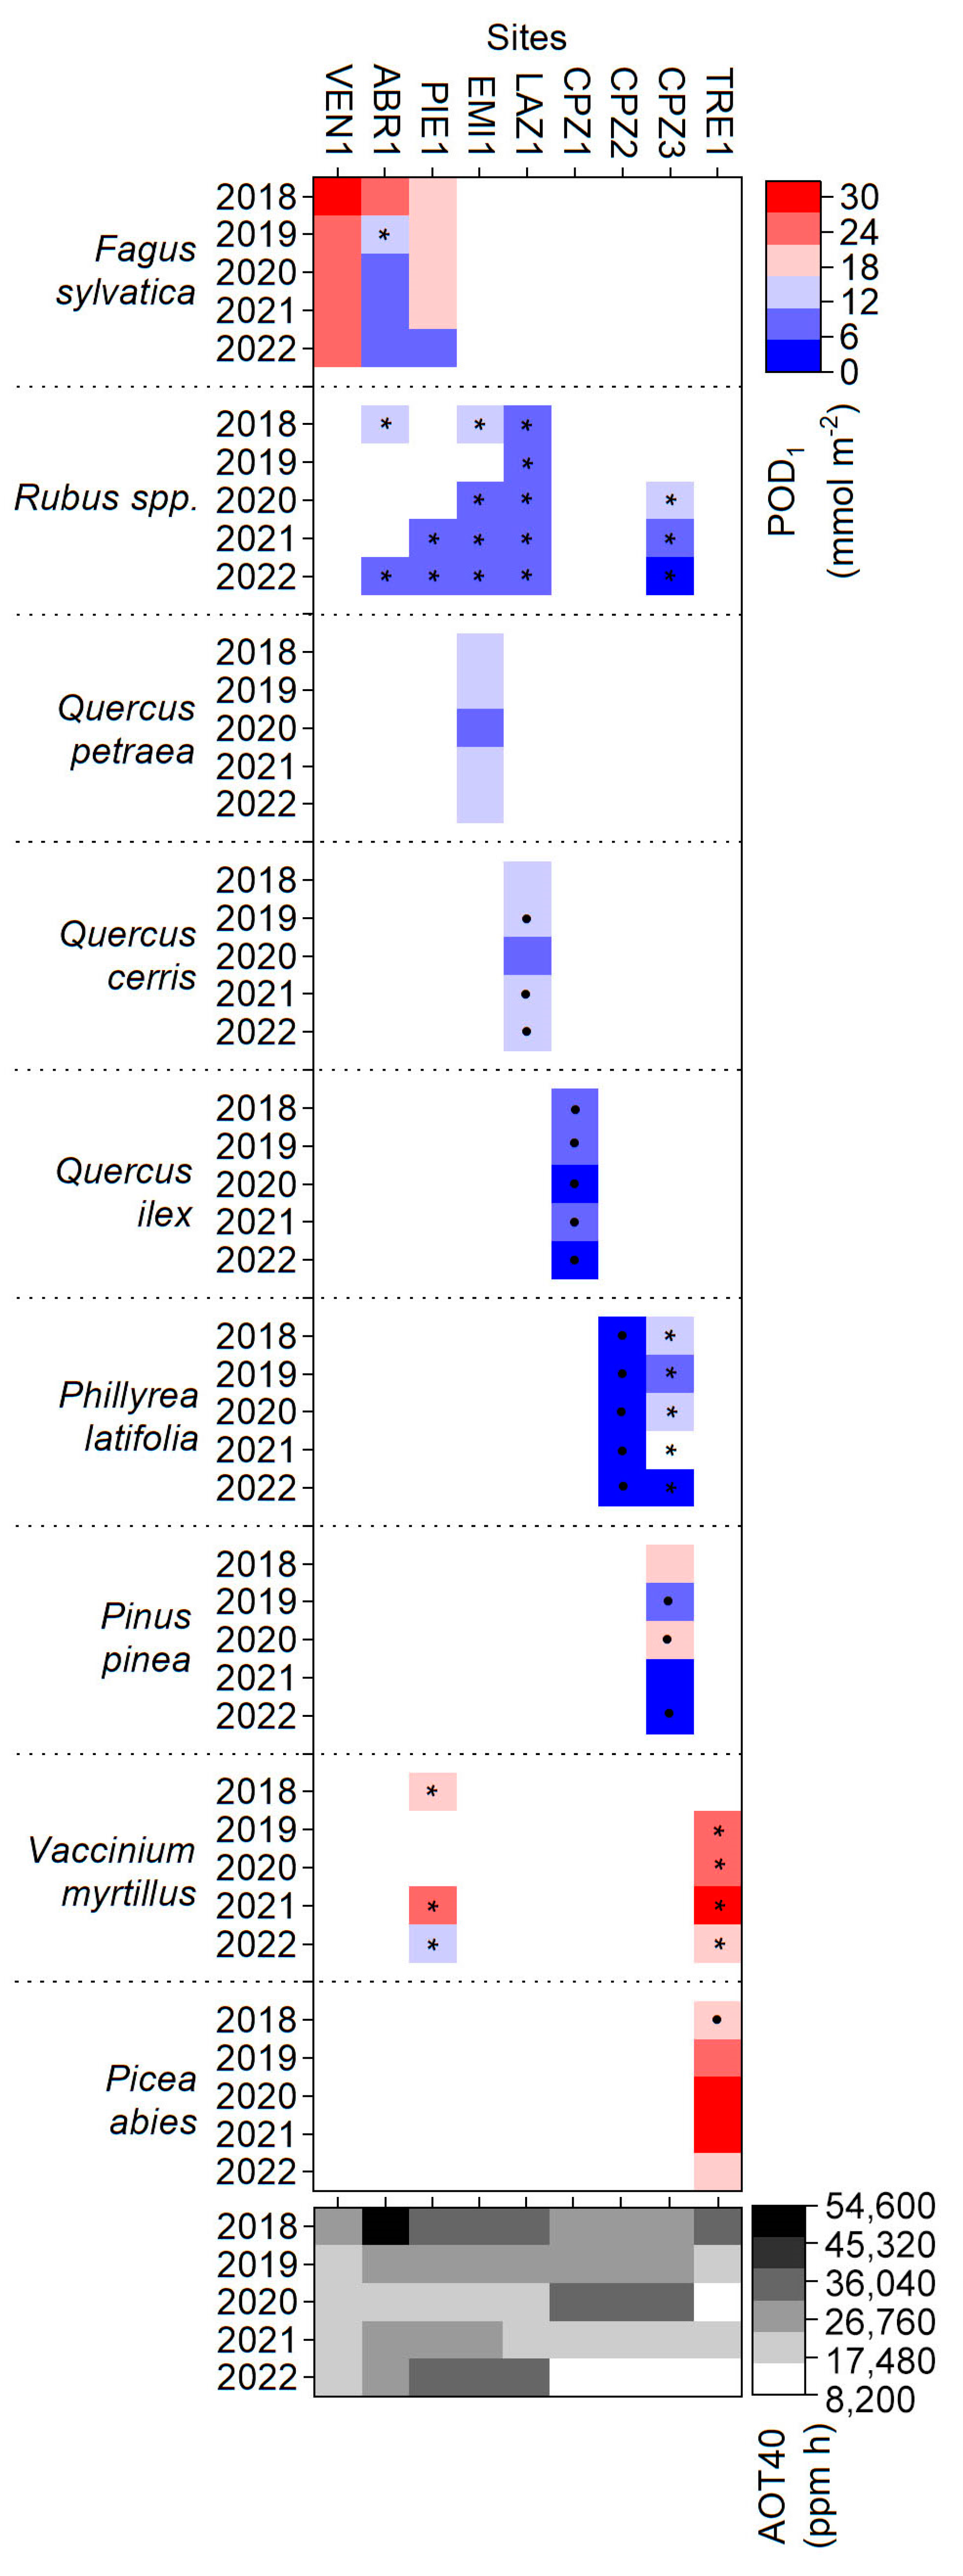
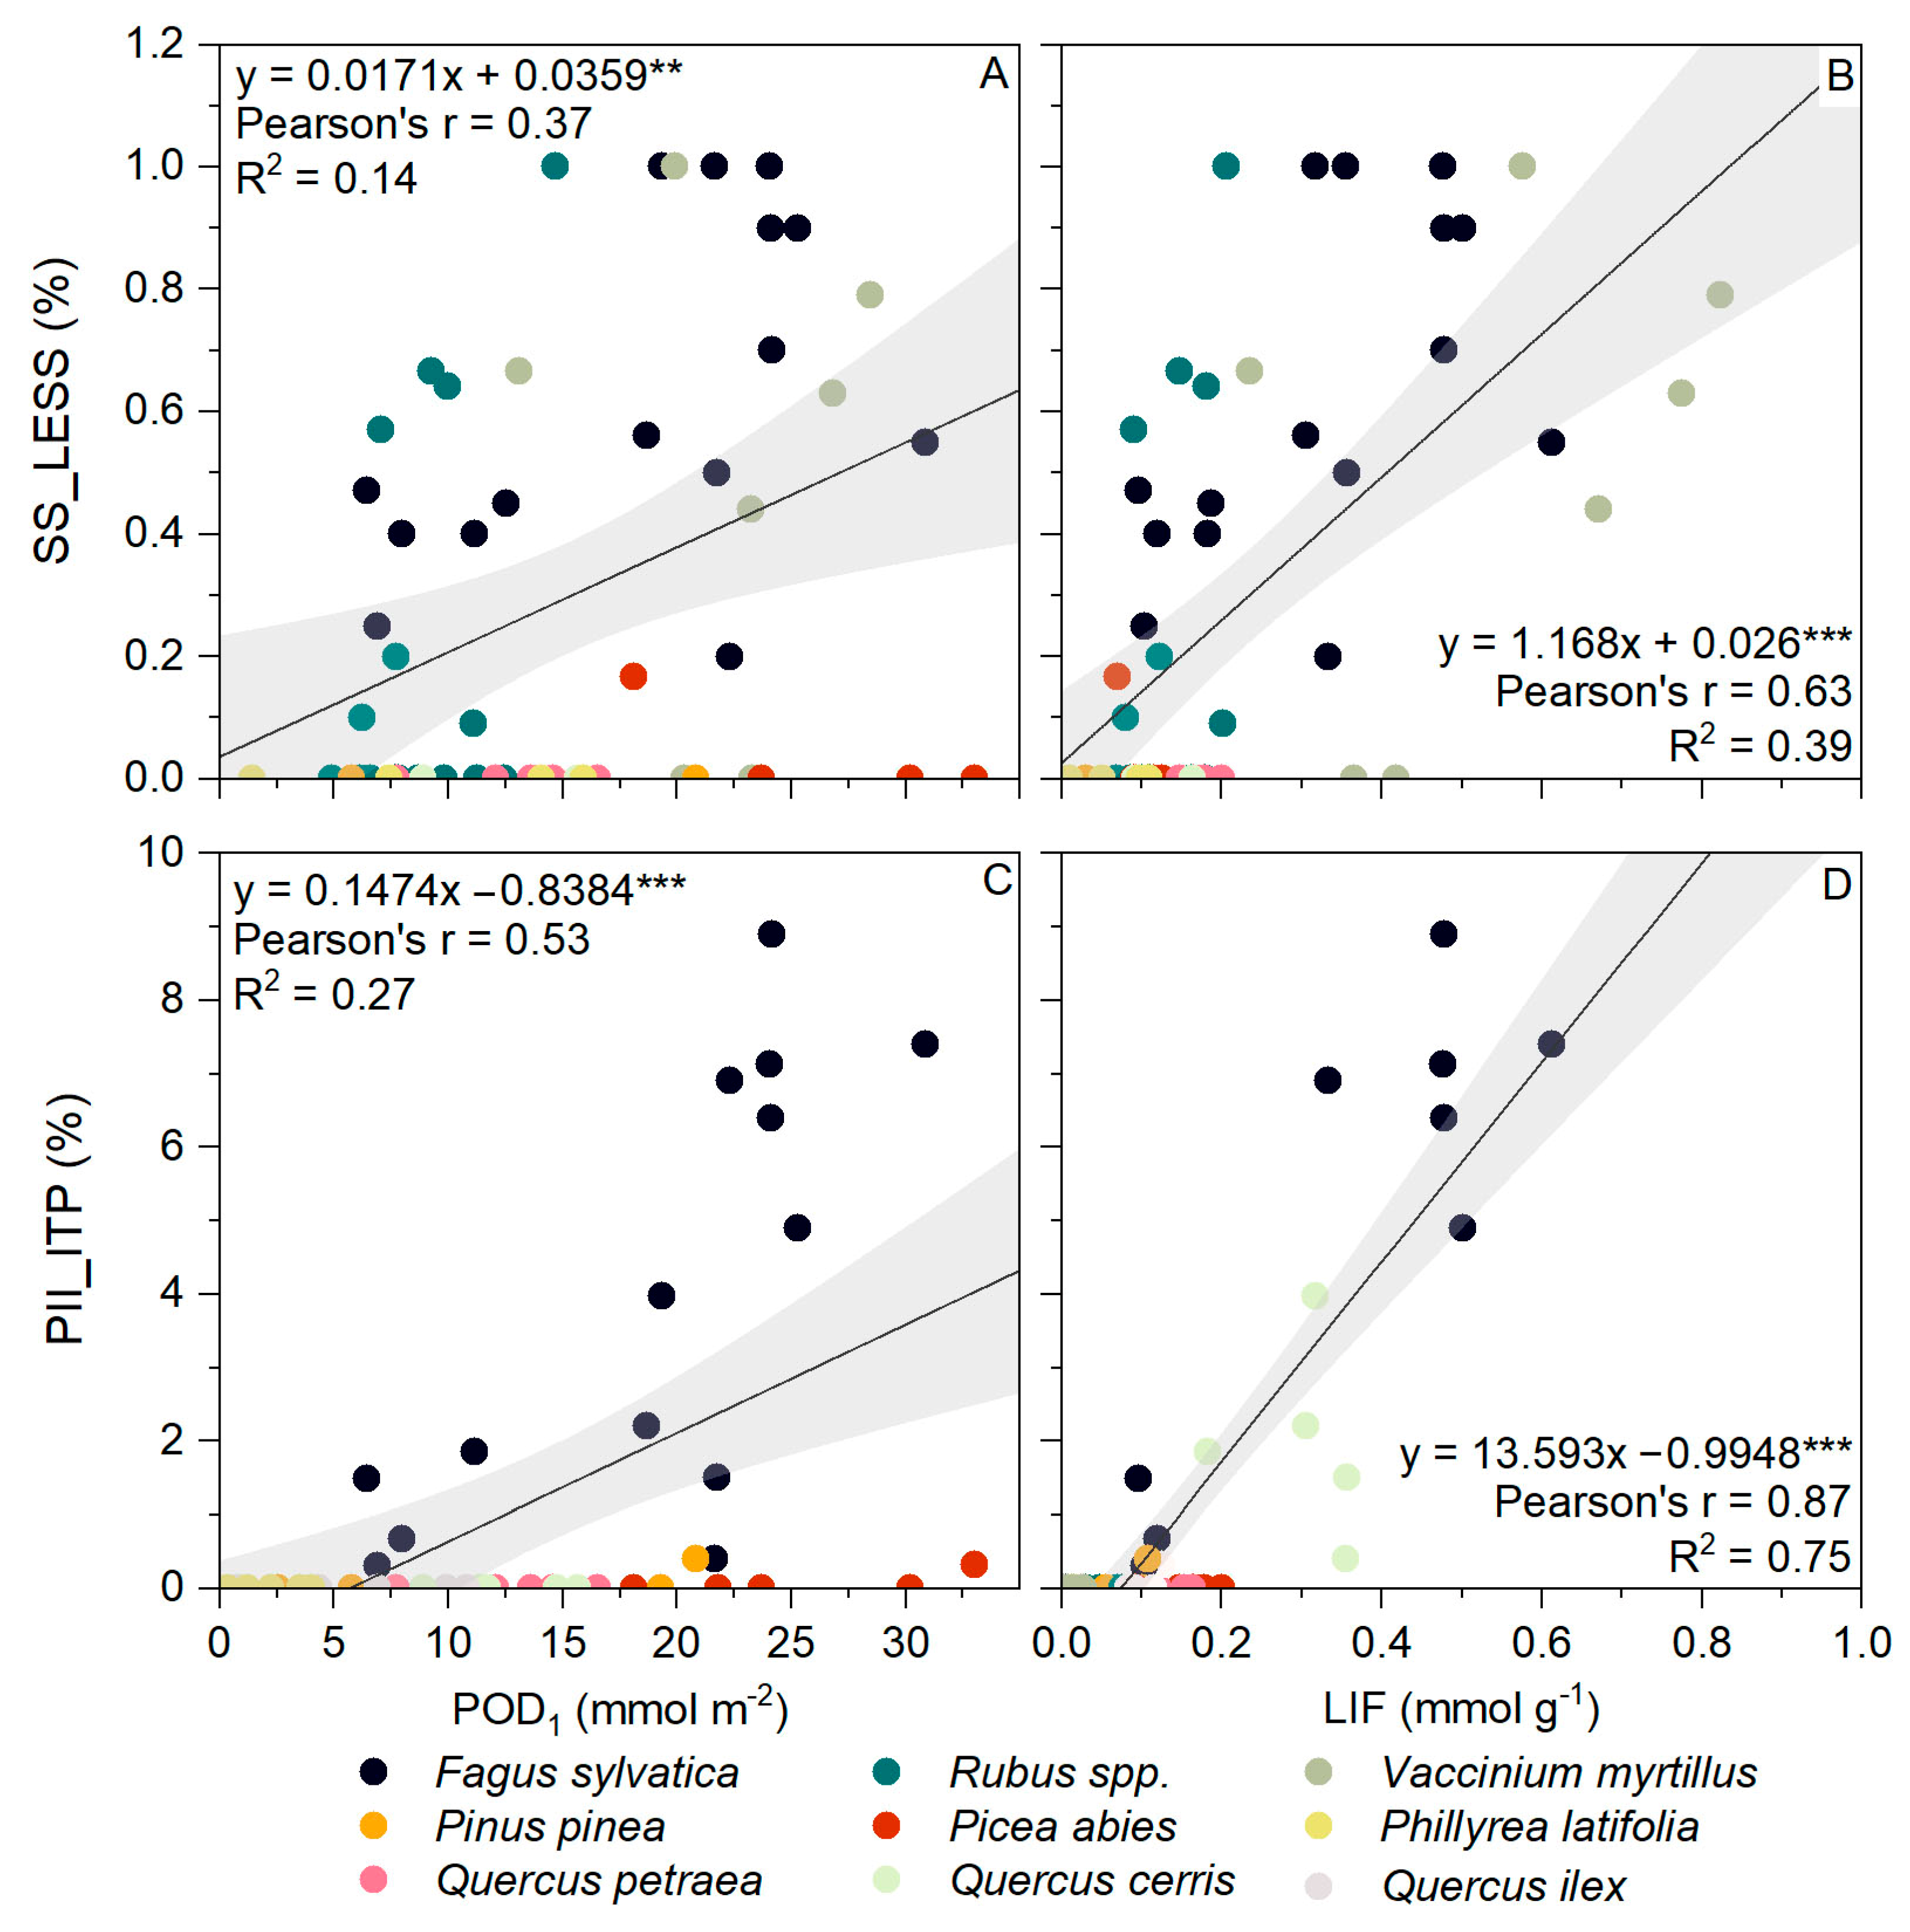
3.4. AOT40 and POD1 versus Visible Foliar Injury

The AOT40 was higher at ABR1 than at the other sites for three out of the five years, with a maximum of 54,588 ppb·h recorded in 2018 (Supplementary Table S4 and Figure 1). The lowest values were at TRE1 (2019–2021) and CPZ (2018 and 2022), with a minimum of 8377 ppb·h at CPZ in 2022. POD1 did not depend on site conditions or on the species. For F. sylvatica, the highest POD1 values were at VEN1 (30.88 mmol m−2 in 2018), and the lowest ones were at ABR1 (6.43 mmol m−2). High POD1 values for this species at VEN1 were associated to the highest PII_ITP among all sites and years.
Concerning Rubus spp., the highest POD1 (14.69 mmol m−2) and 100% SS_LESS were at CPZ3 in 2020. For V. myrtillus, POD1 values were always high at TRE1 with a maximum of 28.47 mmol m−2 in 2021, where SS_LESS values were also high. Interestingly, Picea abies showed a relatively high POD1 value at TRE1 (18.12–33.01 mmol m−2). However, visible foliar injuries were rarely seen for this species, as confirmed by very low values of both SS_LESS and PII_ITP.
At the FACE, AOT40 values in Ambient Air conditions were 13,774 to 24,243 ppb·h (Supplementary Table S5) and increased with increasing enhanced O3 levels. POD1 values were species-specific, with a maximum in Oxford poplar clone (75.15 mmol m−2) and a relatively low value (2.79–6.13 mmol m−2) for the Mediterranean evergreen shrub Arbutus unedo.
The relationship between species-specific POD1 calculated for LESS-species and their relative frequency of O3 VFI (SS_LESS) was statistically significant (p = 0.005, r = 0.37; Figure 2A), while AOT40 and SS_LESS were not correlated (r = 0.11, p = 0.40). The percentage of ITP O3 VFI (PII_ITP) increased with the POD1 values calculated for all the dominant species at each site (r = 0.53, p < 0.001; Figure 2C), while AOT40 was not correlated with PII_ITP (r = 0.03, p = 0.85). Such a tendency was also confirmed in the FACE, where the correlation between PII_FACE and AOT40 was not significant, while it was for POD1 (Figure 3A,B). Moreover, AOT40 did not correlate with POD1 (r = 0.003, p = 0.97).

3.5. LIF versus Visible Foliar Injury

The LIF was calculated for each species and was significantly correlated to SS_LESS (r = 0.63, p < 0.001; Figure 2B) and PII_ITP (r = 0.87, p < 0.001; Figure 2D). Moreover, a significant strong positive correlation (r = 0.70, p < 0.001) between POD1 and LIF was detected. Conversely, AOT40 did not correlate with the LIF (r = 0.03, p = 0.74). Interestingly, the Plant Injury Index (PII_FACE) calculated at the end of growing season for species exposed to O3 in the FACE facility confirmed that the LIF had a higher correlation (r = 0.67, p < 0.001; Figure 3C) with PII_FACE than with AOT40 (r = 0.35, p = 0.09; Figure 3A) and POD1 (r = 0.58, p = 0.003; Figure 3B).

4. Discussion

4.1. Different Sensitivity to O3 among Species according to Visible Foliar Injury

For the dominant tree species inside the forest plots considered in this study (ITP), Fagus sylvatica was the most sensitive species, as it showed O3 VFI at three sites (ABR1, PIE1, and VEN1) in the period of 2018–2022. Our results are in agreement with those of previous studies carried out in nurseries [40], FACE facilities [41], and open-top chambers [42], denoting that beech is characterized by low O3 tolerance and the early appearance of O3 VFI, mainly identifiable as browning and dark spots. Conifers were better at tolerating the abiotic stress due to O3. In fact, O3 VFI was found only in 2018 at CPZ3 for P. pinea and in 2021 at TRE1 for P. abies. The high tolerance for P. pinea was confirmed in the FACE, where O3 VFI was not observed even under twice the ambient O3 levels. The dominant broadleaf species present in the other forest sites located in Central–Southern Italy, such as Quercus ilex, Quercus cerris, Quercus petraea, and Phillyrea latifolia, did not show any O3 VFI. First of all, those representative species of the Mediterranean area evolved in an environment constantly subjected to other oxidative stresses, such as long dry periods and high solar irradiation, and are likely endowed with an efficient antioxidant pool for the detoxification of O3 inside the leaf parenchyma [43]. Experiments carried out in open-top chambers [44] also reported that Quercus ilex plants were asymptomatic even after two years of exposure to high O3 concentrations (approximately daily mean of 40 ppb). In the LESS, Fagus sylvatica showed O3 VFI, although young trees, usually present at forest edges, may be more sensitive to O3 than adult ones [45] due to lower stomatal conductance of mature trees than juvenile trees caused by a greater resistance to height-dependent water transport [46,47]. In addition, shrub species (Rubus spp.) and underbrush plants (Vaccinium myrtillus) were symptomatic during LESS surveys. A relatively high sensitivity of V. myrtillus in terms of O3 VFI was also confirmed in the FACE. A long-term exposure to high concentrations of O3 also resulted in an alteration of the yield and nutraceutical quality of fruits, suggesting that Vaccinium myrtillus is sensitive to O3 [48]. In addition to the above-mentioned species, according to the FACE experiments, Sorbus aucuparia and poplar species were considered to be O3-sensitive, as they showed a high PII due to a high stomatal O3 uptake.

4.2. Which Is the Best Index for Ozone Visible Foliar Injury

Concerning the O3 indices investigated in this work, several studies suggest that AOT40 can provide misleading results if used as the only reference metric for forest protection from O3 (e.g., Anav et al. [34]). Confirming this, although AOT40 values in our target sites were always much higher than the regulatory limit for the protection of forests set by CLRTAP [32] at 5000 ppb h, no significant correlation was found between AOT40 and O3 VFI. On the contrary, POD1 increased with the increase of both injury parameters, highlighting that a flux-based index is more appropriate than AOT40 for the definition of species-specific critical levels and the consequent protection of forests. Indeed, asymptomatic Phillyrea latifolia and Quercus ilex had relatively low POD1 values in Castelporziano (CPZ1 and CPZ2); the values were lower than the critical level indicated by Sicard et al. [49] for hardwoods, i.e., 12 mmol m−2, while Fagus sylvatica and Vaccinium myrtillus regularly exceeded this POD1 critical level and showed VFI in Northern Italian sites (PIE1 and VEN1). Confirming this, the two poplar clones tested in the FACE experiment, i.e., Populus maximowiczii Henry X P. × berolinensis Dippel and Populus x euramericana I-214, characterized by very high stomatal conductance (gmax equal to 348 and 478 mmol O3 m−2 PLA s−1, respectively), exceeded the critical threshold of 12 mmol m−2 (POD1 about 2–3 times higher in Ambient Air treatment), resulting in severe damage, as indicated by PII, while Arbutus unedo (gmax equal to 95 mmol O3 m−2 PLA s−1) exhibited low POD1 and limited symptoms (PII = 0.01–0.08%). However, several species showed very few symptoms, although they had a relatively high value of POD1 (18.12–33.01 mmol m−2 for P. abies, 7.73–16.51 mmol m−2 for Q. petraea, and 8.89–15.66 mmol m−2 for Q. cerris in the years considered) that was, on average, higher than the critical level of 5 and 12 mmol m−2 recommended for conifers and broadleaves, respectively [49]. This study thus developed and tested the LIF, an index that explores the sensitivity to O3 of forest species as a function of not only stomatal flux as a proxy of avoidance capacity but also LMA, a representative parameter of the leaf morphology as a proxy of defense capacity against O3. Interestingly, in forest-monitoring data, we found a strong significant correlation (p < 0.001) of O3 VFI (SS_LESS and PII_ITP) with LIF, even higher than with POD1. Moreover, we confirmed that LIF fitted better than the other two indices also in experimental conditions with O3-fumigated plants in a manipulative FACE experiment. Plant resistance to oxidative stress due to O3 exposure can be explained not only by avoidance (restriction of O3 entry via stomata) but also by tolerance (biochemical defense and repair) [50]. Since LIF considered both avoidance and tolerance against O3, it is proposed as an interesting and effective new proxy for evaluating O3 damages on forest species. Species characterized by high LMA values (and consequent low LIF), such as Picea abies, Pinus pinea, and the Mediterranean sclerophyllous Quercus ilex and Phyllirea latifolia may cope well with the oxidative stress caused by O3. Several studies reported that leaves characterized by high LMA values possess high antioxidant capacities [30,44,51]. In particular, Mediterranean sclerophyllous plants, which are often suffering from drought, high irradiance, and/or O3, have a well-developed mechanism of antioxidative protection to withstand oxidative stress [52,53]. For example, O3-exposed Mediterranean oaks activated the phenylpropanoid pathways to counteract the accumulation of ROS and thus reduce the oxidative damage to physiological functions [54]. Moreover, other studies suggested that a leaf structure characterized by small, thick, and leathery leaves may contribute to resist O3 stress [27,55]. Those leaves have a relatively low intercellular air space and, thus, a limited cell surface interaction with O3 [29]. In addition, the presence of a dense layer of trichomes can often be found on the lower leaf blade, and it could increase the reaction surface with O3, contributing to its degradation before O3 entry into a leaf [44,56,57].

5. Conclusions

The O3 VFI (SS_LESS, PII_ITP, and PII_FACE) increased with increasing POD1 and did not vary with AOT40, suggesting that the new regulations for forest protection should be based on O3 stomatal flux rather than O3 exposure. Moreover, the new index (LIF) proposed here, which takes into account O3 stomatal flux and leaf morphology, showed excellent results (i.e., the highest correlation coefficients with O3 VFI both in forest sites and FACE facility) and deserves to be further explored to assess O3 damage on forest species. To calculate the LIF index, species-specific stomatal conductance model parameters and LMA values are required. These parameters are still missing for many species, especially for shrub species such as Viburnum lantana [58] and Rosa canina [23], which often show O3 VFI in the field. Therefore, for the practical use of LIF, further studies are needed to develop stomatal conductance models and calculate LMA for a larger array of species. Ozone is confirmed as a real and alarming threat to the health of Italian forests. Indeed, characteristic species such as Fagus sylvatica showed important O3 VFI, which can translate into a decline in growth and productivity, with heavy repercussions at the ecosystem level. Conversely, conifers (Pinus pinea and Picea abies), as well as species belonging to the Mediterranean area (Quercus spp. and Phillyrea latifolia), did not show O3 VFI, but it cannot be excluded that O3 could affect other parameters, for example, canopy defoliation or growth reduction.

Supplementary Materials

The following are available online at https://www.mdpi.com/article/10.3390/f14050901/s1, Table S1: Stomatal conductance model parameters, where gmax is maximum stomatal conductance; fmin is minimum conductance; flight_a is a parameter indicating the curvature of stomatal response curve to light; Tmax, Topt, and Tmin are maximum, optimal, and minimum temperature for describing the variation of gs with temperature (ftemp); and VPDmin and VPDmax are the vapor pressure deficit for attaining minimum and maximum gs (fVPD). Table S2: Leaf Mass per Area (mean ± standard error, n = 3) for the species found in MOTTLES sites. Table S3: Leaf Mass per Area (mean ± standard error) for the species subjected to O3 fumigation in FACE experiment. Table S4: Values of AOT40 and POD1 calculated in each site for the period 2018–2022. Table S5: Species subjected to fumigation in O3 FACE (years 2016–2020). For each species, O3 treatment (Ambient Air, 1.5 × , and 2.0 × ), AOT40, POD1, and LIF are reported. Figure S1: Species-specific O3 VFI recorded during field surveys (LESS and ITP) and FACE experiment.

Author Contributions

J.M., Y.H., B.B.M. and E.P. conceived of the study; J.M., Y.H. and B.B.M. carried out the experiment and collected the data; Y.H. and J.M. undertook the statistical analyses. Writing—original draft preparation, J.M.; writing—review and editing, Y.H., B.B.M. and E.P.; supervision, E.P. All authors have read and agreed to the published version of the manuscript.

Funding

This research was funded by MOTTLES (LIFE15 ENV/IT/000183), MODERn(NEC) (LIFE20/GIE/IT/000091), and 4ClimAir (SAC.AD002.173) projects. We also thank National Recovery and Resilience Plan (NRRP) of Italian Ministry of University and Research funded by the European Union—NextGenerationEU, Mission 4 Component 2 Investment 1.4-Avviso 3264/2021, Project Code CN_00000033, Concession Decree No. 1034 of 17 June 2022, CUP B83C22002930006, Project title “National Biodiversity Future Center-NBFC” (Spoke 5); and the Italian Integrated Environmental Research Infrastructures Systems (ITINERIS), project code IR0000032; CUP B53C22002150006.

Data Availability Statement

Data sharing is not applicable to this article as all new created data is already contained within this article.

Acknowledgments

We acknowledge all the project participants for the setting up and maintenance of the monitoring network and for contributing to the visible injury surveys in forest.

Conflicts of Interest

The authors declare no conflict of interest.

References

  1. Cotrozzi, L.; Pellegrini, E.; Nali, C.; Lorenzini, G. Climate change, ozone and plant life. Agrochimica 2019, 62, 181–188. [Google Scholar]
  2. Karmakar, S.P.; Das, A.B.; Gurung, C.; Ghosh, C. Effects of Ozone on Plant Health and Environment: A Mini Review. Res. Jr. Agril. Sci. 2022, 13, 612–619. [Google Scholar]
  3. Xu, X.; Lin, W.; Xu, W.; Jin, J.; Wang, Y.; Zhang, G.; Zhang, X.; Ma, Z.; Dong, Y.; Ma, Q.; et al. Long-term changes of regional ozone in China: Implications for human health and ecosystem impacts. Elem. Sci. Anthr. 2020, 8, 13. [Google Scholar] [CrossRef]
  4. Sicard, P. Ground-level ozone over time: An observation-based global overview. Curr. Opin. Environ. Sci. Health 2021, 19, 100226. [Google Scholar] [CrossRef]
  5. Meleux, F.; Solmon, F.; Giorgi, F. Increase in summer European ozone amounts due to climate change. Atmos. Environ. 2007, 41, 7577–7587. [Google Scholar] [CrossRef]
  6. Young, P.J.; Archibald, A.T.; Bowman, K.W.; Lamarque, J.-F.; Naik, V.; Stevenson, D.S.; Tilmes, S.; Voulgarakis, A.; Wild, O.; Bergmann, D.; et al. Pre-industrial to end 21st century projections of tropospheric ozone from the Atmospheric Chemistry and Climate Model Intercomparison Project (ACCMIP). Atmos. Chem. Phys. 2013, 13, 2063–2090. [Google Scholar] [CrossRef]
  7. Sicard, P.; Anav, A.; De Marco, A.; Paoletti, E. Projected global ground-level ozone impacts on vegetation under different emission and climate scenarios. Atmos. Chem. Phys. 2017, 17, 12177–12196. [Google Scholar] [CrossRef]
  8. Pay, M.T.; Gangoiti, G.; Guevara, M.; Napelenok, S.; Querol, X.; Jorba, O.; Pérez García-Pando, C. Ozone source apportionment during peak summer events over southwestern Europe. Atmos. Chem. Phys. 2019, 19, 5467–5494. [Google Scholar] [CrossRef]
  9. Grulke, N.E.; Heath, R.L. Ozone effects on plants in natural ecosystems. Plant Biol. 2020, 22, 12–37. [Google Scholar] [CrossRef]
  10. Emberson, L. Effects of ozone on agriculture, forests and grasslands. Philos. Trans. R. Soc. A 2020, 378, 20190327. [Google Scholar] [CrossRef]
  11. Harmens, H.; Mills, G. Ozone pollution: Impacts on Carbon Sequestration in Europe; NERC/Centre for Ecology & Hydrology: Lancaster, UK, 2012. [Google Scholar]
  12. Agathokleous, E.; Feng, Z.; Oksanen, E.; Sicard, P.; Wang, Q.; Saitanis, C.J.; Araminiene, V.; Blande, J.D.; Hayes, F.; Calatayud, V.; et al. Ozone affects plant, insect, and soil microbial communities: A threat to terrestrial ecosystems and biodiversity. Sci. Adv. 2020, 6, eabc1176. [Google Scholar] [CrossRef]
  13. Sharma, P.; Jha, A.B.; Dubey, R.S.; Pessarakli, M. Reactive oxygen species, oxidative damage, and antioxidative defense mechanism in plants under stressful conditions. J. Bot. 2012, 2012, 217037. [Google Scholar] [CrossRef]
  14. Hoshika, Y.; Fares, S.; Savi, F.; Gruening, C.; Goded, I.; De Marco, A.; Sicard, P.; Paoletti, E. Stomatal conductance models for ozone risk assessment at canopy level in two Mediterranean evergreen forests. Agric. For. Meteorol. 2017, 234, 212–221. [Google Scholar] [CrossRef]
  15. Hoshika, Y.; Carrari, E.; Mariotti, B.; Martini, S.; De Marco, A.; Sicard, P.; Paoletti, E. Flux-Based Ozone Risk Assessment for a Plant Injury Index (PII) in Three European Cool-Temperate Deciduous Tree Species. Forests 2020, 11, 82. [Google Scholar] [CrossRef]
  16. Proietti, C.; Anav, A.; De Marco, A.; Sicard, P.; Vitale, M. A multi-sites analysis on the ozone effects on Gross Primary Production of European forests. Sci. Total Environ. 2016, 556, 1–11. [Google Scholar] [CrossRef]
  17. Leisner, C.P.; Ainsworth, E.A. Quantifying the effects of ozone on plant reproductive growth and development. Glob. Change Biol. 2012, 18, 606–616. [Google Scholar] [CrossRef]
  18. Mills, G.; Pleijel, H.; Malley, C.S.; Sinha, B.; Cooper, O.R.; Schultz, M.G.; Neufeld, H.S.; Simpson, D.; Sharps, S.; Feng, Z.; et al. Tropospheric Ozone Assessment Report: Present–day tropospheric ozone distribution and trends relevant to vegetation. Elem. Sci. Anth. 2018, 6, 47. [Google Scholar] [CrossRef]
  19. Calatayud, V.; Cerveró, J.; Sanz, M.J. Foliar, Physiological and growth responses of four maple species exposed to ozone. Water Air Soil Pollut. 2007, 185, 239–254. [Google Scholar] [CrossRef]
  20. Li, P.; Calatayud, V.; Gao, F.; Uddling, J.; Feng, Z. Differences in ozone sensitivity among woody species are related to leaf morphology and antioxidant levels. Tree Physiol. 2016, 36, 1105–1116. [Google Scholar] [CrossRef] [PubMed]
  21. Moura, B.B.; Alves, E.S.; Marabesi, M.A.; Ribeiro de Souza, S.; Schaub, M.; Vollenweider, P. Ozone affects leaf physiology and causes injury to foliage of native tree species from the tropical Atlantic Forest of southern Brazil. Sci. Total Environ. 2018, 610–611, 912–925. [Google Scholar] [CrossRef] [PubMed]
  22. Sicard, P.; Hoshika, Y.; Carrari, E.; De Marco, A.; Paoletti, E. Testing visible ozone injury within a Light Exposed Sampling Site as a proxy for ozone risk assessment for European forests. J. For. Res. 2021, 32, 1351–1359. [Google Scholar] [CrossRef]
  23. Moura, B.B.; Carrari, E.; Dalstein-Richier, L.; Sicard, P.; Leca, S.; Badea, O.; Pitar, D.; Shashikumar, A.; Cirani, M.L.; Paoletti, E.; et al. Bridging experimental and monitoring research for visible foliar injury as bio-indicator of ozone impacts on forests. Ecosyst. Health Sustain. 2022, 8, 2144466. [Google Scholar] [CrossRef]
  24. European Council Directive 2008/50/EC of the European Parliament and of the council of 21st May 2008 on ambient air quality and cleaner air for Europe. Off. J. Eur. Union 2008, 152, 1–44.
  25. Paoletti, E.; Alivernini, A.; Anav, A.; Badea, O.; Carrari, E.; Chivulescu, S.; Conte, A.; Ciriani, M.L.; Dalstein-Richer, L.; De Marco, A.; et al. Toward stomatal–flux based forest protection against ozone: The MOTTLES approach. Sci. Total Environ. 2019, 691, 516–527. [Google Scholar] [CrossRef]
  26. De Marco, A.; Proietti, C.; Anav, A.; Ciancarella, L.; D'Elia, I.; Fares, S.; Fornasier, M.F.; Fusaro, L.; Gualtieri, M.; Manes, F.; et al. Impacts of air pollution on human and ecosystem health, and implications for the National Emission Ceilings Directive: Insights from Italy. Environ. Int. 2019, 125, 320–333. [Google Scholar] [CrossRef]
  27. Bussotti, F. Functional leaf traits, plant communities and acclimation processes in relation to oxidative stress in trees: A critical overview. Glob. Change Biol. 2008, 14, 2727–2739. [Google Scholar] [CrossRef]
  28. Feng, Z.; Büker, P.; Pleijel, H.; Emberson, L.; Karlsson, P.E.; Uddling, J. A unifying explanation for variation in ozone sensitivity among woody plants. Glob. Change Biol. 2018, 24, 78–84. [Google Scholar] [CrossRef]
  29. Bennett, J.P.; Rassat, P.; Berrang, P.; Karnosky, D.F. Relationships between leaf anatomy and ozone sensitivity of Fraxinus pennsylvanica marsh. and Prunus serotina Ehrh. Environ. Exp. Bot. 1992, 32, 33–41. [Google Scholar] [CrossRef]
  30. Wieser, G.; Hecke, K.; Tausz, M.; Matyssek, R. Foliage type specific susceptibility to ozone in Picea abies, Pinus cembra and Larix decidua at treeline: A synthesis. Environ. Exp. Bot. 2013, 90, 4–11. [Google Scholar] [CrossRef]
  31. Paoletti, E.; Materassi, A.; Fasano, G.; Hoshika, Y.; Carriero, G.; Silaghi, D.; Badea, O. A new-generation 3D ozone FACE (free air controlled exposure). Sci. Total Environ. 2017, 575, 1407–1414. [Google Scholar] [CrossRef]
  32. CLRTAP, 2017. Mapping Critical Levels for Vegetation, Chapter III of Manual on Methodologies and Criteria for Modelling and Mapping Critical Loads and Levels and Air Pollution Effects, Risks and Trends. UNECE Convention on Long-Range Transboundary Air Pollution. Available online: www.icpmapping.org (accessed on 1 July 2022).
  33. Paoletti, E.; Sicard, P.; Hoshika, Y.; Fares, S.; Badea, O.; Pitar, D.; Popa, I.; Anav, A.; Barbara, B.B.; De Marco, A. Towards long-term sustainability of stomatal ozone flux monitoring at forest sites. Sustain. Horiz. 2022, 2, 100018. [Google Scholar] [CrossRef]
  34. Jarvis, P.G. Interpretation of variations in leaf water potential and stomatal conductance found in canopies in field. Philos. Trans. R. Soc. Lond. B 1976, 273, 593–610. [Google Scholar]
  35. Anav, A.; De Marco, A.; Proietti, C.; Alessandri, A.; Dell’Aquila, A.; Cionni, I.; Friedlingstein, P.; Khvorostyanov, D.; Menut, L.; Paoletti, E.; et al. Comparing concentration-based (AOT40) and stomatal uptake (PODY) metrics for ozone risk assessment to European forests. Glob. Change Biol. 2016, 22, 1608–1627. [Google Scholar] [CrossRef] [PubMed]
  36. Hoshika, Y.; Osada, Y.; De Marco, A.; Penuelas, J.; Paoletti, E. Global diurnal and nocturnal parameters of stomatal conductance in woody plants and major crops. Glob. Ecol. Biogeogr. 2018, 27, 257–275. [Google Scholar] [CrossRef]
  37. Easlon, H.M.; Bloom, A.J. Easy Leaf Area: Automated digital image analysis for rapid and accurate measurement of leaf area. Appl. Plant Sci. 2014, 2, 1400033. [Google Scholar] [CrossRef]
  38. Schaub, M.; Calatayud, V.; Ferretti, M.; Brunialti, G.; Lövblad, G.; Krause, G.; Sanz, M.J. Part VIII: Monitoring of Ozone Injury. In UNECE ICP Forests Programme Coordinating Centre (Ed) Manual on Methods and Criteria for Harmonized Sampling, Assessment, Monitoring and Analysis of the Effects of Air Pollution on Forests; Thünen Institute of Forest Ecosystems: Eberswalde, Germany, 2016; p. 14. [Google Scholar]
  39. Paoletti, E.; Ferrara, A.M.; Calatayud, V.; Cerveró, J.; Giannetti, F.; Sanz, M.J.; Manning, W.J. Deciduous shrubs for ozone bioindication: Hibiscus syriacus as an example. Environ. Pollut. 2009, 157, 865–870. [Google Scholar] [CrossRef]
  40. Gerosa, G.; Marzuoli, R.; Bussotti, F.; Pancrazi, M.; Ballarin-Denti, A. Ozone sensitivity of Fagus sylvatica and Fraxinus excelsior young trees in relation to leaf structure and foliar ozone uptake. Environ. Pollut. 2003, 125, 91–98. [Google Scholar] [CrossRef]
  41. Vollenweider, P.; Günthardt-Goerg, M.S.; Menard, T.; Baumgarten, M.; Matyssek, R.; Schaub, M. Macro- and microscopic leaf injury triggered by ozone stress in beech foliage (Fagus sylvatica L). Ann. For. Sci. 2019, 76, 71. [Google Scholar] [CrossRef]
  42. VanderHeyden, D.; Skelly, J.; Innes, J.; Hug, C.; Zhang, J.; Landolt, W.; Bleuler, P. Ozone exposure thresholds and foliar injury on forest plants in Switzerland. Environ. Pollut. 2001, 111, 321–331. [Google Scholar] [CrossRef]
  43. Paoletti, E. Ozone impacts on Mediterranean forests: A review. Environ. Pollut. 2006, 144, 463–474. [Google Scholar] [CrossRef]
  44. Calatayud, V.; Cerveró, J.; Calvo, E.; García-Breijo, F.J.; Reig-Armiñana, J.; Sanz, M.J. Responses of evergreen and deciduous Quercus species to enhanced ozone levels. Environ. Pollut. 2011, 159, 55–63. [Google Scholar] [CrossRef] [PubMed]
  45. Nunn, A.J.; Kozovits, A.R.; Reiter, I.M.; Heerdt, C.; Leuchner, M.; Lutz, C.; Liu, X.; Low, M.; Winkler, J.B. Comparison of ozone uptake and sensitivity between a phytotron study with young beech and a field experiment with adult beech (Fagus sylvatica). Environ. Pollut. 2005, 137, 494–506. [Google Scholar] [CrossRef] [PubMed]
  46. Kolb, T.E.; Matyssek, R. Limitations and perspectives about scaling ozone impacts in trees. Environ. Pollut. 2001, 115, 373–393. [Google Scholar] [CrossRef] [PubMed]
  47. Ryan, M.G.; Phillips, N.; Bond, B.J. The hydraulic limitation hypothesis revisited. Plant Cell Environ. 2006, 29, 367–381. [Google Scholar] [CrossRef] [PubMed]
  48. Hoshika, Y.; Cotrozzi, L.; Marchica, A.; Carrari, E.; Lorenzini, G.; Nali, C.; Paoletti, E.; Pellegrini, E. Season-long exposure of bilberry plants to realistic and future ozone pollution improves the nutraceutical quality of fruits. Sci. Total Environ. 2022, 822, 153577. [Google Scholar] [CrossRef]
  49. Sicard, P.; De Marco, A.; Carrari, E.; Dalstein-Richier, L.; Hoshika, Y.; Badea, O.; Pitar, D.; Fares, S.; Conte, A.; Popa, I.; et al. Epidemiological derivation of flux-based critical levels for visible ozone injury in European forests. J. For. Res. 2020, 31, 1509–1519. [Google Scholar] [CrossRef]
  50. Hoshika, Y.; Fares, S.; Pellegrini, E.; Conte, A.; Paoletti, E. Water use strategy affects avoidance of ozone stress by stomatal closure in Mediterranean trees–A modelling analysis. Plant Cell Environ. 2020, 43, 611–623. [Google Scholar] [CrossRef]
  51. Matyssek, R.; Bytnerowicz, A.; Karlsson, P.E.; Paoletti, E.; Sanz, M.; Schaub, M.; Wieser, G. Promoting the O3 flux concept for European forest trees. Environ. Pollut. 2007, 146, 587–607. [Google Scholar] [CrossRef]
  52. Munné-Bosch, S.; Peñuelas, J. Drought-induced oxidative stress in strawberry tree (Arbutus unedo L.) growing in Mediterranean field conditions. Plant Sci. 2004, 166, 1105–1110. [Google Scholar] [CrossRef]
  53. Fernández-Marín, B.; Hernández, A.; Garcia-Plazaola, J.I.; Esteban, R.; Míguez, F.; Artetxe, U.; Gómez-Sagasti, M.T. Photoprotective strategies of Mediterranean plants in relation to morphological traits and natural environmental pressure: A meta-analytical approach. Front. Plant Sci. 2017, 8, 1051. [Google Scholar] [CrossRef]
  54. Pellegrini, E.; Hoshika, Y.; Dusart, N.; Cotrozzi, L.; Gérard, J.; Nali, C.; Vaultier, M.-N.; Jolivet, Y.; Lorenzini, G.; Paoletti, E. Antioxidative responses of three oak species under ozone and water stress conditions. Sci. Total Environ. 2019, 647, 390–399. [Google Scholar] [CrossRef] [PubMed]
  55. Bussotti, F.; Desotgiu, R.; Cascio, C.; Strasser, R.J.; Gerosa, G.; Marzuoli, R. Photosynthesis responses to ozone in young trees of three species with different sensitivities, in a 2-year open-top chamber experiment (Curno, Italy). Physiol. Plant. 2007, 130, 122–135. [Google Scholar] [CrossRef]
  56. Li, S.; Tosens, T.; Harley, P.C.; Jiang, Y.; Kanagendran, A.; Grosberg, M.; Jaamets, K.; Niinemets, Ü. Glandular trichomes as a barrier against atmospheric oxidative stress: Relationships with ozone uptake, leaf damage, and emission of LOX products across a diverse set of species. Plant Cell Environ. 2018, 41, 1263–1277. [Google Scholar] [CrossRef]
  57. Oksanen, E. Trichomes form an important first line of defence against adverse environment—New evidence for ozone stress mitigation. Plant Cell Environ. 2018, 41, 1497–1499. [Google Scholar] [CrossRef]
  58. Gottardini, E.; Cristofori, A.; Cristofolini, F.; Nali, C.; Pellegrini, E.; Bussotti, F.; Ferretti, M. Chlorophyll-related indicators are linked to visible ozone symptoms: Evidence from a field study on native Viburnum lantana L. plants in northern Italy. Ecol. Indic. 2014, 39, 65–74. [Google Scholar] [CrossRef]
Figure 1. Annual values of AOT40 and POD1 for each site. The symbols • and * refer to species present only in the ITP or LESS, respectively. If no symbols are present, species were found in both LESS and ITP.
Forests 14 00901 g001
Figure 2. (A) Linear relationship (p = 0.005) between species-specific POD1 and relative frequency of O3 VFI (SS_LESS) over the period 2018–2022 (n = 55). (B) Linear relationship (p < 0.001) between LIF and relative frequency of O3 VFI (SS_LESS) over the period 2018–2022 (n = 55). (C) Linear relationship (p < 0.001) between species-specific POD1 and mean percentage value of leaf area affected by O3 VFI for ITP-dominant species (PII_ITP) over the period 2018–2022 (n = 44). (D) Linear relationship (p < 0.001) between LIF and mean percentage value of leaf area affected by O3 VFI for ITP-dominant species (PII_ITP) over the period 2018–2022 (n = 44). The linear regression lines show 95% confidence intervals in gray. ** p < 0.01, *** p < 0.001.
Forests 14 00901 g002
Figure 3. (A) Linear relationship (p = 0.09, ns) between AOT40 and Plant Injury Index (PII_FACE) calculated for species hosted in the O3 FACE (n = 25). (B) Linear relationship (p = 0.003) between POD1 and Plant Injury Index (PII_FACE) calculated for species hosted in the O3 FACE (n = 25). (C) Linear relationship (p < 0.001) between LIF and Plant Injury Index (PII_FACE) calculated for species hosted in the O3 FACE (n = 25). The linear regression lines show 95% confidence intervals in gray. ns not significant, ** p < 0.01, *** p < 0.001.
Forests 14 00901 g003
Table 1. Features of the nine Italian sites belonging to the MOTTLES network.
Site CodeGeographic CoordinatesAltitudeDominant Tree
Species
Biome
ABR141.86064 N–13.57482 E1500Fagus sylvaticaAlpine
CPZ141.70423 N–12.35719 E0Quercus ilexMediterranean
CPZ241.70429 N–12.35732 E0Phyllirea latifoliaMediterranean
CPZ341.68068 N–12.39084 E0Pinus pineaMediterranean
EMI144.71998 N–10.20345 E200Quercus petraeaContinental
LAZ142.82746 N–11.89817 E690Quercus cerrisMediterranean
PIE145.68374 N–8.06994 E1150Fagus sylvaticaAlpine
TRE146.35825 N–11.49405 E1800Picea abiesAlpine
VEN146.06335 N–12.38810 E1100Fagus sylvaticaAlpine
Table 2. Recorded annual averages of air temperature (T), relative humidity (RH), vapor pressure deficit (VPD), photosynthetically active radiation (PAR), soil water content at 10 cm depth (SWC), annual rainfall and daily O3 concentration at the 9 Italian forest sites. Data refer to the period 2018–2022 ± standard error.
SiteT
(°C)
RH
(%)
VPD
(kPa)
PAR
(μmol m−2 s−1)
SWC
(%)
Rainfall
(mm)
O3
(ppb)
ABR17.67 ± 0.2775.90 ± 2.000.31 ± 0.04374.44 ± 10.6728.90 ± 1.30893.81 ± 157.7352.13 ± 2.08
CPZ *16.30 ± 0.2578.60 ± 1.000.47 ± 0.04412.73 ± 14.6313.01 ± 0.84623.95 ± 125.7929.58 ± 2.16
EMI113.11 ± 1.1174.00 ± 1.000.51 ± 0.09314.36 ± 14.7515.06 ± 0.65793.43 ± 101.9136.50 ± 2.14
LAZ113.54 ± 0.2573.50 ± 2.000.52 ± 0.06369.75 ± 11.6417.38 ± 0.711304.82 ± 328.5745.59 ± 1.53
PIE18.52 ± 0.9674.20 ± 1.000.31 ± 0.02305.80 ± 11.3827.31 ± 1.791765.56 ± 363.5950.20 ± 1.09
TRE15.25 ± 0.5570.50 ± 1.000.29 ± 0.03361.84 ± 21.8239.45 ± 4.41814.65 ± 113.4945.61 ± 2.45
VEN17.56 ± 0.3986.80 ± 1.000.17 ± 0.02329.30 ± 13.7940.38 ± 0.431703.58 ± 291.6033.96 ± 0.94
* Data are the same for CPZ1, CPZ2, and CPZ3, except for SWC, as it is equal to 16.72 ± 1.83 in CPZ3.
Table 3. Recorded daily mean ± standard error of air temperature (T), relative humidity (RH), vapor pressure deficit (VPD), photosynthetically active radiation (PAR), and daily O3 concentration at FACE experiment for years 2016–2020. Plants were subjected to three levels of O3 (AA—Ambient Air, 1.5 × Ambient Air, and 2.0 × Ambient Air).
YearT (°C)RH (%)VPD (kPa)PAR (μmol m−2 s−1)O3 (ppb)
AA1.5 × 2.0 ×
201622.90 ± 0.3057.00 ± 3.001.50 ± 0.08578 ± 1334.7 ± 0.6051.2 ± 0.9066.1 ±1.00
201724.50 ± 0.4047.60 ± 1.301.89 ± 0.08564 ± 1640.3 ± 1.2051.7 ± 1.8063.8 ± 2.30
201822.80 ± 0.2955.60 ± 0.831.48 ± 0.04527 ± 1335.2 ± 0.7053.1 ± 1.1065.2 ± 1.40
201923.50 ± 0.3555.10 ± 0.941.61 ± 0.06548 ± 1438.8 ± 0.9056.2 ± 1.5068.6 ± 1.80
202022.10 ± 0.3961.80 ± 1.121.31 ± 0.05475 ± 1737.5 ± 1.1052.3 ± 1.7073.3 ± 2.30
Table 4. Relative frequency of symptomatic species within the LESS (SS_LESS) for the period 2018–2022.
YearLESS SiteFagus sylvaticaRubus spp.Vaccinium myrtillusPicea abies
2018VEN155
ABR120
PIE156
2019VEN190
ABR145
PIE150
TRE1 44
2020VEN170
ABR125
PIE1100
LAZ1 10
CPZ3 100
TRE1 63
2021VEN190
ABR147
PIE11009
EMI1 20
LAZ1 57
TRE1 79
2022VEN1100
ABR140
PIE14064.266.6
EMI1 66.6
TRE1 10016.6
Table 5. Average percentage value ± standard error of O3 VFI per tree (PII_ITP) for each species inside the forest plot (ITP; n = 5).
YearITP SiteFagus sylvaticaPinus pineaPicea abies
2018VEN17.41 ± 2.15
ABR16.90 ± 3.08
PIE12.20 ± 0.91
CPZ3 0.44 ± 0.35
2019VEN16.40 ± 3.60
PIE11.50 ± 0.49
2020VEN18.90 ± 1.99
ABR10.30 ± 0.06
PIE13.98 ± 1.63
2021VEN14.90 ± 1.05
ABR11.48 ± 0.56
PIE10.41 ± 0.13
TRE1 0.32 ± 0.10
2022VEN17.12 ± 1.50
ABR10.68 ± 0.29
PIE11.85 ± 0.80
Table 6. Plant Injury Index (PII) for species subjected to fumigation in O3 FACE (years 2016–2020). For each O3 treatment (Ambient Air, 1.5 × , and 2.0 × ), the species-specific PII (mean ± standard error) is shown.
YearSpeciesO3 TreatmentPII (%)
2016Populus maximowiczii Henry X P. × berolinensis DippelAmbient Air1.52 ± 0.74
1.5 × 5.79 ± 1.99
2.0 × 9.07 ± 1.96
2017Arbutus unedoAmbient Air0.01 ± 0.01
1.5 × 0.01 ± 0.01
2.0 × 0.08 ± 0.05
2018Phillyrea angustifoliaAmbient Air0
1.5 × 0
2.0 × 0
2018Vaccinium myrtillusAmbient Air1.76 ± 0.64
2.0 × 9.14 ± 0.35
2018Sorbus aucupariaAmbient Air3.99 ± 0.71
2.0 × 11.27 ± 2.40
2018Alnus glutinosaAmbient Air0.66 ± 0.51
2.0 × 7.04 ± 1.88
2019Pinus pineaAmbient Air0
1.5 × 0
2.0 × 0
2020Populus maximowiczii Henry X P. × berolinensis DippelAmbient Air1.52 ± 0.79
1.5 × 6.29 ± 2.02
2.0 × 10.02 ± 2.11
2020Populus x euramericana I-214Ambient Air0.09 ± 0.02
1.5 × 1.88 ± 0.72
2.0 × 4.02 ± 1.33
Disclaimer/Publisher’s Note: The statements, opinions and data contained in all publications are solely those of the individual author(s) and contributor(s) and not of MDPI and/or the editor(s). MDPI and/or the editor(s) disclaim responsibility for any injury to people or property resulting from any ideas, methods, instructions or products referred to in the content.

