Article

Effects of Climate on Variation of Soil Organic Carbon and Alkali-Hydrolyzed Nitrogen in Subtropical Forests: A Case Study of Zhejiang Province, China

1
State Key Laboratory of Subtropical Silviculture, Zhejiang A & F University, Hangzhou 311300, China
2
Zhejiang Province Key Think Tank—Institute of Ecological Civilization, Zhejiang A & F University, Hangzhou 311300, China
3
Key Laboratory of Carbon Cycling in Forest Ecosystems and Carbon Sequestration of Zhejiang Province, Zhejiang A & F University, Hangzhou 311300, China
4
School of Environmental and Resources Science, Zhejiang A & F University, Hangzhou 311300, China
5
Forest Resource Monitoring Center of Zhejiang Province, Hangzhou 310000, China
6
Forestry and Water Bureau of Longyou County, Quzhou 324400, China
*
Author to whom correspondence should be addressed.
These authors contributed equally to this work.
Forests 2023, 14(5), 914; https://doi.org/10.3390/f14050914
Submission received: 30 March 2023 / Revised: 25 April 2023 / Accepted: 25 April 2023 / Published: 28 April 2023
(This article belongs to the Section Forest Soil)

Abstract

:
Subtropical forests play an important role in the global carbon cycle and climate change mitigation. In order to understand the effects of climate factors on soil carbon in subtropical forest ecosystems, it is necessary to make full use of carbon sequestration potential. Soil organic carbon (SOC) and soil alkali-hydrolyzed nitrogen (SAN) were tested in 255 plots of subtropical forests in Zhejiang Province, and their forest reserves from 2020 in Zhejiang Province were compared with those from 2010. The results showed that SOC content significantly increased, but SAN content decreased over those ten years. Combined with random forest (RF) and correlation analysis, the contribution of different climate factors (temperature, precipitation, etc.) to soil carbon storage was analyzed, and the main driving factors were evaluated. The RF model explained that winter (December to February) and spring (March to May) were the most dominant drivers to the 0–10 cm and 10–30 cm increases in SOC. There was a significant positive correlation between precipitation and SOC accumulation (0–30 cm) during winter and spring. The minimum temperatures in summer (June to August) and autumn (September to November) were negatively correlated with SOC accumulation (0–30 cm). Increasing the precipitation or irrigation (cloud seeding) in winter could improve the carbon sequestration capacity of subtropical forest soils. This study provides a new perspective on the sensitivity and potential response of the carbon cycle to climate change in subtropical forest ecosystems.

1. Introduction

The forest soil carbon pool is a vital component of the terrestrial organic carbon pool and is crucial for mitigating global warming. Carbon neutrality, which aims to balance carbon emissions from human activities and industrial production through carbon sequestration, use, and storage, is becoming increasingly important [1]. Forest ecosystems are significant carbon reservoirs and play a critical role in achieving carbon neutrality. The forest soil carbon pool, in particular, is essential for achieving carbon neutrality [2]. Thus, investigating the effects of climate on soil carbon and nitrogen pools is necessary to identify effective ways to increase carbon sinks.
Soil organic carbon (SOC) accounts for approximately two-thirds of the global soil carbon pool [3]. SOC research has been conducted in various countries to estimate carbon storage [4,5,6,7,8]. SOC primarily derives from decaying vegetation, fungal and bacterial growth, and metabolic activities of organisms [9]. Feng et al. [10] discovered that changes in aboveground litter and root input significantly affect SOC and microbial communities in forest ecosystems. Litter increases the SOC pool and microbial biomass. Soil microorganisms significantly contribute to ecosystem carbon storage [11]. According to Waldrop and Firestone [12], microbial communities alter their composition and function based on environmental conditions such as temperature, humidity, and nutrient availability. Wang et al. [13] examined the different effects of warming duration on bacterial and fungal communities and their association with the soil carbon pool. Temperature and soil moisture are the most important factors affecting the response of bacterial community composition and structure to warming [14]. Therefore, understanding the responses of SOC and soil microorganisms to climate is crucial for forest management and achieving carbon neutrality. Further research in this direction can address the shortcomings of our efforts to increase soil carbon sinks in forest management. As an essential component of the soil nutrient pool, soil nitrogen reservoirs are vital for plant growth and soil microbial community activities. Additionally, soil nitrogen content can impact SOC. Li et al. [15] showed that a reduction in exogenous nitrogen input significantly decreased SOC and soil nitrogen pool content. He et al.’s [16] study of wetlands demonstrated that water, nitrogen, and salt significantly affect SOC. Soil alkali-hydrolyzed nitrogen (SAN) includes inorganic nitrogen (ammonium nitrogen, nitrate nitrogen) and hydrolyzed organic nitrogen (amino acids, acylammonium, and hydrolyzed proteins), which contain most forms of nitrogen in the soil nitrogen pool. Understanding the responses to SAN and climate can clarify the response characteristics of the soil nitrogen pool to climate, and help adjust the carbon pool of subtropical forests by manipulating water, temperature, and exogenous nitrogen.
Subtropical forest ecosystems are a significant component of the global carbon cycle, and Zhejiang Province is rich in subtropical forest resources [17]. Dong et al. [18] reported the horizontal and vertical distributions of SOC in the 0–100 cm soil in a subtropical forest ecosystem in Zhejiang Province. However, no subsequent analysis was performed in conjunction with climate data. Therefore, this study aims to combine the changes in SOC content and SAN content in Zhejiang Province from 2010 to 2020 with ten-year climate data. The study will analyze the distributions of SOC and SAN accumulation in subtropical forest systems over the past decade. Moreover, it will explore the response of SOC and SAN to climate indices (temperature and precipitation) on a large scale to assist in managing subtropical forest ecosystems in the context of global warming.

2. Materials and Methods

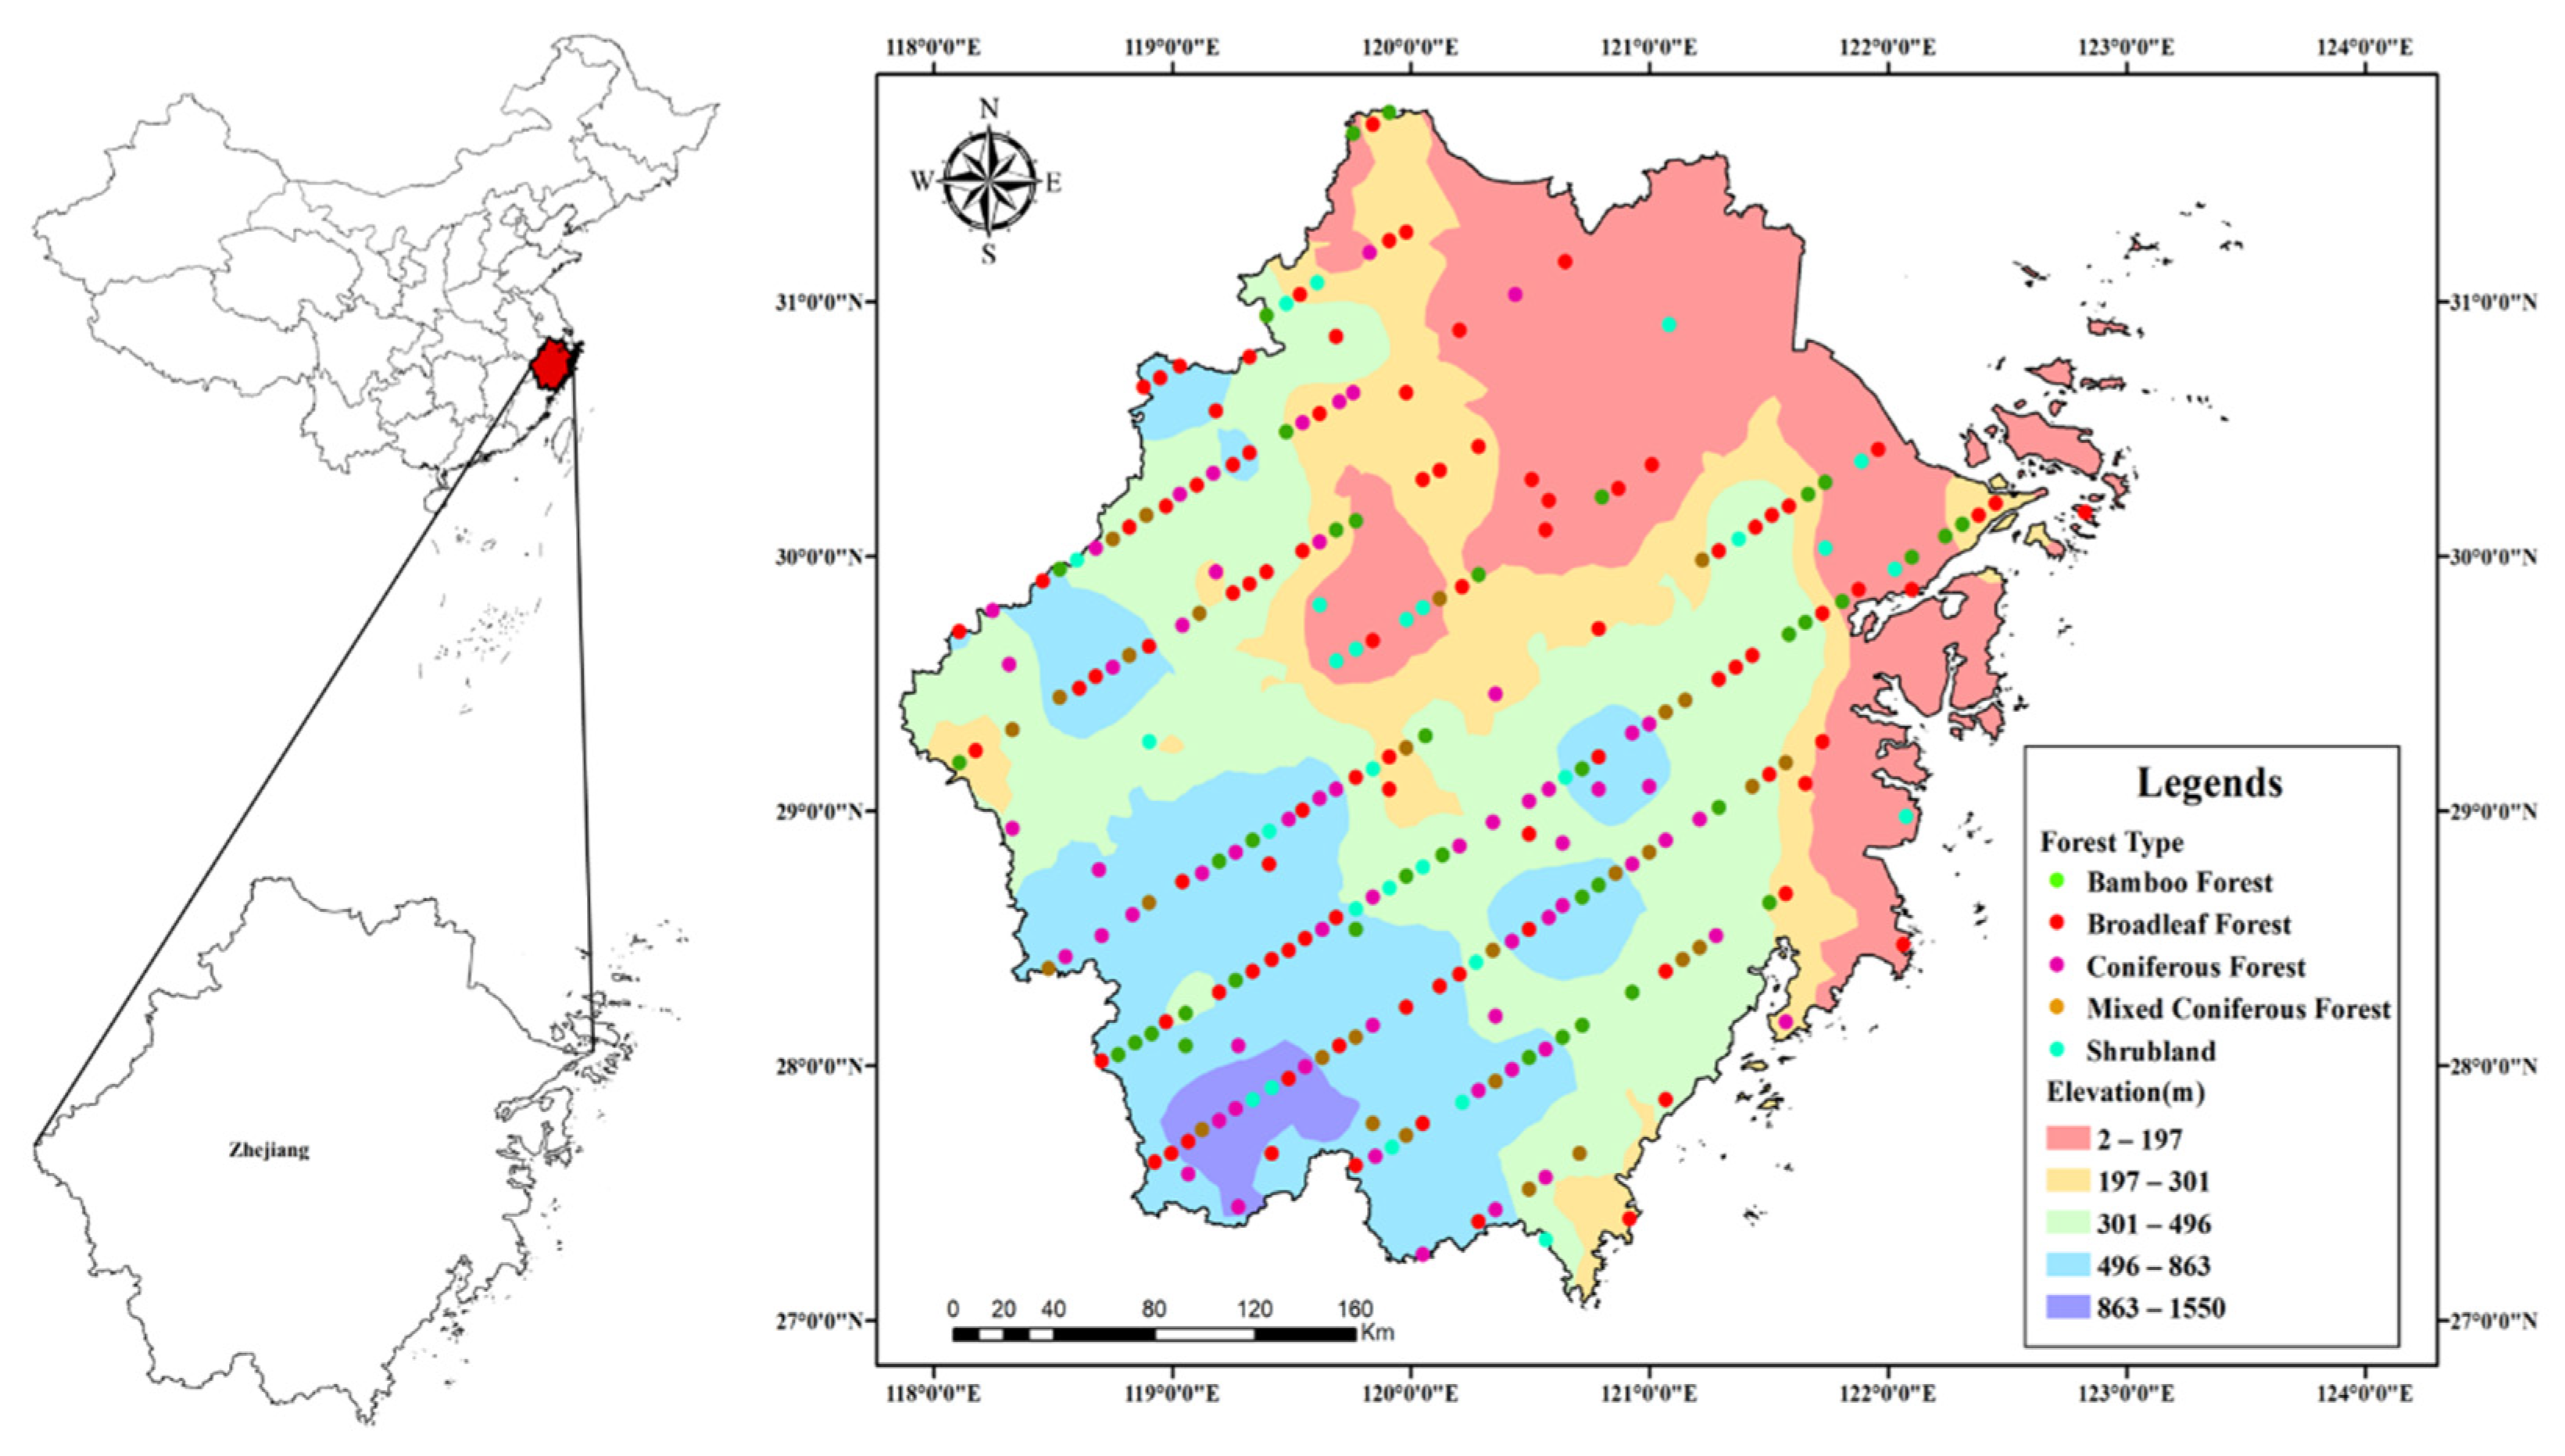
2.1. Description of Study Area

The study area was a subtropical forest in Zhejiang Province. Zhejiang Province is located in southeast China, in the Yangtze River Delta region. This region has a central subtropical, humid monsoon climate, superior natural conditions, and rich forest resources. Zhejiang is located in the middle of the subtropical zone and has a moderate temperature, four distinct seasons, sufficient light, and abundant rainfall. The average annual temperature is between 15 °C and 18 °C, annual sunshine hours are between 1100 and 2200 h, and average annual precipitation is between 1100 mm and 2000 mm. January and July are the months with the lowest and highest temperatures of the year, respectively. Whereas, May and June are the periods of concentrated rainfall. Zhejiang Province has an area of 6.6797 million hectares of forest land. The forest coverage rate is 60.5 percent, and the total volume of living standing trees is 194 million cubic meters. Red soil and yellow soil are the main soil types in Zhejiang Province [19,20]. In this study, we focused on subtropical forest soils in the Zhejiang Province.

2.2. Sample Plots and Data Collection

We established a grid system in a subtropical forest in Zhejiang Province by means of mechanical layout. The sample sites were 4 km (E-W) and 6 km (S-N) in the entire grid system. A fixed sample plot was set up at the location of the sample sites. The fixed sample plot had a side length of 28.28 m, covering an area of 800 square meters. We used a global positioning system (GPS) to obtain the longitude, latitude, and elevation of fixed sampling sites. Based on the survey results, 255 fixed sample sites were selected for typical sampling (Figure 1). To minimize the interference between sampling and the fixed plot, we placed the soil sample south-west of the fixed plot. The north-eastern corner of the soil sample site was 6 m south-west (45°) of the fixed sample site. The soil sample was a square with a side length of 8 m and area of 64 m2. If the investigation factor of the soil sample did not coincide with that of the fixed sample, it would be adjusted in a clockwise direction. Five soil sample sites were established in the south-east, south-west, north-east, north-west, and the middle of the soil sample sites. Each soil profile was dug to a depth of 60 cm. Along the entire length, soil samples were collected from 0–10 cm, 10–30 cm, and 30–60 cm depths. For each layer of soil, the soil from the five sites was thoroughly mixed before being sent back to the laboratory.
The climate data we used were from Climate AP v2.30 [21]. The obtained meteorological data were for the decade 2010–2019. These data included each season of the year and for each year as a whole. The meteorological data obtained included the mean temperature (MT), maximum temperature (MXT), minimum temperature (MIT), mean precipitation (PPT), mean temperature of the coldest month (MCMT), mean temperature of the warmest month (MWMT), temperature difference between MWMT and MCMT (TD), annual heat moisture index (AHM), extreme minimum temperature over 30 years (EMT), extreme maximum temperature over 30 years (EXT), Hargreaves reference evaporation (Eref) (Vishwakarma et al., 2021), and the difference between precipitation and Hargreaves reference evaporation (PE) (Table 1).

2.3. Sample Processing and Analysis

All soil samples were stored indoors and dried at room temperature. Then, they were sieved first through a 0.25 mm mesh and then a 0.149 mm mesh, which filtered out all the roots and gravel. SOC in the soil samples was measured using the potassium dichromate external heating method [22,23]. The SAN was determined using the alkaline hydrolyzable diffusion method [22,24]

2.4. Data Analysis

Statistical analysis of the data was performed using SPSS software. The soil carbon and nitrogen data measured in 2010 and 2020 were collated and compared. Climate data from 2010 to 2020 were matched with soil data.
The general Kriging method is a kind of interpolation method based on the Kriging method but it is more dependent on the measurement error model to achieve accurate or smooth interpolation. It calculates the semi-variogram values between the known points and elements and then finds the appropriate fitting function. Finally, the semi-variogram model was solved and predicted according to a fitting function [25,26]. The method respects the original measured data values, the overall distribution is relatively discrete, and the patch processing is richer, which can present more gradients and smoother edge processing (higher accuracy) on the basis of highlighting the fluctuation of data distribution, and can more objectively represent the spatial distribution characteristics of this study. In this study, the common Kriging method was used to predict the output of the trend removal order of the point elements at one time, and the modeling process was performed using the geostatistical wizard in ArcMap® software.
According to the principle of the random forest (RF) algorithm, based on the bagging method, as a special case, each decision tree has random sampling back to generate a training data set that extracts different characteristic information for training. It exhibits double randomness and enhances the overall stability of the model. The importance of random forest can be used to calculate variables and to analyze the characteristics of contribution. Stochastic forest analysis was used to identify the active drivers of forest soil carbon stocks as climate indicators. We used Python as the programming language for model construction and training, and divided the dataset into training and test sets with a ratio of 8:2, respectively [27]. The change in the mean square error (MSE) between the observed and true values was evaluated when the predictor data were randomly posed, and the significance of each predicted climate indicator variable was determined. In our test, the nTree and nRangdom parameters of the RF method were set to 500 and 1000, respectively. This method was used to cross-validate R2 and evaluate the model. The climate factors that had a great influence on carbon and nitrogen reserves were screened for later analysis.
To understand the SOC content and SAN content of subtropical forest ecosystems, the random forest analysis method was used to study the relationship between climate indicators with SOC and SAN, and to screen the top 25% of the factors of importance. Significance was determined by Pearson’s correlation analysis using SPSS software to clarify the impacts of climate factors on SOC and SAN.

3. Results

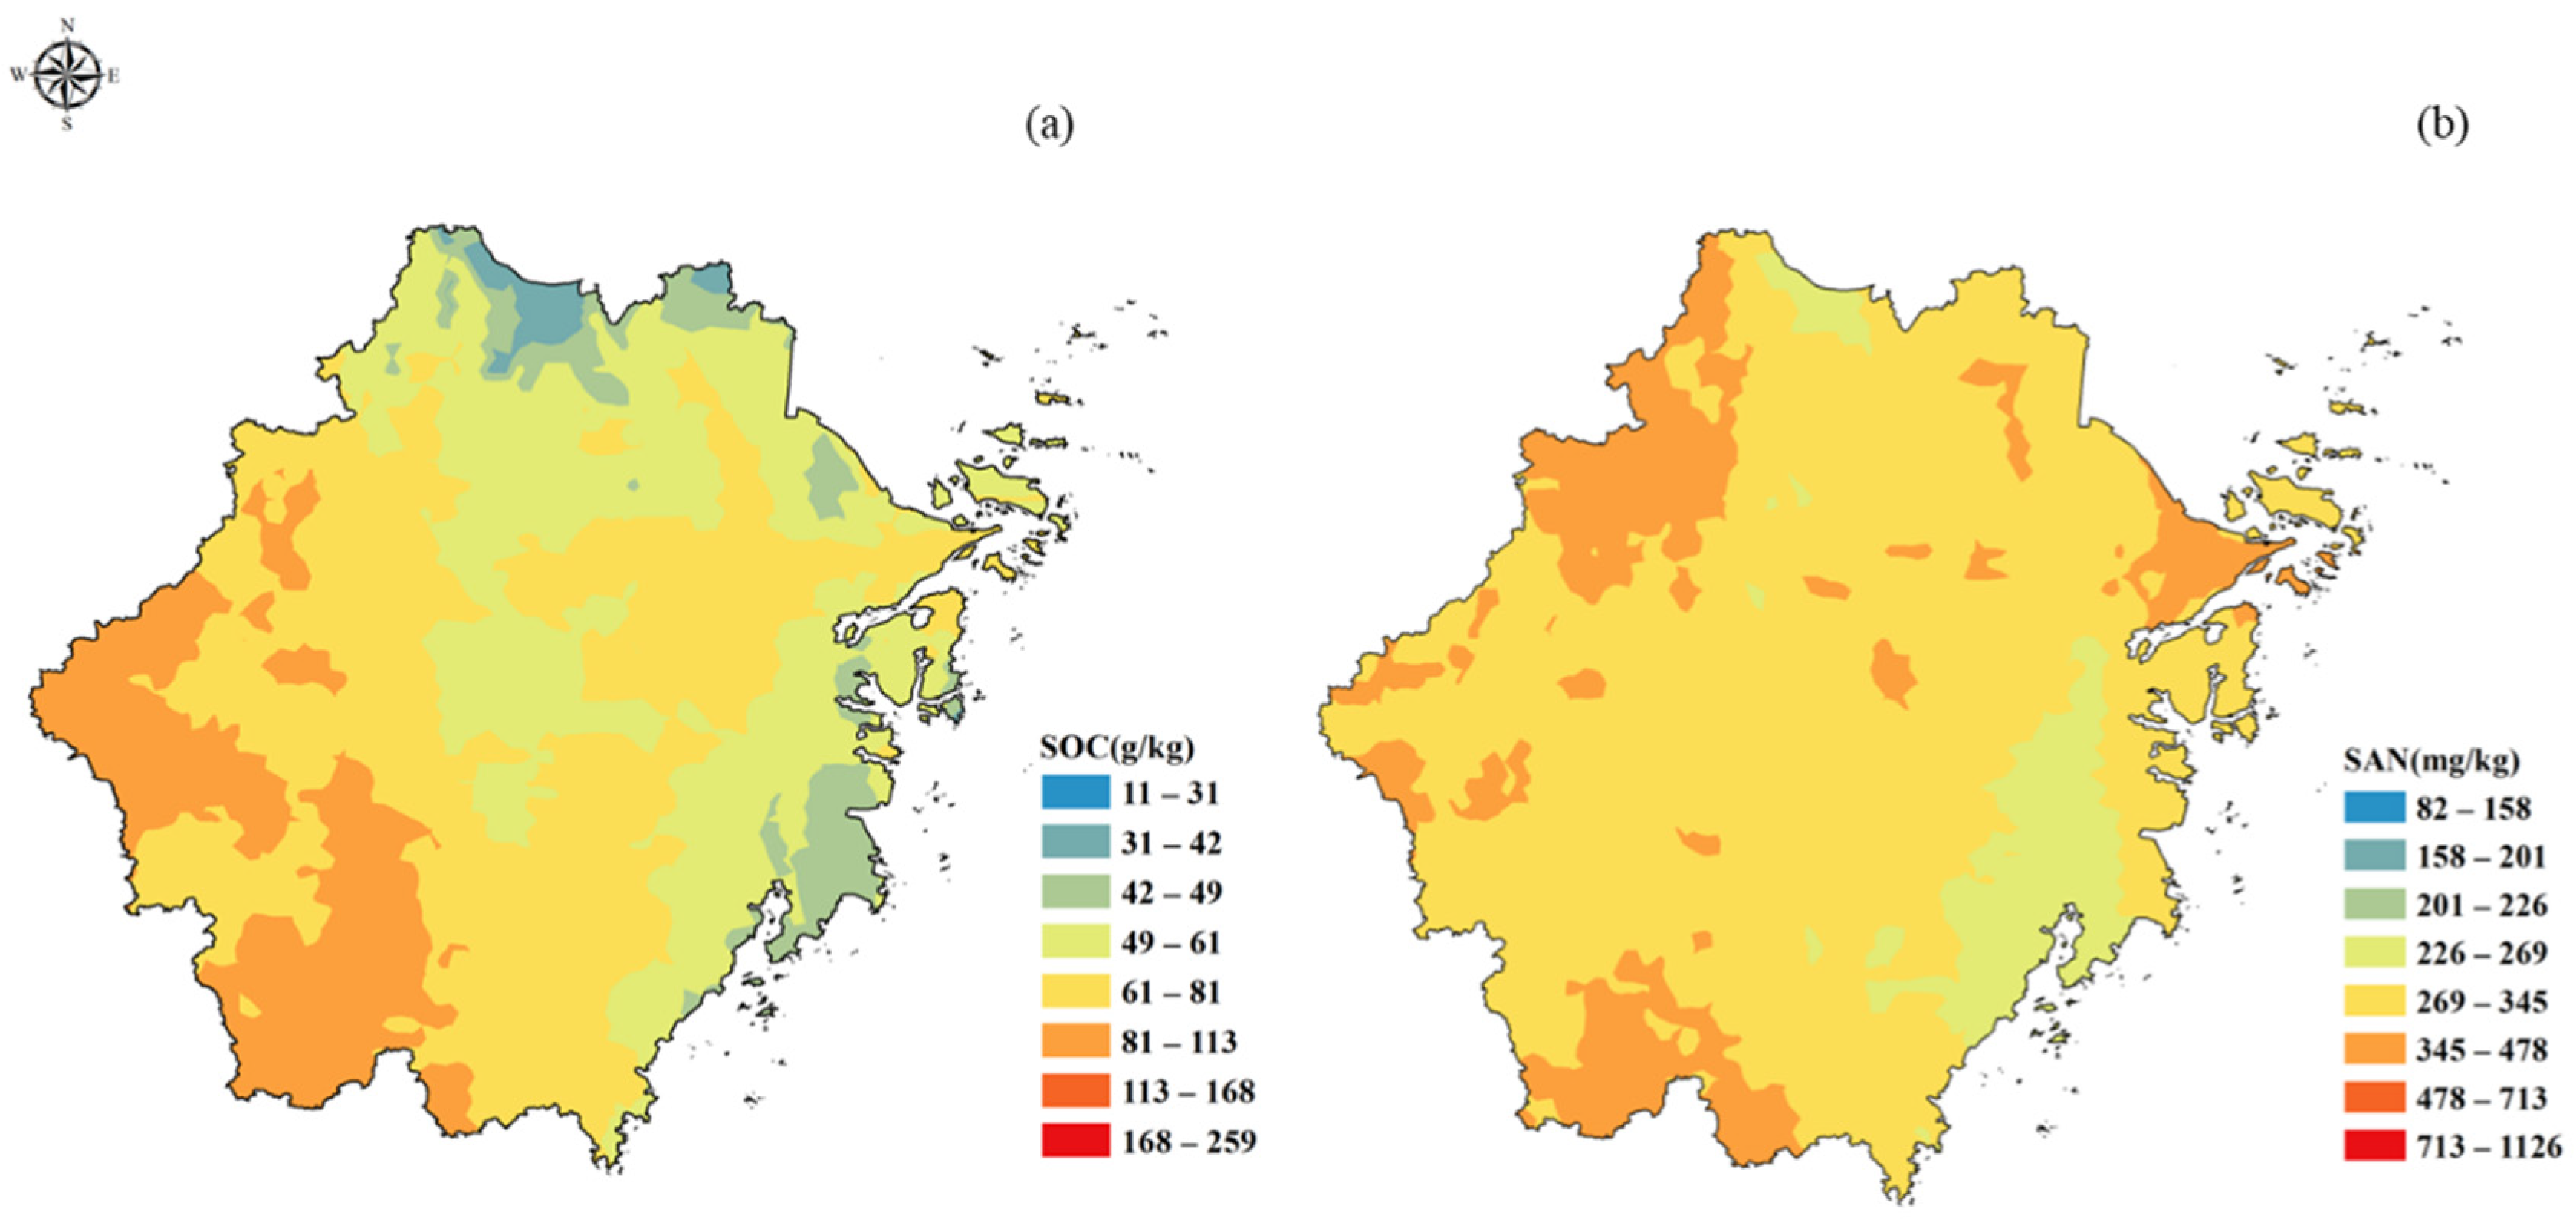
3.1. The Distribution of SOC and SAN in Subtropical Forests in Zhejiang Province

The SOC content at 0–10 cm was 1.76–132.99 g/kg with an average of 35.95 g/kg, at 10–30 cm it was 0.67–92.67 g/kg with an average of 20.98 g/kg, and at 30–60 cm it was 0.89–70.11 g/kg with an average of 13.77 g/kg in 2020. The coefficients of variation (CVs) were 62.81%, 72.74%, and 81.92%, respectively. The SAN content at 0–10 cm was 17.39–606.23 mg/kg with an average of 145.42 mg/kg, at 10–30 cm it was 13.94–554.20 mg/kg with an average of 101.61 mg/kg, and at 30–60 cm it was 0.46–328.71 mg/kg with an average of 74.91 mg/kg. The CVs were 62.79%, 73.97%, and 65.57%, respectively (Table 2).
The Empirical Bayesian Kriging (EBK) modeling process was performed using ArcMAP® software. The measured values of SOC and SAN, in the subtropical forest soils of Zhejiang Province in 2020, were input into the Kriging model (Figure 2).
The overall distribution of SOC content in subtropical forests in Zhejiang Province showed that the SOC content was higher in the western region, lower in the eastern coastal region, and showed a gradual increasing trend from east to west. The overall distribution of SAN in subtropical forests in Zhejiang Province showed that the SAN content was low in the southeast coastal area and high in the northeast coastal area and the northwest and southwest areas. The overall trend of the SAN content gradually increased from east to west.

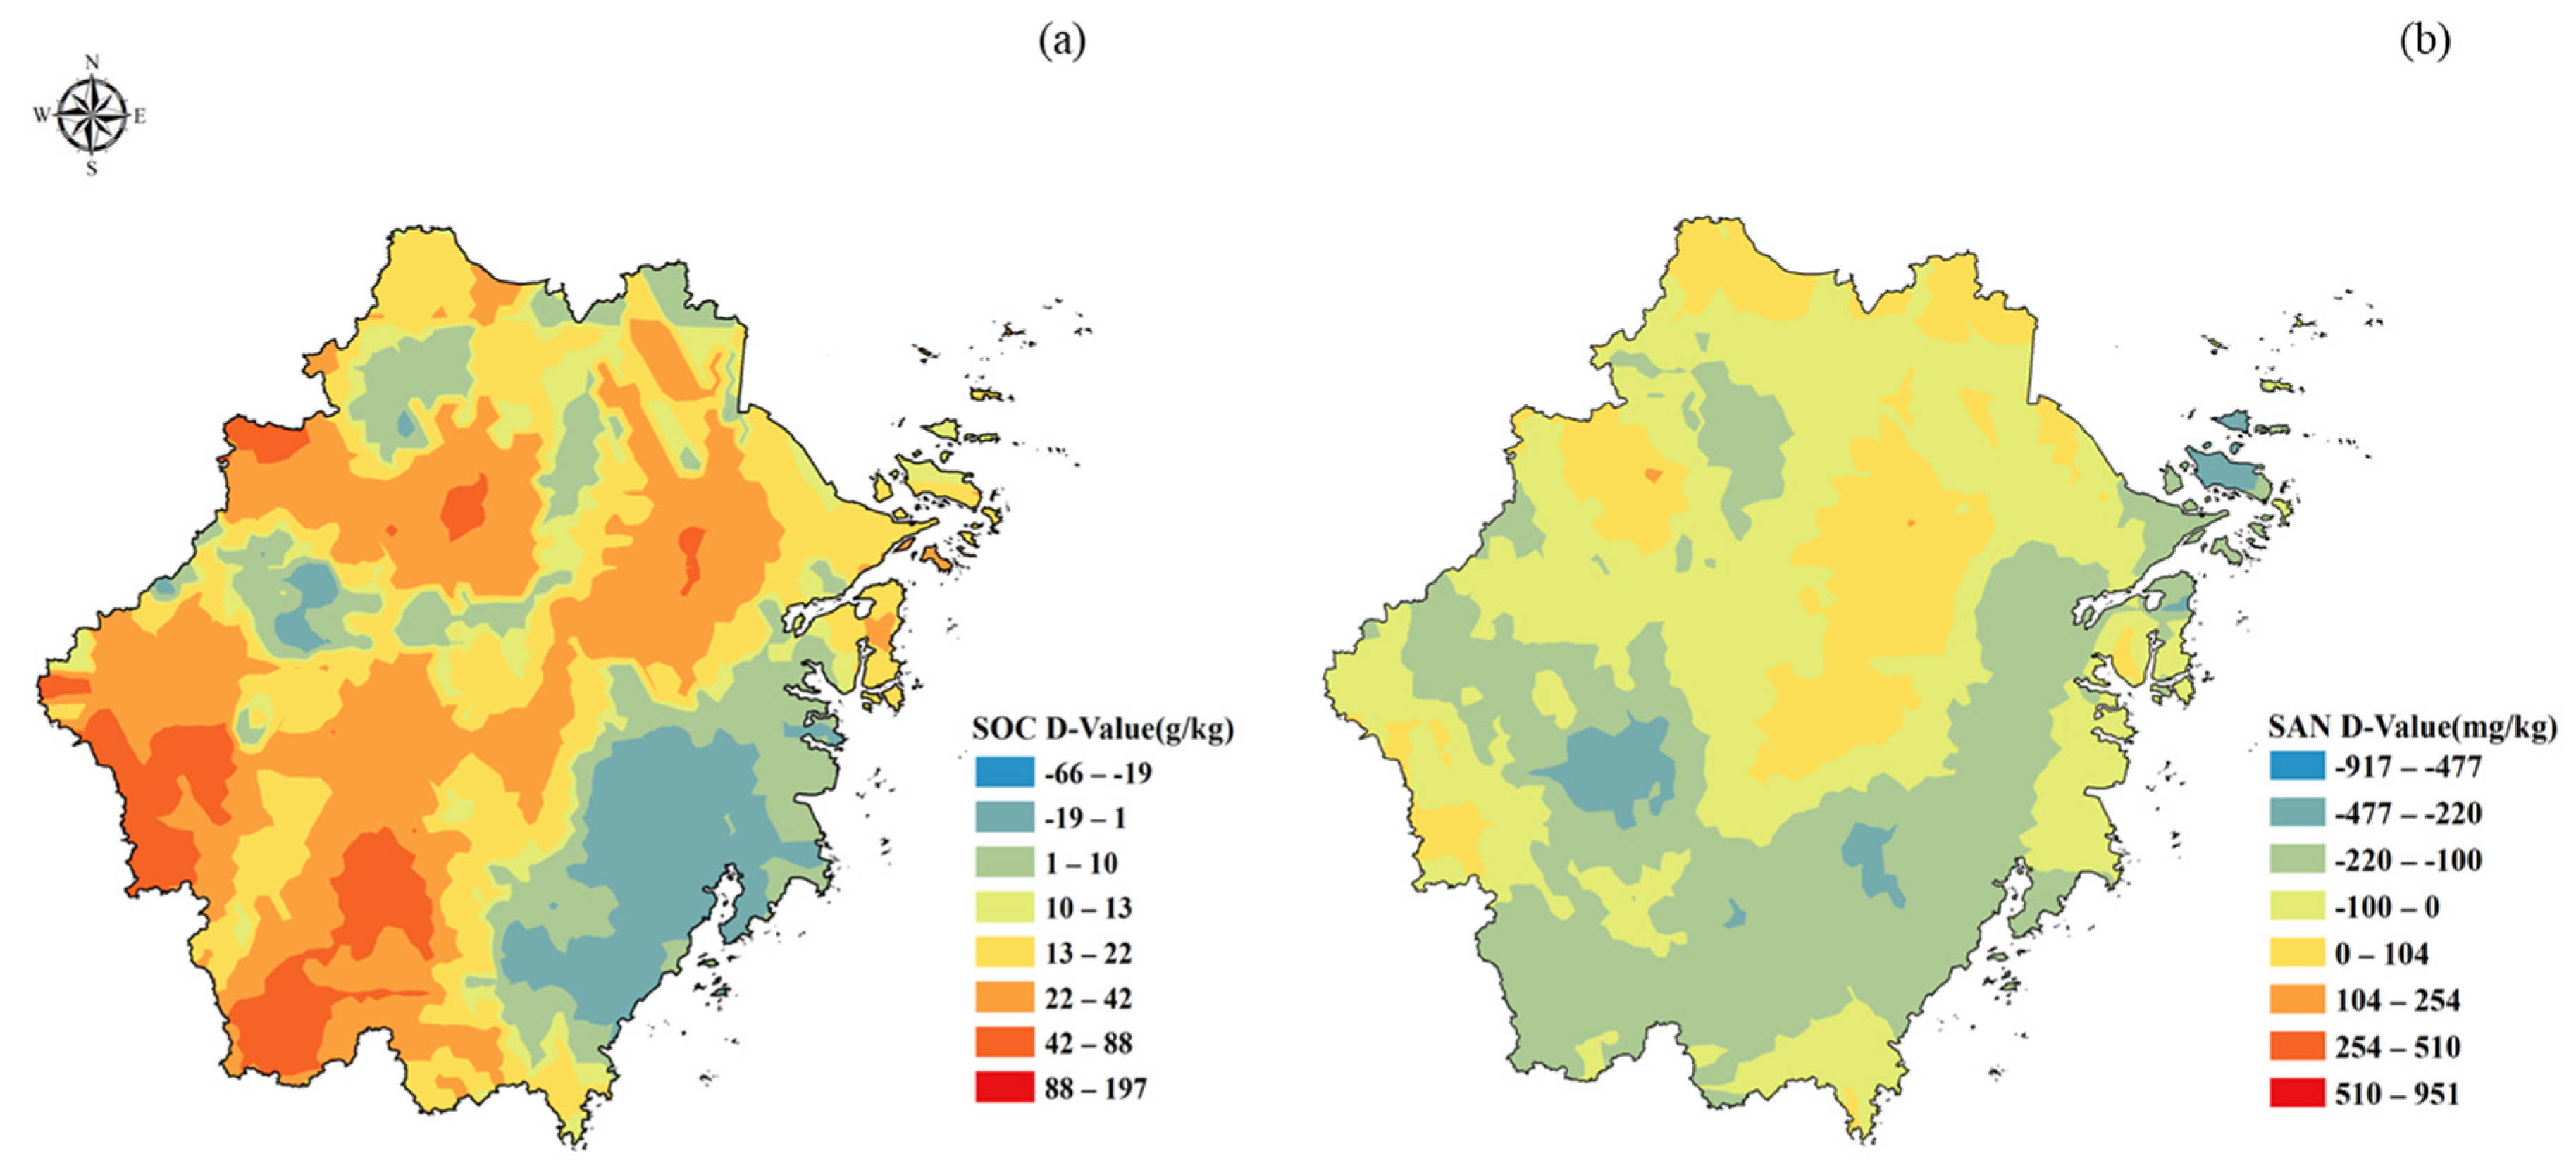
3.2. Variation Characteristics of SOC and SAN in Subtropical Forests

The difference contents of SOC in 2010 and 2020 (SOC content in 2020 subtracts SOC content in 2010) at 0–10 cm was −29.17 to 117.53 g/kg with an average of 10.00 g/kg, at 10–30 cm it was −52.67 to 65.75 g/kg with an average of 6.61 g/kg, and at 30–60 cm it was −48.12 to 57.93 g/kg with an average of 4.98 g/kg. The difference contents of SAN in 2010 and 2020 (SAN content in 2020 subtracts SAN content in 2010) at 0–10 cm was −416.94 to 405.03 mg/kg with an average of −58.43 mg/kg, at 10–30 cm it was −357.19 to 501.84 mg/kg with an average of −29.16 mg/kg, and at 30–60 cm it was −324.49 to 270.33 mg/kg with an average of −1.41 mg/kg (Table 3).
The average difference in SOC content in subtropical forests of Zhejiang Province was positive, indicating that the SOC content increased from 2010 to 2020. The highest accumulation of SOC content was found in the 0–10 cm soil layer, followed by a decrease in SOC content with increasing soil depth, with the lowest concentration in the 10–60 cm soil layer. Conversely, the average difference in SAN content in the subtropical forests of Zhejiang Province was negative, indicating an overall downward trend in SAN content. The SAN content in the 0–10 cm soil layer significantly decreased, while the decrease in SAN content became less significant with increasing soil depth, with an average variation of −1.41 mg/kg in the 30–60 cm soil layer.
To visualize the differences between SOC content and SAN content in subtropical forest soils of Zhejiang Province in 2020 and 2010, the data were input into a Kriging model (Figure 3). The results showed that the decrease in SOC content mainly occurred in the southeastern coastal area of Zhejiang Province, while the SOC content increased in the western, central, and southwestern regions. On the other hand, the SAN content of subtropical forests in Zhejiang Province showed an overall downward trend, with the largest decreasing areas observed in the coastal regions, and smaller, localized decreasing values in central Zhejiang.
Overall, these findings highlight the spatial variability of SOC and SAN content in subtropical forest soils of Zhejiang Province over the past decade, and provide insights into the potential impacts of climate change on soil nutrient dynamics. Further research is needed to investigate the underlying mechanisms driving these changes, and to develop effective strategies for managing and restoring soil fertility in subtropical forest ecosystems.

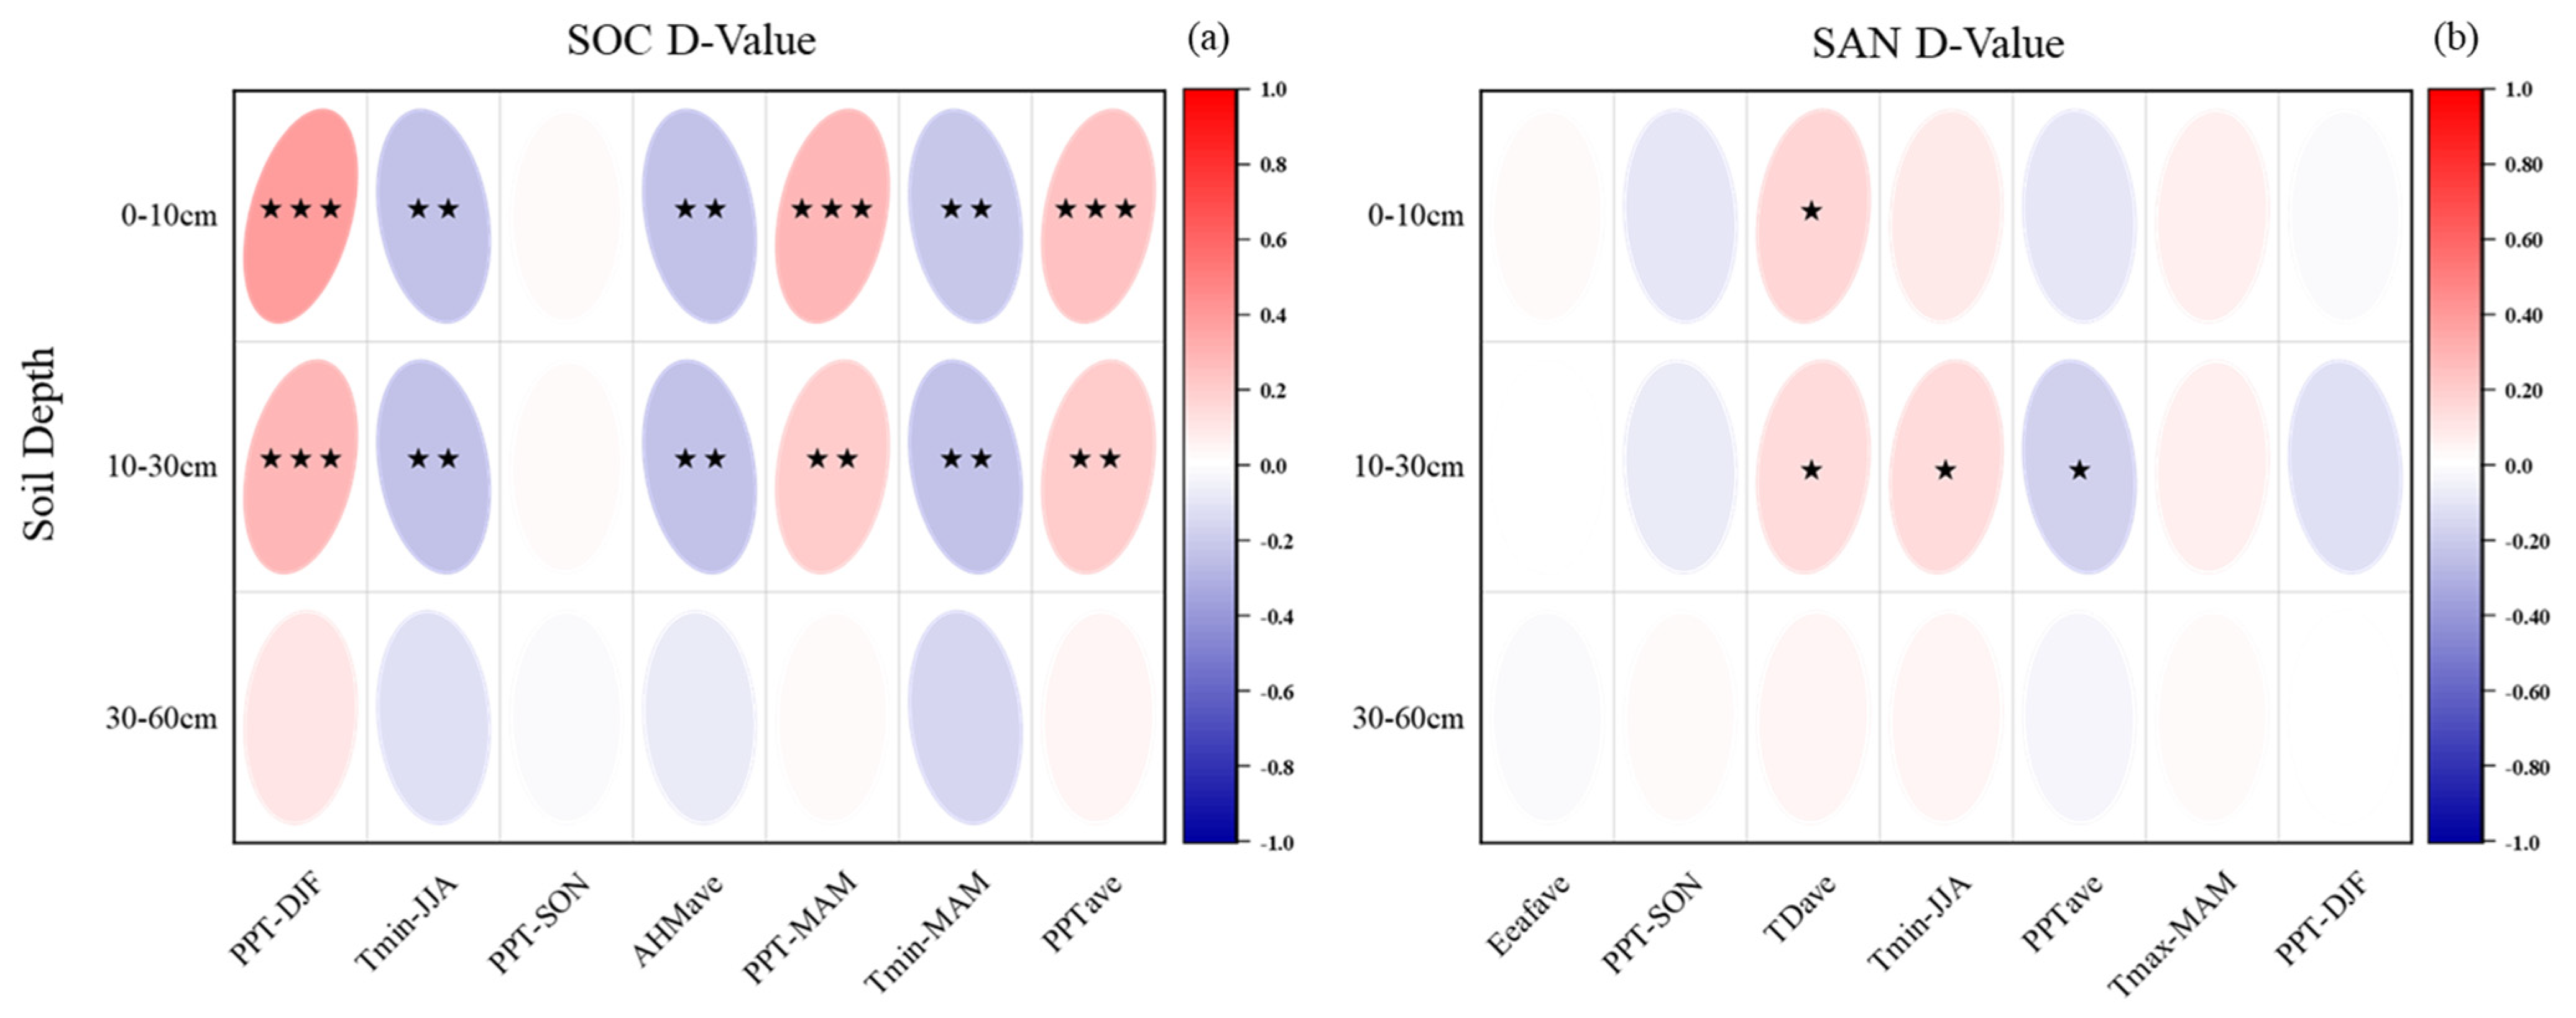
3.3. Effects of Climate Indicators on SOC and SAN Variation Characteristics in Subtropical Forests

The active driving factors of forest soil carbon storage among the climate indicators were identified using a RF analysis. Importance and characteristic contribution analyses were carried out using RF among the 28 climate factor indicators, and the top 25% of the importance indicators were screened out. Then, the selected climate indicators and the changes in SOC content and SAN content were analyzed (Table 4). The correlations between the selected climate indicators and the changes in SOC content and SAN content at different depths were analyzed using SPSS.
The correlation analysis indicated that PPT-DJF showed a significant positive correlation (p < 0.001) with SOC differences at 0–10 cm and 10–30 cm. On the other hand, Tmin-JJA, AHMave, and Tmin-MAM exhibited a significant negative correlation (p < 0.01) with SOC differences at 0–10 cm and 10–30 cm. Additionally, PPT-MAM and PPTave were significantly positively correlated with SOC differences at 0–10 cm (p < 0.001) and 10–30 cm (p < 0.01). TD was significantly positively correlated with SAN differences at 0–10 cm and 10–30 cm (p < 0.05), while Tmin-JJA was significantly positively correlated with SAN differences at 10–30 cm (p < 0.05). PPTave exhibited a significant negative correlation with SAN differences at 10–30 cm (p < 0.05). No significant correlation was observed between the selected climate indicators and the changes in SOC and SAN at 30–60 cm, and the climate indicators did not significantly affect the SOC and SAN contents at 30–60 cm (Figure 4). Precipitation was found to have a considerable influence on SOC variation in the response analysis of SOC and climatic factors.

4. Discussion

4.1. Distribution of SOC and SAN Variations in the Subtropical Forest System in the Zhejiang Province

The distribution of SOC content in subtropical forests in Zhejiang Province indicated a higher SOC content in the western region and a lower content in the eastern coastal region, with a gradual increasing trend from east to west, consistent with the topographic change in the region. These differences in SOC content may be attributed to variations in land use, forest management, and economic and social development. The findings of this study are consistent with those of Dong et al. [18] and Dai et al. [19] regarding SOC in subtropical forest ecosystems in Zhejiang Province. The SOC difference from 2010 to 2020 also followed a similar trend of gradually increasing from east to west. Furthermore, the SOC accumulation was higher in the 0–10 cm region than in the 10–60 cm region, indicating a decrease in SOC variation with increasing soil depth, which is consistent with the findings of Wang et al. [28]. The accumulation of SOC also increased with altitude (Figure 5), and the areas above 600 m showed a much higher average SOC accumulation compared to low-altitude areas. These results suggest that subtropical forest ecosystems have a high carbon sequestration capacity, and SOC accumulation primarily occurs in the surface soil due to the influence of microbial communities and plant life activities.
Regarding SAN distribution, the content of SAN was lower in the southeast coastal areas and higher in the northeast coastal areas, northwest, and southwest areas, with an overall increasing trend from east to west, consistent with the topographic change in Zhejiang Province. Dong et al. [18] reported similar findings. Soil nitrogen and carbon were also found to increase with elevation, while SAN content decreased with increasing soil depth by Podwojewski et al. [29]. However, the difference in soil SAN content significantly decreased from 2010 to 2020, with a significant decrease in SAN content at 0–10 cm and a small change at 30–60 cm. The decrease in SAN content decreased with increasing soil depth. Microbial activity and the soil carbon pool, nitrogen pool, and C/N ratio are significantly related, as reported by Ao et al. [30] and Sui et al. [31]. The decrease in SAN in the subtropical forest in Zhejiang Province may be due to high carbon utilization by soil microorganisms, plant growth activities, and the lack of exogenous nitrogen application in the soil nitrogen pool, leading to a decrease in nitrogen fertilizers. The average variation in SAN content from 30 to 60 cm was small, at −1.41 mg/kg. It was concluded that the main reason for the outflow of SAN is the consumption of nitrogen by the soil surface microbial community, root microbial community, and plant growth.

4.2. Responses of SOC and SAN to Climate Factors in Subtropical Forests

Through analyzing climate factors and SOC differences, it was observed that the minimum temperature from March to August showed a significant negative correlation with SOC difference in the 0–10 cm and 10–30 cm soil layers, indicating that low temperatures in spring and summer are not conducive to soil SOC accumulation (Figure 6). On the other hand, precipitation had a significant positive effect on SOC differences in the 0–10 cm and 10–30 cm soil layers, with winter precipitation (PPT-DJF) and (PPT-MAM) having the most significant effects on soil at 10–10 cm and 10–30 cm, making them important indices for random forest screening. This finding is consistent with previous research that suggested appropriate precipitation increases SOC accumulation in China’s subtropical forest system [32,33]. Moreover, studies by Mao et al. [33], analyzing the correlation between net ecosystem productivity (NEP) and climate factors in subtropical forests of Zhejiang Province, demonstrated that precipitation is a key climate factor, influencing carbon sequestration in middle-aged forests (2000–2015) and mature forests (2016–2079). Similarly, Davidson et al. [34] found that soil respiration was significantly inhibited after heavy rainfall in the eastern Amazon Basin of Brazil, further supporting the positive effect of appropriate precipitation on SOC accumulation in forest ecosystems.
It has been well established that soil microbial activity is temperature-sensitive [35], as temperature affects the decomposition rate of soil organic carbon. Microbial communities and structures are also greatly influenced by rainfall and temperature, and are correlated with microbial activity and metabolism to some extent [36,37,38]. In the subtropical forest system of Zhejiang Province, winter temperatures were found to reduce the carbon decomposition of soil and soil microorganisms, while precipitation had a positive effect on the process of carbon accumulation [33,39]. However, the detailed response mechanism to precipitation and temperature by the soil microbial community requires further investigation.
In general, soil carbon accumulation and decomposition should be holistically analyzed, considering the combined effects of climate factors, such as temperature and precipitation, on soil microbial activity. Climate factors should not be analyzed in isolation as single indices for the 0–30 cm soil layer. It is evident that precipitation has a positive effect on SOC accumulation, particularly when low temperatures during winter and spring inhibit carbon decomposition activities. Previous research has also shown that the pulse effect of soil precipitation on soil microbial respiration in secondary forests is stronger and faster compared to natural forest soils [40]. Therefore, future studies on the response mechanism of forest ecosystems to climate change in Zhejiang Province should consider detailed factors such as forest type, tree species, altitude, and other indicators. The response of the carbon pool to climate change in subtropical forest systems should be studied with high precision and on a large scale.

5. Conclusions

We conducted an empirical study of changes in SOC and SAN content in subtropical forest ecosystems from 2010 to 2020, and analyzed the driving factors of climate change using random forest analysis with meteorological data. Our findings provide additional insights into the large-scale dynamics of soil carbon and nitrogen storage under climate change.
We found that SOC and SAN content increased from east to west in the subtropical forests of Zhejiang Province, with the greatest accumulation occurring in the western, southwestern, and central subtropical forest areas. Our results suggest that the response of SOC to climate factors is not independent, but linked. Specifically, we found that an appropriate increase in winter and spring precipitation can promote SOC accumulation in subtropical forest ecosystems. This is because, during these seasons, when the ambient temperature is low, the increase in precipitation has a positive effect on the carbon uptake of the soil ecosystem, demonstrating the effect of precipitation and temperature on SOC accumulation on a large scale.
Our study provides valuable insights into the dynamics of soil carbon and nitrogen pools in subtropical forest ecosystems, enhancing our understanding of how these ecosystems respond to climate change. Our findings can provide important guidance for forestry departments seeking to strengthen the response of forests and forest carbon pools to climate change through effective forest management. By deepening our understanding of the interplay between forests and climate change, our findings contribute to the development of informed forest management strategies that promote sustainable forest management and carbon sequestration, which are crucial for achieving global climate change mitigation goals.

Author Contributions

X.C. and T.Z. designed the study. X.C. and T.Z. finished the experiment. X.C., X.S. and S.L. have collected literature and data. L.X., Y.S., B.X., J.Y. and Y.Z. revised the manuscript. The paper was written by X.C. All authors have read and agreed to the published version of the manuscript.

Funding

This research was funded by the Key Research and Development Program of Zhejiang Province (Grant number: 2023C02003); the National Natural Science Foundation of China (Grant number: 32001315; U1809208; 31870618); the Key Research and Development Program of Zhejiang Province (Grant number: 2021C02005); the Scientific Research Development Fund of Zhejiang A&F University (Grant number: 2020FR008); the Key Research and Development Program of Zhejiang Province (Grant number: 2022C03039).

Informed Consent Statement

Not applicable.

Data Availability Statement

We can’t release the data for legal reasons.

Acknowledgments

The authors would like to thank Yongjun Shi and Lin Xu for guidance and help on topic selection and manuscript writing.

Conflicts of Interest

The authors declare that they have no competing interest.

References

  1. IPCC. Annex I: Glossary. In Global Warming of 1.5 °C; Masson-Delmotte, V., Zhai, P.M., Pörtner, H.O., Roberts, D., Skea, J., Shukla, P.R., Pirani, A., Moufou-ma-Okia, W., Péan, C., Pidcock, R., et al., Eds.; An IPCC Special Report on the Impacts of Global Warming of 1.5 °C Above Pre-Industrial Levels and Related Global Greenhouse Gas Emission Pathways, in the Context of Strengthening the Global Response to Thethreat of Climate Change, Sustainable Development, and Efforts to Era-Dicate Poverty; World Meteorological Organization: Geneva, Switzerland, 2018; pp. 541–562. [Google Scholar]
  2. Yang, Y.; Shi, Y.; Sun, W.; Chang, J.; Zhu, J.; Chen, L.; Wang, X.; Guo, Y.; Zhang, H.; Yu, L.; et al. Terrestrial carbon sinks in China and around the world and their contribution to carbon neutrality. Sci. China Life Sci. 2022, 65, 861–895. [Google Scholar] [CrossRef]
  3. Batjes, N.H. Total carbon and nitrogen in the soils of the world. Eur. J. Soil Sci. 2014, 65, 10–21. [Google Scholar] [CrossRef]
  4. Morisada, K.; Ono, K.; Kanomata, H. Organic carbon stock in forest soils in Japan. Geoderma 2004, 119, 21–32. [Google Scholar] [CrossRef]
  5. Yang, Y.; Mohammat, A.; Feng, J.; Zhou, R.; Fang, J. Storage, patterns and environmental controls of soil organic carbon in China. Biogeochemistry 2007, 84, 131–141. [Google Scholar] [CrossRef]
  6. Martin, M.P.; Wattenbach, M.; Smith, P.; Meersmans, J.; Jolivet, C.; Boulonne, L.; Arrouays, D. Spatial distribution of soil organic carbon stocks in France. Biogeosciences 2011, 8, 1053–1065. [Google Scholar] [CrossRef] [Green Version]
  7. Viscarra Rossel, R.A.; Webster, R.; Bui, E.N.; Baldock, J.A. Baseline map of organic carbon in Australian soil to support national carbon accounting and monitoring under climate change. Glob. Change Biol. 2014, 20, 2953–2970. [Google Scholar] [CrossRef] [PubMed] [Green Version]
  8. Rodríguez Martín, J.A.; Álvaro-Fuentes, J.; Gonzalo, J.; Gil, C.; Ramos-Miras, J.J.; Grau Corbí, J.M.; Boluda, R. Assessment of the soil organic carbon stock in Spain. Geoderma 2016, 264, 117–125. [Google Scholar] [CrossRef] [Green Version]
  9. Scharlemann, J.P.W.; Tanner, E.V.J.; Hiederer, R.; Kapos, V. Global soil carbon: Understanding and managing the largest terrestrial carbon pool. Carbon Manag. 2014, 5, 81–91. [Google Scholar] [CrossRef]
  10. Feng, J.; He, K.; Zhang, Q.; Han, M.; Zhu, B. Changes in plant inputs alter soil carbon and microbial communities in forest ecosystems. Glob. Change Biol. 2022, 28, 3426–3440. [Google Scholar] [CrossRef]
  11. Bardgett, R.D.; Freeman, C.; Ostle, N.J. Microbial contributions to climate change through carbon cycle feedbacks. ISME J. 2008, 2, 805–814. [Google Scholar] [CrossRef] [PubMed] [Green Version]
  12. Waldrop, M.P.; Firestone, M.K. Response of microbial community composition and function to soil climate change. Microb. Ecol. 2006, 52, 716–724. [Google Scholar] [CrossRef]
  13. Wang, H.; Li, J.; Chen, H.; Liu, H.; Nie, M. Enzymic moderations of bacterial and fungal communities on short- and long-term warming impacts on soil organic carbon. Sci. Total Environ. 2022, 804, 150197. [Google Scholar] [CrossRef] [PubMed]
  14. Rui, J.; Li, J.; Wang, S.; An, J.; Liu, W.T.; Lin, Q.; Yang, Y.; He, Z.; Li, X. Responses of bacterial communities to simulated climate changes in alpine meadow soil of the Qinghai-Tibet plateau. Appl. Environ. Microbiol. 2015, 81, 6070–6077. [Google Scholar] [CrossRef] [Green Version]
  15. Li, C.; Aluko, O.O.; Yuan, G.; Li, J.; Liu, H. The responses of soil organic carbon and total nitrogen to chemical nitrogen fertilizers reduction base on a meta-analysis. Sci. Rep. 2022, 12, 1150–1156. [Google Scholar] [CrossRef] [PubMed]
  16. He, M.; Mo, X.; Meng, W.; Li, H.; Xu, W.; Huang, Z. Optimization of nitrogen, water and salinity for maximizing soil organic carbon in coastal wetlands. Glob. Ecol. Conserv. 2022, 36, e02146. [Google Scholar] [CrossRef]
  17. Yu, G.; Chen, Z.; Piao, S.; Peng, C.; Ciais, P.; Wang, Q.; Lia, X.; Zhu, X. High carbon dioxide uptake by subtropical forest ecosystems in the East Asian monsoon region. Proc. Natl. Acad. Sci. USA 2014, 111, 4910–4915. [Google Scholar] [CrossRef] [Green Version]
  18. Dong, J.; Zhou, K.; Jiang, P.; Wu, J.; Fu, W. Revealing horizontal and vertical variation of soil organic carbon, soil total nitrogen and C:N ratio in subtropical forests of southeastern China. J. Environ. Manag. 2021, 289, 112483. [Google Scholar] [CrossRef]
  19. Dai, W.; Fu, W.; Jiang, P.; Zhao, K.; Li, Y.; Tao, J. Spatial pattern of carbon stocks in forest ecosystems of a typical subtropical region of southeastern China. For. Ecol. Manag. 2018, 409, 288–297. [Google Scholar] [CrossRef]
  20. Fang, H.; Ji, B.; Deng, X.; Ying, J.; Zhou, G.; Shi, Y.; Xu, L.; Tao, J.; Zhou, Y.; Li, C.; et al. Effects of topographic factors and aboveground vegetation carbon stocks on soil organic carbon in Moso bamboo forests. Plant Soil 2018, 433, 363–376. [Google Scholar] [CrossRef]
  21. Wang, T.; Wang, G.; Innes, J.L.; Seely, B.; Chen, B. ClimateAP: An application for dynamic local downscaling of historical and future climate data in Asia Pacific. Front. Agric. Sci. Eng. 2017, 4, 448–458. [Google Scholar] [CrossRef] [Green Version]
  22. Zhang, Z.; Huang, X.; Zhou, Y.; Zhang, J.; Zhang, X. Discrepancies in karst soil organic carbon in southwest china for different land use patterns: A case study of Guizhou Province. Int. J. Environ. Res. Public Health 2019, 16, 4199. [Google Scholar] [CrossRef] [Green Version]
  23. Nóbrega, G.N.; Ferreira, T.O.; Artur, A.G.; de Mendonça, E.S.; Raimundo, R.A.; Teixeira, A.S.; Otero, X.L. Evaluation of methods for quantifying organic carbon in mangrove soils from semi-arid region. J. Soils Sediments 2015, 15, 282–291. [Google Scholar] [CrossRef]
  24. Agricultural Chemistry Committee of China. Determination of soil organic matter. In Soil and Agricultural Chemistry Analysis; Agricultural Chemistry Committee of China: Beijing, China, 2000; pp. 30–34. [Google Scholar]
  25. Mirzaee, S.; Ghorbani-Dashtaki, S.; Mohammadi, J.; Asadi, H.; Asadzadeh, F. Spatial variability of soil organic matter using remote sensing data. Catena 2016, 145, 118–127. [Google Scholar] [CrossRef]
  26. Krivoruchko, K.; Gribov, A. Evaluation of empirical Bayesian kriging. Spat. Stat. 2019, 32, 100368. [Google Scholar] [CrossRef]
  27. Sivanandam, P.; Lucieer, A. Tree Detection and Species Classification in a Mixed Species Forest Using Unoccupied Aircraft System (UAS) RGB and Multispectral Imagery. Remote Sens. 2022, 14, 4963. [Google Scholar] [CrossRef]
  28. Wang, T.; Kang, F.; Cheng, X.; Han, H.; Bai, Y.; Ma, J. Spatial variability of organic carbon and total nitrogen in the soils of a subalpine forested catchment at Mt. Taiyue, China. Catena 2017, 155, 41–52. [Google Scholar] [CrossRef]
  29. Podwojewski, P.; Poulenard, J.; Zambrana, T.; Hofstede, R. Overgrazing Effects on Vegetation Cover and Properties of Volcanic Ash Soil in the Páramo of Llangahua and La Esperanza (Tungurahua, Ecuador). Soil Use Manag. 2002, 18, 45–55. [Google Scholar] [CrossRef]
  30. Ao, L.; Zhao, M.; Li, X.; Sun, G. Different Urban Forest Tree Species Affect the Assembly of the Soil Bacterial and Fungal Community. Microb. Ecol. 2022, 83, 447–458. [Google Scholar] [CrossRef]
  31. Sui, X.; Li, M.; Frey, B.; Wang, M.; Weng, X.; Wang, X.; Chen, F.; Li, X.; Du, Z.; Yang, L.; et al. Climax forest has a higher soil bacterial diversity but lower soil nutrient contents than degraded forests in temperate northern China. Ecol. Evol. 2022, 12, e9535. [Google Scholar] [CrossRef]
  32. Chen, X.; Zhang, D.; Liang, G.; Qiu, Q.; Liu, J.; Zhou, G.; Liu, S.; Chu, G.; Yan, J. Effects of precipitation on soil organic carbon fractions in three subtropical forests in southern China. J. Plant Ecol. 2015, 9, 10–19. [Google Scholar] [CrossRef] [Green Version]
  33. Mao, F.; Du, H.; Zhou, G.; Zheng, J.; Li, X.; Xu, Y.; Huang, Z.; Yin, S. Simulated net ecosystem productivity of subtropical forests and its response to climate change in Zhejiang Province, China. Sci. Total Environ. 2022, 838, 155993. [Google Scholar] [CrossRef]
  34. Davidson, E.A.; Verchot, L.V.; Henrique Cattânio, J.; Ackerman, I.L.; Carvalho, J.E.M. Effects of soil water content on soil respiration in forests and cattle pastures of eastern Amazonia. Biogeochemistry 2000, 48, 53–69. [Google Scholar] [CrossRef]
  35. Walker, T.W.N.; Kaiser, C.; Strasser, F.; Herbold, C.W.; Leblans, N.I.W.; Woebken, D.; Janssens, I.A.; Sigurdsson, B.D.; Richter, A. Microbial temperature sensitivity and biomass change explain soil carbon loss with warming. Nat. Clim. Change 2018, 8, 885–889. [Google Scholar] [CrossRef]
  36. Cao, H.; Chen, R.; Wang, L.; Jiang, L.; Yang, F.; Zheng, S.; Wang, G.; Lin, X. Soil pH, total phosphorus, climate and distance are the major factors influencing microbial activity at a regional spatial scale. Sci. Rep. 2016, 6, 25815. [Google Scholar] [CrossRef] [Green Version]
  37. Klimek, B. Scots pine roots modify the short-term effects of temperature and moisture on soil bacteria and fungi. Appl. Ecol. Environ. Res. 2013, 11, 173–188. [Google Scholar] [CrossRef]
  38. Perreault, L.; Forrester, J.A.; Wurzburger, N.; Mladenoff, D.J. Emergent properties of downed woody debris in canopy gaps: A response of the soil ecosystem to manipulation of forest structure. Soil Biol. Biochem. 2020, 151, 108053. [Google Scholar] [CrossRef]
  39. Kravchenko Irina, K.; Tikhonova Ekaterina, N.; Ulanova Ruzalia, V.; Menko Ekaterina, V.; Sukhacheva Marina, V. Effect of temperature on litter decomposition, soil microbial community structure and biomass in a mixed-wood forest in European Russia. Curr. Sci. 2019, 116, 765–772. [Google Scholar] [CrossRef]
  40. Wang, Q.; He, N.; Liu, Y.; Li, M.; Xu, L. Strong pulse effects of precipitation events on soil microbial respiration in temperate forests. Geoderma 2016, 275, 67–73. [Google Scholar] [CrossRef]
Figure 1. Study sites and the distribution of sample plots.
Forests 14 00914 g001
Figure 2. Spatial distribution of (a) SOC and (b) SAN in a subtropical forest ecosystem in Zhejiang Province.
Forests 14 00914 g002
Figure 3. Spatial distribution of (a) SOC difference value and (b) SAN difference value in a subtropical forest ecosystem in Zhejiang Province.
Forests 14 00914 g003
Figure 4. The correlation between (a) SOC and (b) SAN differences and climate indicators in subtropical forests. SOC D-Value is SOC difference value, SAN D-Value is SAN difference value; Statistical significance levels denoted as ★ = p < 0.05, ★★ = p < 0.01 and ★★★ = p < 0.001.
Forests 14 00914 g004
Figure 5. Relationship between (a) SOC difference value (0–60 cm) and altitude, and the (b) SOC differences in different altitude group. Different lowercase letters indicate significant differences.
Forests 14 00914 g005
Figure 6. Relationship between SOC (0–10 cm) difference value and (a) PPT-DJF, (b) PPTave, and (c) PPT-MAM. Relationship between SOC (10–30 cm) difference value and (d) PPT-DJF, (e) PPTave, and (f) PPT-MAM.
Forests 14 00914 g006
Table 1. The name of the climate factors.
Full NameAbbreviation
mean annual temperature (°C),MAT
mean warmest month temperature (°C)MWMT
mean coldest month temperature (°C)MCMT
temperature difference between MWMT and MCMT, or continentality (°C),TD
mean annual precipitation (mm),PPT
annual heat: moisture index (MAT + 10)/(PPT/1000)AHM
extreme minimum temperature over 30 yearsEMT
Hargreaves reference evaporationEref
Hargreaves climatic moisture deficitCMD
mean temperature (°C)Tave
mean maximum temperature (°C)Tmax
mean minimum temperature (°C)Tmin
December (from the previous year for an individual year), January, and FebruaryDJF
March, April, and MayMAM
June, July, and AugustJJA
September, October, and NovemberSON
Average valueave
Table 2. Content of soil organic carbon (SOC) and alkali-hydrolyzed nitrogen (SAN) in forest ecosystems in Zhejiang Province, 2020.
Depth (cm)NumberMeanMedianMaximumMinimumSDCV
(%)
SOC
content
0–1024435.9430.40132.991.7622.5862.82
10–3024420.9717.4492.670.6715.2572.74
30–6024413.7110.9570.110.3711.1581.28
SAN
content
0–10244145.42118.86606.2317.3991.3262.79
10–30244101.6182.17554.2013.9475.1673.97
30–6024474.9162.80328.7110.4649.1265.57
Note: The unit of SOC content is g/kg; the unit of SAN content is mg/kg; SD = standard deviation; CV = coefficient variance.
Table 3. The difference contents between SOC and SAN of forest ecosystems in Zhejiang Province from 2010 to 2020.
Depth (cm)NumberMeanMedianMaximumMinimumSD
SOC
difference
0–1016510.006.83117.53−29.1723.71
10–301656.614.7065.75−52.6716.13
30–601654.983.1157.93−48.1212.84
SAN
difference
0–10244−58.43−55.37405.03−416.94107.25
10–30244−29.16−29.62501.84−357.1999.32
30–60244−1.41−2.67270.33−324.4961.98
Note: The unit of SOC difference is g/kg; the unit of SAN difference is mg/kg; SD = standard deviation.
Table 4. The importance of climate indices of random forest analysis for SOC and SAN in forest ecosystems in Zhejiang province.
Depth (cm)★★★★★★★★★★★★★★★★★★★★★★★★★★★
SOC
difference
0–60PPT-DJFTmin-JJAPPT-SONAHMavePPT-MAMTmin-MAMPPTave
SAN
difference
0–60ErefavPPT-SONTDaveTmin-JJAPPTaveTmax-MAMPPT-DJF
Note: The SOC difference and SAN difference are between 2010 and 2022; The number of represents the ranking of importance of climate indicators calculated by random forest to soil carbon and nitrogen pools (the top 25% of 28 climate indicators were selected).
Disclaimer/Publisher’s Note: The statements, opinions and data contained in all publications are solely those of the individual author(s) and contributor(s) and not of MDPI and/or the editor(s). MDPI and/or the editor(s) disclaim responsibility for any injury to people or property resulting from any ideas, methods, instructions or products referred to in the content.

