
Improving Wildfire Danger Assessment Using Time Series Features of Weather and Fuel in the Great Xing’an Mountain Region, China


Abstract
:1. Introduction
2. Materials and Methods
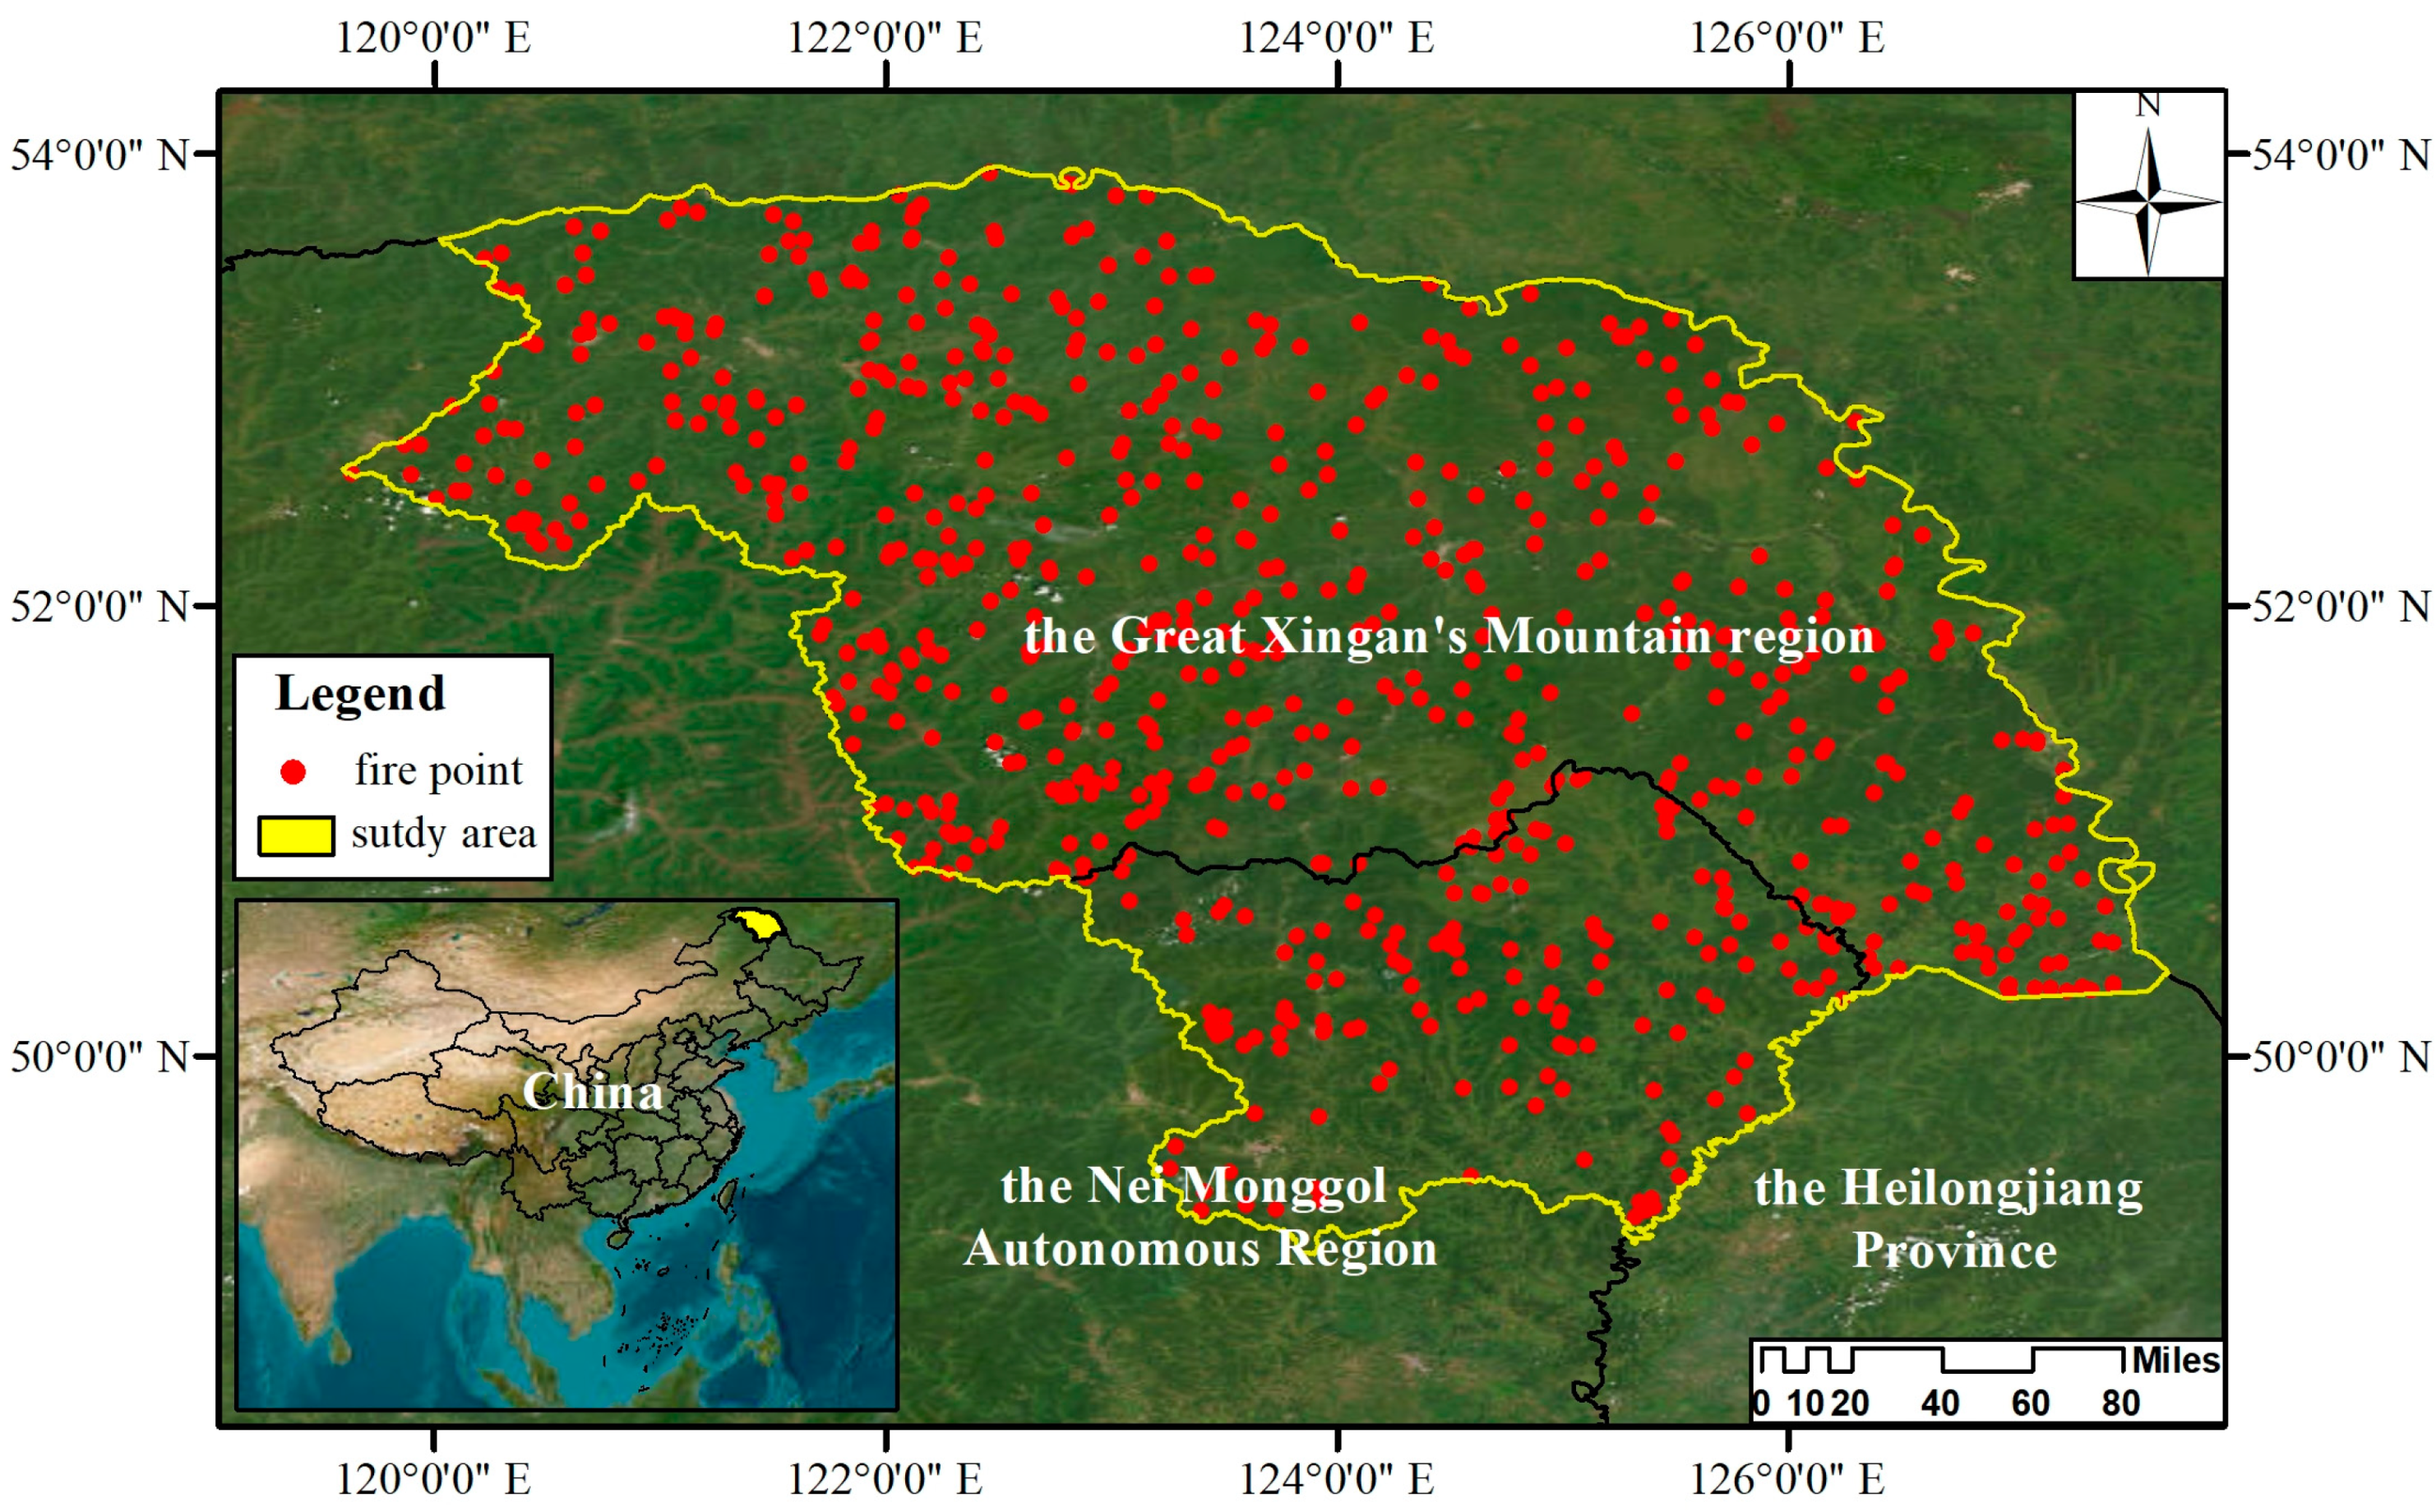
2.1. Study Area
2.2. Data Preparation
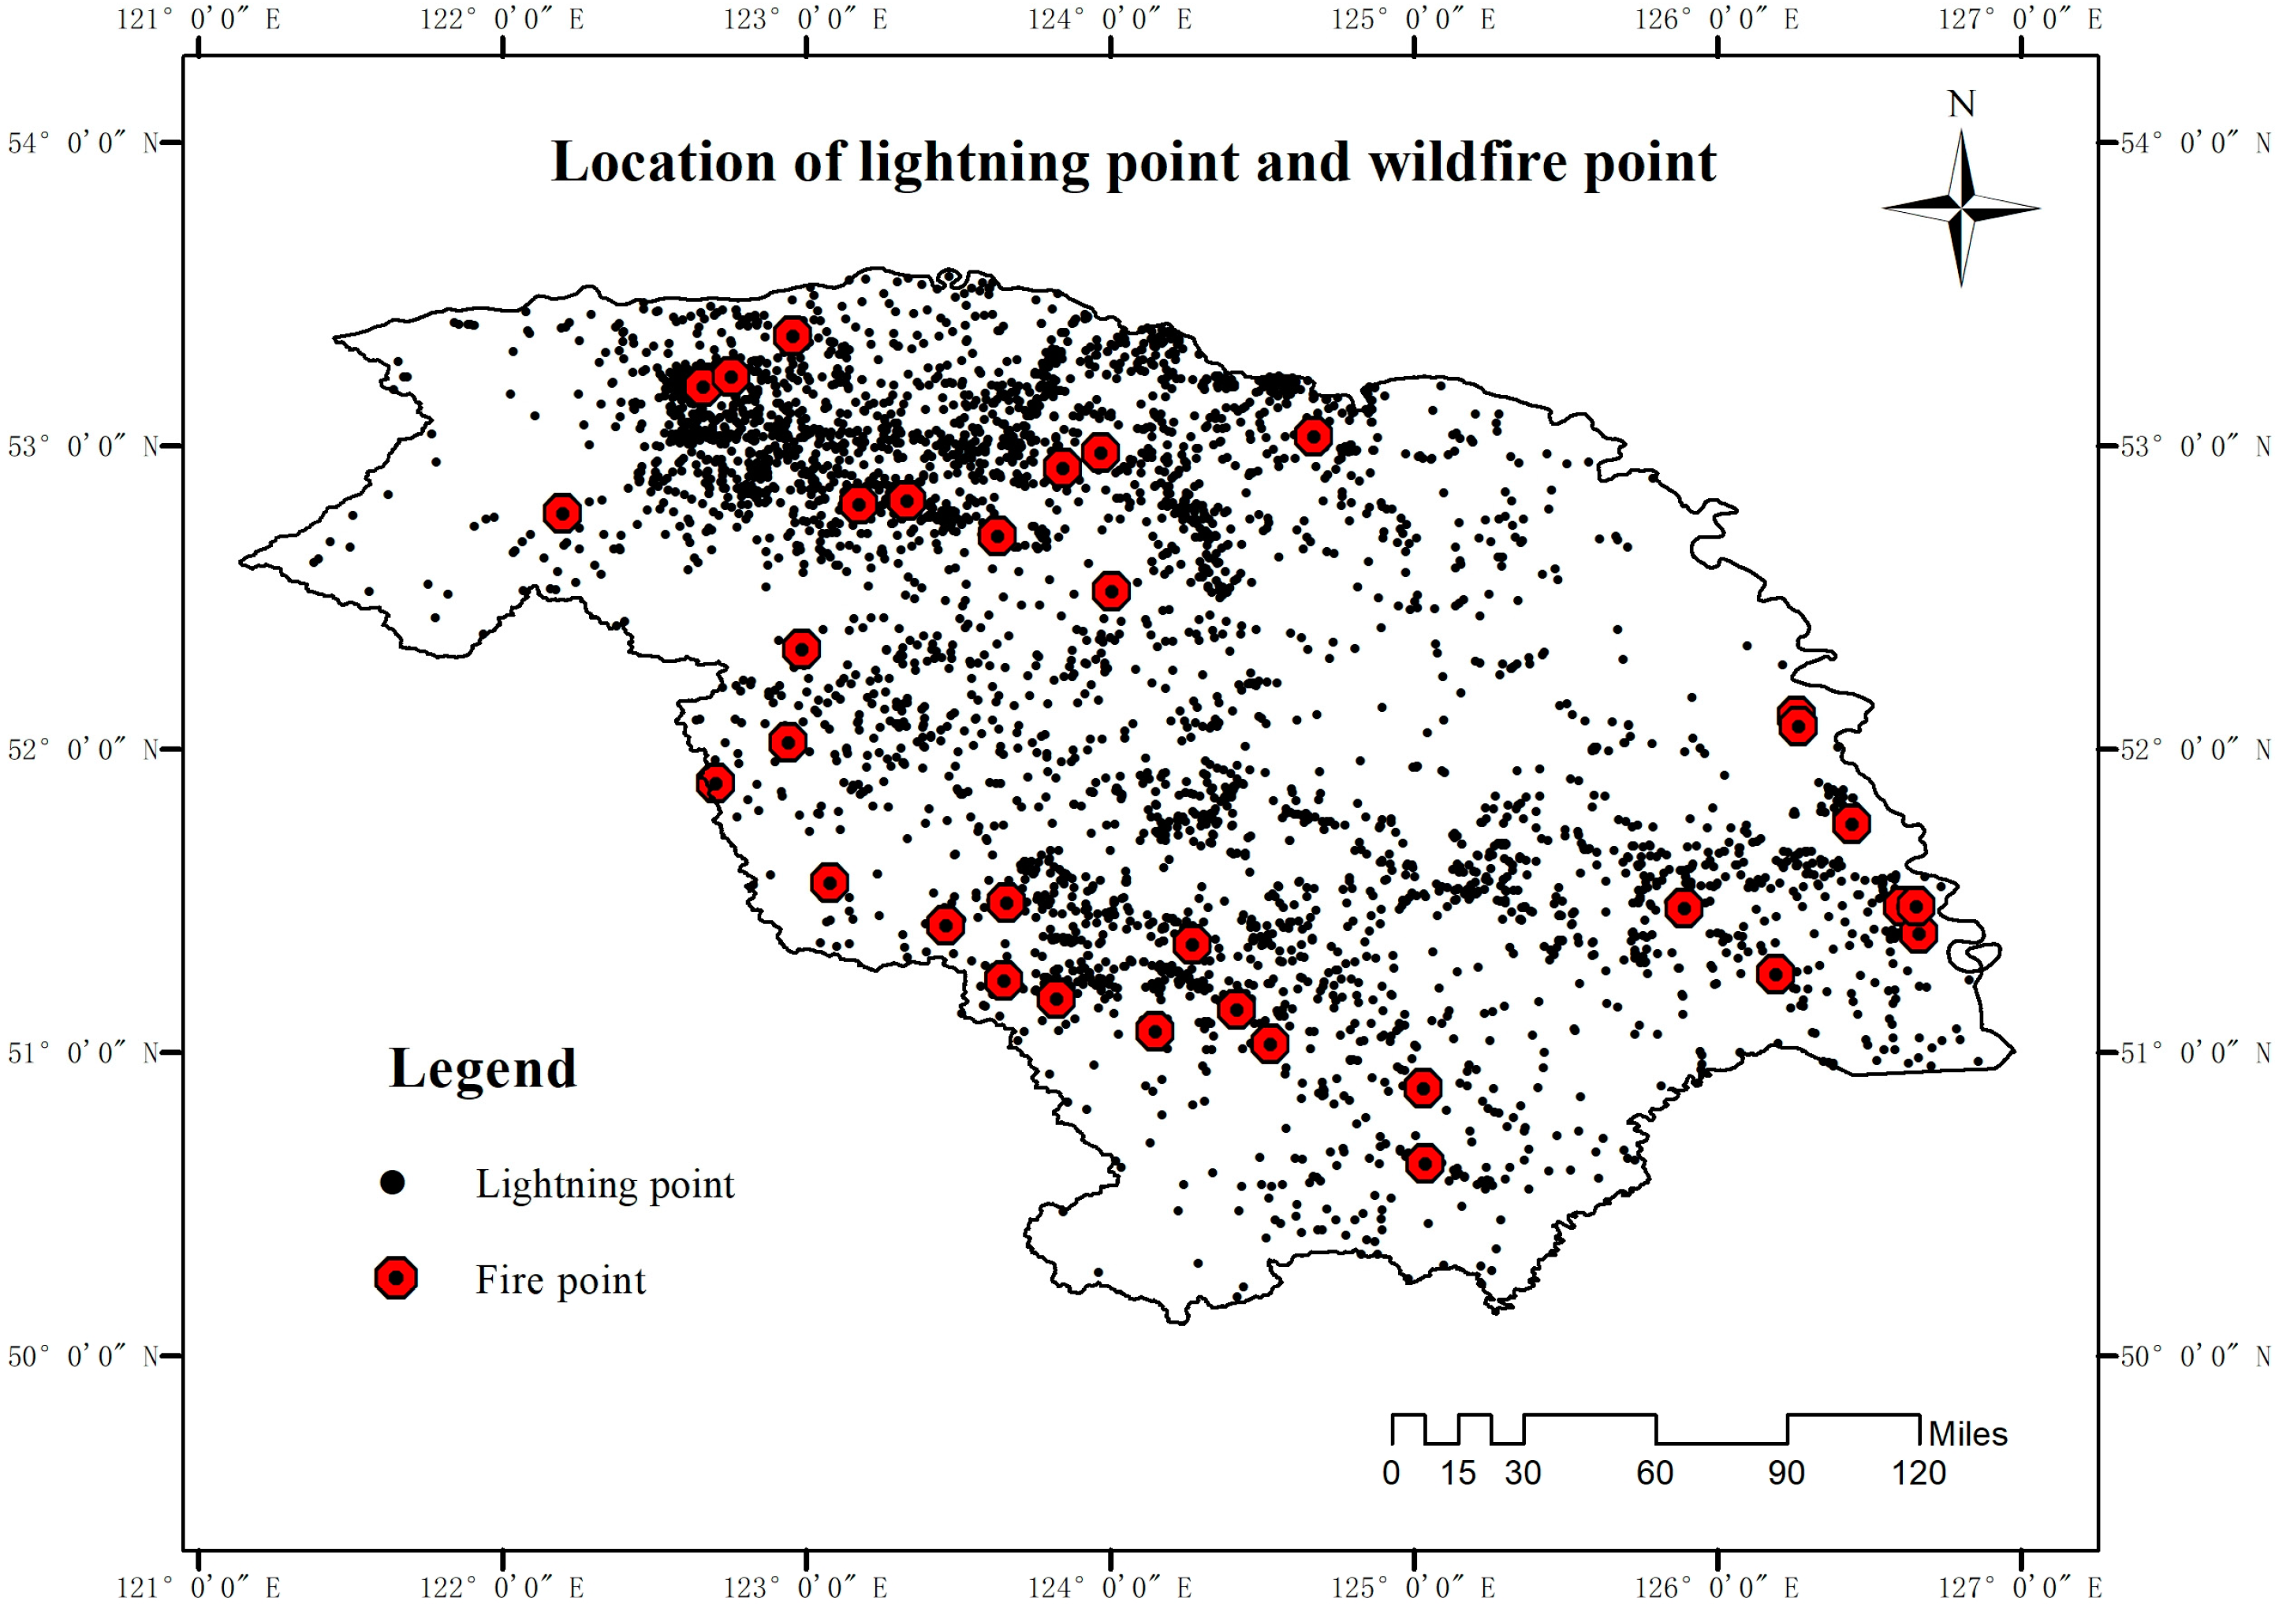
2.2.1. Dependent Variables
- (1)
- First, a circular buffer zone was established with the fire location as the center and the burning area as the buffer area.
- (2)
- Then, the same buffer zone was established on each day between the 16th day before the fire occurrence and the 16th day after the fire extinction.
- (3)
- Third, non-fire points were chosen at random from the forest area outside the buffer zone, with a non-fire to fire ratio of 10:1. The forest area was extracted from the MODIS land cover product MCD12Q1 and classified into forest area according to categories 1–8 of the IGBP classification scheme.
2.2.2. Explanatory Variables
Topographic Variables

| Variable Type | Variable Name | Variable Code | Source | Resolution |
|---|---|---|---|---|
| Topography | Elevation (m) | Elevation | GMTED2010 [55] | 0.001°, _ |
| Slope (0–90°) | Slope | |||
| Aspect | Aspect | |||
| Topographic roughness index | TRI | |||
| Weather | Daily maximum temperature (°C) | Tem_max | ERA5-Land [23] | 0.1°, 1 day |
| Daily average relative humidity (0%–100%) | RH_avg | |||
| Daily precipitation (cm) | Pre | |||
| Daily average wind speed (m/s) | Win_avg | |||
| Fuel | Fine fuel moisture code | FFMC | Fire Danger Indices Historical Data [7,24] | 0.25°, 1 day |
| Duff moisture code | DMC | |||
| Drought code | DC | |||
| Initial buildup index | ISI | |||
| Fire weather index | FWI | |||
| Dominant tree species | TS | the third Forestry Survey of China | 0.001°, _ | |
| Leaf area index | LAI | MODIS MOD15A2H | 500 m, 8 days |
| Aspect | Azimuth (°) |
|---|---|
| North | 337.5°~360°, 0°~22.5° |
| Northeast | 22.5°~67.5° |
| East | 67.5°~112.5° |
| Southeast | 112.5°~157.5° |
| South | 157.5°~202.5° |
| Southwest | 202.5°~247.5° |
| West | 247.5°~292.5° |
| Northwest | 292.5°~337.5° |
Weather Variables
Fuel Variables
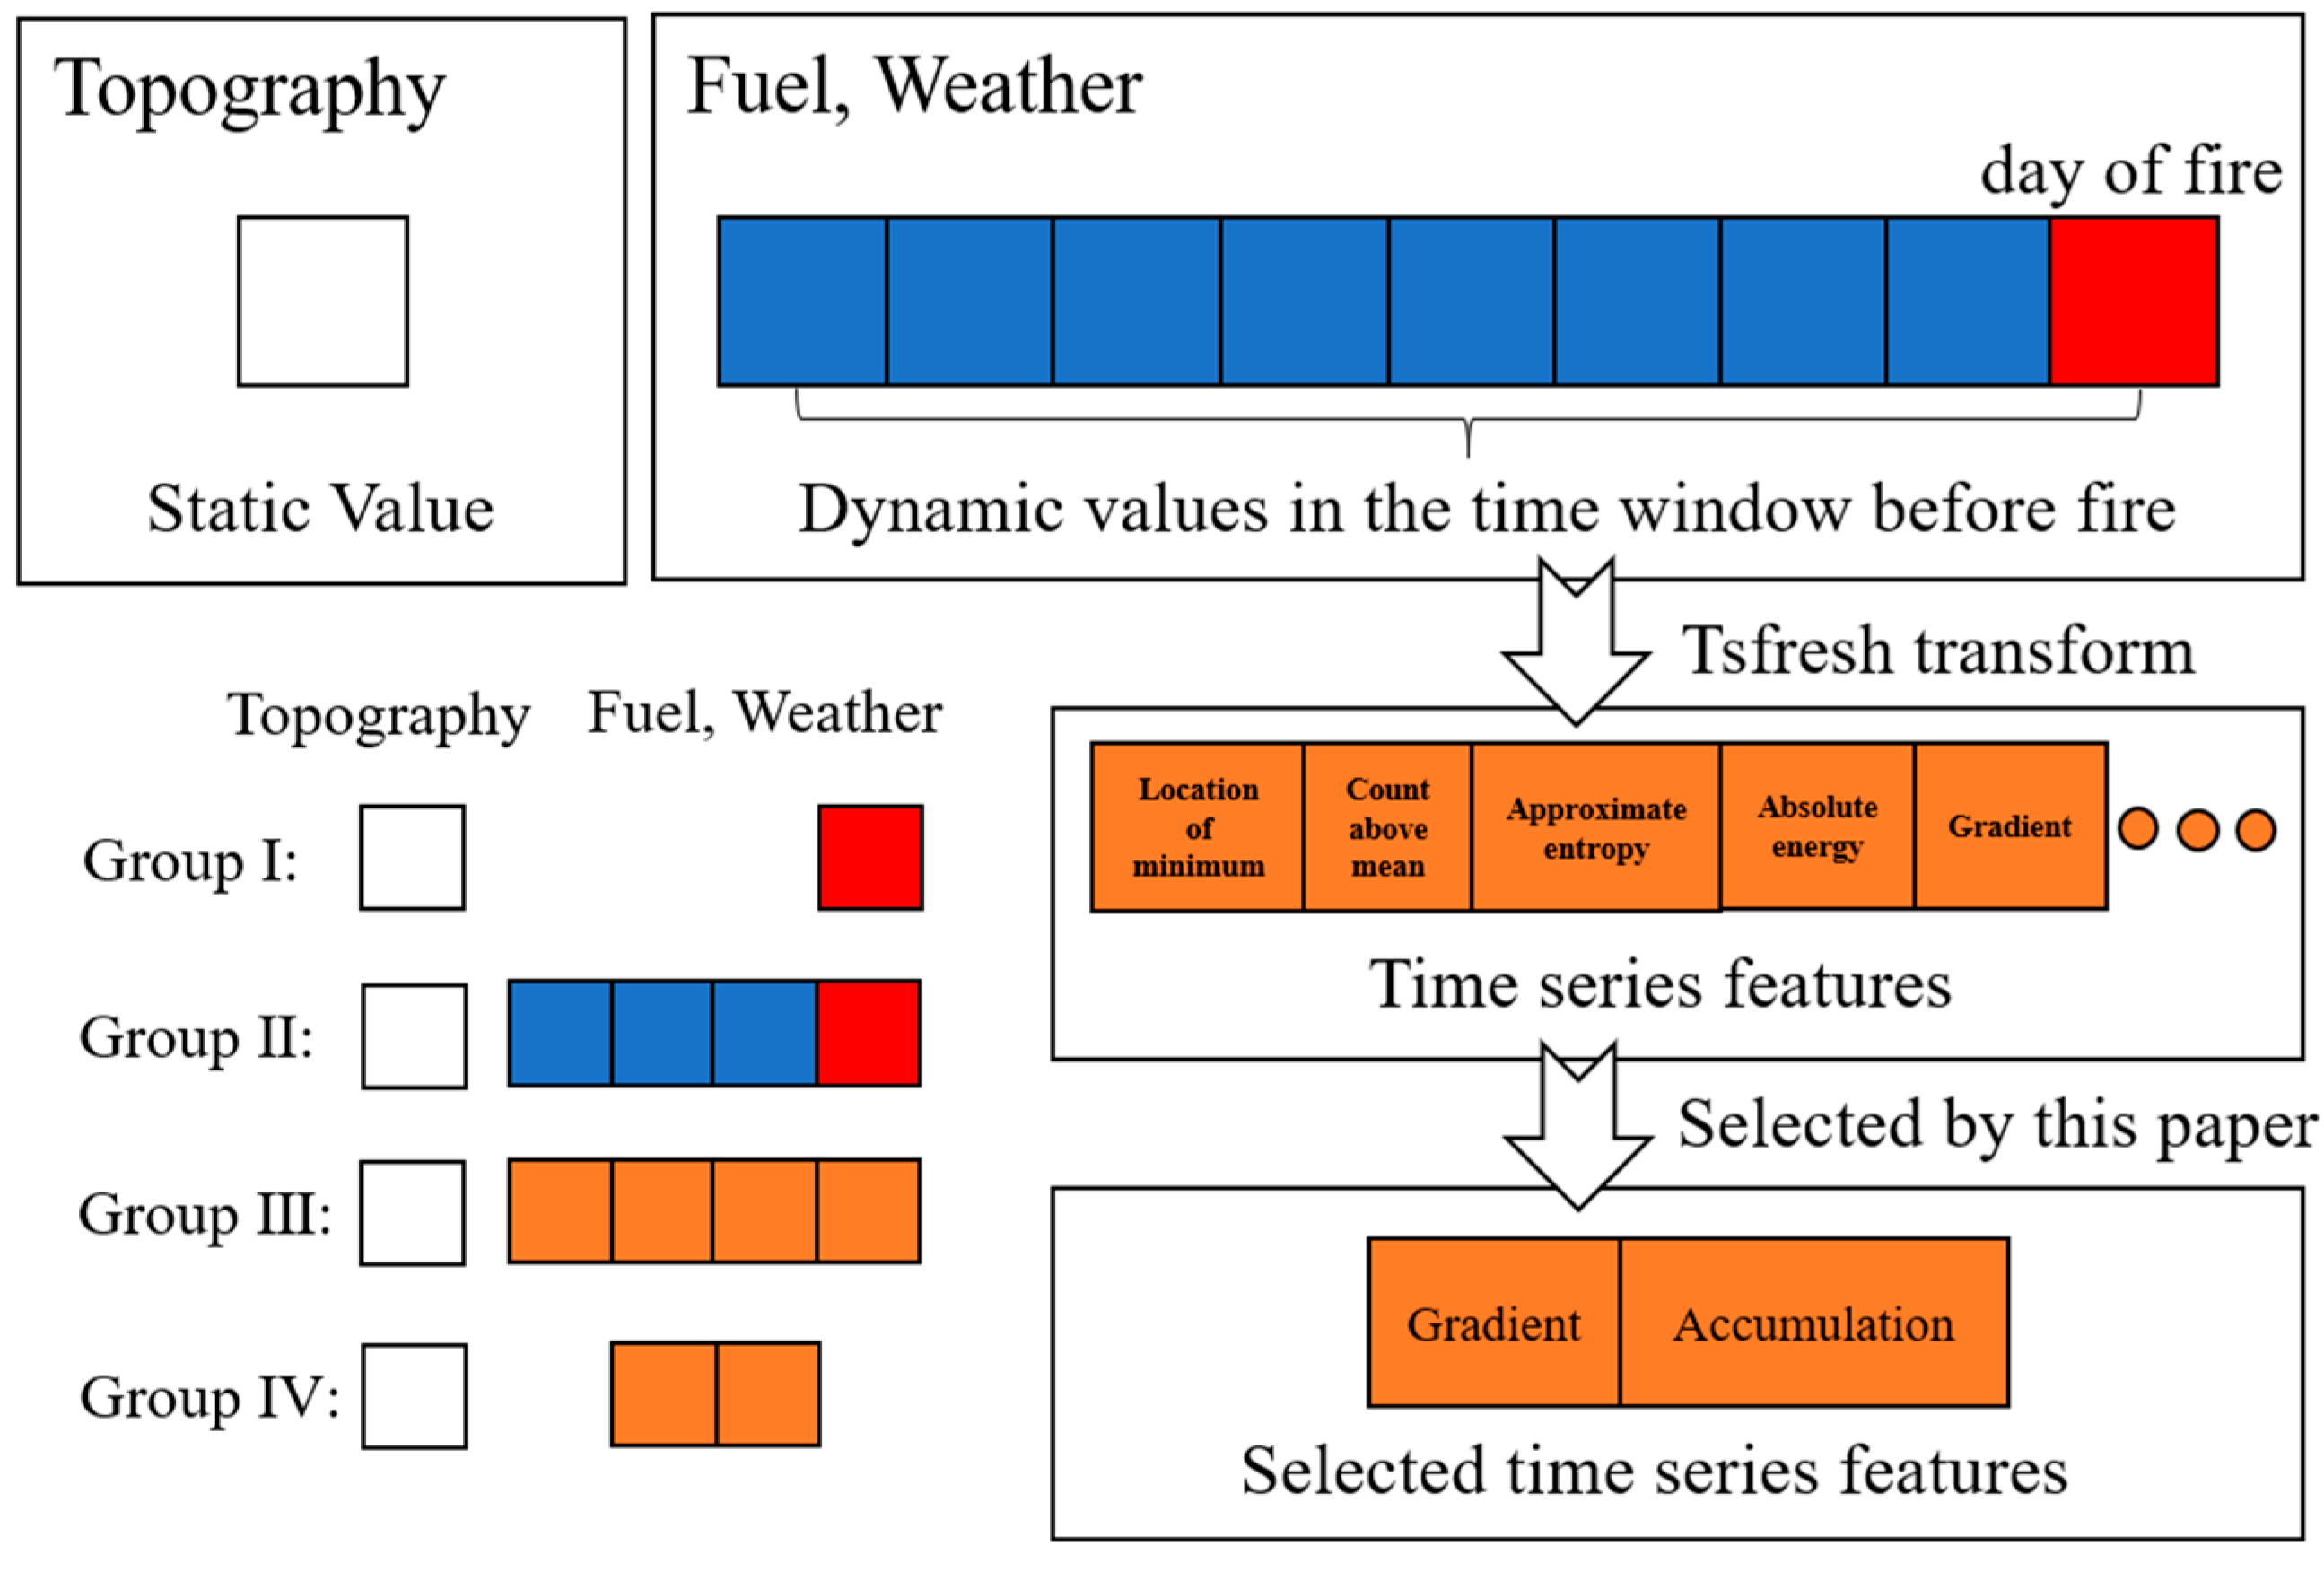
2.3. Feature Groups
2.3.1. Time Series Features of Weather and Fuel
2.3.2. Four Feature Groups
2.4. Model
2.4.1. Random Forest
2.4.2. Balanced Random Forest
2.4.3. Extreme Gradient Boosting
2.4.4. Evaluation Indexes
3. Results
3.1. Evaluation Results
3.2. Wildfire Danger Map
4. Discussion
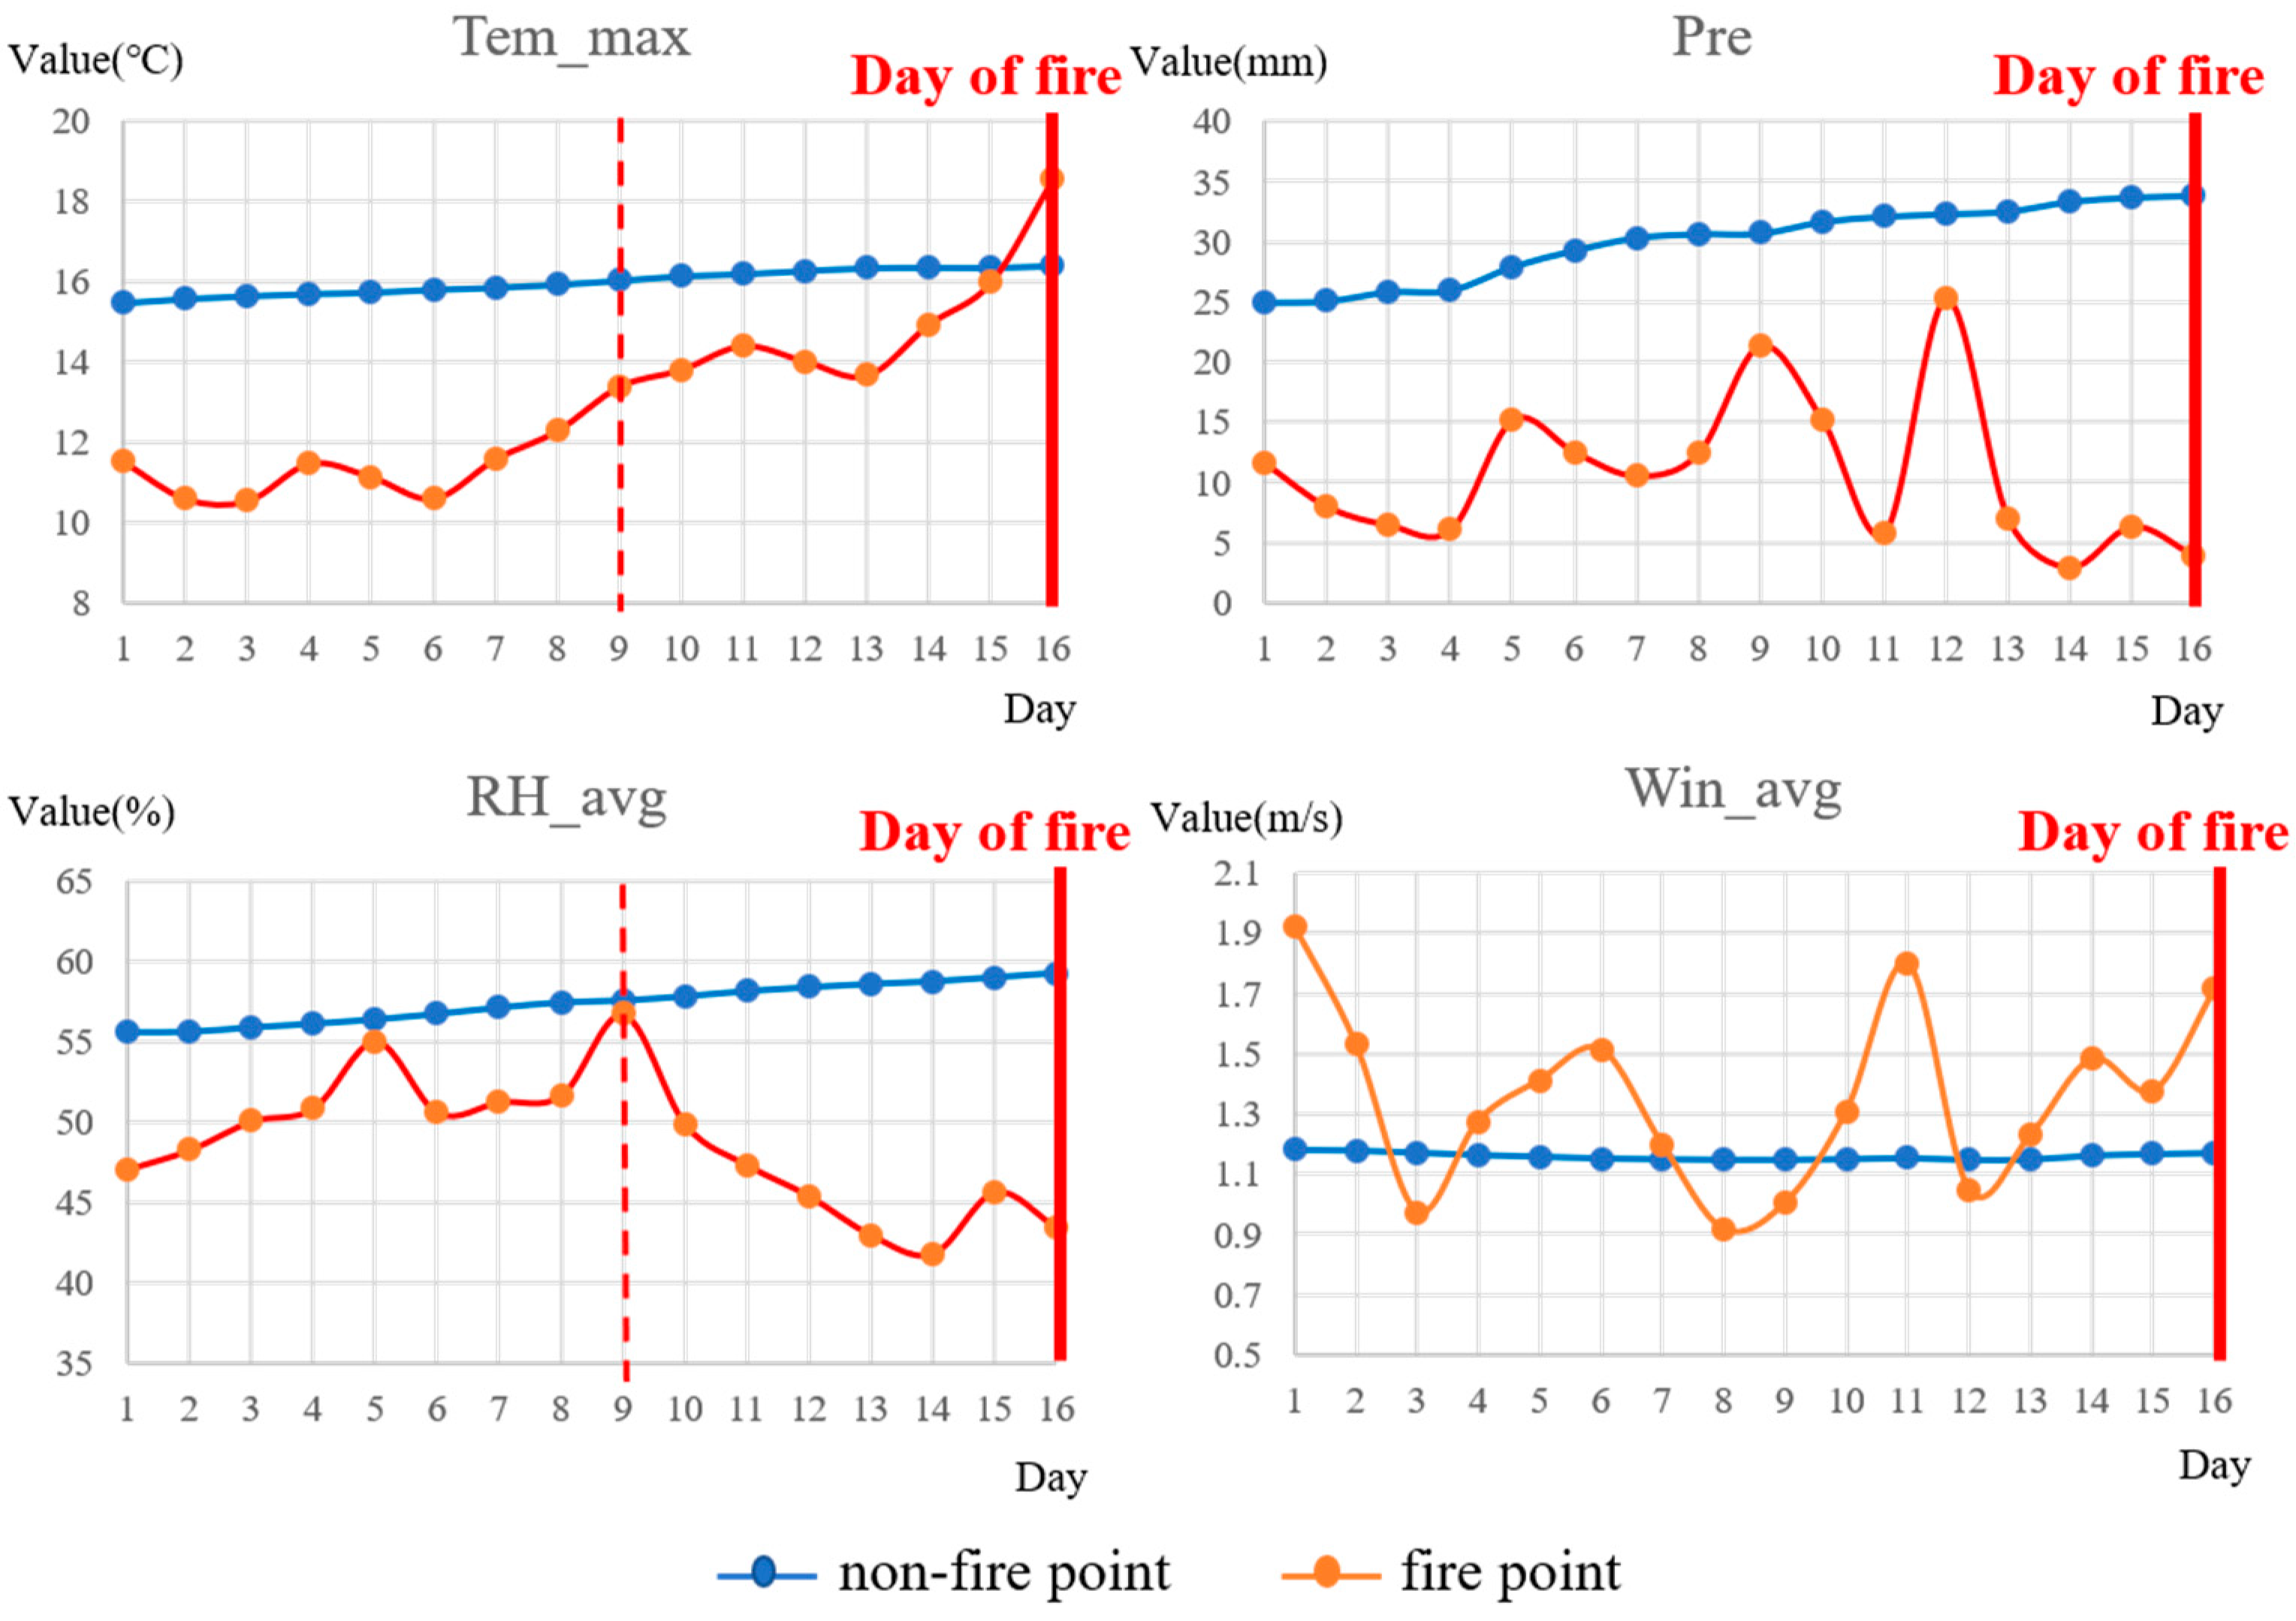
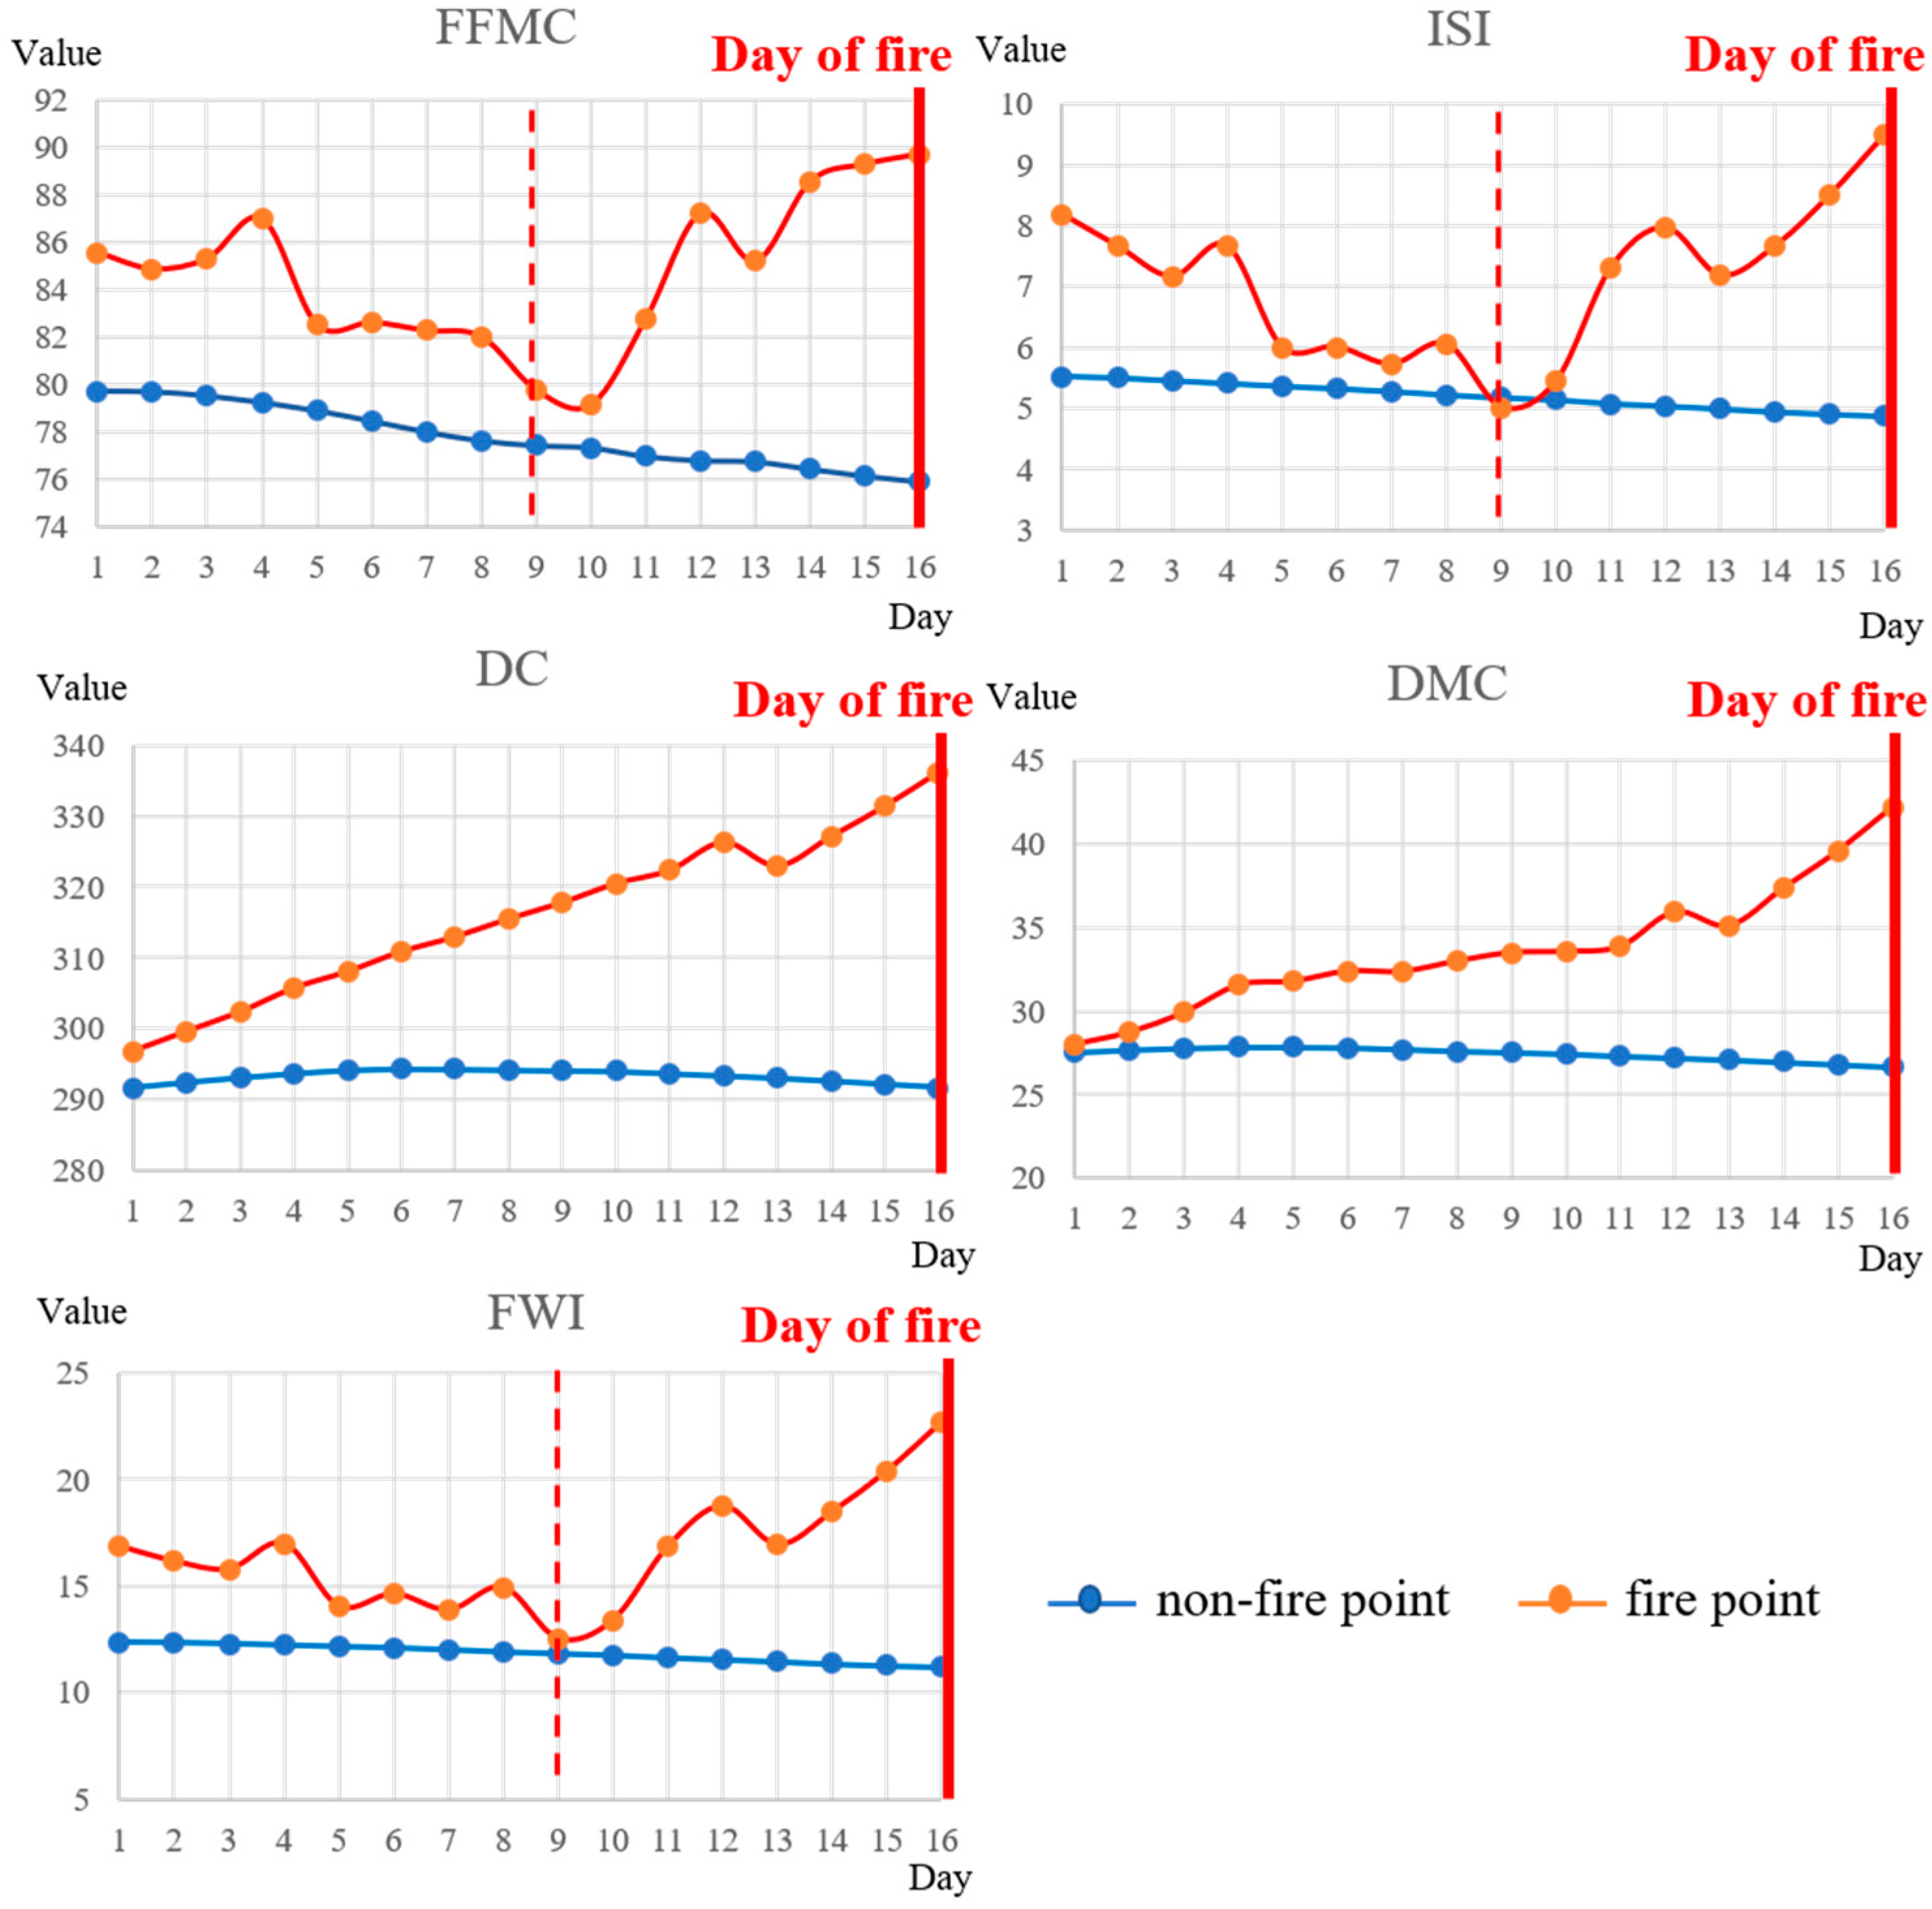
4.1. Changing Characteristics of Weather and Fuel
4.2. Using Timing Series Features to Assessing Wildfire Danger
4.3. Limitations and Future Work
5. Conclusions
Author Contributions
Funding
Data Availability Statement
Acknowledgments
Conflicts of Interest
References
- Johnston, L.M.; Wang, X.; Erni, S.; Taylor, S.W.; McFayden, C.B.; Oliver, J.A.; Stockdale, C.; Christianson, A.; Boulanger, Y.; Gauthier, S.; et al. Wildland fire risk research in Canada. Environ. Rev. 2020, 28, 164–186. [Google Scholar] [CrossRef]
- Schultz, M.G.; Heil, A.; Hoelzemann, J.J.; Spessa, A.; Thonicke, K.; Goldammer, J.G.; Held, A.C.; Pereira, J.M.C.; van het Bolscher, M. Global wildland fire emissions from 1960 to 2000. Glob. Biogeochem. Cycles 2008, 22, 198–215. [Google Scholar] [CrossRef]
- Jones, M.W.; Abatzoglou, J.T.; Veraverbeke, S.; Andela, N.; Lasslop, G.; Forkel, M.; Smith, A.J.P.; Burton, C.; Betts, R.A.; van der Werf, G.R.; et al. Global and Regional Trends and Drivers of Fire Under Climate Change. Rev. Geophys. 2022, 60, 108–129. [Google Scholar] [CrossRef]
- Tian, X.R.; Shu, L.; Zhao, F.; Wang, M.; McRae, D.J. Future impacts of climate change on forest fire danger in northeastern China. J. For. Res. 2011, 22, 437–446. [Google Scholar] [CrossRef]
- Liu, Z.; Yang, J.; Chang, Y.; Weisberg, P.J.; He, H.S. Spatial patterns and drivers of fire occurrence and its future trend under climate change in a boreal forest of Northeast China. Glob. Change Biol. 2012, 18, 2041–2056. [Google Scholar] [CrossRef]
- Costafreda-Aumedes, S.; Comas, C.; Vega-Garcia, C. Human-caused fire occurrence modelling in perspective: A review. Int. J. Wildland Fire 2017, 26, 983–998. [Google Scholar] [CrossRef]
- Wagner, C.E. Development and Structure of the Canadian Forest Fire Weather Index System; Canadian Forestry Service: Ottawa, ON, Canada, 1987.
- Cohen, J.D.; Deeming, J.E. The National Fire-Danger Rating System: Basic Equations; US Department of Agriculture, Forest Service, Pacific Southwest Forest and Range Experiment Station: Albany, CA, USA, 1985.
- McArthur, G.A. Fire Behavior Characteristics of the Longford Fire; Department of National Development, Forestry and Timber Bureau: Canberra, Australia, 1967.
- Pearce, H.; Majorhazi, K. Application of fire behaviour to fire danger and wildfire threat modelling in New Zealand. In Proceedings of the 3rd International Wildland Conference, Sydney, Australia, 3–6 October 2003. [Google Scholar]
- Chen, R.; He, B.; Quan, X.; Lai, X.; Fan, C. Improving Wildfire Probability Modeling by Integrating Dynamic-Step Weather Variables over Northwestern Sichuan, China. Int. J. Disaster Risk Sci. 2023, 14, 313–325. [Google Scholar] [CrossRef]
- Tian, X.R.; Douglas, J.; Mcrae; Zhang, Y.H. Review of forest fire risk classification forecasting systems. World For. Res. 2006, 19, 8. [Google Scholar]
- Martell, D.L. Forest fire management. In Handbook of Operations Research in Natural Resources; Springer: Boston, MA, USA, 2007; Volume 99. [Google Scholar]
- Tian, X.R.; Cui, W.; Shu, L.-F.; Zong, X. Effects of Climate Change on Burn Probability of Forests in Daxing’anling. Forests 2019, 10, 611. [Google Scholar] [CrossRef]
- Varela, V.; Vlachogiannis, D.; Sfetsos, A.; Politi, N.; Karozis, S. Methodology for the Study of Near-Future Changes of Fire Weather Patterns with Emphasis on Archaeological and Protected Touristic Areas in Greece. Forests 2020, 11, 1168. [Google Scholar] [CrossRef]
- Fernandes, P.M. Variation in the Canadian Fire Weather Index Thresholds for Increasingly Larger Fires in Portugal. Forests 2019, 10, 838. [Google Scholar] [CrossRef]
- Taylor Stephen, W.; Alexander Martin, E. Science, technology, and human factors in fire danger rating: The Canadian experience. Int. J. Wildland Fire 2006, 15, 121–135. [Google Scholar] [CrossRef]
- Pyne, S.J.; Andrews, P.L.; Laven, R. Introduction to Wildland Fire, 2nd ed.; John Wiley & Sons: New York, NY, USA, 1996. [Google Scholar]
- Hartley, I.P.; Hill, T.C.; Chadburn, S.E.; Hugelius, G. Temperature effects on carbon storage are controlled by soil stabilisation capacities. Nat. Commun. 2021, 12, 6713. [Google Scholar] [CrossRef] [PubMed]
- Hou, X.; Orth, R. Observational evidence of wildfire-promoting soil moisture anomalies. Sci. Rep. 2020, 10, 11008. [Google Scholar] [CrossRef]
- Abatzoglou, J.T. Development of gridded surface meteorological data for ecological applications and modelling. Int. J. Climatol. 2013, 27, 121–131. [Google Scholar] [CrossRef]
- Lawson, B.D.; Armitage, O.B. Weather Guide for the Canadian Forest Fire Danger Rating System; National Resources Canada: Edmonton, AB, Canada, 2008.
- Sabater, J.M. ERA5-Land Hourly Data from 1981 to Present; Copernicus Climate Change Service (C3S) Climate Data Store (CDS): The Hague, The Netherlands, 2019. [Google Scholar] [CrossRef]
- Vitolo, C.; Di Giuseppe, F.; Barnard, C.; Coughlan, R.; San-Miguel-Ayanz, J.; Liberta, G.; Krzeminski, B. ERA5-based global meteorological wildfire danger maps. Sci. Data 2020, 7, 216. [Google Scholar] [CrossRef]
- Quan, X.; He, B.; Yebra, M.; Yin, C.; Liao, Z.; Li, X. Retrieval of forest fuel moisture content using a coupled radiative transfer model. Environ. Model. Softw. 2017, 95, 290–302. [Google Scholar] [CrossRef]
- Quan, X.; Li, Y.; He, B.; Cary, G.J.; Lai, G. Application of Landsat ETM+ and OLI data for foliage fuel load monitoring using radiative transfer model and machine learning method. IEEE J. Sel. Top. Appl. Earth Obs. Remote Sens. 2021, 14, 5100–5110. [Google Scholar] [CrossRef]
- Quan, X.; Xie, Q.; He, B.; Luo, K.; Liu, X. Integrating remotely sensed fuel variables into wildfre danger assessment for China. Int. J. Wildland Fire 2021, 30, 807–821. [Google Scholar] [CrossRef]
- Trang, P.T.; Andrew, M.E.; Chu, T.; Enright, N.J. Forest fire and its key drivers in the tropical forests of northern Vietnam. Int. J. Wildland Fire 2022, 31, 213–229. [Google Scholar] [CrossRef]
- Phelps, N.; Woolford, D.G. Guidelines for effective evaluation and comparison of wildland fire occurrence prediction models. Int. J. Wildland Fire 2021, 30, 225–240. [Google Scholar] [CrossRef]
- De Frenne, P.; Lenoir, J.; Luoto, M.; Scheffers, B.R.; Zellweger, F.; Aalto, J.; Hylander, K. Topography and edge effects are more important than elevation as drivers of vegetation patterns in a neotropical montane forest. J. Veg. Sci. 2014, 25, 724–733. [Google Scholar] [CrossRef]
- Zhang, X.R.; Guan, D.J.; Mou, F.Y.; Dong, K. Calculation and Analysis of Annual Total Solar Radiation in Complicated Topography. Adv. Mater. Res. 2012, 512, 47–50. [Google Scholar] [CrossRef]
- De Frenne, P.; Lenoir, J.; Luoto, M.; Scheffers, B.R.; Zellweger, F.; Aalto, J.; Hylander, K. Forest microclimates and climate change: Importance, drivers and future research agenda. Glob. Change Biol. 2021, 5, 2279–2297. [Google Scholar] [CrossRef]
- Maingi, J.; Henry, M. Factors influencing wildfire occurrence and distribution in eastern Kentucky, USA. Int. J. Wildland Fire 2007, 16, 23–33. [Google Scholar] [CrossRef]
- Stambaugh, M.C.; Guyette, R.P. Predicting spatio-temporal variability in fire return intervals using a topographic roughness index. For. Ecol. Manag. 2008, 254, 463–473. [Google Scholar] [CrossRef]
- Jaafari, A.; Gholami, D.M.; Zenner, E.K. A Bayesian modeling of wildfre probability in the Zagros Mountains, Iran. Ecol. Inform. 2017, 39, 32–44. [Google Scholar] [CrossRef]
- Nadeem, K.; Taylor, S.W.; Woolford, D.G.; Dean, C.B. Mesoscale spatiotemporal predictive models of daily human and lightning-caused wildland fire occurrence in British Columbia. Int. J. Wildland Fire 2020, 29, 11–27. [Google Scholar] [CrossRef]
- Vilar, L.; Woolford, D.G.; Martell, D.L.; Martin, M.P. A model for predicting human-caused wildfire occurrence in the region of Madrid, Spain. Int. J. Wildland Fire 2010, 19, 325–337. [Google Scholar] [CrossRef]
- Rodger, C.J.; Brundell, J.B.; Holzworth, R.H.; Lay, E.H. Growing Detection Efficiency of the Worldwide Lightning Location Network. Am. Inst. Phys. 2009, 1118, 15–20. [Google Scholar] [CrossRef]
- Lang, T. NRT Lightning Imaging Sensor (LIS) on International Space Station (ISS) Backgrounds [Indicate Subset Used]; NASA Global Hydrometeorology Resource Center DAAC: Huntsville, AL, USA, 2022. [CrossRef]
- Blakeslee, R.J. Lightning Imaging Sensor (LIS) on TRMM Backgrounds [Indicate Subset Used]; NASA Global Hydrometeorology Resource Center DAAC: Huntsville, AL, USA, 2010. [CrossRef]
- Burrows W, R.; King, P.; Lewis P, J.; Kochtubajda, B.; Snyder, V. Lightning occurrence patterns over Canada and adjacent United States from lightning detection network observations. Atmosphere 2002, 40, 59–80. [Google Scholar] [CrossRef]
- Wotton B, M.; Martell D, L. A lightning fire occurrence model for Ontario. Can. J. For. Res. 2005, 35, 1389–1401. [Google Scholar] [CrossRef]
- Krawchuk, M.A.; Cumming, S.G.; Flannigan, M.D. Predicted changes in fire weather suggest increases in lightning fire initiation and future area burned in the mixedwood boreal forest. Clim. Change 2009, 92, 83–97. [Google Scholar] [CrossRef]
- Coughlan, R.; Di Giuseppe, F.; Vitolo, C.; Barnard, C.; Lopez, P.; Drusch, M. Using machine learning to predict fire-ignition occurrences from lightning forecasts. Meteorol. Appl. 2021, 28, e1973. [Google Scholar] [CrossRef]
- Hessilt, T.D.; Abatzoglou, J.T.; Chen, Y.; Randerson, J.T.; Scholten, R.C.; van der Werf, G.; Veraverbeke, S. Future increases in lightning ignition efficiency and wildfire occurrence expected from drier fuels in boreal forest ecosystems of western North America. Environ. Res. Lett. 2022, 17, 054008. [Google Scholar] [CrossRef]
- Jolly, W.M.; Cochrane, M.A.; Freeborn, P.H.; Holden, Z.A.; Brown, T.J.; Williamson, G.J.; Bowman, D.M.J.S. Climate-induced variations in global wildfire danger from 1979 to 2013. Nat. Commun. 2015, 6, 7537. [Google Scholar] [CrossRef]
- Chen, F.; Fan, Z.; Niu, S.; Zheng, J. The Influence of Precipitation and Consecutive Dry Days on Burned Areas in Yunnan Province, Southwestern China. Adv. Meteorol. 2014, 2014, 748923. [Google Scholar] [CrossRef]
- Sharples, J.J.; McRae, R.H.D.; Weber, R.O. Wind characteristics over complex terrain with implications for bushfire risk management. Environ. Model. Softw. 2010, 25, 1099–1120. [Google Scholar] [CrossRef]
- Lagerquist, R.; Flannigan, M.D.; Wang, X.; Marshall, G.A. Automated prediction of extreme fire weather from synoptic patterns in northern Alberta, Canada. Can. J. For. Res. 2017, 47, 1175–1183. [Google Scholar] [CrossRef]
- Luo, K.W.; Quan, X.W.; He, B.B.; Yebra, M. Efects of live fuel moisture content on wildfre occurrence in fre-prone regions over southwest China. Forests 2019, 10, 887. [Google Scholar] [CrossRef]
- Du, Y.; Zhang, D. Spatial and temporal distribution of land surface temperature and its influencing factors in Greater Khingan Mountains from 2001 to 2019. For. Eng. 2020, 36, 10. (In Chinese) [Google Scholar]
- Xu, H. Forest in Great Xing’an Mountains of China; Science Press: Beijing, China, 1998. (In Chinese) [Google Scholar]
- Han, H.L. Design of Lightning Monitoring Location and Lightning Fire Warning System in the Northern Great Xingan’s Mountain; Beijing University of Posts and Telecommunications: Beijing, China, 2012. (In Chinese) [Google Scholar]
- Menezes, L.S.; Oliveira, A.M.D.; Santos, F.; Russo, A.; de Souza, R.A.; Roque, F.O.; Libonati, R. Lightning patterns in the Pantanal: Untangling natural and anthropogenic-induced wildfires. Sci. Total Environ. 2022, 820, 153021. [Google Scholar] [CrossRef] [PubMed]
- Danielson, J.J.; Gesch, D.B. Global Multi-Resolution Terrain Elevation Data 2010 (GMTED2010); U.S. Geological Survey Open: Reston, VA, USA, 2011.
- Coulson, K.L. Characteristics of the radiation emerging from the top of a rayleigh atmosphere—I: Intensity and polarization. Planet. Space Sci. 1959, 1, 265–276. [Google Scholar] [CrossRef]
- Fang, H.L.; Baret, F.; Plummer, S.; Schaepman-Strub, G. An Overview of Global Leaf Area Index (LAI): Methods, Products, Validation, and Applications. Rev. Geophys. 2019, 57, 739–799. [Google Scholar] [CrossRef]
- Cutler, A.; Cutler, D.; Stevens, J. Random Forests. Mach. Learn. 2001, 45, 157–176. [Google Scholar] [CrossRef]
- Jaafari, A.; Pourghasemi, H.R. Factors Influencing Regional-Scale Wildfire Probability in Iran. Spat. Model. GIS R Earth Environ. Sci. 2019, 28, 607–619. [Google Scholar] [CrossRef]
- Wu, Z.; He, H.S.; Yang, J.; Liu, Z.; Liang, Y. Relative effects of climatic and local factors on fire occurrence in boreal forest landscapes of northeastern China. Sci. Total Environ. 2014, 493, 472–480. [Google Scholar] [CrossRef]
- O’Brien, R.; Ishwaran, H. A random forests quantile classifier for class imbalanced data. Pattern Recognit 2019, 90, 232–249. [Google Scholar] [CrossRef]
- Wang, Z.; He, B.; Lai, X. Balanced Random Forest Model is More Suitable for Wildfire Risk Assessment. In Proceedings of the IGARSS 2022 IEEE International Geoscience and Remote Sensing Symposium, Kuala Lumpur, Malaysia, 17–22 July 2022; pp. 3596–3599. [Google Scholar] [CrossRef]
- Chen, T.; Guestrin, C. XGBoost: A Scalable Tree Boosting System. In Proceedings of the 22nd ACM SIGKDD International Conference on Knowledge Discovery and Data Mining, San Francisco, CA, USA, 13–17 August 2016. [Google Scholar] [CrossRef]
- Varela, V.; Vlachogiannis, D.; Sfetsos, A.; Karozis, S.; Politi, N.; Giroud, F. Projection of Forest Fire Danger due to Climate Change in the French Mediterranean Region. Sustainability 2019, 11, 4284. [Google Scholar] [CrossRef]
- Zong, X.; Tian, X.; Yin, Y. Impacts of Climate Change on Wildfires in Central Asia. Forests 2020, 11, 802. [Google Scholar] [CrossRef]
- Ma, W.; Feng, Z.; Cheng, Z.; Chen, S.; Wang, F. Identifying Forest Fire Driving Factors and Related Impacts in China Using Random Forest Algorithm. Forests 2020, 11, 507. [Google Scholar] [CrossRef]
- Taylor, S.W.; Woolford, D.G.; Dean, C.B.; Martell, D.L. Wildfire Prediction to Inform Fire Management: Statistical Science Challenges. Stat. Sci. 2013, 28, 586–615. [Google Scholar] [CrossRef]
- Zumbrunnen, T.; Pezzatti, G.B.; Menéndez, P.; Bugmann, H.; Bürgi, M.; Conedera, M. Weather and human impacts on forest fires: 100 years of fire history in two climatic regions of Switzerland. For. Ecol. Manag. 2011, 261, 2188–2199. [Google Scholar] [CrossRef]
- Wang, Y. Updated Source Code for Calculating Fire Danger Indices in the Canadian Forest Fire Weather Index System; Natural Resources Canada, Canadian Forest Service, Northern Forestry Centre: Edmonton, AB, Canada, 2015; 26p. [Google Scholar]
- Tatli, H.; Türke, M. Climatological evaluation of Haines forest fire weather index over the Mediterranean Basin. Meteorol. Appl. 2014, 21, 545–552. [Google Scholar] [CrossRef]


| Variable Type | Variable Code | Variable Explanation | Time Window | Selected Feature Type |
|---|---|---|---|---|
| Weather | Tem_max | Daily maximum temperature extracted from ERA5-Land surface air temperature. | 8 days | Gradient |
| RH_avg | Daily average relative humidity extracted from ERA5-Land surface air temperature and surface dewpoint temperature. | 8 days | Gradient, Cumulative | |
| Pre | Daily precipitation extracted from ERA5-Land total precipitation. | 16 days | Cumulative | |
| Win_avg | Daily average wind speed extracted from ERA5-Land surface u-wind and v-wind. | 16 days | Cumulative | |
| Fuel | FFMC | Fine fuel moisture code represents the moisture content of litter and other cured fine fuels. | 8 days | Gradient, Cumulative |
| DMC | Duff moisture code represents the average moisture content of loosely compacted organic layers of moderate depth. | 16 days | Gradient, Cumulative | |
| DC | Drought code represents the average moisture content of deep, compact organic layers. | 16 days | Gradient, Cumulative | |
| ISI | Initial buildup index represents the expected rate of fire spread. | 8 days | Gradient, Cumulative | |
| FWI | Fire weather index is a numeric rating of fire intensity. | 8 days | Gradient, Cumulative |
| Fire Points: Non-Fire Points | Recall | Precision | F1-Score |
|---|---|---|---|
| 1:1 | 0.933 | 0.750 | 0.831 |
| 1:2 | 0.915 | 0.877 | 0.895 |
| 1:3 | 0.904 | 0.931 | 0.917 |
| 1:4 | 0.896 | 0.952 | 0.923 |
| 1:5 | 0.887 | 0.960 | 0.922 |
| 1:6 | 0.868 | 0.961 | 0.905 |
| Model | Feature Group | Recall | Precision | ROC-AUC | PR-AUC | F1-Score |
|---|---|---|---|---|---|---|
| Random Forest | group I | 0.733 | 0.831 | 0.852 | 0.804 | 0.779 |
| group II | 0.873 | 0.990 | 0.983 | 0.960 | 0.928 | |
| group III | 0.872 | 0.996 | 0.986 | 0.957 | 0.930 | |
| group IV | 0.886 | 0.996 | 0.986 | 0.964 | 0.938 | |
| XGBoost | group I | 0.745 | 0.853 | 0.860 | 0.817 | 0.795 |
| group II | 0.892 | 0.987 | 0.992 | 0.967 | 0.937 | |
| group III | 0.886 | 0.968 | 0.994 | 0.971 | 0.925 | |
| group IV | 0.889 | 0.992 | 0.998 | 0.975 | 0.938 | |
| Balanced Random Forest | group I | 0.801 | 0.731 | 0.909 | 0.798 | 0.764 |
| group II | 0.889 | 0.948 | 0.991 | 0.956 | 0.918 | |
| group III | 0.893 | 0.926 | 0.990 | 0.959 | 0.909 | |
| group IV | 0.911 | 0.948 | 0.996 | 0.976 | 0.929 |
Disclaimer/Publisher’s Note: The statements, opinions and data contained in all publications are solely those of the individual author(s) and contributor(s) and not of MDPI and/or the editor(s). MDPI and/or the editor(s) disclaim responsibility for any injury to people or property resulting from any ideas, methods, instructions or products referred to in the content. |
© 2023 by the authors. Licensee MDPI, Basel, Switzerland. This article is an open access article distributed under the terms and conditions of the Creative Commons Attribution (CC BY) license (https://creativecommons.org/licenses/by/4.0/).
Share and Cite
Wang, Z.; He, B.; Chen, R.; Fan, C. Improving Wildfire Danger Assessment Using Time Series Features of Weather and Fuel in the Great Xing’an Mountain Region, China. Forests 2023, 14, 986. https://doi.org/10.3390/f14050986
Wang Z, He B, Chen R, Fan C. Improving Wildfire Danger Assessment Using Time Series Features of Weather and Fuel in the Great Xing’an Mountain Region, China. Forests. 2023; 14(5):986. https://doi.org/10.3390/f14050986
Chicago/Turabian StyleWang, Zili, Binbin He, Rui Chen, and Chunquan Fan. 2023. "Improving Wildfire Danger Assessment Using Time Series Features of Weather and Fuel in the Great Xing’an Mountain Region, China" Forests 14, no. 5: 986. https://doi.org/10.3390/f14050986