Article

Response Characteristics of Photosynthetic Productivity to the Canopy Spatial Distribution Pattern of Larix kaempferi

1
State Key Laboratory of Tree Genetics and Breeding, Key Laboratory of Tree Breeding and Cultivation of State Forestry and Grassland Administration, Research Institute of Forestry, Chinese Academy of Forestry, Beijing 100091, China
2
School of Eco-Environmental Engineering, Guizhou University for Nationalities, Guiyang 550025, China
*
Author to whom correspondence should be addressed.
These authors contributed equally to this work.
Forests 2023, 14(6), 1171; https://doi.org/10.3390/f14061171
Submission received: 30 April 2023 / Revised: 29 May 2023 / Accepted: 29 May 2023 / Published: 6 June 2023
(This article belongs to the Section Forest Ecology and Management)

Abstract

:
The spatial distribution of the forest canopy plays an important role in the transpiration and photosynthetic capacity of trees, ultimately affecting their growth and biomass production. Despite its importance, how canopy photosynthetic productivity enhancement depends on canopy spatial distribution remains unclear. To address this knowledge gap, we conducted a study on Larix kaempferi (Lamb.) Carrière (L. kaempferi) plantations in Gansu, China, investigating the relationship between canopy height, leaf area, seasonal variations in canopy spatial distribution, and photosynthetic parameters. The results showed that the net photosynthetic rate, stomatal conductance, and transpiration rate of L. kaempferi increase with greater canopy height, while photosynthetically active radiation shows the opposite trend. Canopy photosynthetic productivity peaked in April, May, and June when the height in the canopy was 40%, followed by 20%, and then 30% from the perspective of spatiotemporal canopy spatial distribution. Maximum leaf area (10.7 m2) and photosynthesis productivity (919.6 mg·C·h−1) were observed when the height in the canopy ranged from 48%–59%. The changes increased sunlight exposure (75%–88%, 88%–100%) in different canopy areas. Additionally, there was a decrease in the amount of space covered by shade (25%–38%, 50%–63%, and 63%–75%), depending on the specific region within the canopy. By scientifically managing stand density, the canopy spatial distribution can be optimized for photosynthesis, resulting in maximum light interception rates, enhanced photosynthetic capacity, and reduced “non-functional canopy”. These findings offer effective and scientifically informed management strategies for the forestry industry. By optimizing the structure of the canopy, specifically in L. kaempferi, these strategies aim to maximize photosynthetic productivity.

1. Introduction

The canopy photosynthetic productivity is the primary driving force for promoting and supporting forest formation [1] and is the main energy source for canopy carbon supply and metabolism [2]. The spatial distribution of the canopy directly affects tree photosynthetic capacity and tree growth [3], and then individual tree photosynthesis affects the performance/productivity of the entire forest stand [4,5,6]. This is because photosynthetic productivity mainly depends on the three-dimensional structure of the forest stand, the photosynthetic capacity of the canopy leaves, and the interception and conversion efficiency of light by leaves under specific environmental conditions [7,8,9]. Therefore, revealing the influence of canopy spatial distribution on photosynthetic productivity helps understand the formation of forest productivity and improves the ecosystem’s carbon sink capacity [10]. Therefore, it is crucial to develop forest management measures and discover forest productivity from an ecological and physiological perspective [11,12].
Significant differences exist in the spatial distribution of light within the canopy [13,14]. The light environment within forests is therefore highly different from that of crop canopies where canopy structure or leaf material is more homogenous and not so cone-shaped [15,16,17]. The relative light intensity in the canopy in young forest stands does not decrease steadily from top to bottom. It is worth highlighting here that this is because there is no full canopy closure and thus the spacing between neighboring trees permits light to enter directly from different angles, not just top-down. A local light intensity peak was found near the middle canopy of old Douglas fir trees; the light intensity in the canopy increased because of the lateral penetration of diffused light [8,13,14]. The forest light energy utilization rate was affected by forest canopy spatial distribution [15].
In addition, several studies have shown that variations in leaf optical properties, light environment, and irradiation conditions lead to spatial changes in crown photosynthesis [16,17,18]. Kurachi et al. [8,10,19] estimated canopy photosynthesis during different seasons by evaluating the light interception by the canopy, air temperature conditions, and branches (twigs without leaves) respiration. The model of Kurachi et al. [19] on canopy photosynthesis indicates that light conditions, such as light interception by leaves and branches (plus stems), are important factors affecting canopy photosynthesis. Thus, the effect of light interception by the canopy on photosynthesis should be considered [8]. Changes in the canopy position led to variations in stand productivity [20], as the annual photosynthetic rate of the canopy is highly correlated with the specific leaf mass of different canopy positions (proportions of sun-lit and shaded crown volumes) in deciduous trees (Larix sp.) [21]. The spatial distribution of tree canopy complexity is influenced by shoot growth, branch death, and the production of epidermal branches [22]. The leaf area ratio (leaf area/plant biomass) has a significant influence on the amount of light absorbed per unit of aboveground biomass [23].
The shade of the tree canopy causes the temperature in the lower canopy to be cooler than that of the upper canopy during the day, and the opposite characteristics are observed at night [24]. This leads to a difference in the air humidity and vapor pressure deficit (VPD) of the canopy between the upper and lower layers. Temperature changes affect photosynthesis and respiration, and humidity affects leaf stomatal conductance, affecting the accumulated canopy photosynthesis [19,25]. Light attenuation within the canopy leads to vertical variations in leaf physiological and morphological parameters [26]. However, numerous studies have also indicated that leaves in a low-light environment are adaptable to low light to optimize the carbon harvest of trees. Changes in light also affect the biochemistry of the leaves—a lot depends on whether the acclimation occurred before or after the leaf morphology and anatomy become fixed (developmental versus dynamic) [15]. Therefore, exploring the spatial and temporal dynamics of photosynthesis throughout the canopy structure is important for the precise quantification of canopy photosynthetic productivity.
Larix kaempferi (Lamb.) Carr. (L. kaempferi) (Japanese larch) is the main afforestation tree and timber species in Northeast China [27]. It is endemic to Japan and native to the central mountainous region of Honshu Island [28,29,30] (Figure S1). Japanese larch showed greater resistance and resilience in morphological and physiological responses and plant-water relations [31]. Although many researchers have already studied canopy photosynthesis, there is still a lack of research on the spatial distribution of photosynthesis within the canopy of L. kaempferi. Therefore, we hypothesize that the response of canopy photosynthetic parameters to changes in canopy spatial distribution pattern is not significant; the canopy spatial distribution pattern of canopy physiological and ecological parameters has a complex impact on the distribution pattern of photosynthetic productivity; thus, exploring the canopy spatial distribution and their photosynthetic productivity of L. kaempferi is significant. Our main objectives were (1) to discover characteristics that vary in the relationship between photosynthetic parameters and canopy spatial distribution, (2) to determine the distribution pattern of canopy physiological and ecological parameters and photosynthetic productivity, and (3) to clarify how canopy photosynthetic productivity enhancement depends on canopy spatial distribution.

2. Materials and Methods

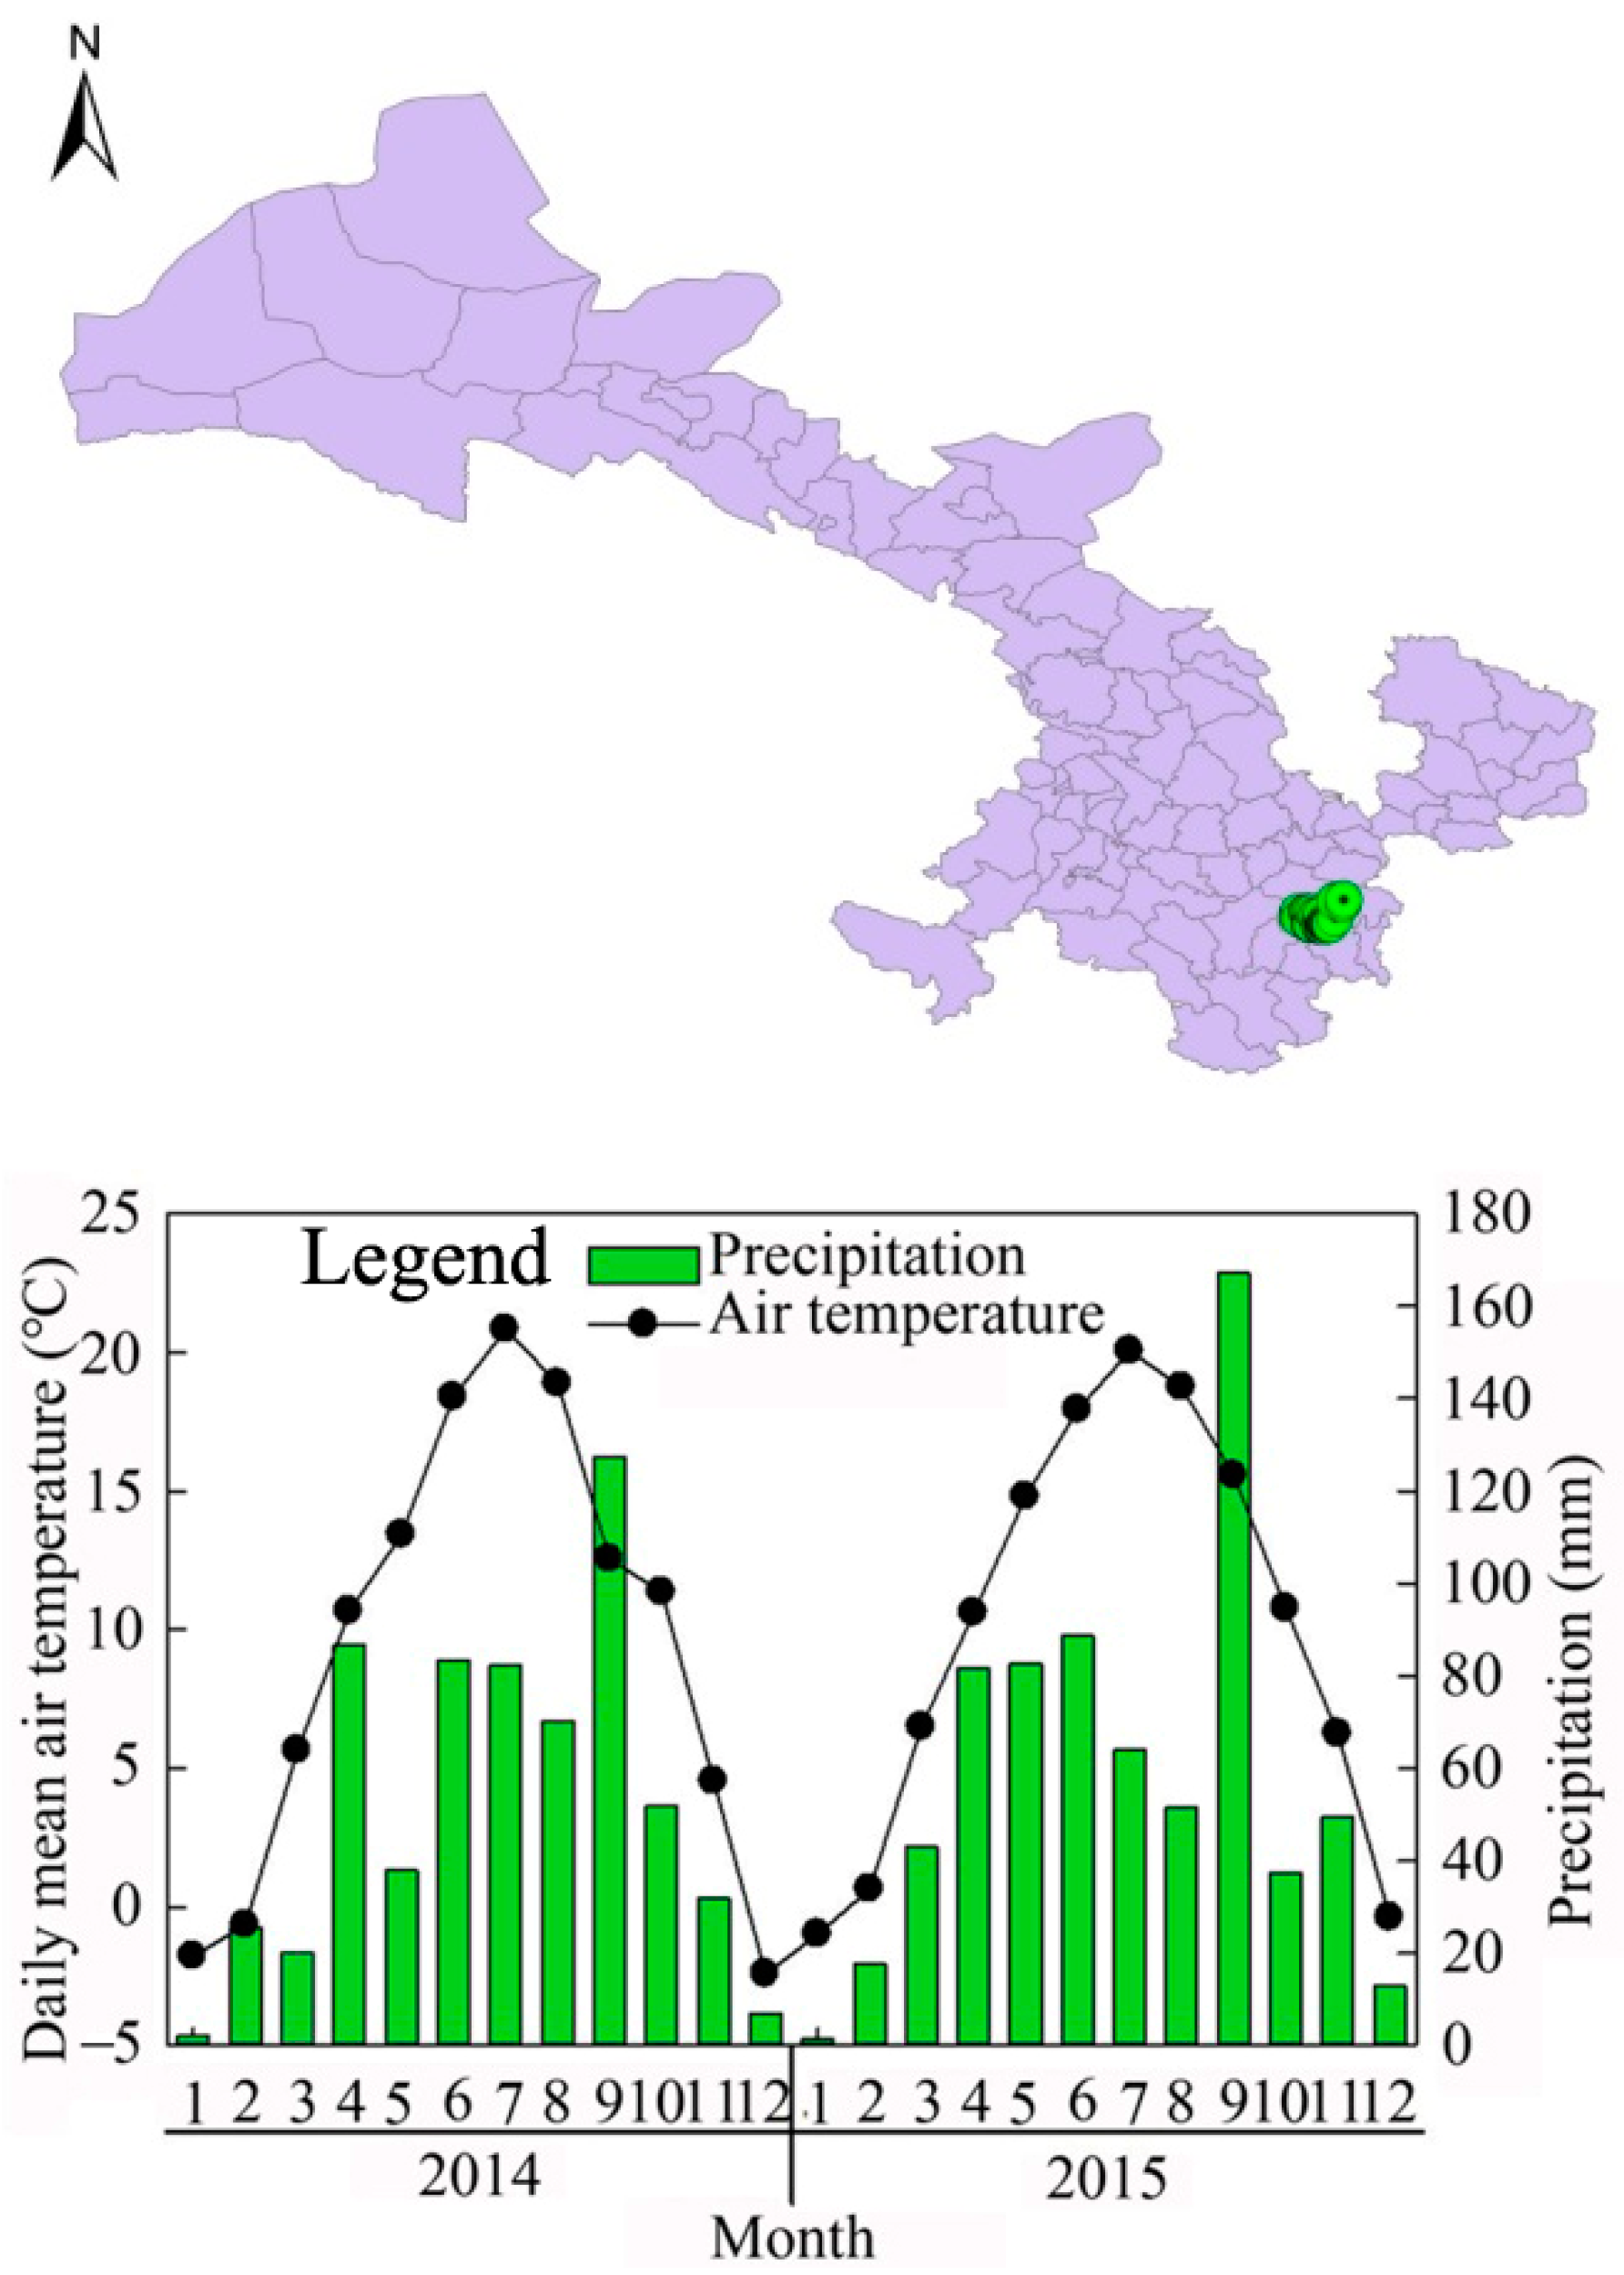
2.1. Site Description

This study was conducted in an L. kaempferi plantation in Xiaolongshan Forestry Experimental Bureau, Gansu province, northwest China. The site was defined as the climate transition zone between the northern subtropical and warm temperate zones and was in the western Qinling Mountains (104°22′–106°43′ E, 33°30′–34°49′ N), at an altitude of 700–3330 m (Figure 1). The mean annual temperature is 7–12 °C, the extreme maximum temperature is 39.2 °C, the minimum temperature is −23.2 °C, the mean values of mean annual precipitation is 670 mm, and the mean annual precipitation range is 460–800 mm. Most of the precipitation is concentrated in July, August, and September, which accounts for approximately 70%–80% of the annual precipitation. The frost-free period is 140d–218d (from early June to late October or early January of the next year) and the soil in these areas is mainly mountain brown soil [32,33].

2.2. Experimental Design and Sampling

The trees of L. kaempferi plantation including sapling (3-year-old), young (8-year-old), and mature (20-year-old) stages were selected for research in this study (Table 1). Three plots (20 m × 30 m) were set up in each stand with almost the same slope and aspect, and each tree was investigated. A target tree was selected, and then four neighboring trees of the target tree were selected as samples (totaling 36) [33]. The sapling stands were present in a mixed forest of L. kaempferi and Picea crassifolia, had an open canopy structure, and there was no shelter between the branches of the four adjacent sample trees. The 8-year-old and 20-year-old stands consisted of pure L. kaempferi forests and had a significant canopy closure. Within the middle and lower canopy, the branches intersected, and the neighboring trees created shade for one another. Consequently, this led to a reduced light environment in the middle and lower canopy areas. The soil nutrients in the sample plots decreased with decreasing soil depth, and the ranges of C:N, C:P, and N:P were 10.50–15.90, 22.29–32.79, and 1.66~2.72, respectively (Table 2).

2.3. Dendrometric and Photosynthetic Data Collection

A dynamic weather station (DL16; Adolf Thies GmbH & Co., KG, Göttingen, Germany) was used to measure the environmental variables (i.e., air temperature, Tair, and VPD) outside the chamber at 30 min intervals. The statistics for the measurement data for the photosynthetic light-response curves and the VPD and the specific leaf area (SLA) are listed in Table 3. The canopy was evenly divided into multiple layers based on its length. Each canopy was divided into eight equal layers based on the light interception effects, according to the stratified clipping method [34]. The first to eighth layers of the canopy was present from the top to bottom of the tree, and the position of the photosynthesis measurement point on the branch was consistent with the tree-division canopy. The canopy bottom was expressed as 0% of the relative crown height and the canopy top as 100%. Well-growing branches were selected from each layer and each direction for photosynthesis determination. The light and foliage area distributions of the samples were determined with the change in canopy depth and directional position (Figure 2). They measured using a portable photosynthetic system (LI-6400XT; LI-COR, Inc., Lincoln, NE, USA) [33].

2.4. Photosynthetic Light-Response Curve Measurement

Photosynthetic light-response curves (LRCs) of selected fully elongated needles were determined using a portable photosynthesis system (Li-6400XT; LI-COR, Inc., Lincoln, NE, USA). The coniferous cluster sample was acclimated for 20 min at a CO2 concentration of 380 mol·m−2·s−1, close to the actual concentration around coniferous trees. A CO2 mixer (Li-6400-01) maintained a stable CO2 supply in the chamber. In our previous research, we demonstrated that different vertical positions of the larch canopy stabilize when photosynthetically active radiation (PAR) is 1400 mol·m−2·s−1. Therefore, all coniferous clusters were induced with 1400 mol·m−2·s−1 radiation for at least 10 min to ensure that the potential photosynthetic capacity of all needle clusters could be activated. The coniferous cluster set was allowed to equilibrate for at least 2 min before measurements. To avoid the influence of photosynthetic ‘midday depression’ on the measurement results, the determination time was selected between 8:30 AM and 12:30 PM on sunny days, using a liquefied CO2 cylinder as the gas source, the CO2 response curve of needles was measured in situ using a portable photosynthesis measurement system connected to a controllable light cluster leaf chamber. The needles were induced using the same induction conditions as the light response curve measurement before the light response curve measurement. After the induction is completed, call the CO2 response curve automatic determination program, the light intensity in the leaf chamber was set as 1000 µmol·m−2·s−1, the CO2 concentration was 380 µmol·mol−1 [33], the temperature was 25 °C, and the flow rate was 500 µmol·s−1 before the LRCs was measured. The LRCs curve of the needles was measured when the photosynthetic rate remained stable. We adjusted the automatic measurement program of the LRCs curve, setting the CO2 concentration to 380 µmol·mol−1, the temperature to 25 °C, and light intensity to 2000, 1500, 1000, 800, 600, 400, 200, 100, 50, 20, and 0 µmol·m−2·s−1 from strong to weak, and the LRCs curve was measured automatically by an instrument.
In this study, we selected the most common models (Nonrectangle hyperbola model (NRH), modified rectangle hyperbola model (MRH), and Modigliani Miller model (MM)) to find the optimal model to fit LRC curves. The model equations are as follows:
MM model [35]:
P n = P max 1 e A Q Y P A R P max R d
where Pn is net photosynthesis rate (µmol·m−2·s−1), Pmax is the maximum Pn (µmol·m−2·s−1), PAR is photosynthetically active radiation (µmol·m−2·s−1), AQY is apparent quantum yield, and Rd is dark respiration (µmol·m−2·s−1).
MRH model [36]:
P n = A Q Y P A R 1 λ P A R 1 + δ P A R R d
δ = A Q Y P max
where λ is a dimensionless correction factor.
NRH model [37]:
P n = A Q Y P A R + P max A Q Y P A R P max 2 4 A Q Y θ P max 2 θ R d
where θ is the curvature of the LRC curve.

2.5. Optimal LRC Model Selection

After the models were modified, they were assessed by calculating the coefficient of determination (R2), mean error (ME), mean relative error (MRE), mean squared error (RMSE), and relative mean squared error (RRMSE) of the calculation model:
R 2 = 1 i = 1 n ( y i y ^ i ) 2 i = 1 n ( y i y ) 2
M E = i = 1 n ( y i y ^ i ) n
M R E = i = 1 n ( y i y ^ i ) i = 1 n y i
R M S E = i = 1 n ( y i y ^ i ) 2 n 1
where n is the number of samples, y i is the observed value, and y ^ i is the predicted value.

2.6. Leaf Area and Specific Leaf Area Determination

The branch diameter, branch length, branch chord length, and branch angle of all branches were measured in each canopy layer. Then, all branches were cut and weighed, and a branch with an average weight was selected as the measuring branch in each canopy layer. The branches and leaves were weighed separately. The needles were measured in situ using a portable photosynthesis measurement system connected to a controlled light cluster leaf chamber. The clusters were measured and then all needles were stripped to measure the leaf area. The coniferous leaf area of L. kaempferi is difficult to measure directly in the field; therefore, the needles used to measure photosynthesis were removed and placed in an ice box to take them to the laboratory. We scanned the coniferous leaf with the Scan Maker i800 Plus scanner. We measured the leaf area using Photoshop software to obtain the SLA (cm2·g−1) from the conical projection area (S, cm2) and dry weight (Wdry, g), according to the following formula.
S L A = S W d r y

2.7. Canopy Photosynthesis Productivity Estimation

The canopy photosynthesis productivity was estimated using a hierarchical accumulation method [38]. The equation is as follows:
P c a n = i = 1 l k = 1 s P d a y   i , k × L A i , k
where Pcan is the canopy photosynthetic productivity (g·C·a−1), Pday is the daily canopy photosynthetic productivity (g·C·m−2·d−1), LA is the leaf area (m2), i and k are the number of canopies and measured days, respectively, l and s are the total number of canopies and measured days, respectively. The leaf area of each canopy was calculated by measuring the SLA and weight of dry leaves, which were all assessed from the sample trees. As a result, the daily photosynthetic productivity can be calculated using the following equation:
P d a y = j = 1 48 P n j × 1800 × 12 × 10 6
where Pn is net photosynthesis rate, j is the time (a day (24 h) was equally divided into 48 parts), 1800 means 1800 s, 12 is the molar mass of C (12 g·C·mol−1). Pday was calculated by Equation (1) and PAR that Equation (2) [33].
Continuous PAR and air temperature (Ta) data for each canopy were acquired from the forest ecological system research station at Xiaolong Mountain in Gansu Province. PAR was used to estimate the canopy productivity.
Then, Equation (10) was revised as follows:
P c a n = i = 1 l k = 1 s j = 1 48 A Q Y P A R + P max A Q Y P A R P max 2 4 A Q Y θ P max 2 θ R d j × 1800 × 12 × 10 6   i , k × L A i , k
The stomatal limit value (Ls) was calculated by:
Ls = 1 − Ci/Ca
Ci is intercellular CO2 concentration; Ca is atmospheric CO2 concentration.

2.8. Data Analysis

We accounted statistically for the block effect of sampling each canopy at several directions, heights, and time points. Specifically, all the measured data in eight directions: east, west, south, north, southeast, southwest, northeast, and northwest in each canopy layer in each middle-month from May to September were averaged to become the final data for analysis. A nonlinear mixed model was used to analyze the relationship between canopy spatial structure and canopy photosynthetic productivity. Akaike’s information standard was calculated (AICc; corrected for small sample size) to determine the best-fit model. The significance level of p < 0.05 was used for all statistical procedures. Statistical analyses were performed using the R software (Version 3.3.0) [39], and data were tested for normal distribution using the Shapiro–Wilk normality test and for variance homogeneity using Levene’s test [33].

3. Results

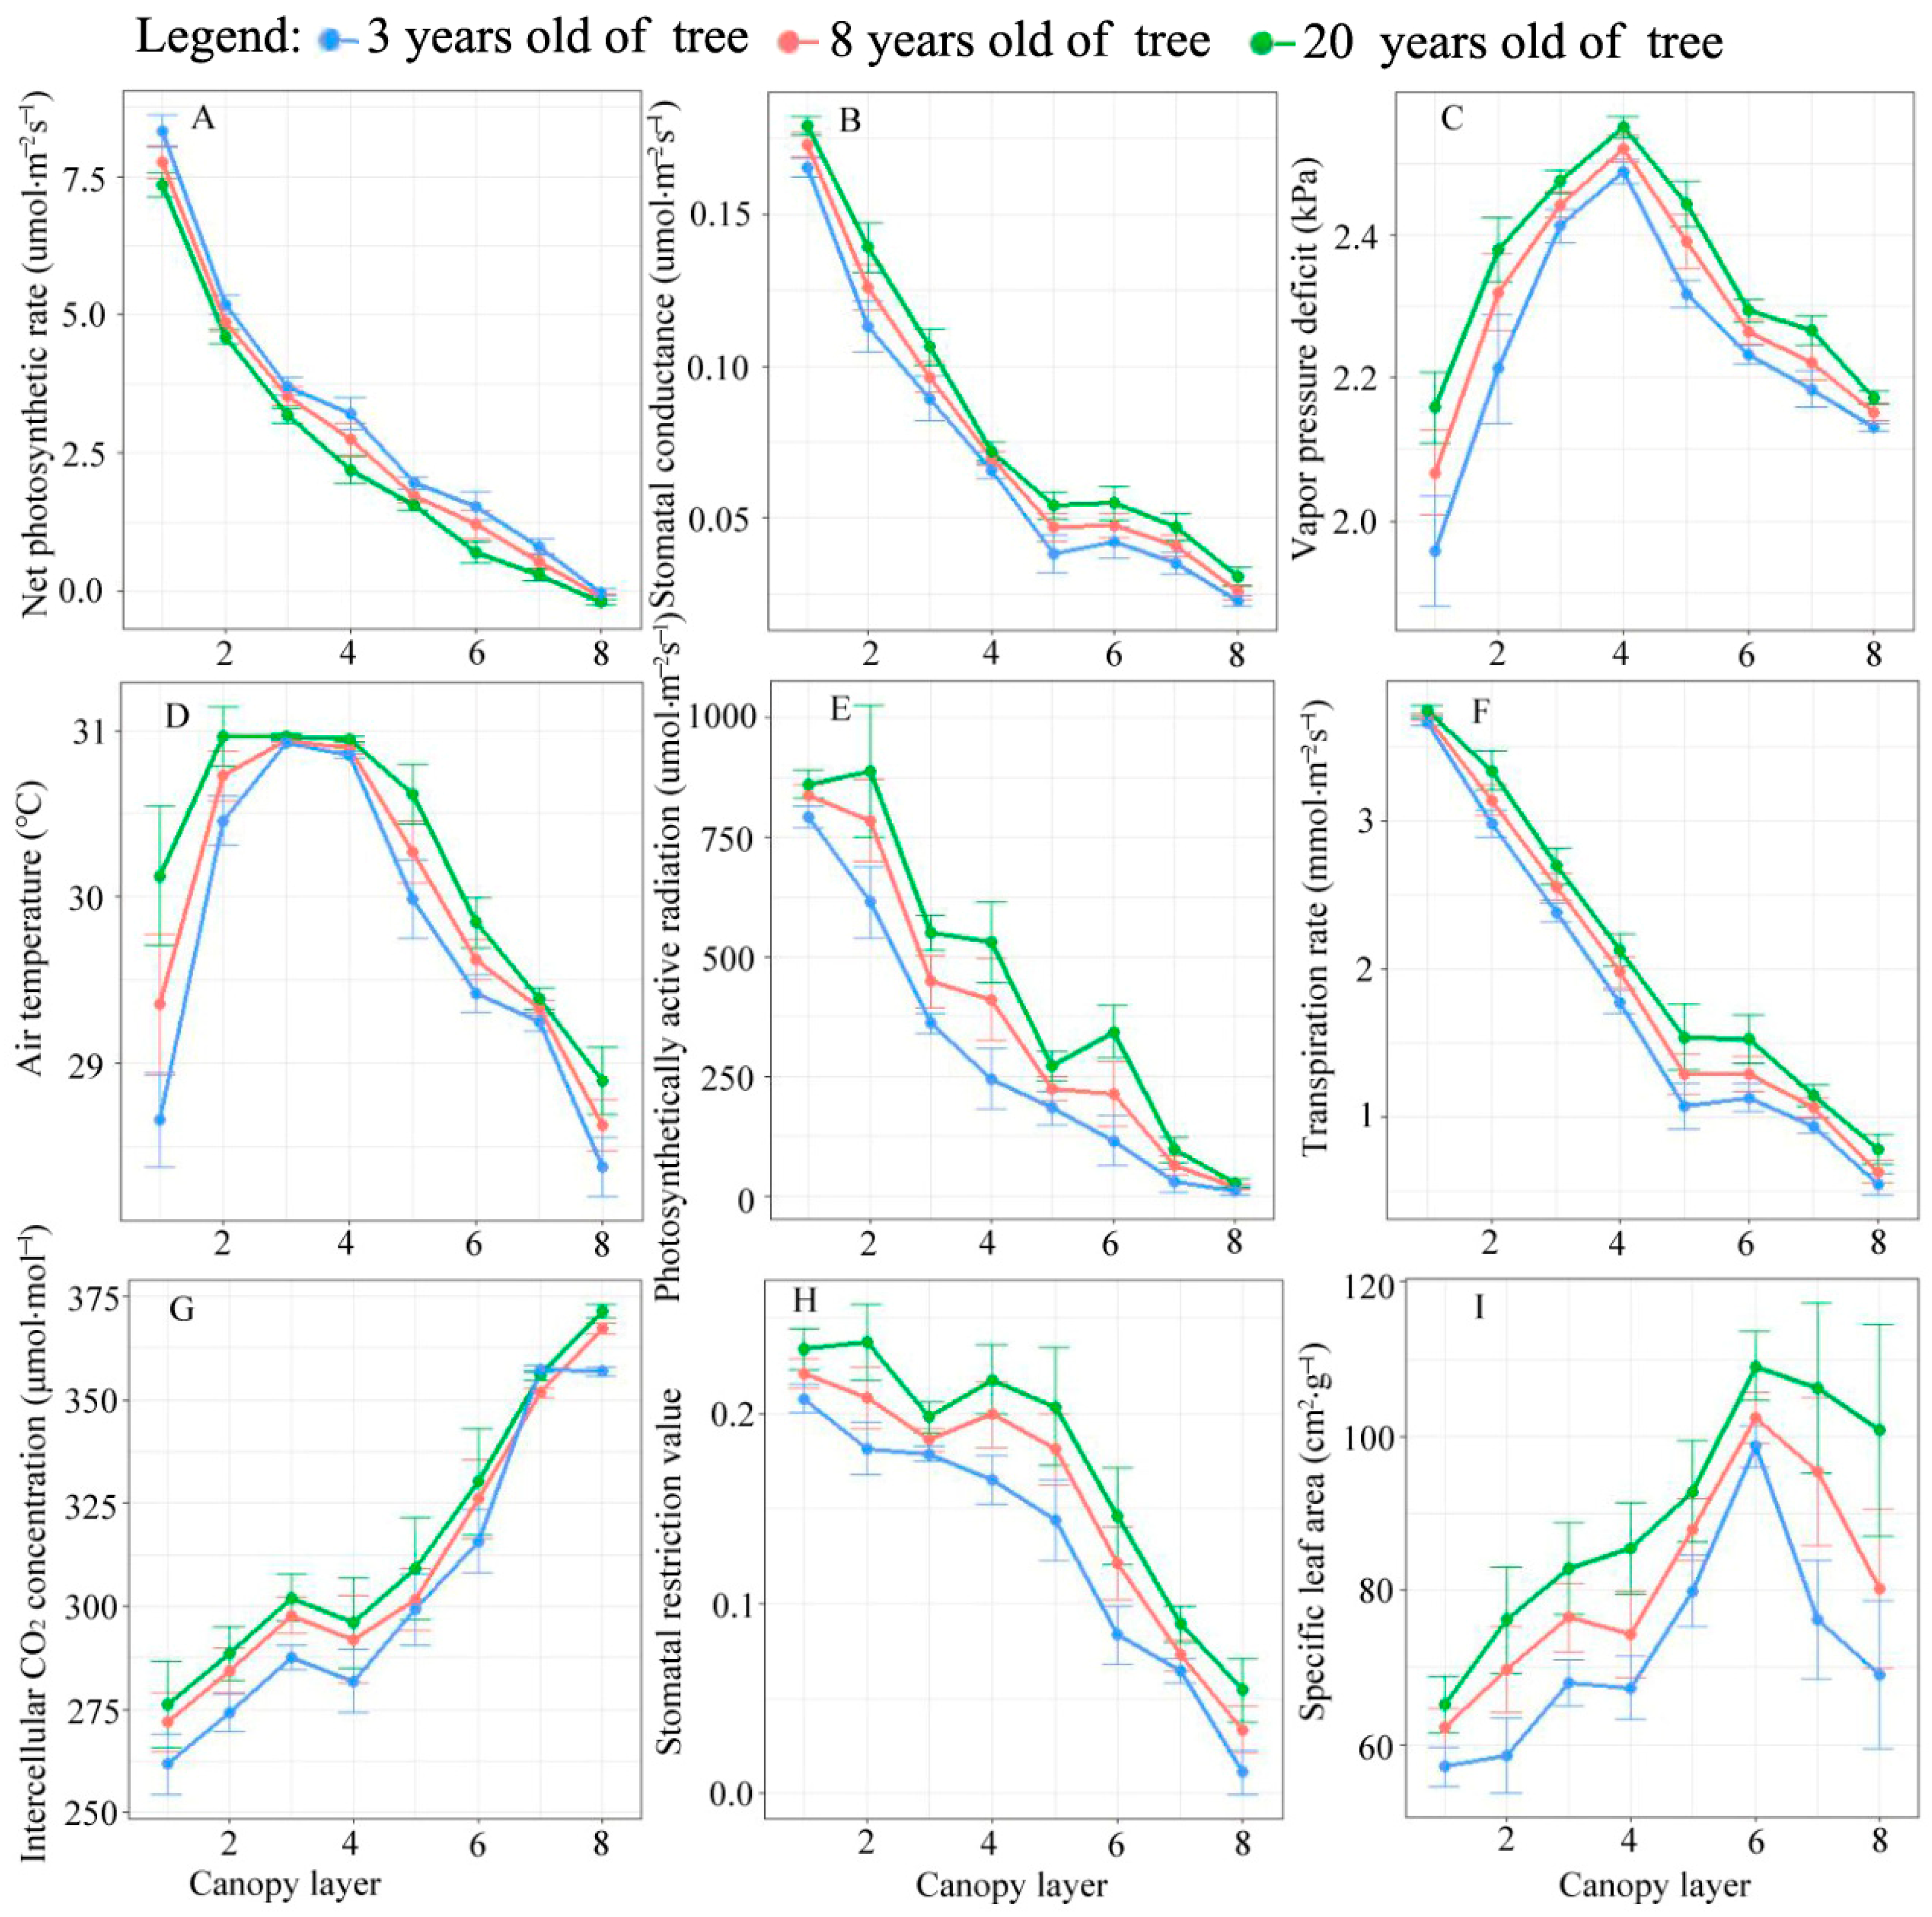
3.1. Distribution Pattern of Photosynthetic Parameters in Canopy

The results highlighted the changes in canopy leaf area and photosynthesis characteristics in the canopy. With an increase in the canopy layer, the net photosynthetic rate, PAR, stomatal conductance (gs), and transpiration rate showed an exponential change, and the VPD and temperature exhibited a univariate quadratic curve change regulation (Figure 3). The VPD and air temperature were maximum in the third and fourth canopy layers, respectively. With an increase in the canopy layer, the intercellular CO2 concentration and specific leaf area decreased linearly and the stomatal limit value increased. There is not much difference among different ages in the overall pattern.

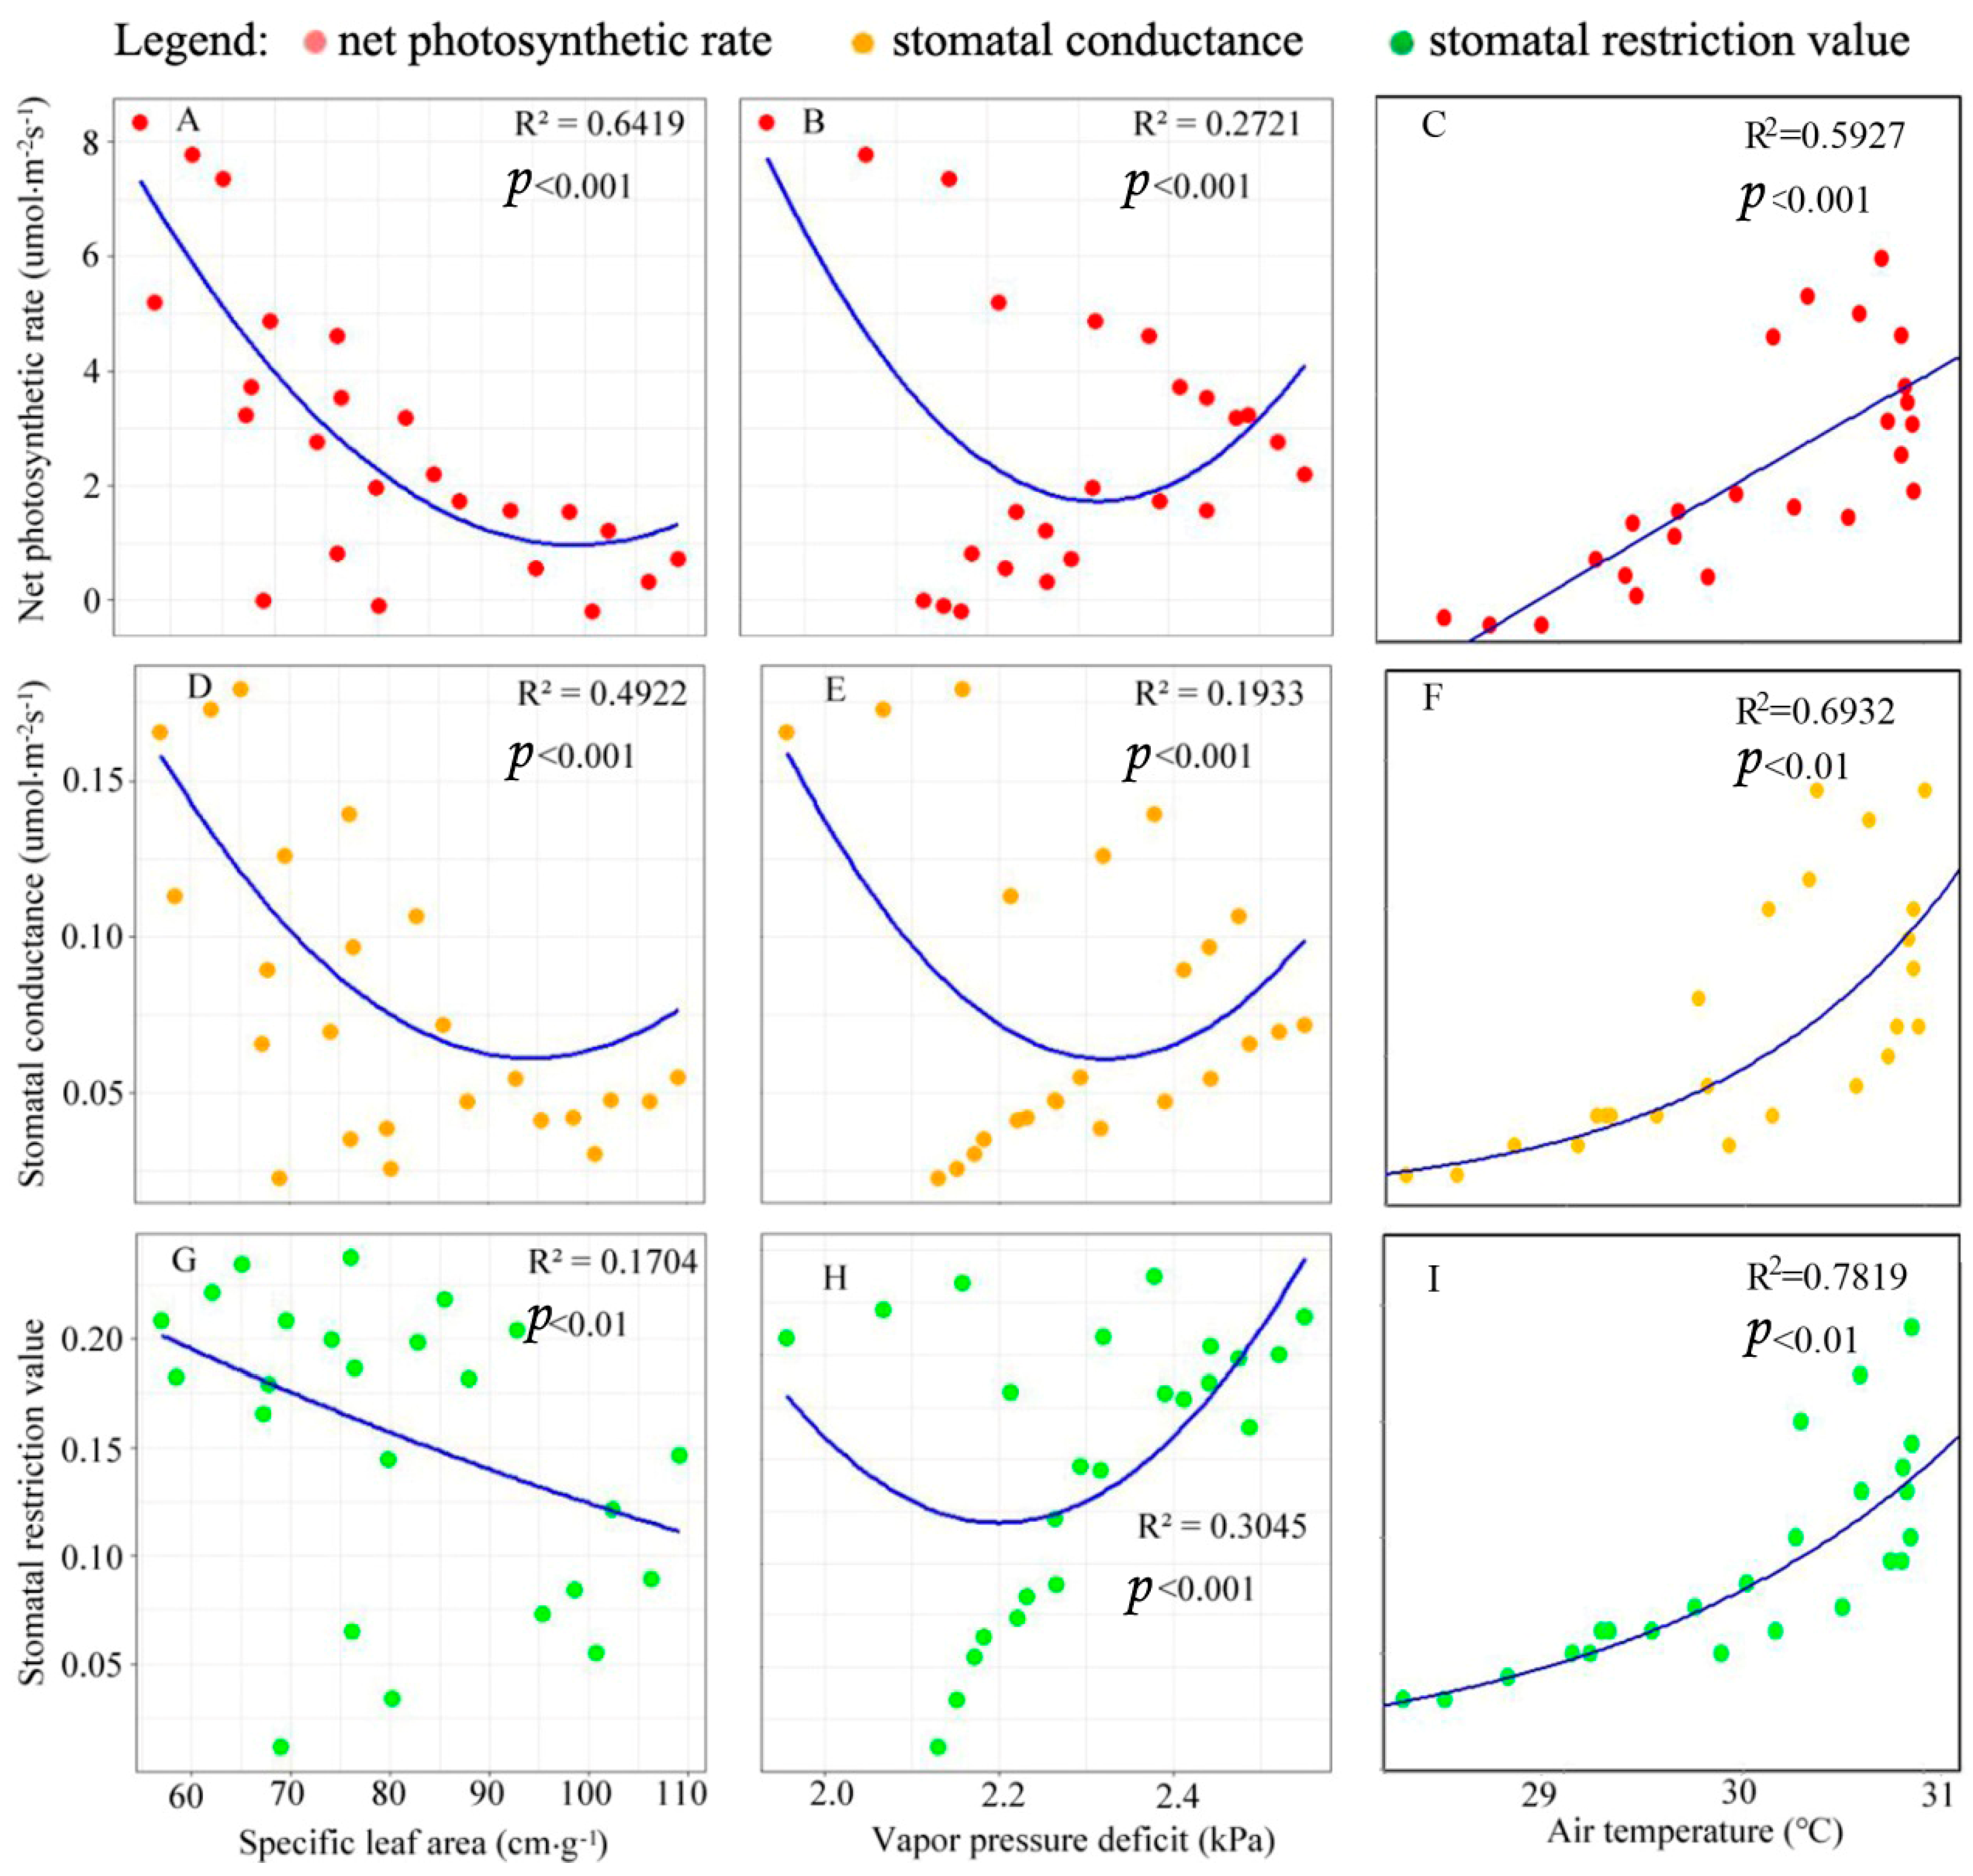
3.2. Relationships between Photosynthetic Parameters versus VPD, SLA, and Ta

Pn was significantly negatively correlated with SLA and VPD (Figure 4). The correlation between Pn and SLA (R2 = 0.64) was stronger than between Pn and VPD (R2 = 0.27). The correlation between Ta and Pn (R2 = 0.59) was positive, and weaker than the correlation of SLA with Pn. The relationships of SLA, VPD, and Ta with gs were similar to those with Pn. The Ls were negatively correlated with SLA and VPD and positively correlated with Ta, but the correlation between Ls and Ta was more significant (R2 = 0.78). This indicated that gs and Pn are closely related.

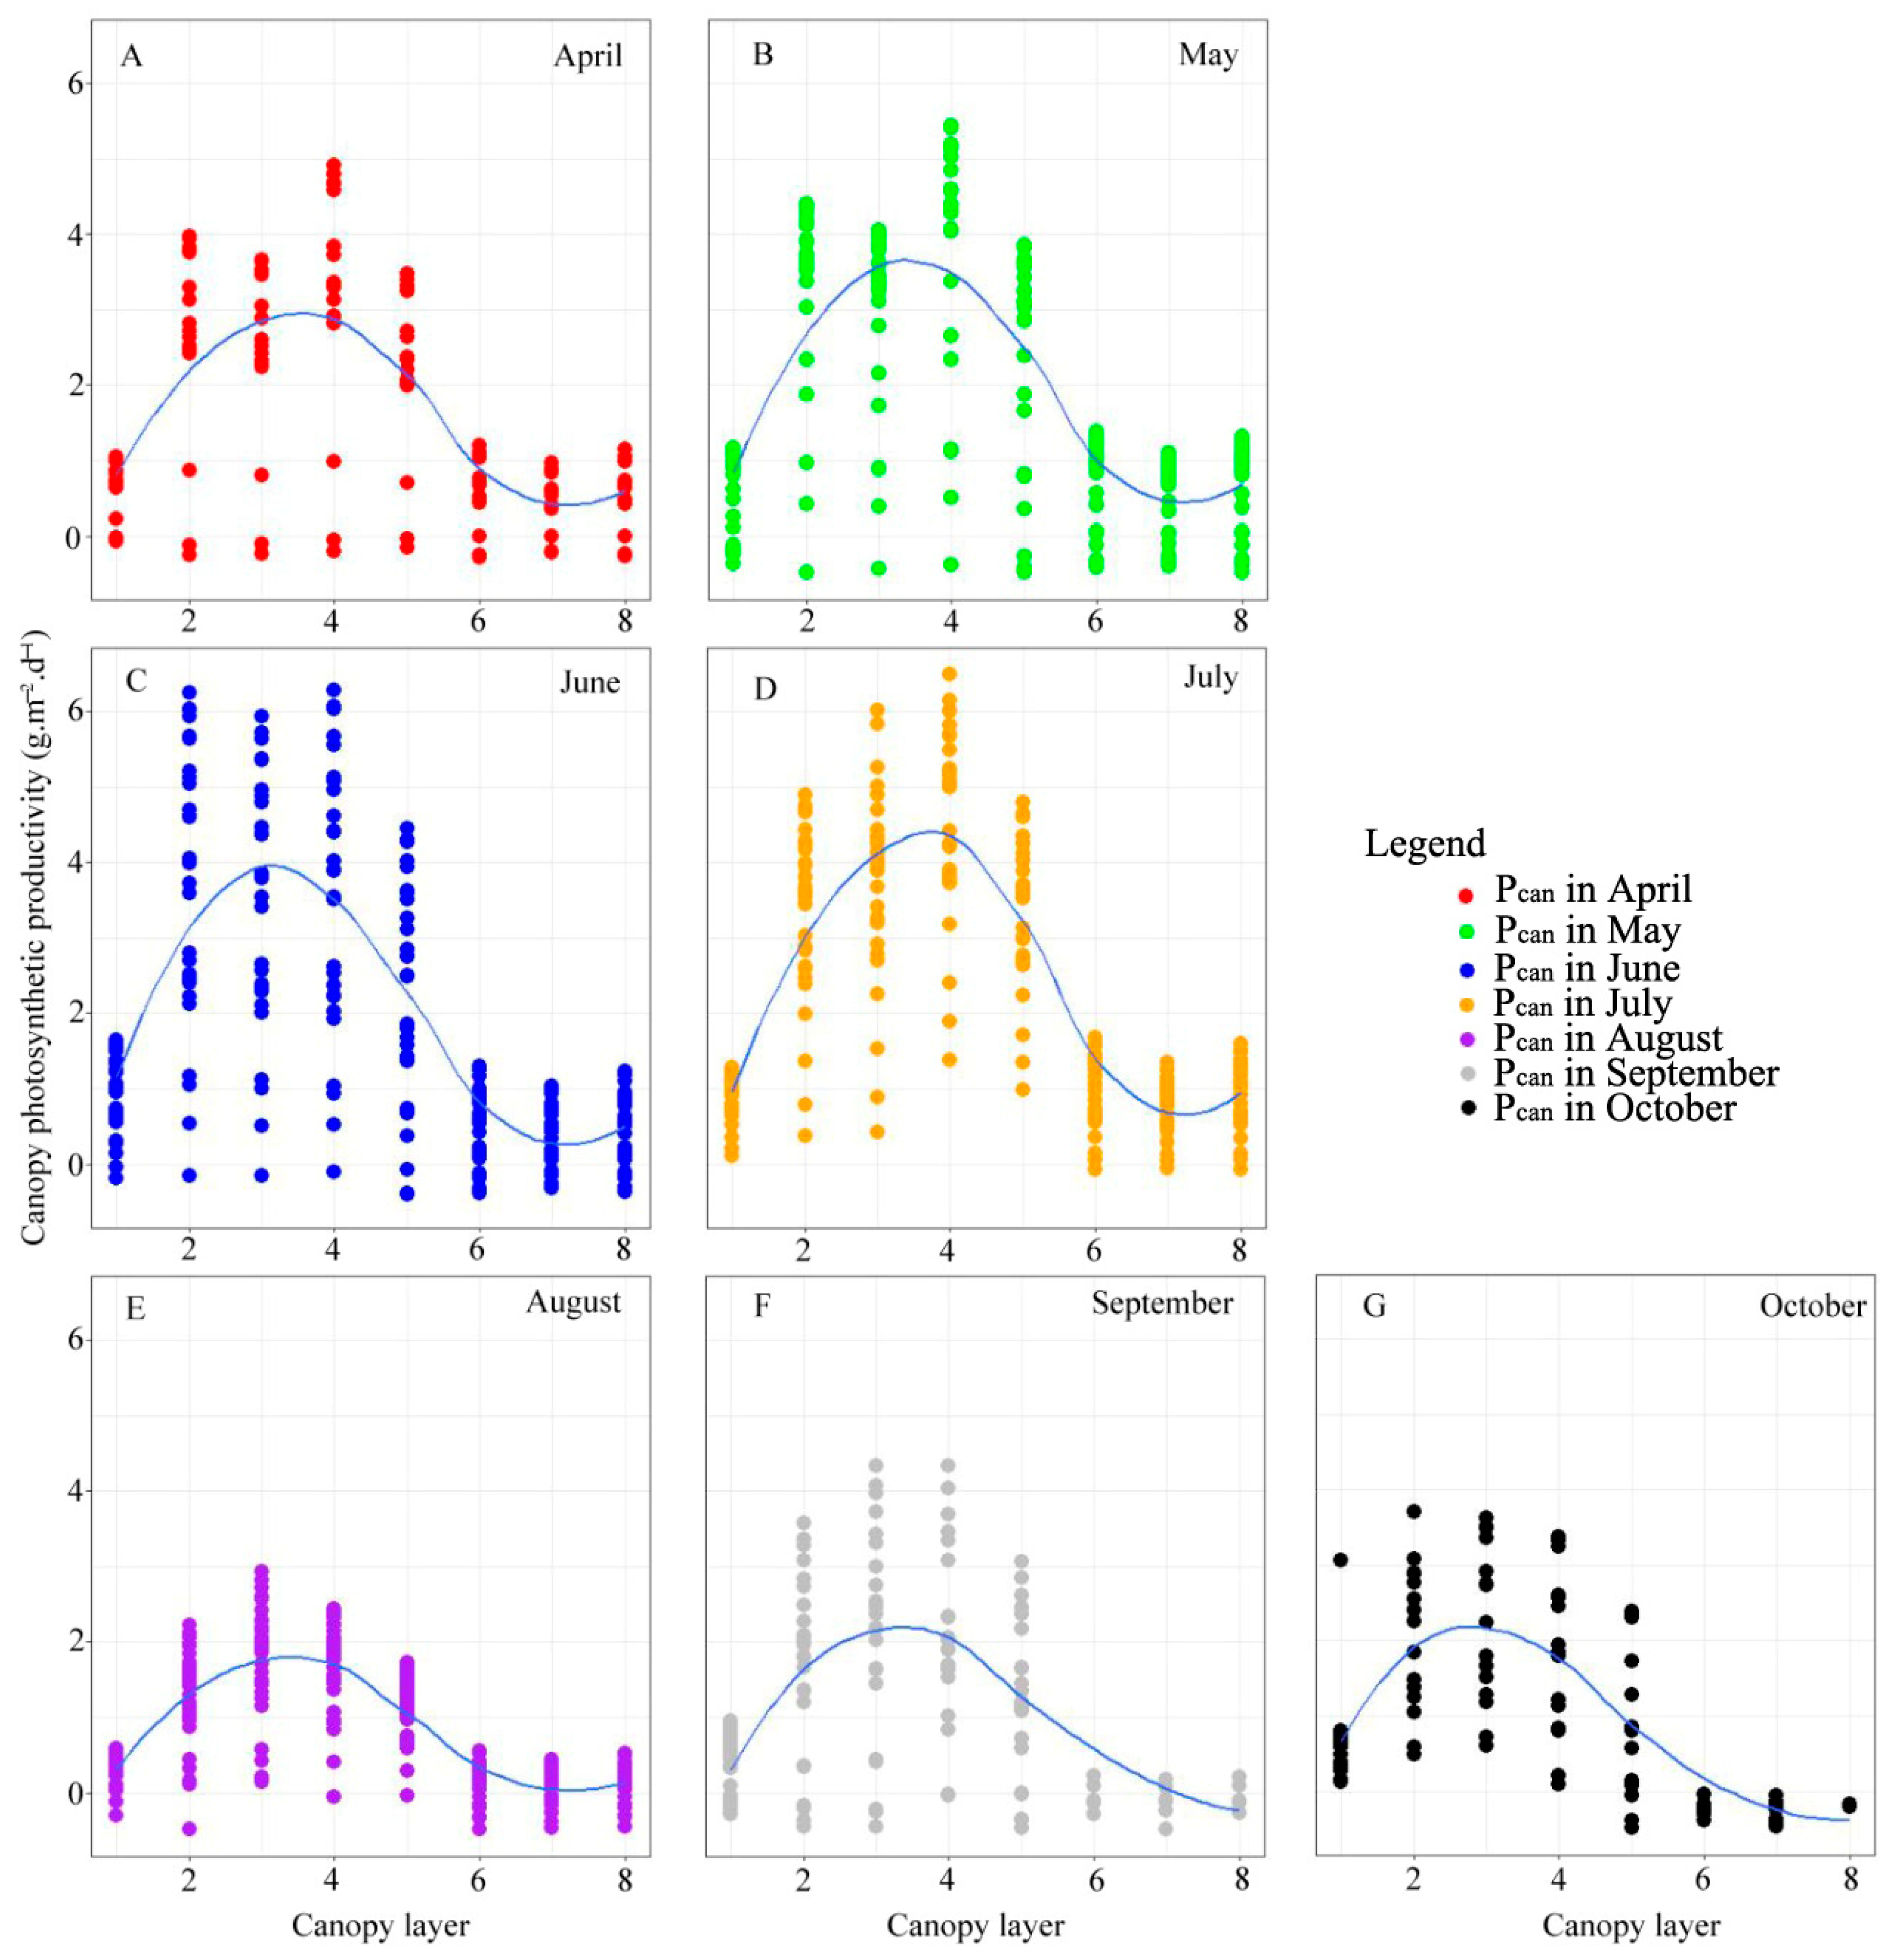
3.3. Vertical Profiles of Canopy Photosynthesis Productivity during the Growing Season

The findings indicated a pattern in canopy photosynthetic productivity concerning height. As the canopy height increased, productivity initially rose, reaching its peak in the third or fourth layer of the canopy. Subsequently, it declined, reaching its lowest point in the seventh layer. However, there was a slight increase in productivity again in the eighth layer (Figure 5). In April, May, and June, canopy photosynthetic productivity was the highest in the fourth layer, followed by the second and third layers. In July and September, it was in the following order: fourth > third > second. In October, it was in the following order: second > third > fourth and seventh > eighth. Furthermore, canopy photosynthetic productivity was highest in June and July, and lowest in August.

3.4. Effect of Leaf Area on Photosynthetic Productivity

The total leaf area and photosynthetic productivity of the canopy were 10.7 m2, and 919.6 mg C·h−1, respectively (Figure 6). The leaf area first increased and then decreased as height in the canopy increased. It reached a maximum value at a height in the canopy from 48% to 59% (approximately 2.74 m2), accounting for 25.6% of the whole canopy. Photosynthesis productivity reached a maximum at the same depth (about 266.5 mg C·h−1 (28.9%)). When the height in the canopy was 59–69%, the leaf area was 18.1%, and the photosynthesis productivity was 14.6% of the canopy.

3.5. Effect of Canopy Layer on Photosynthetic Productivity

The canopy layer was significantly correlated with photosynthetic productivity (p < 0.001). The results showed that canopy productivity showed a lower state in the high space (88%–100%) with sufficient sunlight (Table 4). Extensive gaps between trees, resulting in less shading of shaded parts of the canopy (25%–38%, 50%–63%, and 63%–75%) in sunlight (75%–88%, 88%–100%), the coverage space of the upper layer of the canopy is smaller, increasing the shadow area of the lower space.

4. Discussion

4.1. Response of Photosynthetic Productivity of Larch to Canopy Spatial Structure Pattern

The maximum photosynthetic rate and net photosynthetic rate of the samples in this study decreased significantly with increasing canopy layers, due to the sufficient light environment in the upper layer (70%–100%), and the decreased light levels in the lower layers (1%–30%). This pattern has also been observed in other tree species [40,41]. In addition, alterations in leaf and stomatal conductance are crucial in influencing the vertical variations in the maximum photosynthetic rate [42]. The reasons for the above phenomena are maybe that the distribution of L. kaempferi forest is sparse, where all leaves in the canopy grow in a sufficient light environment, while the sample is in densely populated forests, and the light pressure in the middle and lower canopy layers is relatively high.
Canopy net photosynthetic rate and stomatal conductivity had significant threshold responses to increasing VPD, consistent with other tree species [43,44]. When VPD exceeded a certain threshold, the net photosynthetic rate and stomatal conductivity decreased with increasing VPD. The main mechanism of the decrease in gs in response to an increase in VPD is the hydraulic one—i.e., either passive hydraulic mechanism or abscisic acid-mediated [45]. In addition, the interplay between net photosynthetic rate, stomatal conductance, and vapor pressure deficit (VPD) is further influenced by leaf water potential and hydraulic conductivity [46]. In this study, the optimal threshold of VPD for the net photosynthetic rate and stomatal conductivity increased with increasing the canopy layer. This is mainly due to differences in the canopy microenvironments and leaf physiological parameters [43,46]. In addition, differences in the optimal threshold of VPD for photosynthesis in the canopy may reflect different strategies trees use to maximize photosynthetic capacity under specific environmental conditions [47].

4.2. Response of Physiological Parameters of Larch to Canopy Spatial Structure Pattern

It has been observed that there is an exponential decline in light transmission as plant canopy height increases [48,49,50]. This effect is particularly prominent within the canopy height range of 38% to 88%, as these areas exhibit a higher leaf area density than other regions. This phenomenon has substantial implications for light intensity, leaf development, morphology, energy balance, and water-use efficiency, resulting in alterations in leaf physiology and canopy structural parameters [51]. In addition, different leaves and stems have different functional capabilities. Tree species with superior physiological characteristics, larger leaf area, and higher chlorophyll and nitrogen content [52]. Specifically, the reduction of plant morphology (reduced leaf size and stem length, leaf length/width, and vegetative growth) and chlorophyll content causes a reduction of physiological traits (reduction of photosynthesis, leaf water potential, and sap movement) [52]. The physiological explanation for this phenomenon is attributed to a decrease in leaf photosynthesis and an increase in leaf chlorophyll content. Therefore, plants in areas with high leaf area density require more photosynthesis to sustain growth and development, which may negatively impact plant growth and productivity [53].
From the results, we can try to analyze the reasons why the vertical structure of the canopy affects the photosynthetic parameters from a physiological point of view. That leaves of different canopy layers and ages received different light intensities simultaneously [54]. The canopy microenvironment has spatial heterogeneity, and the long-term adaptation of leaves to the microenvironment changes the optimal environmental factors for photosynthesis [8,21].

4.3. Correlation between Canopy Spatial Distribution and Photosynthetic Productivity

According to the spatial distribution characteristics of specific leaf area, leaf volume distribution, and light energy distribution, a more reasonable distribution pattern of leaf quantity and light energy can maximize photosynthetic productivity [49,55,56]. We emphasize the importance of considering the development of the three-dimensional structure of forest canopies in ecosystem management plans and afforestation programs to increase the productivity of planted forest ecosystems [53,56,57]. Studies have shown that a larger growth coefficient for a specific leaf area leads to seasonal changes in specific leaf areas [58]. Canopy photosynthesis models are used for estimation, considering light interception by non-photosynthetic organs and analyzing the correlation between vertical trends, seasonal variation, and environmental and forest stand factors [19].
Optimizing the spatial distribution of the canopy can increase canopy photosynthetic productivity, thereby increasing the potential for tree production [53,59]. Tree distribution is a key factor that affects tree photosynthetic productivity, yield, and quality [23]. Although increasing temperatures and extended growing seasons can help improve the photosynthetic productivity of forest ecosystems, the interaction between climate change, phenology, and canopy carbon dynamics is a future research direction [60]. Light availability significantly affects the photosynthetic capacity of these species [61]. In addition, for the characteristics of the light distribution in different parts of the canopy and the physiological characteristics of leaves, the canopy height is closely related to the overall light availability of the entire canopy. Appropriate canopy height can increase the amount of light in the lower part of the canopy, increase photosynthetic productivity, and increase leaf photosynthetic activity and specific leaf weight [62]. Therefore, through scientific management, specific leaf areas can reach optimal conditions in the morning, reducing light loss and enhancing photosynthetic capacity [51,63].

4.4. Forestry Management Methods to Improve Forest Productivity

According to Li et al. [64], the canopy can be divided into functional and non-functional layers based on the vertical distribution characteristics of leaf biomass and stem cross-sectional area growth. The functional layer refers to the layer with a larger stem cross-sectional area and the highest leaf density, while the other layers are non-functional. Based on the contribution of canopy photosynthetic productivity to total production instead of stem cross-sectional area growth, as well as the contribution of leaf area and net primary productivity (NPP) to the total, the height of the “functional layer” is determined. When the contribution of leaf area to total photosynthetic productivity is equal to the same height NPP, the canopy and its upper part are defined as the “functional layer”. In contrast, the lower part of the canopy is defined as the “non-functional layer” or canopy.
In this study, the artificially optimizing forest productivity determines the contribution of canopy leaf area to canopy and productivity at 14.6% and 18.1%, respectively, at 61% to 71% height. Therefore, the canopy and above should be classified as the “functional layer,” with the upper 2/3 of the canopy as the “functional layer” and the lower 1/3 as the “non-functional layer,” providing theoretical guidance for artificial operation and the L. kaempferi directional cultivation management pruning technology.

5. Conclusions

Our research aimed to enhance canopy photosynthetic productivity by focusing on canopy spatial distribution through effective management methods. By implementing scientific management practices, we were able to optimize the specific leaf area, minimize light loss, and enhance overall photosynthetic capacity. Our findings suggest that management strategies, such as timely manual trimming in densely grown forests without gaps can eliminate the lower canopy, which exhibits low photosynthetic productivity and high resource consumption. This approach helps reduce the loss of photosynthetic productivity in “non-functional canopy areas”. These measures should be implemented to improve the photosynthetic productivity of L. kaempferi. Our study provides a technical approach to enhance plantation productivity and is a valuable reference for regulating canopy structure in larch plantations.

Supplementary Materials

The following supporting information can be downloaded at: https://www.mdpi.com/article/10.3390/f14061171/s1, Figure S1: Natural distribution of Larix kaempfer.

Author Contributions

C.W. conceived the study and wrote the manuscript. D.C. and G.X. conceived and designed the experiment, X.S. and S.Z. revised and commented on the manuscript. All authors have read and agreed to the published version of the manuscript.

Funding

This research was funded by National Natural Science Foundation of China (32001308), and National Natural Science Foundation of China (General Program) (31971652), Fundamental Research Funds of CAF (CAFYBB2022ZA00103), Fundamental Research Funds of CAF (CAFYBB2022ZC001).

Data Availability Statement

The data is available on request from the corresponding author.

Acknowledgments

We thank all the researchers who made their data available for this study.

Conflicts of Interest

The authors declare that the research was conducted without any commercial or financial relationships that could be construed as a potential conflict of interest.

Abbreviations

LRCphotosynthetic light-response
L. kaempferiLarix kaempferi (Lamb.) Carr
PARphotosynthetically active radiation
NRHNonrectangle hyperbola model
MRHModified rectangle hyperbola model
MMModigliani Miller model
Pnnet photosynthesis rate
Pmaxthe maximum Pn
AQYapparent quantum yield
Rddark respiration
R2the coefficient of determination
MEmean error
MREmean relative error
RMSEmean squared error
RRMSErelative mean squared error
SLAspecific leaf area
Wdrydry weight
Sthe conical projection area
Pcancanopy photosynthesic productivity
Pdaydaily canopy photosynthesic productivity
LAthe leaf area
Taair temperature
Ciintercellular CO2 concentration
Caatmospheric CO2 concentration
Lsstomatal limit value
gsstomatal conductance
VPDvapor pressure deficit
Tairair temperature
NPPnet primary productivity

References

  1. Badgley, G.; Field, C.B.; Berry, J.A. Canopy near-infrared reflectance and terrestrial photosynthesis. Sci. Adv. 2017, 3, e1602244. [Google Scholar] [CrossRef] [Green Version]
  2. Bar-Even, A. Daring metabolic designs for enhanced plant carbon fixation. Plant Sci. 2018, 273, 71–83. [Google Scholar] [CrossRef]
  3. Smith, W.K.; Bell, D.T.; Shepherd, K.A. Associations between leaf structure, orientation, and sunlight exposure in five Western Australian communities. Am. J. Bot. 1998, 85, 56–63. [Google Scholar] [CrossRef]
  4. Lowman, M.D.; Schowalter, T.D. Plant science in forest canopies—The first 30 years of advances and challenges (1980–2010). New Phytol. 2012, 194, 12–27. [Google Scholar] [CrossRef]
  5. Slot, M.; Winter, K. In situ temperature response of photosynthesis of 42 tree and liana species in the canopy of two Panamanian lowland tropical forests with contrasting rainfall regimes. New Phytol. 2017, 214, 1103–1117. [Google Scholar] [CrossRef] [Green Version]
  6. Meir, P.; Mencuccini, M.; Binks, O.; Da Costa, A.L.; Ferreira, L.; Rowland, L. Short-term effects of drought on tropical forest do not fully predict impacts of repeated or long-term drought: Gas exchange versus growth. Philos. Trans. R. Soc. B Biol. Sci. 2018, 373, 20170311. [Google Scholar] [CrossRef] [Green Version]
  7. Kira, T.; Shinozaki, K.; Hozumi, K. Structure of forest canopies as related to their primary productivity1. Plant Cell Physiol. 1969, 10, 129–142. [Google Scholar] [CrossRef]
  8. Kurachi, N.; Hagihara, A.; Hozumi, K. Evaluation of the light interception by non-photosynthetic organs in a Larix leptolepis plantation. Ecol. Res. 1986, 1, 173–183. [Google Scholar] [CrossRef]
  9. Parker, G.G. Structure and microclimate of forest canopies. For. Canopies 1995, 73–106. [Google Scholar]
  10. Kurachi, N.; Hagihara, A.; Hozumi, K. Canopy photosynthetic production in a Japanese larch stand. I. Seasonal and vertical changes of leaf characteristics along the light gradient in a canopy. Ecol. Res. 1992, 7, 255–265. [Google Scholar] [CrossRef]
  11. Ren, Y.; Zhang, C.; Zuo, S.; Li, Z. Scaling up of biomass simulation for Eucalyptus plantations based on landsenses ecology. Int. J. Sustain. Dev. World Ecol. 2017, 242, 135–148. [Google Scholar] [CrossRef]
  12. Fien, E.K.; Fraver, S.; Teets, A.; Weiskittel, A.R.; Hollinger, D.Y. Drivers of individual tree growth and mortality in an uneven-aged, mixed-species conifer forest. For. Ecol. Manag. 2019, 449, 117446. [Google Scholar] [CrossRef]
  13. Denison, W.C.; Tracy, D.M.; Rhoades, F.M.; Sherwood, M. Direct, non-destructive measurement of biomass and structure in living old-growth Douglas-fir. In Proceedings from Research on Coniferous Forest Ecosystems—A Symposium, Bellingham, Washington; U.S. Department of Agriculture, Forest Service, Pacific Northwest Forest and Range Experiment Station: Portland, OR, USA, 1972; pp. 23–24. [Google Scholar]
  14. Ishii, H.T.; Tanabe, S.I.; Hiura, T. Exploring the relationships among canopy structure, stand productivity, and biodiversity of temperate forest ecosystems. For. Sci. 2004, 50, 342–355. [Google Scholar]
  15. Wang, N.; Palmroth, S.; Maier, C.A.; Domec, J.; Oren, R. Anatomical changes with needle length are correlated with leaf structural and physiological traits across five Pinus species. Plant Cell Environ. 2019, 42, 1690–1704. [Google Scholar] [CrossRef]
  16. Yang, X.; Tang, J.; Mustard, J.F.; Lee, J.-E.; Rossini, M.; Joiner, J.; Munger, J.W.; Kornfeld, A.; Richardson, A.D. Solar-induced chlorophyll fluorescence that correlates with canopy photosynthesis on diurnal and seasonal scales in a temperate deciduous forest. Geophys. Res. Lett. 2015, 42, 2977–2987. [Google Scholar] [CrossRef]
  17. Takala, T.L.; Mõttus, M. Spatial variation of canopy PRI with shadow fraction caused by leaf-level irradiation conditions. Remote Sens. Environ. 2016, 182, 99–112. [Google Scholar] [CrossRef]
  18. Atherton, J.; Olascoaga, B.; Alonso, L.; Porcar-Castell, A. Spatial Variation of Leaf Optical Properties in a Boreal Forest Is Influenced by Species and Light Environment. Front. Plant Sci. 2017, 8, 309. [Google Scholar] [CrossRef] [Green Version]
  19. Kurachi, N.; Hagihara, A.; Hozumi, K. Canopy photosynthetic production in a Japanese larch stand. I. Estimation of the canopy photosynthetic production. Ecol. Res. 1993, 8, 349–361. [Google Scholar] [CrossRef]
  20. Ryan, M.G.; Binkley, D.; Fownes, J.H. Age-Related Decline in Forest Productivity: Pattern and Process. Adv. Ecol. Res. 1997, 27, 213–262. [Google Scholar] [CrossRef]
  21. Oren, R.; Schulze, E.-D.; Matyssek, R.; Zimmermann, R. Estimating photosynthetic rate and annual carbon gain in conifers from specific leaf weight and leaf biomass. Oecologia 1986, 70, 187–193. [Google Scholar] [CrossRef]
  22. Bosc, A.; De Grandcourt, A.; Loustau, D. Variability of stem and branch maintenance respiration in a Pinus pinaster tree. Tree Physiol. 2003, 23, 227–236. [Google Scholar] [CrossRef] [PubMed] [Green Version]
  23. Feng, G.; Luo, H.; Zhang, Y.; Gou, L.; Yao, Y.; Lin, Y.; Zhang, W. Relationship between plant canopy characteristics and photosynthetic productivity in diverse cultivars of cotton (Gossypium hirsutum L.). Crop J. 2016, 4, 499–508. [Google Scholar] [CrossRef] [Green Version]
  24. Cavaleri, M.A.; Coble, A.P.; Ryan, M.G.; Bauerle, W.L.; Loescher, H.W.; Oberbauer, S.F. Tropical rainforest carbon sink declines during El Niño as a result of reduced photosynthesis and increased respiration rates. New Phytol. 2017, 216, 136–149. [Google Scholar] [CrossRef] [PubMed] [Green Version]
  25. Azuma, W.; Ishii, H.R.; Masaki, T. Height-related variations of leaf traits reflect strategies for maintaining photosynthetic and hydraulic homeostasis in mature and old Pinus densiflora trees. Oecologia 2019, 189, 317–328. [Google Scholar] [CrossRef]
  26. Legner, N.; Fleck, S.; Leuschner, C. Within-canopy variation in photosynthetic capacity, SLA and foliar N in temperate broad-leaved trees with contrasting shade tolerance. Trees 2014, 28, 263–280. [Google Scholar] [CrossRef]
  27. Cáceres, C.B.; Hernández, R.E.; Fortin, Y. Shrinkage variation in Japanese larch (Larix kaempferi (Lamb.) Carr.) progenies/provenances trials in Eastern Canada. Wood Mater. Sci. Eng. 2017, 13, 1–7. [Google Scholar] [CrossRef] [Green Version]
  28. Shao, X.W. Study on the ecological survey of Larix kaempferi. Shandong For. Sci. Technol. 1985, 1, 9–18. (In Chinese) [Google Scholar]
  29. Pâque, L.E. Improvement of Larch (Larix sp.) for Better Growth, Stem form and Wood Quality: Proceedings of an International Symposium; INRA: Orleans, France, 2002. [Google Scholar]
  30. Hoshi, H. Forest tree genetic resources conservation stands of Japanese larch (Larix kaempferi (Lamb.) Carr.). For. Tree Gen. Res. Inf. 2004, 1, 1–4. [Google Scholar]
  31. Bhusal, N.; Lee, M.; Han, A.R.; Han, A.; Kim, H.S. Responses to drought stress in Prunus sargentii and Larix kaempferi seedlings using morphological and physiological parameters. For. Ecol. Manag. 2020, 465, 118099. [Google Scholar] [CrossRef]
  32. Mueller, P.; Jensen, K.; Megonigal, J.P. Plants mediate soil organic matter decomposition in response to sea level rise. Glob. Chang. Biol. 2016, 22, 404–414. [Google Scholar] [CrossRef]
  33. Xia, G.W.; Chen, D.S.; Sun, X.M.; Zhang, S.G. Spatial heterogeneity of photosynthetic and physiological parameters in Larix kaempferi crown. For. Res. 2018, 31, 130–137. (In Chinese) [Google Scholar]
  34. Monsi, M.; Saeki, T. The light factor in plant communities and its significance for dry matter production. Jpn. J. Bot. 1953, 14, 22–52. [Google Scholar]
  35. Bassman, J.H.; Zwier, J.C. Gas exchange characteristics of Populus trichocarpa, Populus deltoides and Populus trichocarpa × P. deltoides clones. Tree Physiol. 1991, 8, 145–159. [Google Scholar] [CrossRef] [PubMed]
  36. Liu, Q.; Dong, L.H.; Li, F.R. Modeling net CO2 assimilation (AN) within the crown of young planted Larix olgensis trees. Can. J. For. Res. 2018, 48, 1085–1098. [Google Scholar] [CrossRef] [Green Version]
  37. Thornley, J.H.M. Mathematical Models in Plant Physiology; Academic Press: London, UK; New York, NY, USA, 1976; pp. 108–110. [Google Scholar]
  38. Boonen, C.; Samson, R.; Janssens, K.; Pien, H.; Lemeur, R.; Berckmans, D. Scaling the spatial distribution of photosynthesis from leaf to canopy in a plant growth chamber. Ecol. Model. 2002, 156, 201–212. [Google Scholar] [CrossRef]
  39. R Core Team. R: A Language and Environment for Statistical Computing; R Foundation for Statistical Computing: Vienna, Austria, 2017; Available online: http://www.R-project.org/ (accessed on 25 June 2021).
  40. Escalona, J.M.; Bota, J.; Medrano, H. Distribution of leaf photosynthesis and transpiration within grapevine canopies under different drought conditions. VITIS-J. Grapevine Res. 2015, 42, 57. [Google Scholar] [CrossRef]
  41. Walker, B.J.; Drewry, D.T.; Slattery, R.A.; VanLoocke, A.; Cho, Y.B.; Ort, D.R. Chlorophyll Can Be Reduced in Crop Canopies with Little Penalty to Photosynthesis. Plant Physiol. 2018, 176, 1215–1232. [Google Scholar] [CrossRef] [Green Version]
  42. Fukuda, A.; Kondo, K.; Ikka, T.; Takai, T.; Tanabata, T.; Yamamoto, T. A novel QTL associated with rice canopy temperature difference affects stomatal conductance and leaf photosynthesis. Breed. Sci. 2018, 68, 305–315. [Google Scholar] [CrossRef] [Green Version]
  43. Peters, J.; Morales, D. Gas exchange characteristics of Pinus canariensis needles in a forest stand on Tenerife, Canary Islands. Trees 2003, 17, 492–500. [Google Scholar] [CrossRef]
  44. Fuchs, M.; Stanghellini, C. The functional dependence of canopy conductance on water vapor pressure deficit revisited. Int. J. Biometeorol. 2018, 62, 1211–1220. [Google Scholar] [CrossRef]
  45. Shirke, P.A.; Pathre, U.V. Influence of leaf-to-air vapour pressure deficit (VPD) on the biochemistry and physiology of photosynthesis in Prosopis juliflora. J. Exp. Bot. 2004, 55, 2111–2120. [Google Scholar] [CrossRef]
  46. Shibuya, T.; Kano, K.; Endo, R.; Kitaya, Y. Effects of the interaction between vapor-pressure deficit and salinity on growth and photosynthesis of Cucumis sativus seedlings under different CO2 concentrations. Photosynthetica 2018, 56, 893–900. [Google Scholar] [CrossRef]
  47. Cunningham, S. Photosynthetic responses to vapour pressure deficit in temperate and tropical evergreen rainforest trees of Australia. Oecologia 2005, 142, 521–528. [Google Scholar] [CrossRef] [PubMed]
  48. Song, Q.; Zhang, G.; Zhu, X.G. Optimal crop canopy architecture to maximize canopy photosynthetic CO2 uptake under elevated CO2—A theoretical study using a mechanistic model of canopy photosynthesis. Funct. Plant Biol. 2013, 40, 108–124. [Google Scholar] [CrossRef] [PubMed] [Green Version]
  49. Song, Y.; Ryu, Y. Seasonal changes in vertical canopy structure in a temperate broadleaved forest in Korea. Ecol. Res. 2015, 30, 821–831. [Google Scholar] [CrossRef]
  50. Dusenge, M.E.; Duarte, A.G.; Way, D.A. Plant carbon metabolism and climate change: Elevated CO2 and temperature impacts on photosynthesis, photorespiration and respiration. New Phytol. 2019, 221, 32–49. [Google Scholar] [CrossRef] [Green Version]
  51. Šimpraga, M.; Verbeeck, H.; Bloemen, J.; Vanhaecke, L.; Demarcke, M.; Joó, E.; Pokorska, O.; Amelynck, C.; Schoon, N.; Dewulf, J.; et al. Vertical canopy gradient in photosynthesis and monoterpenoid emissions: An insight into the chemistry and physiology behind. Atmos. Environ. 2013, 80, 85–95. [Google Scholar] [CrossRef]
  52. Bhusal, N.; Bhusal, S.J.; Yoon, T.-M. Comparisons of physiological and anatomical characteristics between two cultivars in bi-leader apple trees (Malus × domestica Borkh.). Sci. Hortic. 2018, 231, 73–81. [Google Scholar] [CrossRef]
  53. Kenzo, T.; Inoue, Y.; Yoshimura, M.; Yamashita, M.; Tanaka-Oda, A.; Ichie, T. Height-related changes in leaf photosynthetic traits in diverse Bornean tropical rain forest trees. Oecologia 2015, 177, 191–202. [Google Scholar] [CrossRef]
  54. Kaiser, E.; Matsubara, S.; Harbinson, J.; Heuvelink, E.; Marcelis, L.F. Acclimation of photosynthesis to light flecks in tomato leaves: Interaction with progressive shading in a growing canopy. Physiol. Plant 2018, 162, 506–517. [Google Scholar] [CrossRef] [Green Version]
  55. Qu, L.Y.; Ji, D.H.; Shi, F.C.; Kaichiro, S.; Takayoshi, K. Growth and photosynthetic performance of seedlings of two larch species grown in shaded conditions. Eurasian J. For. Res. 2005, 8, 43–51. [Google Scholar]
  56. Elferjani, R.; DesRochers, A.; Tremblay, F. Plasticity of bud phenology and photosynthetic capacity in hybrid poplar plantations along a latitudinal gradient in northeastern Canada. Environ. Exp. Bot. 2016, 125, 67–76. [Google Scholar] [CrossRef]
  57. Niinemets, Ü. A review of light interception in plant stands from leaf to canopy in different plant functional types and in species with varying shade tolerance. Ecol. Res. 2010, 25, 693–714. [Google Scholar] [CrossRef]
  58. Xu, C.L.; Sun, X.M.; Zhang, S.G. Comparative analysis on photosynthetic productivity of Larix kaempferi, L. olgensis and their hybrids. J. Northwest For. Univ. 2012, 27, 129–133. (In Chinese) [Google Scholar]
  59. Wright, I.J.; Cooke, J.; Cernusak, L.A.; Hutley, L.B.; Scalon, M.C.; Tozer, W.C.; Lehmann, C.E. Stem diameter growth rates in a fire-prone savanna correlate with photosynthetic rate and branch-scale biomass allocation, but not specific leaf area. Austral Ecol. 2019, 44, 339–350. [Google Scholar] [CrossRef]
  60. Xue, W.; Lindner, S.; Dubbert, M.; Otieno, D.; Ko, J.; Muraoka, H.; Werner, C.; Tenhunen, J. Supplement understanding of the relative importance of biophysical factors in determination of photosynthetic capacity and photosynthetic productivity in rice ecosystems. Agric. For. Meteorol. 2017, 232, 550–565. [Google Scholar] [CrossRef]
  61. Hirtreiter, J.N.; Potts, D.L. Canopy structure, photosynthetic capacity and nitrogen distribution in adjacent mixed and monospecific stands of Phragmites australis and Typha latifolia. Plant Ecol. 2012, 213, 821–829. [Google Scholar] [CrossRef]
  62. Bhusal, N.; Han, S.-G.; Yoon, T.-M. Summer pruning and reflective film enhance fruit quality in excessively tall spindle apple trees. Hortic. Environ. Biotechnol. 2017, 58, 560–567. [Google Scholar] [CrossRef]
  63. Cao, N.; Yu, H.Q.; Wang, S.B.; Yu, T.; Cao, M.J. Analysis on canopy structure and photosynthetic characteristics of high yield maize population. J. Maize Sci. 2006, 14, 94–97. (In Chinese) [Google Scholar] [CrossRef]
  64. Li, F.R.; Wang, Z.F.; Wang, B.S. Studies on the effective crown development of Larix olgensis (I)-determination of the effective crown. J. Northeast For. Univ. 1996, 24, 1–8. (In Chinese) [Google Scholar]
Figure 1. Research site location and seasonal changes in mean air temperature and precipitation from January 2014 to December 2015.
Forests 14 01171 g001
Figure 2. Distribution of photosynthesis measurement positions in canopy of Larix kaempferi.
Forests 14 01171 g002
Figure 3. Spatial variation of photosynthetic parameters and micro-environmental factors of Larix kaempferi.
Forests 14 01171 g003
Figure 4. The relationship between net photosynthetic rate (Pn) and specific leaf area (SLA), vapor pressure deficit (VPD), and air temperature (Ta) (AC); the relationship between stomatal conductance (gs) and SLA, VPD, and Ta (DF); the relationship between stomatal restriction value (Ls) and SLA, VPD, and Ta (GI). The red dot is net photosynthetic rate (Pn), orange dot is stomatal conductance (gs), and green dot is stomatal restriction value (Ls), respectively.
Forests 14 01171 g004
Figure 5. Vertical gradient difference in different month (seasons) of canopy photosynthesis productivity.
Forests 14 01171 g005
Figure 6. Spatial distribution in leaf area and net primary productivity of Larix kaempferi.
Forests 14 01171 g006
Table 1. Summary of characteristics in the investigated Larix kaempferi plantations.
Age (a)SlopeDensity (Trees·hm−2)Height (m)DBH (cm)Canopy Width (m)Canopy Length (m)
3South44004.3 ± 0.12 *4.4 ± 0.37 *1.4 ± 0.03 *4.0 ± 0.16 *
8Southwest370010.0 ± 0.18 *7.5 ± 0.03 *2.3 ± 0.04 *5.9 ± 0.21 *
20West216016.1 ± 0.14 *13.5 ± 0.20 *2.8 ± 0.04 *6.4 ± 0.11 *
Note: DBH: Diameter at breast height, * means p < 0.01.
Table 2. Summary of soil nutrient and stoichiometry ratio in the investigated Larix kaempferi plantations.
Stand Age/(a)Soil Depth/(cm)C/(mg·g−1)N/(mg·g−1)P/(mg·g−1)C:NC:PN:P
30~1019.53 ± 4.731.28 ± 0.420.58 ± 0.09 *15.90 ± 1.79 *32.79 ± 3.84 *2.10 ± 0.40 *
10~2017.92 ± 4.79 *1.24 ± 0.39 *0.55 ± 0.09 *15.47 ± 0.78 *30.12 ± 3.46 *2.03 ± 0.33 *
20~4014.37 ± 6.130.98 ± 0.47 *0.52 ± 0.12 *15.47 ± 1.11 *24.87 ± 5.45 *1.66 ± 0.48 *
80~1018.16 ± 3.711.68 ± 0.420.6 ± 0.050 *11.16 ± 0.69 *29.48 ± 4.39 *2.72 ± 0.57
10~2016.19 ± 3.87 *1.58 ± 0.46 *0.64 ± 0.09 *10.65 ± 0.70 *23.18 ± 2.41 *2.23 ± 0.38 *
20~4014.25 ± 6.54 *1.18 ± 0.56 *0.57 ± 0.12 *13.03 ± 0.14 *22.49 ± 6.13 *1.81 ± 0.53 *
200~1018.93 ± 3.98 *1.57 ± 0.49 *0.72 ± 0.1012.67 ± 2.04 *25.74 ± 2.21 *2.10 ± 0.42 *
10~2016.58 ± 3.71 *1.62 ± 0.530.64 ± 0.08 *10.50 ± 1.5424.08 ± 2.50 *2.33 ± 0.49 *
20~4014.91 ± 6.601.23 ± 0.580.60 ± 0.14 *13.50 ± 0.56 *22.29 ± 5.191.78 ± 0.46 *
Note: * means p < 0.01.
Table 3. Parameters summary of all the photosynthetic light-response curves (LRCs), leaf traits, and environmental conditions in 2014–2015.
Canopy LayerTop2nd3rd4th5th6th7thBottomTotal
Pn−0.101 *0.5361 * 1.2121 *1.7211 *2.7521 *3.5171 *4.8541 *7.7661 *2.7821 *
gs0.0261 *0.0411 *0.0481 *0.0471 *0.0701 *0.0961 *0.1261 *0.1731 *0.0781 *
Tr0.631 *1.067 * 1.290 *1.295 *1.980 *2.555 *3.137 * 3.698 *1.957 *
Ci367.200 * 351.800 * 326.000 * 301.700 * 291.900 * 297.800 *284.500 * 272.000 * 289.200 *
Ls0.03400 *0.07300 *0.12100 *0.18100 *0.20000 *0.18600 *0.20800 *0.22100 *0.15300 *
SLA80.1990 * 95.3980 *102.415 *87.9305 *74.2485 *76.5025 * 69.6535 *62.1725 *81.0655 *
Ta28.6295 * 29.335 * 29.622 * 30.271 * 30.889 *30.941 *30.728 *29.355 *29.971 *
VPD2.1521 *2.2211 *2.2651 *2.3901 *2.5201 *2.4421 *2.3201 *2.0681 *2.2971 *
PAR18.485 *64.460 * 213.167 *224.682 *410.627 * 448.559 *784.654 * 836.806 * 375.180 *
Note: Pn refers to net photosynthetic rate, gs refers to stomatal conductance, Tr refers to transpiration rate, Ci refers to intercellular CO2 concentration, Ls refers to stomatal restriction value, SLA refers to specific leaf area, Ta refers to air temperature, and PAR refers to Photosynthetically active radiation. Mean, Std., Max., and Min. represent the mean value, standard deviation, maximum value, and minimum value, respectively, * means p < 0.01.
Table 4. The fitting result of the nonlinear mixed model for the relationship between canopy spatial structure and its photosynthetic productivity.
Canopy LayerParameterp-ValuePseudo-R2
abc
10.1200.8910.4520.070.28
20.3410.7340.3710.240.13
30.7150.2050.518<0.050.36
40.0930.8100.4180.180.21
50.5480.3360.425<0.010.41
60.6390.2670.481<0.010.47
70.2570.6090.3750.050.31
80.3640.5780.3060.110.24
Disclaimer/Publisher’s Note: The statements, opinions and data contained in all publications are solely those of the individual author(s) and contributor(s) and not of MDPI and/or the editor(s). MDPI and/or the editor(s) disclaim responsibility for any injury to people or property resulting from any ideas, methods, instructions or products referred to in the content.

