Article

Pan-Transcriptome Analysis of Willow Species from Diverse Geographic Distributions

State Key Laboratory of Tree Genetics and Breeding, Jiangsu Key Laboratory for Poplar Germplasm Enhancement and Variety Improvement, the Southern Modern Forestry Collaborative Innovation Center, Nanjing Forestry University, Nanjing 210037, China
*
Author to whom correspondence should be addressed.
Forests 2023, 14(6), 1182; https://doi.org/10.3390/f14061182
Submission received: 20 April 2023 / Revised: 1 June 2023 / Accepted: 5 June 2023 / Published: 7 June 2023
(This article belongs to the Special Issue Forest-Tree Comparative Genomics and Adaptive Evolution)

Abstract

:
Willows, in the genus Salix, are widespread on the earth with significant ecological and economic values for humans. Although about 500 Salix species have been estimated, the genomic foundation of their adaptations to environments with diverse stresses has been underexplored. Here, we applied a pan-transcriptome approach to investigate the phylogenetic relationships and genetic variations among 16 willow species. A pan-transcriptome of 29,668 gene families was assembled, 69% of which exhibited presence/absence variation across the analyzed species. In comparison to core genes present in all species, shell gene families absent in at least one species were enriched with genes in pathways of signaling transduction and response to stimuli, suggesting their functions in the interaction with diverse environmental factors. A phylogenetic tree of 16 willow species was constructed with high confidence based on 870 single-copy orthologous genes, providing detailed evolutionary relationships of willow sections. The willow species were further assigned into four species clusters using the gene numbers in each family. The diversity of gene family size and gene expression levels among the willow species are closely associated with their geographical distributions. The gene family members involved in DNA repair and cellular response to DNA damage stimuli were expanded in willow species from high-altitude regions in southwestern China, which may contribute to their tolerance to ultraviolet radiation stress. Our study generates a comprehensive pan-transcriptome resource for a large set of Salix species and provides insights into the adaptations of willows to diverse environments, which will be valuable for comparative analysis with other related woody and herbaceous plants.

1. Introduction

Willow is the common name for plants in the genus Salix of the family Salicaceae [1]. There are about 500 natural and 200 hybrid willow species on the earth, mostly distributed in cold and temperate regions with moist soils [2,3]. Willow plants can be grouped into diverse types or sections based on their sizes and growth habitats, ranging from tall trees to shorter shrubs to low-growing and creeping cushion plants [4]. They have adapted to different environmental conditions and have formed endemic distributions in some regions. Willow plants play an important role in ecosystems as dominant species in many natural habitats and as food sources for herbivorous insects and some mammals [5]. Moreover, willow plants are of significant economic and social value, serving as industrial feedstock and bioenergy resources, ornamental and forage plants, and materials for tannin and salicylic acid [6,7,8].
The genetic polymorphism of willows is relatively high due to frequent hybridization and diverse chromosomal ploidy levels [9,10]. Shrub willows in nature are primarily diploid, while arbor willows are mostly allopolyploid [11]. The genomes of several diploid and tetraploid willows have been sequenced and assembled in past years [12,13,14,15,16]. Comprehensive analysis of genomes and transcriptomes of willow species would provide clues to understanding their adaptations to diverse environments.
The pan-transcriptome is a recalling concept of the pan-genome, which reflects the set of all transcripts of a species or an organism. For most species, the genome of only a single individual has been sequenced, which only represents a portion of the genes in the species gene pool [17]. To overcome this limit, the concept of a pan-genome has been proposed, which is defined as all of the genes present in individuals or strains of a species, mainly consisting of core genes, dispensable (shell) genes, and specific (cloud) genes [18]. Pan-genomic studies were originally initiated on microbes. The results of these studies indicated that horizontal gene transfer and gene loss play important roles in shaping the genomic diversity and adaptation of bacterial populations [19]. With the advance of modern sequencing techniques, such as next-generation sequencing (NGS) and third-generation sequencing (TGS), pan-genomic studies have been applied in plant research. More and more plant species, such as tomatoes [20], cucumbers [21], rice [22], and sorghum [23], have been investigated using pan-genomic approaches. These studies revealed novel genes and structural variations that were absent in the reference genomes and which are responsible for phenotypic variation in these crops. Furthermore, a pan-transcriptome constructed from the RNA-seq data of different individuals or species can capture most of the genes expressed in the genome, so the pan-transcriptome analysis can be a cost-effective approach to explore the genetic variations in a species or an organism.
In the present study, we performed RNA-seq analyses on the leaf tissues of 16 willow species to construct a high-quality pan-transcriptome and investigate their phylogenetic relationships using single-copy genes. The diversities of gene family size and gene expression levels were explored in these willow species from diverse geographical distributions. Our study provides valuable resources and insights for understanding the diversity and adaptation of willow species.

2. Materials and Methods

2.1. Data Collection and Transcriptome Sequencing

Two sets of RNA-seq data from 16 species from 9 sections were used in our analysis. In the first set, mature-leaf samples with comparative growth stages were collected from seven willow species including hakuro-nishiki willow (Salix integra), corkscrew willow (Salix matsudana var. tortuosa), weeping willow (Salix babylonica), swamp willow (Salix myrtilloides), Nanjing willow (Salix nankingensis), desert willow (Salix psammophila), and basket willow (Salix viminalis), which are planted in Nanjing Forestry University (32°07′ N and 118°81′ E). Total RNA was extracted from leaves using the RNAprep pure plant Kit (TIANGEN, Beijing, China) according to the manufacturer’s instructions. The samples were first treated with DNase and applied for library construction using Truseq RNA library prep kit v 2. Each sample was barcoded and sequenced as paired-end on the Illumina HiSeq 2500 instrument (Illumina, San Diego, CA, USA).
In the second set, a total of 13 RNA-seq libraries from nine willow species, including wallich willow (Salix wallichiana), Indian willow (Salix tetrasperma), creeping Himalayan willow (Salix souliei), cushion willow (Salix brachista), dustpan willow (Salix suchowensis), deng willow (Salix dunnii), purple willow (Salix purpurea), Japanese fantail willow (Salix udensis), and winnow willow (Salix koriyanagi), were downloaded from the Short Sequence Read Archive (SRA) database. These sequences were derived from a wide range of studies [15,16,24,25,26], from which the samples from leaves in natural or normal conditions were selected for further analysis.

2.2. Transcriptome Assembly and Completeness Assessment

In the quality-control stage, adaptors were trimmed, and low-quality reads were filtered with Trimmomatic (version 0.39) [27]. The high-quality filtered reads of each individual were assembled using Trinity (version 2.8.5) [28] with de novo mode. To obtain the representative assembly transcripts (RATs), the preliminary assembly transcripts (PATs) were filtered and screened using the following strategies: (1) Bacterial, fungal, and human genomes downloaded from NCBI were used to identify potential contamination sequences. Transcripts with coverage and identity >70% were removed. (2) The longest transcript within a locus was defined as the representative transcript. (3) Cd-hit-est (version 4.8.1) [29] program was used to remove redundant transcripts with the parameters “-c 0.95 -n 10”. (4) Transdecoder (version 5.5.0) (http://transdecoder.github.io/, accessed on 5 September 2022) was used to predict the open reading frame (ORF) of the remaining transcripts, and the transcripts with a coding length of less than 100 amino acids were removed. BUSCO (version 3.0.2) [30] was applied for the assessment of transcriptome completeness.

2.3. Functional Annotation of Transcripts

For gene annotation, all RATs were performed by aligning them against seven public protein databases, including NR, SwissProt, eggNOG5, Pfam, TAIR10, GO, and KEGG databases using Diamond (version 2.0.13.151) [31] with the parameter “--evalue 1 × 10⁻⁵”. Gene Ontology (GO) and the Kyoto Encyclopedia of Genes and Genomes (KEGG) were used for an overview of gene functions. A gene-set enrichment test was performed by the ClusterProfiler [32] package. GO or KEGG terms with an adjusted p value (p adjust) < 0.05 were considered significantly enriched.

2.4. SSR and TF Identification

The presumptive simple sequence repeats (SSRs) of Salix transcripts were identified by Misa (https://webblast.ipk-gatersleben.de/misa/, accessed on 23 September 2022) [33] with default settings. The transcription factors (TFs) of willow transcripts were predicted by the iTAK tool (version 1.7a) [34] with default parameters.

2.5. Gene Family Clustering and Evolutionary Analysis

OrthoFinder (version 2.5.4) [35] pipeline was used to identify orthologous groups (OGs). Single-copy genes in 16 Salix species and 2 outgroups (Oryza sativa version IRGSP-1.0 and Populus trichocarpa version AMTR 1.0) were selected for the construction of phylogenetic trees. Sequences of genes in each OG were aligned using MAFFT (version 7.490) [36] with default parameters. The gaps in the alignments of each gene group were removed using trimAL (version 1.4.1) [37], and then all sequences of each species were concatenated end-to-end to form the supergene sequences. RAxML (version 8.2.12) [38] was used for the construction of phylogenetic trees, followed by the estimation of the divergence time in willow species using R8s [39]. CAFE (version 3.1, Chapel Hill, NC, USA) [40] software was used to identify gene families with significant expansion or contraction.

2.6. Identification of One-to-One Orthologous Genes and Expression Analysis

Genes of one-to-one patterns in all 16 Salix species were obtained using Blast (version 2.12.0+) [41]. The transcripts of each willow species were compared with transcripts of all other willow species by using Blastn with “-evalue 1 × 10⁻⁵”. Reciprocal best hits were identified and clustered into a one-to-one gene list for the 16 Salix species.
To quantify the expression levels of genes, filtered high-quality reads were mapped to the RATs of the same species using Rsem (version 1.3.3) [42]. Read counts obtained by Rsem were applied for differential expression analysis using a DEseq2 [43] R package. Genes were defined as differentially expressed using the cutoff p adjust < 0.05 and |log2 Fold Change| > 1.

3. Results

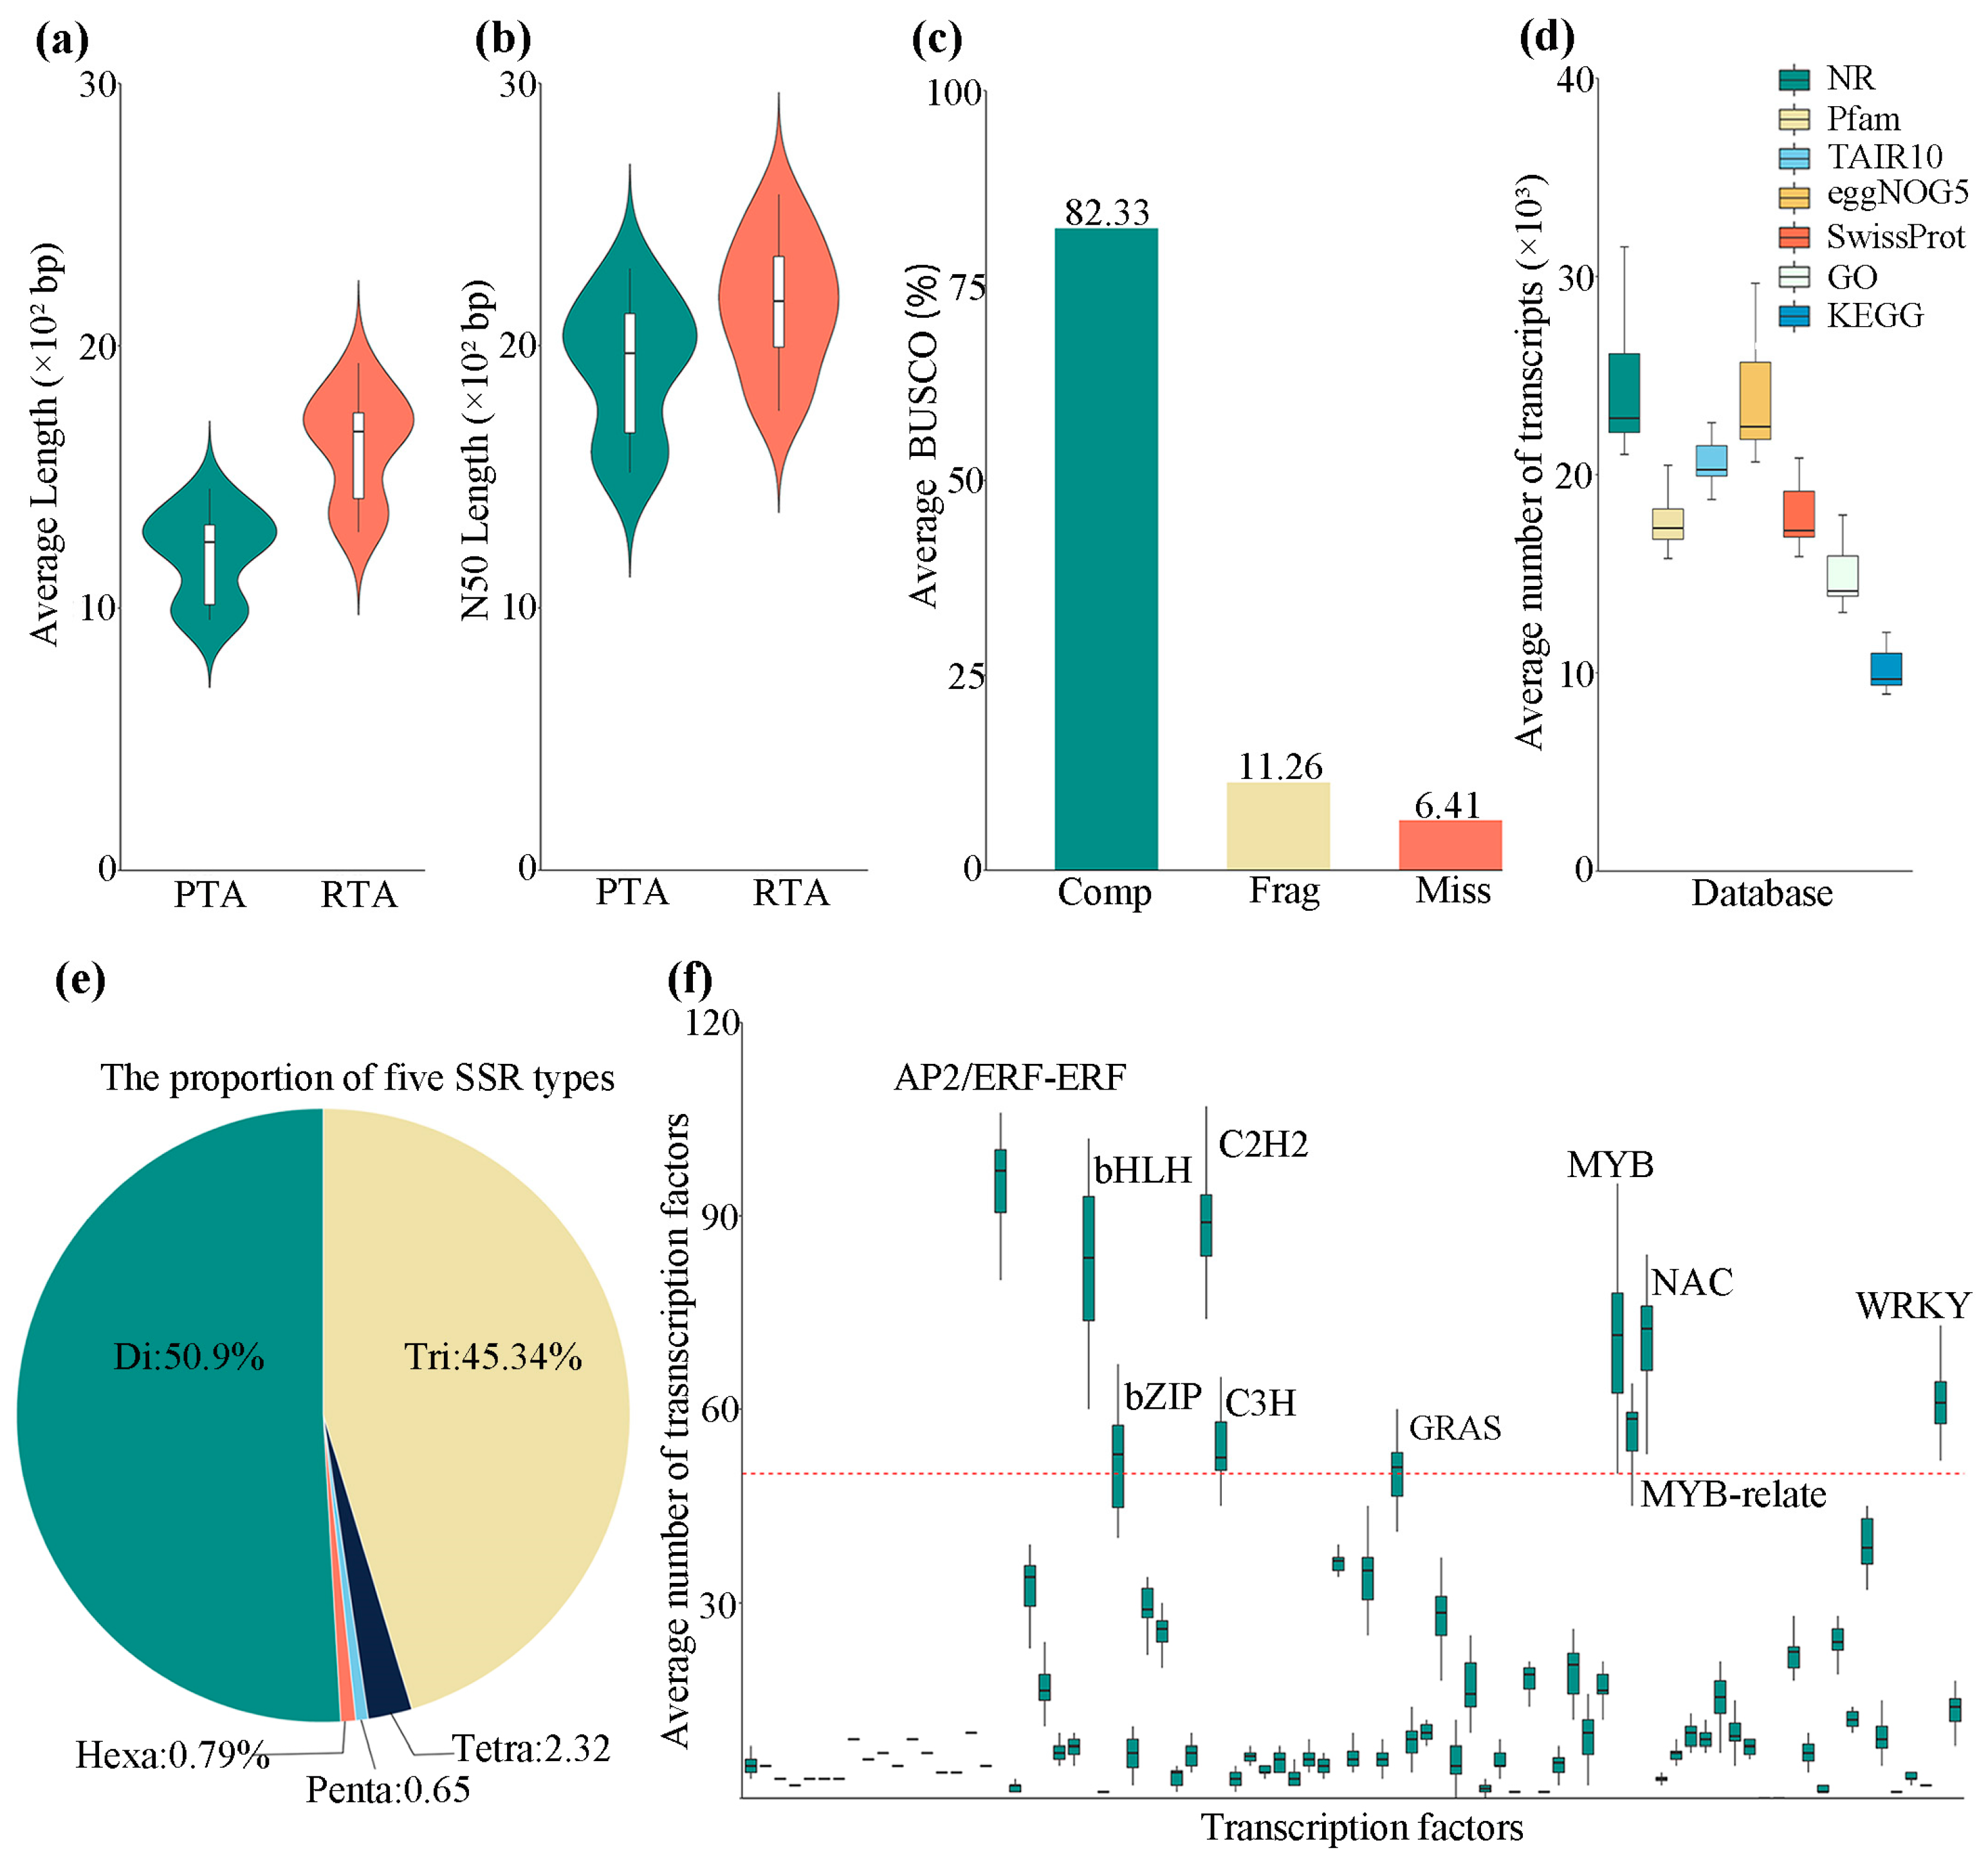
3.1. De Novo Assembly and Annotation of Willow Transcriptomes

The willow species used in our analysis can be classified into six groups based on their geographic distributions (Table S1). S. wallichiana, S. tetrasperma, S. Souliei, and S. brachista grow mainly in the mountainous areas of southwestern China, such as Tibet, Sichuan, and Yunnan. S. wallichiana and S. tetrasperma are plants of low mountains, at an altitude of about 1800 m, while S. Souliei and S. brachista are alpine cushion plants, at an altitude of more than 4000 m. S. matsudana var. tortuosa, S. babylonica, S. nankingensis, and S. dunni are common willow tree species in the central, eastern, and southern plains of China. S. integra, S. myrtilloides, and S. viminalis are three willow species distributed in the Jilin, Liaoning, and Heilongjiang provinces in northeastern China. They grow in lowland swamp areas, which belong to a temperate monsoon climate with long and cold winters and an average temperature of −20 °C. S. psammophila, S. koriyanagi, S. udensis, S. suchowensis, and S. purpurea are common plain shrubs that can be used for windbreaks, sand fixation, and basket weaving. Among them, S. purpurea is native to Europe, while the other four willow species are widely distributed in the northern and sometimes southern regions of China.
We collected RNA-seq data from the 16 willow species to assemble the transcriptome of each one. In total, 204 Gb clean bases and 1.36 billion clean reads were collected, with an average of 0.85 billion reads per species (Table S2). Next, we assembled the reads into 1,952,512 preliminarily transcript assemblies (PTAs) with an average length and average N50 of 1208 bp and 1924 bp, respectively (Figure 1a, Table S3). A series of screenings (see Materials and Methods for details) were applied on the PTAs. Finally, 402,284 representative transcript assemblies (RTAs) were generated (Table 1), of which the average length and N50 were significantly increased (Figure 1b, Table S3). We assessed the completeness of the RTAs using BUSCO, and the results showed that a mean of 93.59% of universal single-copy genes was present in the RTAs (Figure 1c, Table S4).
Multiple databases were used to annotate the functions of the RTAs of all willow species. On average, 24,099 (95.85%) transcripts of each species of willow were retrieved in these databases, and 17,895 (58.73%) transcripts were annotated with unknown functions (Figure 1d, Table S5). Simple sequence repeat (SSR) markers are important resources for genetic diversity assessment. In our analysis, a total of 86,581 SSRs were identified in all of the willows’ transcripts (Table S6), of which dinucleotide (50.9%) and trinucleotide repeats (45.34%) were the most significant proportion, followed by tetranucleotide repeats (2.32%), and the lowest were hexanucleotide (0.79%) and pentanucleotide repeats (0.65%) (Figure 1e). Transcripts encoding transcription factors (TFs) were further annotated. A total of 20,830 TF-encoding transcripts from 68 TF families were identified, with a mean of 333 per willow species (Table S7). The MYB/MYB-related (2089), C2H2 (1502), AP2/ERF-ER (1478), bHLH (1329), and NAC (1118) were the top 5 TF families in the willow transcriptomes (Figure 1f). The high-quality willow pan-transcriptome and the derived SSRs and TFs provide essential resources for genetic studies of willows.

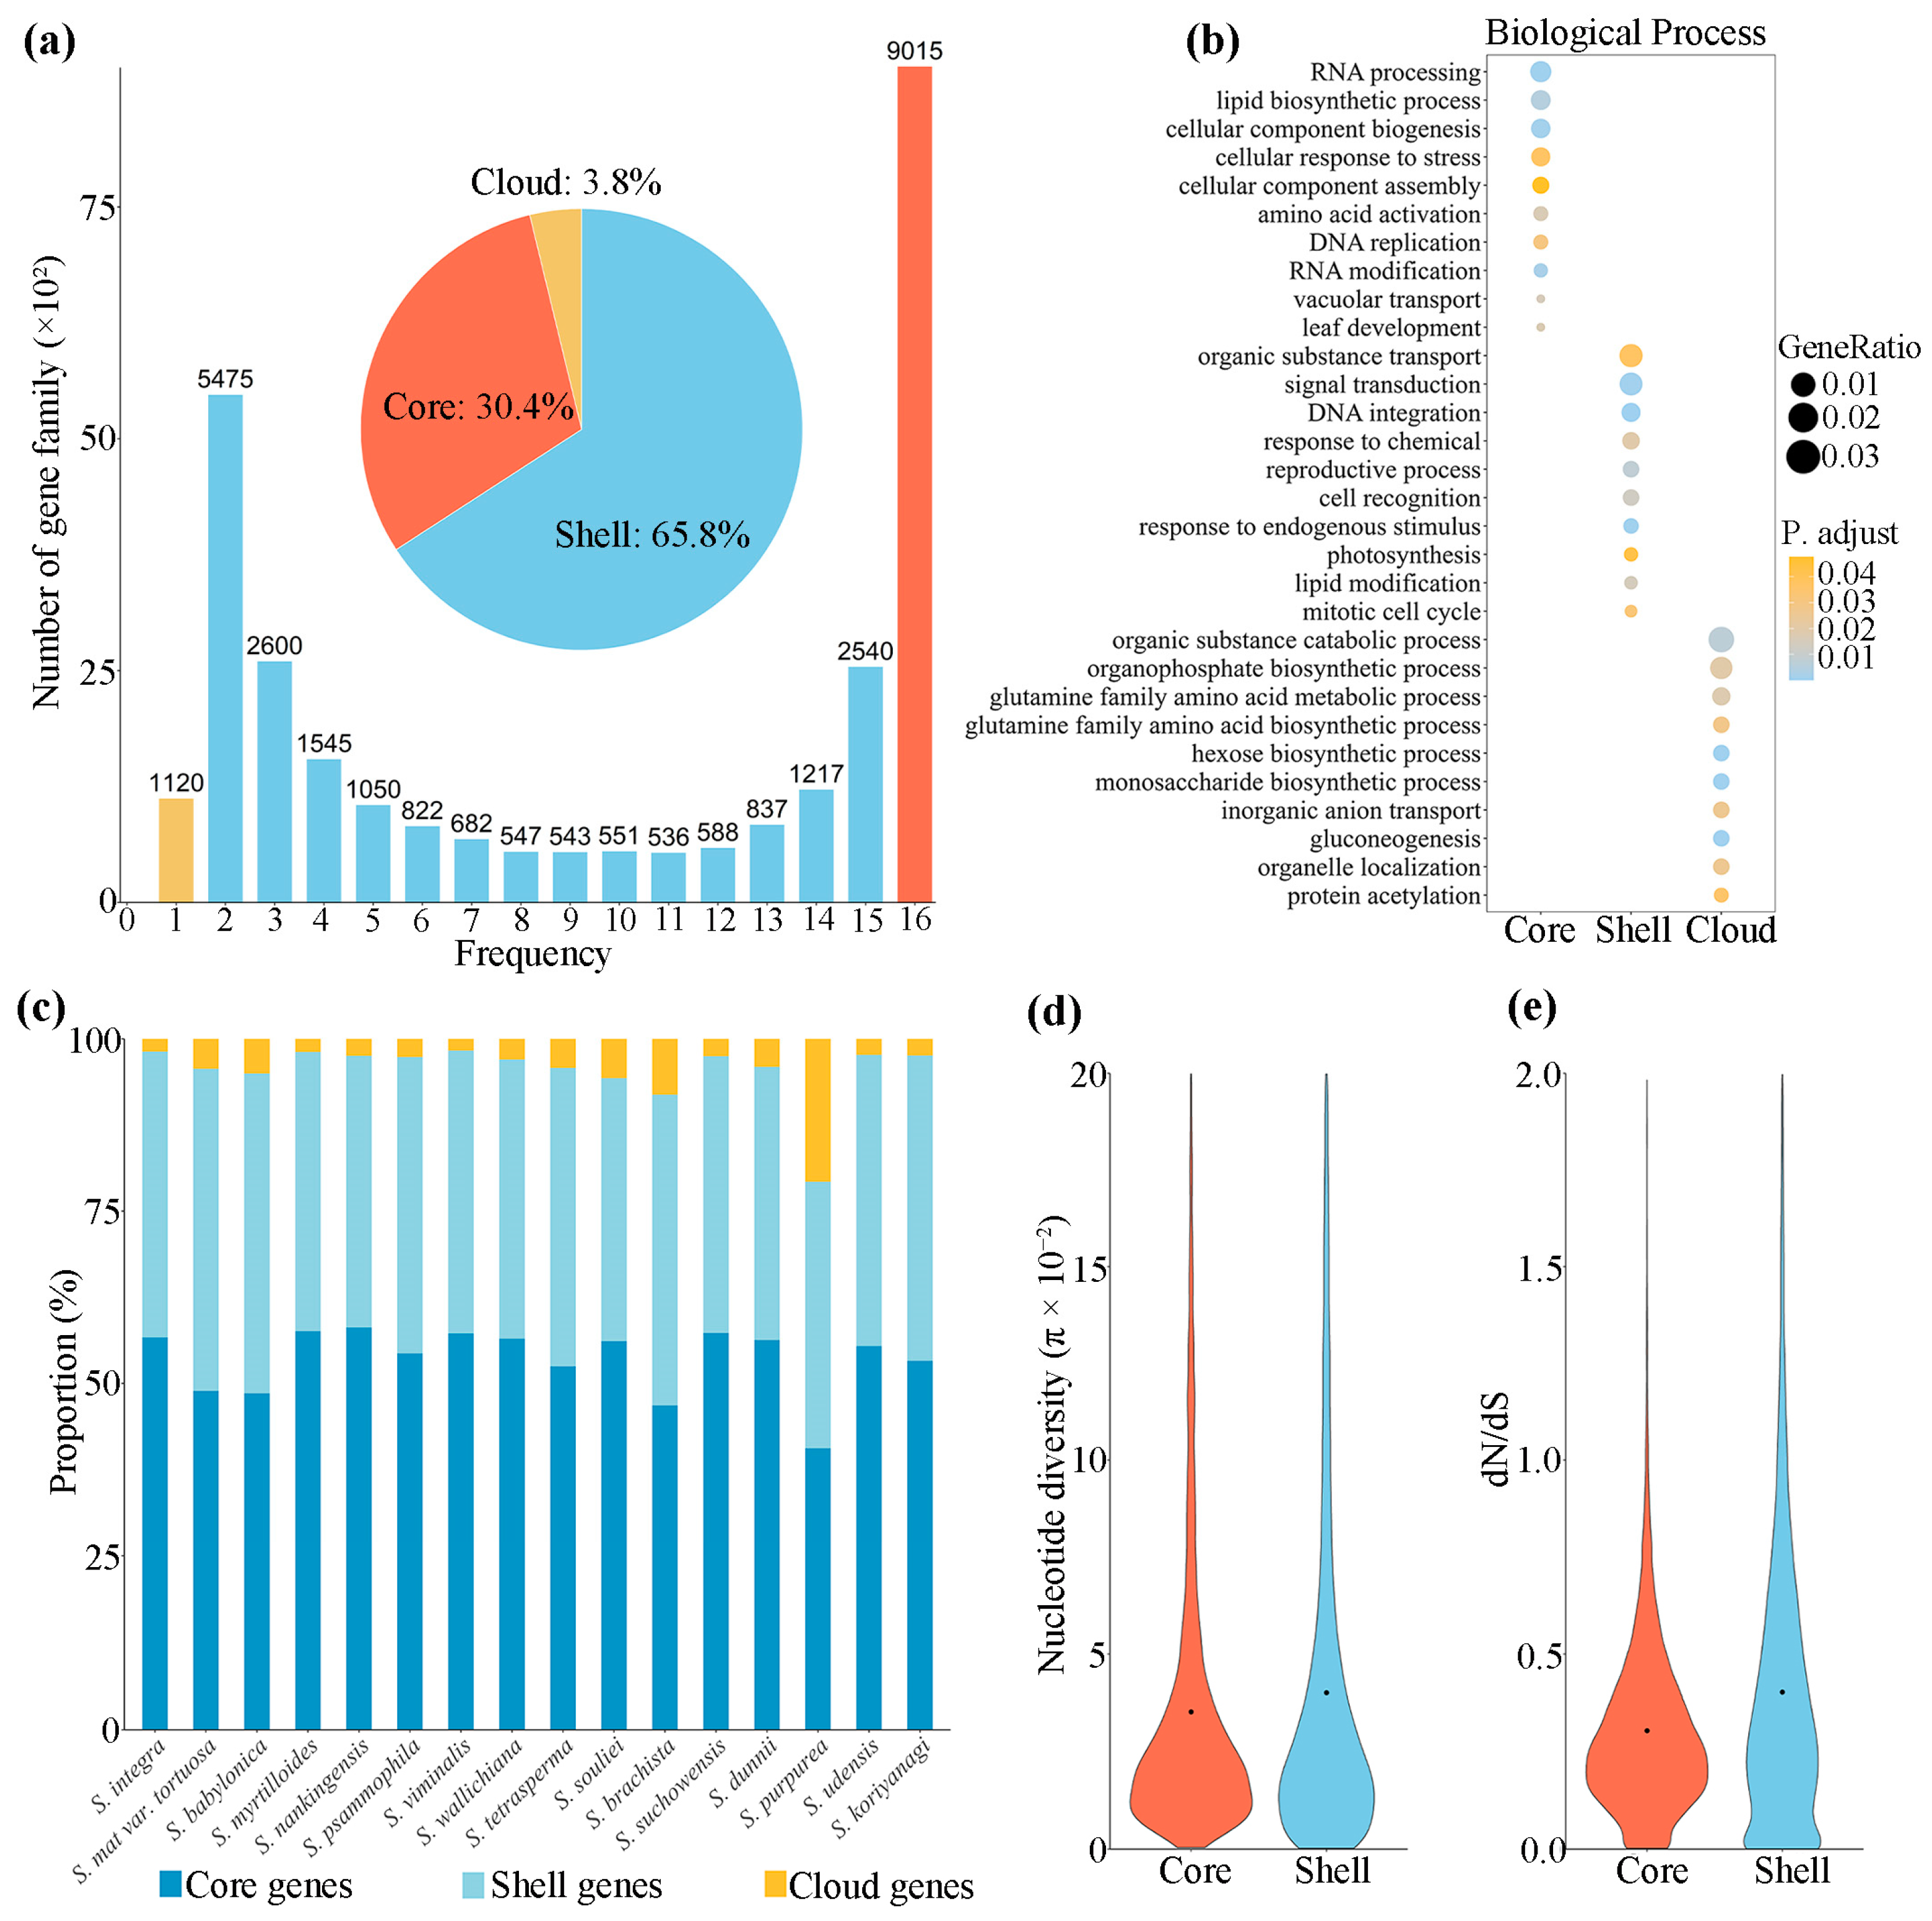
3.2. Characterization of Willow Pan-Transcriptome

All of the transcripts were grouped into 29,668 gene families according to sequence similarity (Table S8). All of the gene families were categorized based on their presence/absence frequencies. A total of 9015 (30.4%) gene families present in all species were defined as core, 19,533 (65.8%) gene families present in 2–15 species were defined as shell, and 1120 (30.8%) gene families uniquely present in a single species were defined as cloud sets (Figure 2a). The core, shell, and cloud transcripts were also summarized according to each willow species (Figure 2c, Table S9). On average, each species consisted of 53.51% core, 41.92% shell, and 4.57% cloud transcripts/genes. During the construction of the pan-transcriptome, we assessed the size of the pan-transcriptome by iteratively increasing the number of species through random sampling (Figure S1a). When more species were included, the number of core families decreased and the number of Pan gene families increased, which is consistent with the observations of other plants [44,45].
Gene ontology (GO) enrichment analysis revealed significant functional differences between the core and shell gene families. The genes of the core set were enriched in basic biological functions. By contrast, the shell genes were enriched in signal transduction, reproductive processes, cell recognition, and organic substance transport (Figure 2b). In addition, the shell family showed higher nucleotide diversity (π) and non-synonymous-to-synonymous substitutions ratios (dN/dS) than the core family (Figure 2d,e). Taken together, the shell gene family may make more contributions to adaptations to diverse environments than the core gene family.

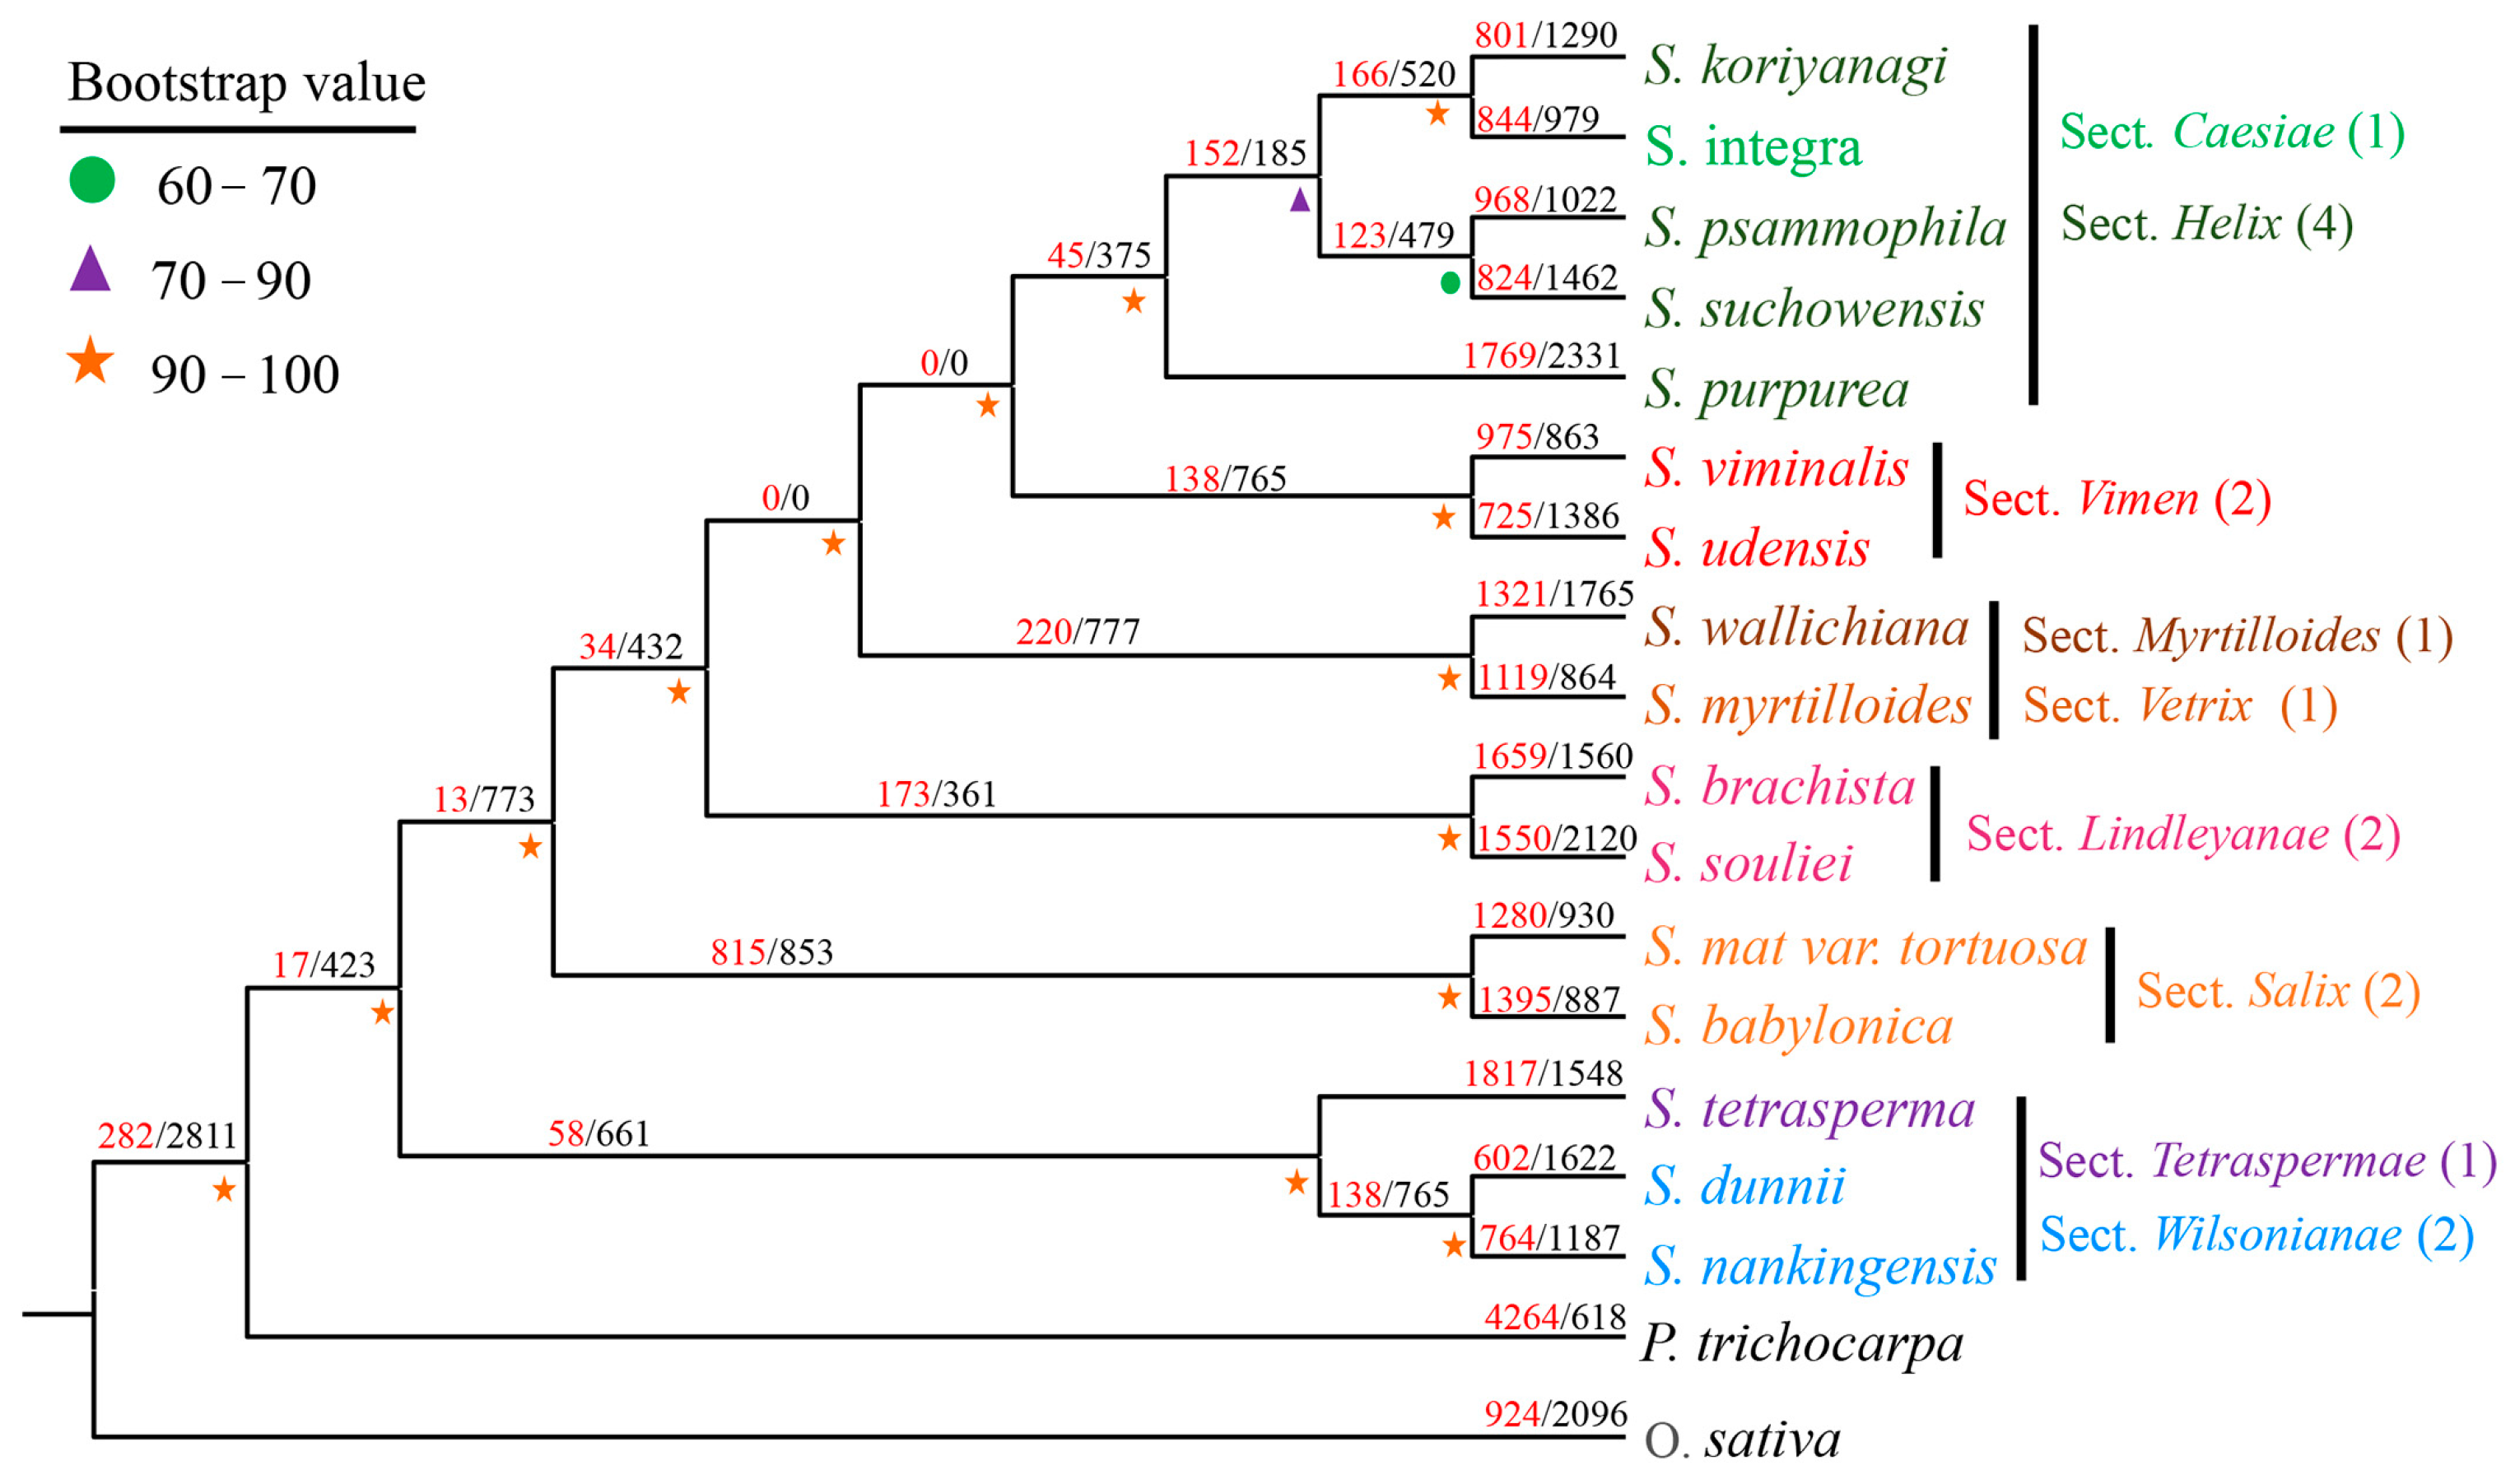
3.3. Phylogenetic Analysis of Willow Species

The phylogenetic tree of the 16 Salix species was constructed using 870 single-copy homologous genes (Figure 3). The high bootstrap values indicated the reliability of the phylogenetic tree. The tree was divided into six clades, and each clade consisted of Sect. Tetraspermae and Sect. Wilsonianae as an early diverging branch. S. myrtilloides (Sect. Myrtilloides) and S. wallichiana (Sect. Vetrix) were grouped into the same clade, indicating the close relationship between the two species. S. integra was in a sister position to the three willow species of the clade consisting of Sect. Helix and Sect. Caesiae.
We further analyzed gene family expansion and contraction in the willow species using the existing evolutionary framework. A total of 1668 gene families significantly expanded or contracted in the clade of Sect. Salix, whose prominent members were allopolyploids [14,46].
The divergence time of the Salix species was estimated based on the phylogenetic tree (Figure S2). The results show that the Salix genus diverged from Populus 33.3 million years ago (Mya), and willow species of Sect. Tetraspermae and Sect. Wilsonianae diverged from other species at about 24.88 Mya, and the genus of Salix was estimated to originate in the Oligocene.

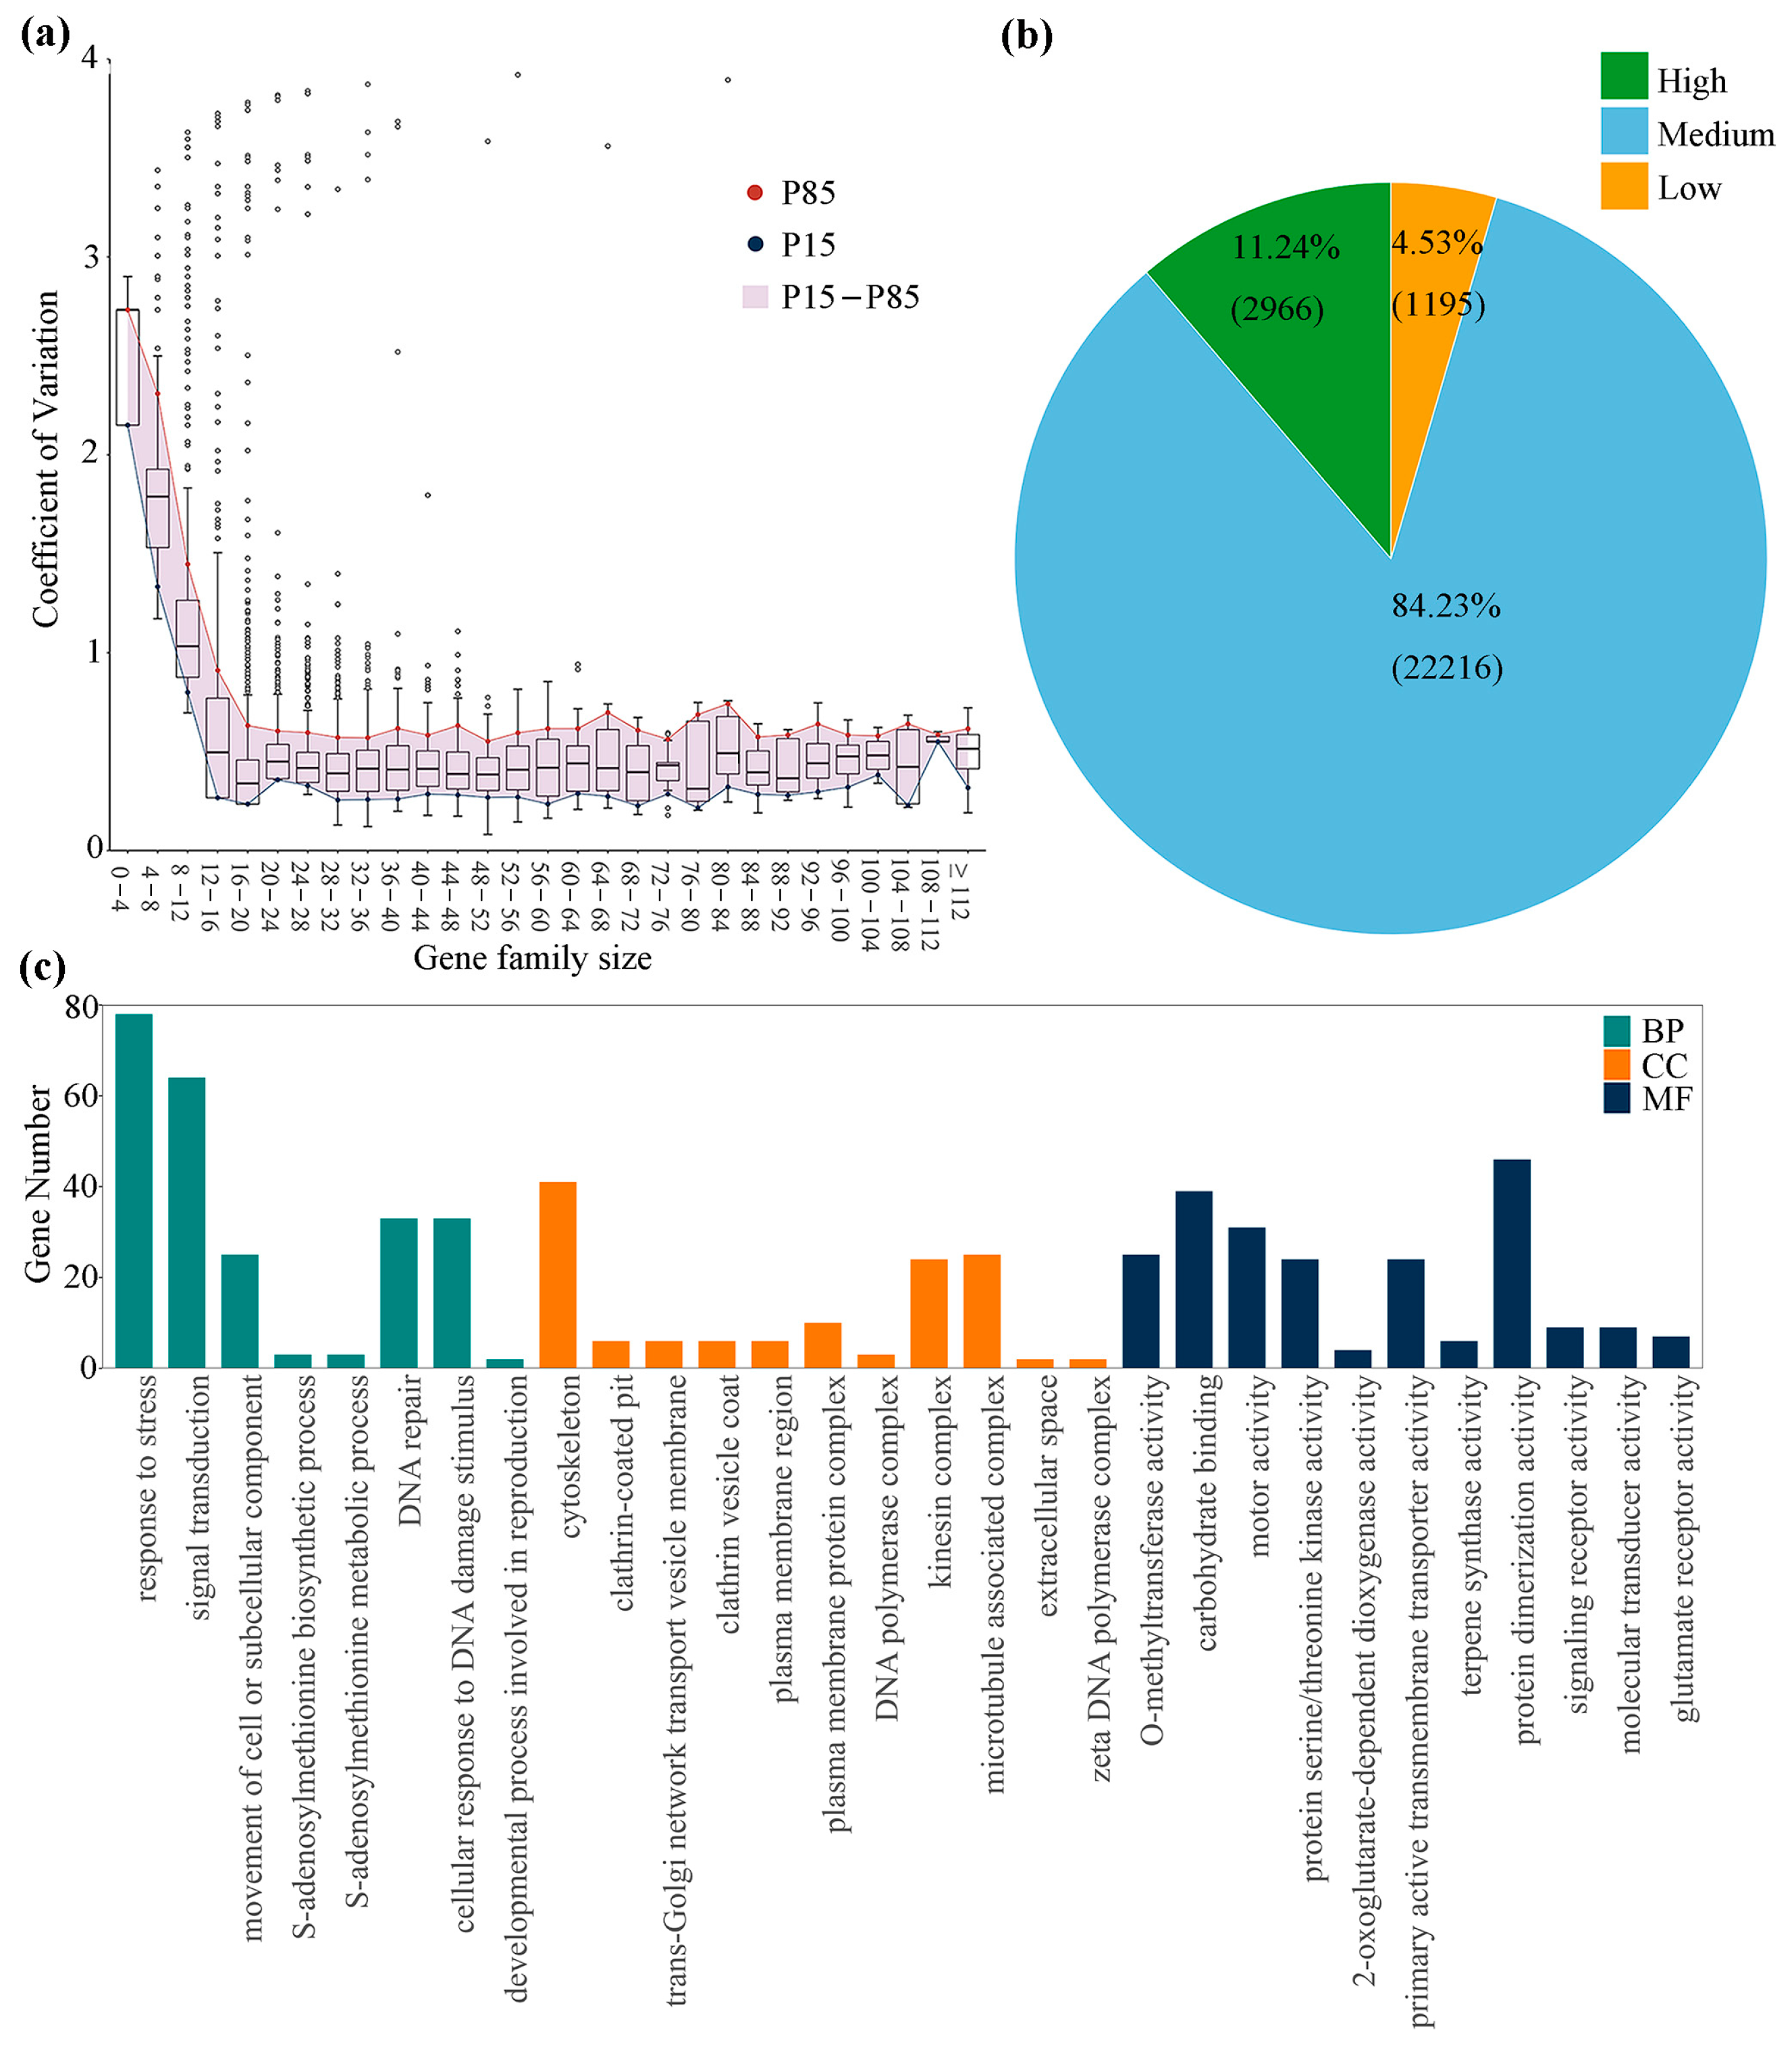
3.4. Variation in Gene Family Size among Willow Species

The increment of gene numbers in gene families could result in complicated regulation in response to diverse stresses. The Coefficients of Variation (CVs) of gene numbers in each gene family across all the willow species were calculated to evaluate the diversity of the gene families. The gene families were first categorized into 29 groups based on the total number of genes (Figure 4a). In each group, the gene families with greater CV values than the 85th quantile were defined as high-variant gene families. Meanwhile, those with CV values lower than the 15th quantile were defined as low-variant families, and the other gene families were named as median-variant families. In total, 2966 (11.24%), 22,216 (84.23%), and 1195 (4.53%) gene families were grouped as high-, medium-, and low-variant families, respectively (Figure 4b, Table S10).
GO enrichment analysis was performed for the gene families of three categories with different variant levels in gene numbers. The results indicated that members of the low- and medium-variability gene families were enriched with housekeeping genes involved in basic activities and the primary metabolism pathways (Table S11). In contrast, the gene families with high variability were significantly enriched in GO terms related to stress responses, such as response to abiotic stress, signal transduction, O-methyltransferase activity, and DNA repair (Figure 4c).

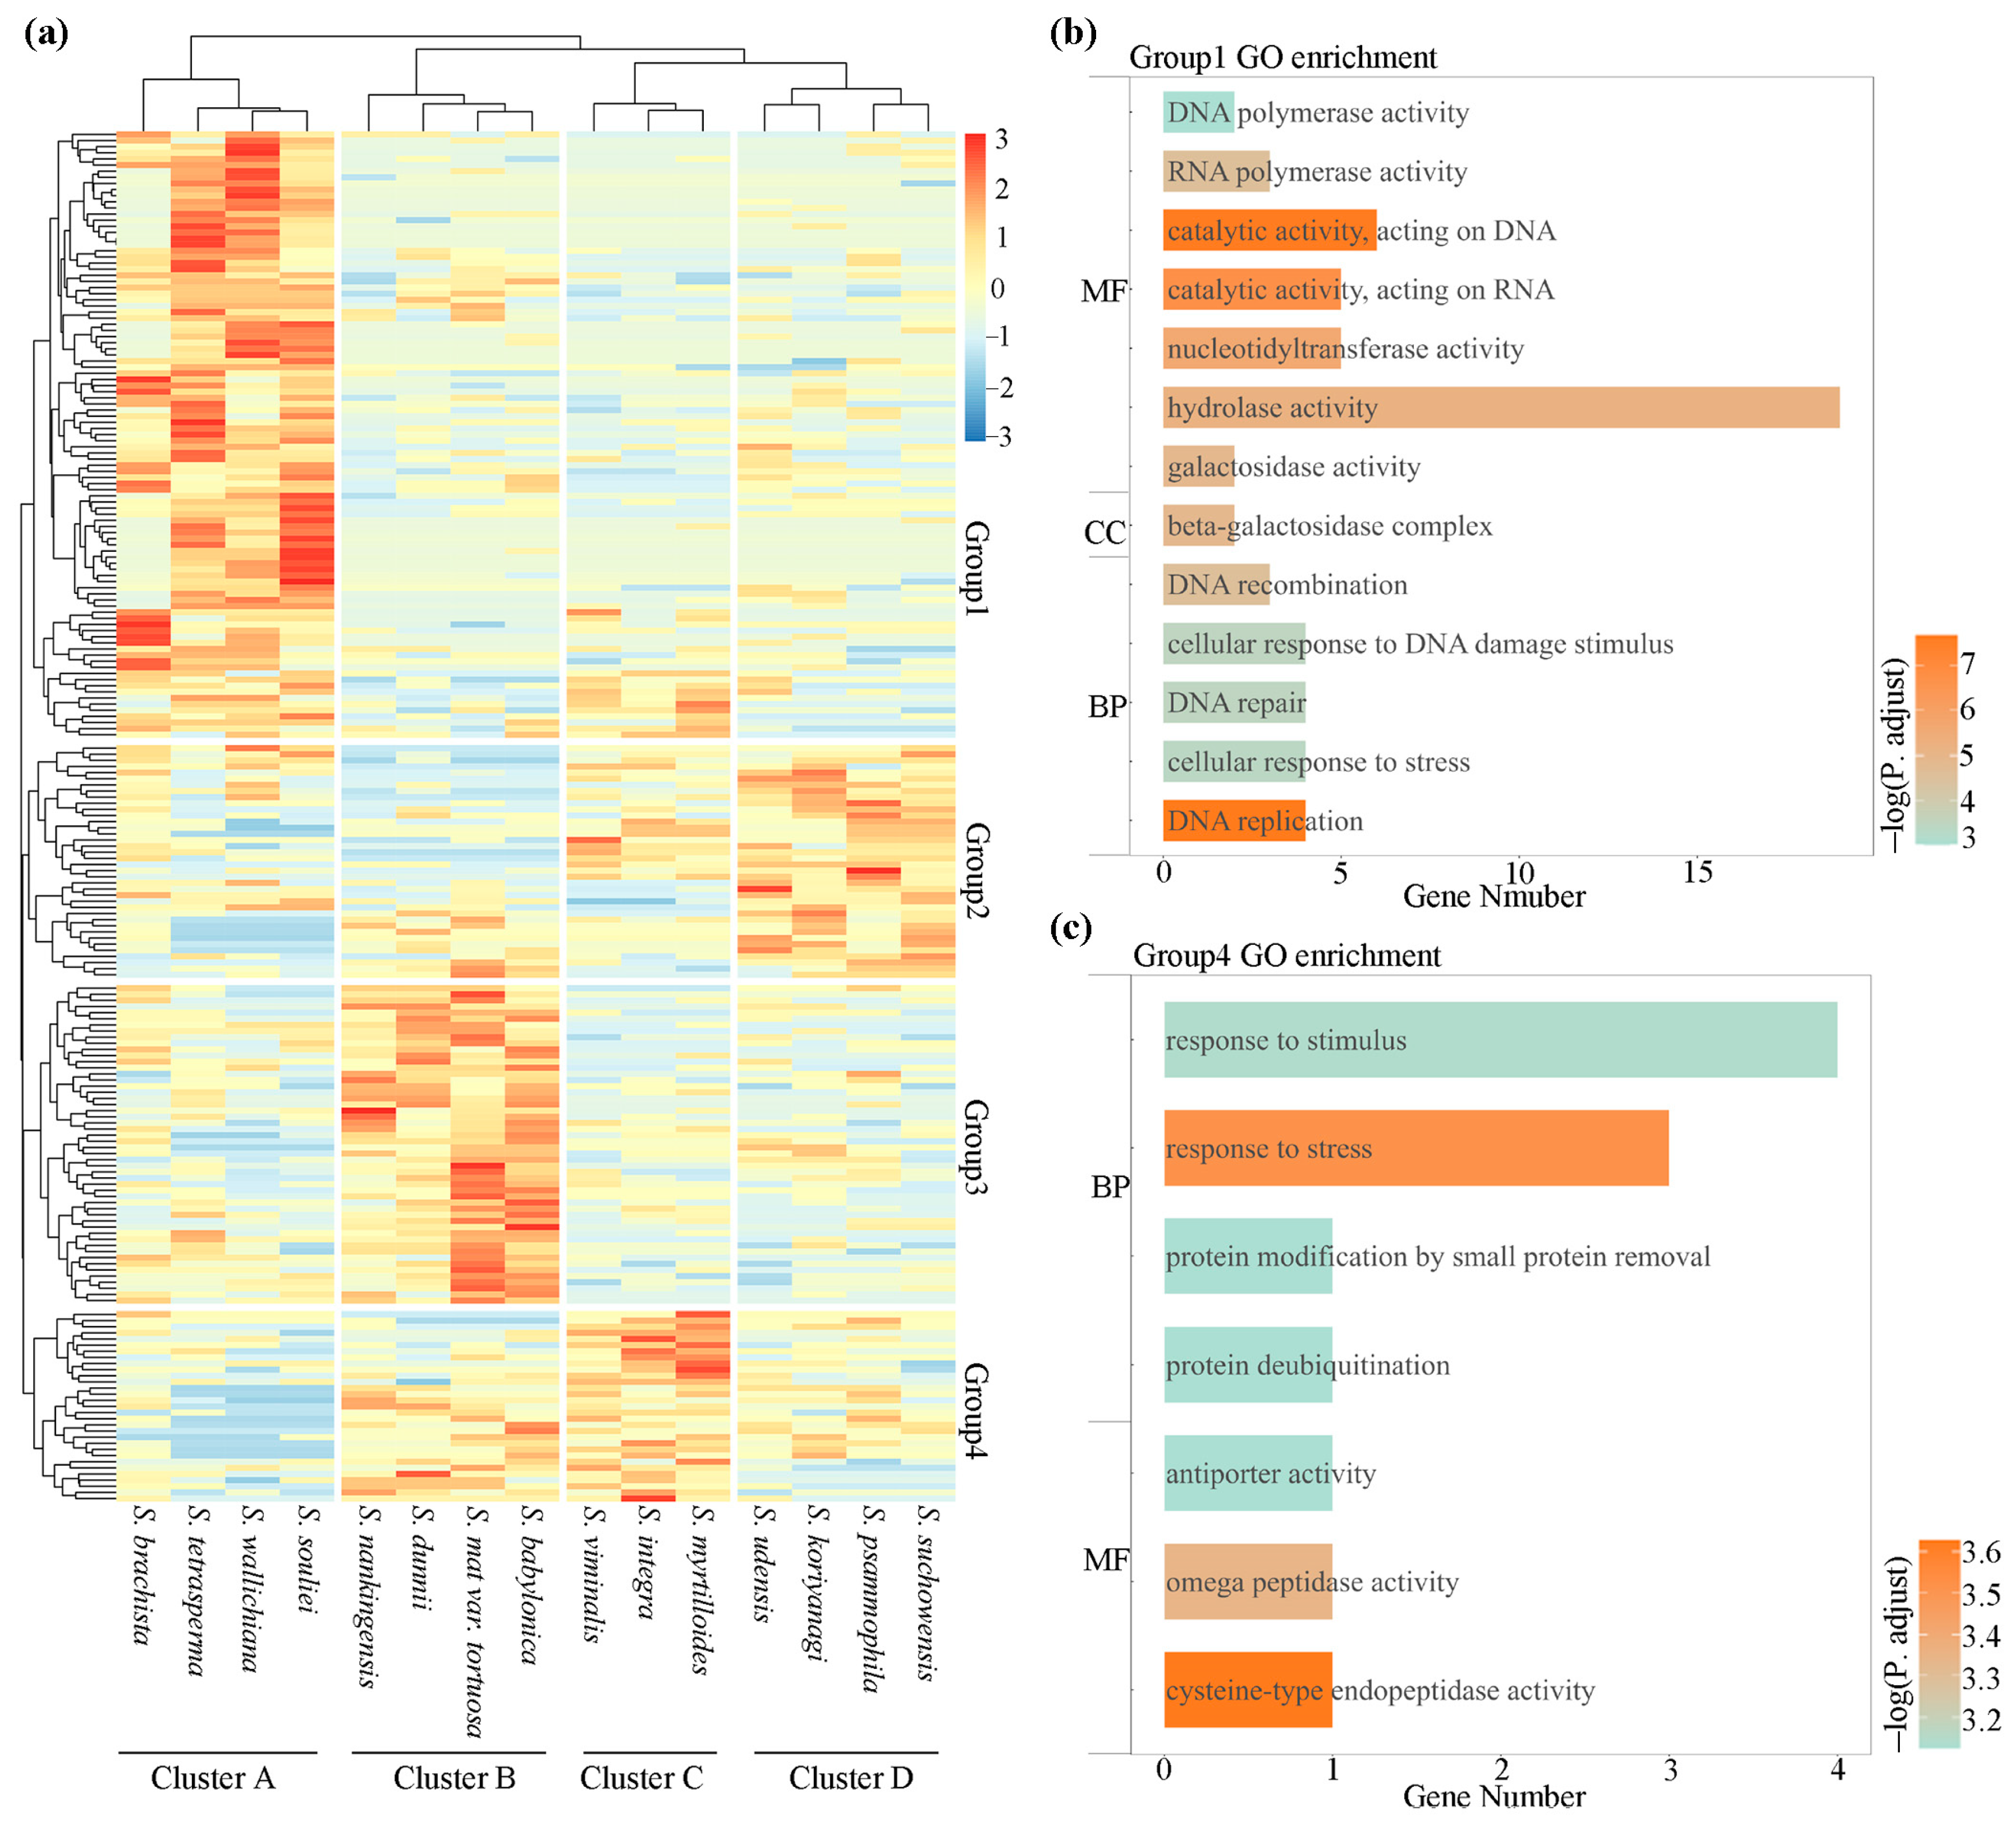
3.5. Clustering of Gene Families Based on Family Size

Hierarchical clustering was performed for 2966 high-variability families. The 16 willow species except for S. purpurea were grouped into 4 clusters (Figure S3a). The clusters of willow species agreed well with their geographical distribution (Table S12). Members of cluster A were mainly distributed in Tibet, Sichuan, Yunnan, and other southwestern regions of China; members of cluster B were mainly distributed in Central, East, and South China; members of cluster C were primarily distributed in the northeast of China; and members of cluster D were mainly distributed in Northwest, North, and part of Northeast China.
ANOVA was performed to detect gene families with significant differences in gene numbers among the four clusters of willow species. The 220 identified gene families (p value < 0.05) were then clustered into four groups based on gene family size (Figure 5a). Within the four groups, 99, 38, 52, and 31 genes were detected in groups 1 to 4, respectively. The gene families in the four groups also exhibited distinct expansion patterns into four species clusters (Figure 5a). GO enrichment and KEGG pathway enrichment analysis were performed for the four gene family groups (Table S13). GO terms related to DNA damage repair, such as “DNA polymerase activity”, “DNA repair”, “DNA recombination”, and “cellular response to DNA damage stimulus”, were enriched in gene family group 1 (Figure 5b). As shown in Figure 5a, the family sizes of gene families in group 1 were larger in species cluster A, which are mostly from southwest regions of China with high altitudes. The gene families in group 4 were mainly involved in pressure stimuli and protein modification, such as “response to stimulus”, “response to stress”, “protein deubiquitination”, and “protein modification by small protein removal” (Figure 5c). The family sizes of group 4 were large in species clusters B and C, of which the species of cluster C were mostly from drought regions.

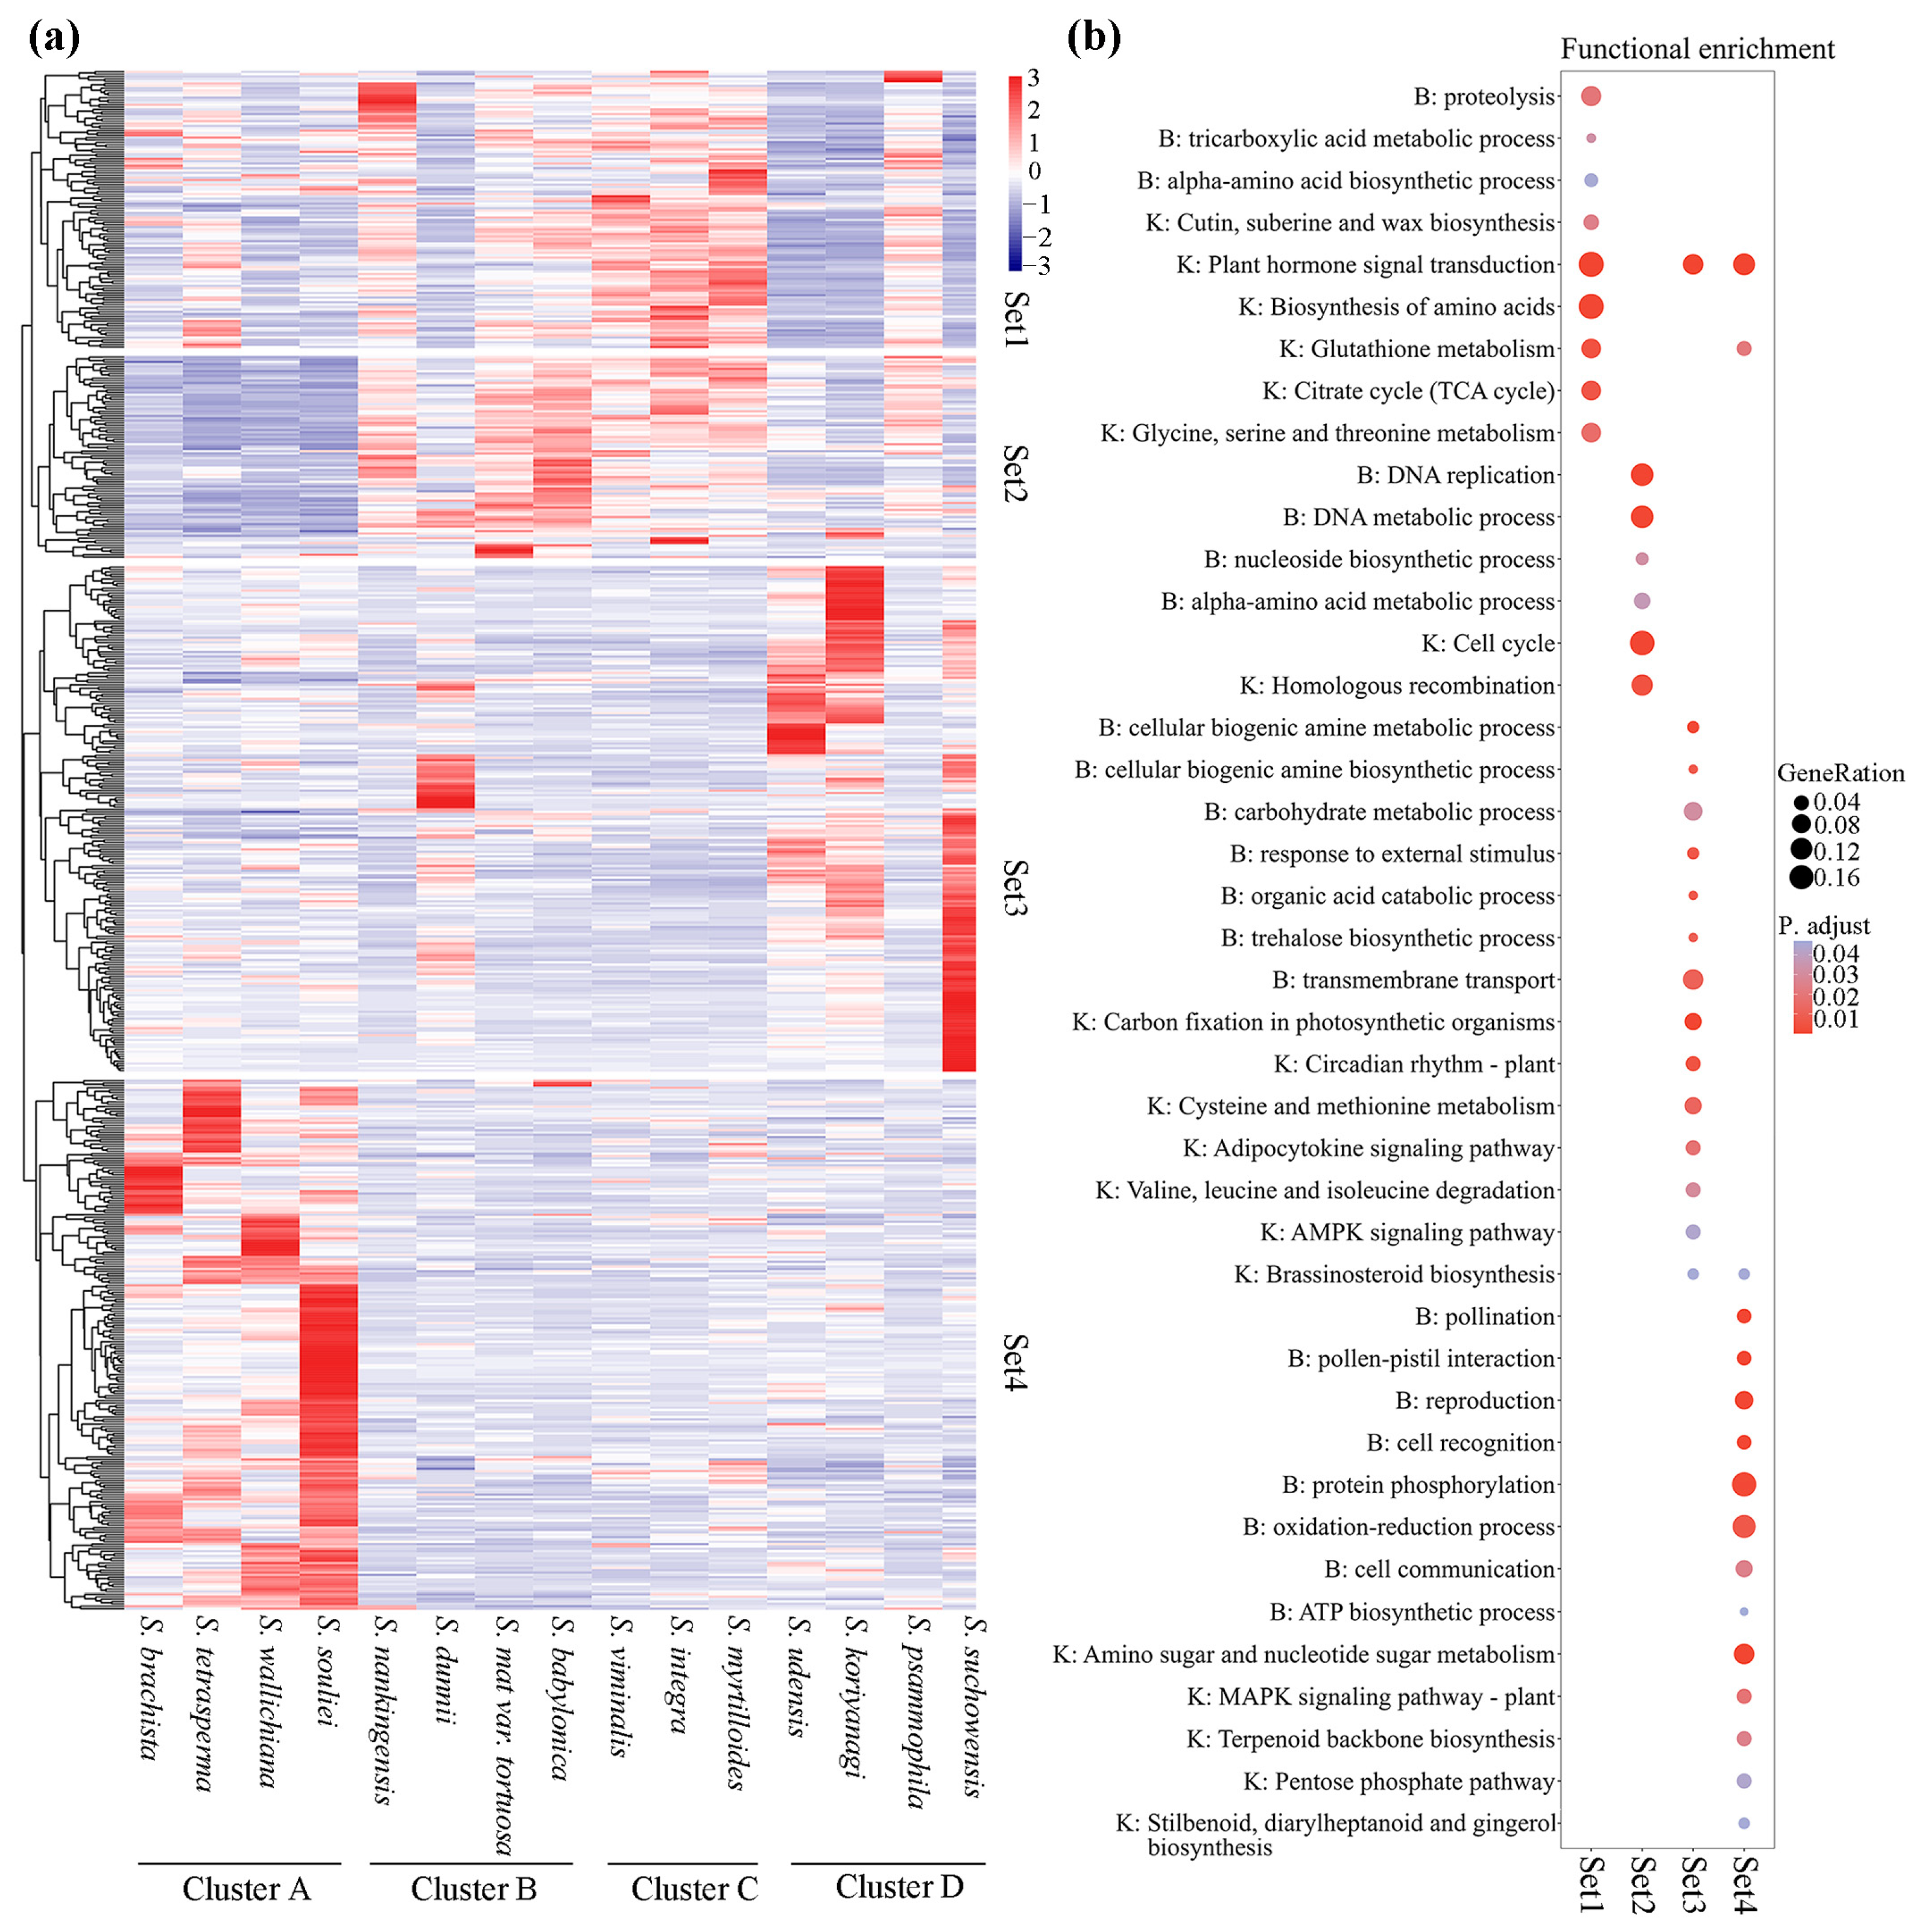
3.6. Expression Patterns of Orthologous Genes in Willow Species

All RAT sequences from the willow transcriptome were aligned with each other to identify orthologous genes. A total of 9016 genes with a 1:1 relationship between any two species were identified, which is much larger than the previous analysis of 10 Salicaceae species (238) [47]. Among these orthologous genes, 644 genes were detected to be differentially expressed in the 16 willow species. The hierarchical clustering of all DEGs grouped these genes into four sets (Figure 6a, Table S14). GO and KEGG pathway enrichment analyses of DEG sets indicated that genes involved in pollination and reproduction were enriched in Set4 genes, which were highly expressed in the willows of cluster A. Genes in the citrate cycle and glycine, the serine and threonine metabolism, and the cutin and wax biosynthesis pathways were enriched in Set1 genes, which were highly expressed in willows of cluster C. Further studies of the physiological functions of these differentially expressed genes would provide clues to understanding the mechanisms of environmental adaptations of willow species.

4. Discussion

4.1. High-Quality Willow Pan-Transcriptome

The pan-transcriptome facilitates understanding of the genetic variation in complex organisms at the transcriptional level [48]. Although transcriptional studies of many Salix species have been reported [49,50,51,52], most of them focused on a single or a few species. In the present study, we constructed a high-quality willow pan-transcriptome consisting of 402,284 RATs using de novo assembly of RNA-seq data from 16 Salix species. The pan-transcriptome showed extensive presence/absence variation, with 69.6% of gene families being variable in willows. This number is similar to the report in a pan-genomic study of 16 sorghum cultivars (64%) [23] but smaller than the pan-transcriptome study of 116 Camellia plants (93%) [53]. As reported in the literature, hybridization and polyploidization are quite common in willow species [9,10], which may cause challenges for pan-genome and pan-transcriptome analysis. In our study, the longest transcript within a locus was selected, and redundant transcripts were further clustered and removed. These approaches kept the major information of the transcriptome from a haplotype genome. Haplotype-aware genome assembly will provide more information about the genomic variations and chromosomal arrangement of the willow pan-genome. As one of the pan-genome/transcriptome features, the differences in structure and function between the genes of core and shell families were evident [54]. Genes of the shell families were enriched in processes of signal transduction and response to stimuli, indicating their significant roles in the adaptation of willow species to environments with diverse stresses.

4.2. Systematic and Taxonomic Significance of Salix

The classification of species in the genus Salix has been considered a systematic and taxonomic difficulty due to a large number of intraspecific variations and the high frequency of hybridization among natural species [1,5]. Previous studies mostly focused on the phylogenetic study of Salix using chloroplast and ribosome sequences [55,56,57]. In the present study, we used single-copy orthologs to construct a phylogenetic tree. The tree consisted of six clades: Sect. Tetraspermae and Sect. Wilsonianae, Sect. Salix, Sect. Lindleyanae, Sect. Myrtilloides and Sect. Vetrix, Sect. Vimen, and Sect. Helix and Sect. Caesiae. The relationship of Salix sections is consistent with Wang’s taxonomical system [58]. Furthermore, our study showed that the divergence of genus Salix from genus Populus occurred about 33 Mya (Figure S2) during the period of the early Oligocene, which is consistent with the results based on the plastid sequence (34 Mya) [59], but later than a parallel study that also used a single-copy ortholog (48 Mya) [47]. In addition, the estimated time for the occurrence of Salix species diversity (24.88–10.79 Mya) was earlier than the study of Zhao et al. (17.6–4.6 Mya) [47], which may be due to the number of species and the high quality of the transcripts in our study. Our results support the increment of species diversity of willow in the Miocene Epoch.

4.3. Potential Role of Gene Family Expansion in Environmental Adaptation of Willows

Gene family size variation is an important source of genetic variation in organisms [60,61]. Gene families with high turnover rates often participate in the adaptive evolution of species [62,63]. Based on the gene families with high variability in family size, the willow species were assigned into four species clusters with different geographical distributions (Figure 5a). Meanwhile, the gene families were assigned into four groups (Figure 5a). Further analysis indicates that the patterns of gene expansion agree well with the geographical distributions.
The Salix species in cluster A were mainly distributed in Southwest China, which has a complex topography with a wide range of plateau and mountainous areas. Among the species in cluster A, Salix souliei grows on alpine meadows or bare rocks at altitudes of 4200–4800 m [58]. Salix brachista, an endemic species of the Tibeto-Himalayan region, is mainly distributed at altitudes above 4000 m [16]. Ultraviolet (UV) radiation is one of the major abiotic stress factors in high-altitude regions. The enhancement of DNA repair-related functions is a key genetic characteristic of plants with resistance to UV stress [64,65,66]. Gene family expansions associated with DNA repair have emerged as a universal survival mechanism for high-altitude plants [67]. In our analysis, genes in processes of DNA repair, cellular response to DNA damage stimuli, and DNA recombination were enriched in the genes of group 1, which are expanded in willow species from southwestern China.

4.4. Relationship between Geographical Characteristics and Expression Patterns of Orthologs

Plants respond to changes in the external environment by activating molecular pathways. To compare gene expressions in Salix species from different geographical regions, we identified differentially expressed genes among them using transcriptome analysis based on orthologous genes. Our analysis indicated that genes involved in pollination and reproduction were enriched in gene sets that were highly expressed in cluster A, and genes in the citrate cycle and glycine, the serine and threonine metabolism, and the cutin and wax biosynthesis pathways were enriched in gene sets that were highly expressed in cluster C. The high-altitude environment could affect the reproduction processes of plants [66,68]. The highly expressed genes in pollination and reproduction would contribute to adaptation in regions with a short time window for growth and reproduction, such as the original growth environments of the willows in cluster A.
Increased metabolic capacity can help plants survive under cold stress, and transcriptome analysis showed that the metabolic levels of carbohydrates in plants under chilling stress were significantly induced [69]. Differential expression of genes involved in the glycine, serine, and threonine metabolic pathways under chilling stress were also observed in winter rapeseed [70] and cucumbers [71]. Wax on the surface of leaves can reduce cold damage in chilling environments [72]. Genes that were highly expressed in willow species from Northeast China could improve the adaptation of trees through adjustments of diverse metabolic pathways.

5. Conclusions

The pan-transcriptome analysis provides an excellent opportunity to investigate the phylogeny and genetic diversity of willow species. In our study, the transcriptomes of 16 willow species were assembled, followed by the identification of core, shell, and cloud genes among these species. The phylogenetic tree constructed using all single-copy genes exhibits the evolutionary relationship of willow species from diverse sections. The diversity of gene family size and gene expression levels among the studied species are closely associated with their geographical distributions. Our analyses provide insights into the adaptations of willow species to diverse environments and genetic resources to improve the tolerance of trees, including willows, through tree breeding and other biological techniques, such as genome editing.

Supplementary Materials

The following supporting information can be downloaded at https://www.mdpi.com/article/10.3390/f14061182/s1: Figure S1: Gene family numbers of pan-transcriptome and functional enrichment analysis. (a) Numbers of gene families in the pan- and core transcriptomes with increasing species numbers. (b) The top six enriched KEGG pathways of the core, shell, and cloud gene families. (c, d) The top six enriched molecular function (c) and cellular component (d) terms of the core, shell, and cloud gene families from GO enrichment analysis; Figure S2: Phylogenetic tree with estimated divergence times (million years ago). Three node calibrations (red number) were defined by the TimeTree database (http://www.timetree.org/, accessed on 2 October 2022); Figure S3: Clustering analysis of willow species. (a) Hierarchical clustering of 16 Salix species using 2966 high-variability gene families. (B) KEGG pathways significantly enriched in different groups of gene families. (c,d) GO terms significantly enriched in gene family group2 (c) and group3 (d); Table S1: Summary of the RNA-seq data of 16 Salix species; Table S2: Quality control of the 16 Salix species’ RNA-seq data; Table S3: Transcriptome assembly of 16 Salix species; Table S4: Completeness evaluation of the 16 Salix species’ transcriptomes; Table S5: Transcriptome annotation of 16 Salix species; Table S6: Presumptive SSRs among 16 Salix species transcriptomes using MISA; Table S7: TFs among the 16 Salix species’ transcriptomes by using iTAK; Table S8: Summary of the gene families of 16 Salix species identified; Table S9: The proportion of core, disposable, and specific transcripts/genes in each Salix species; Table S10: Classification of gene families into high-, medium-, and low-variability categories; Table S11: Significantly enriched GO items in high-, medium-, and low-variability families; Table S12: The main geographic distribution of the 16 Salix species; Table S13: Gene families with significant size variation (ANOVA: p value < 0.05) and their annotation; Table S14: Orthologous genes with differential expressions (p adjust < 0.05) and their annotation.

Author Contributions

L.X. and T.Y. conceived and designed the experiments. Z.Y. and L.X. wrote the paper. Z.Y., L.C., Y.G. and X.D. performed data analysis. All authors have read and agreed to the published version of the manuscript.

Funding

This work was supported by the National Natural Science Foundation of China (32171826 to L.X.) and the Key Research and Development Project of Jiangsu Province, China (BE2021366 to T.Y.).

Data Availability Statement

All sequencing reads generated during this study are available in the SRA database with the BioProject accession PRJNA926477. SRA accession numbers for each sequenced dataset are listed in Table S1.

Conflicts of Interest

The authors declare no conflict of interest.

References

  1. Argus, G.W. The genus Salix (Salicaceae) in southeastern United States. Am. Soc. Plant Taxon. 1986, 9, 1–170. [Google Scholar] [CrossRef]
  2. Tawfeek, N.; Mahmoud, M.F.; Hamdan, D.I.; Sobeh, M.; Farrag, N.; Wink, M.; El-Shazly, A.M. Phytochemistry, pharmacology and medicinal uses of plants of the genus Salix: An updated review. Front. Pharmacol. 2021, 12, 593856. [Google Scholar] [CrossRef] [PubMed]
  3. Flora of North America Editorial Commite (Ed.) Flora of North America North of Mexico, Vol 7; Oxford University Press: New York, NY, USA, 2010. [Google Scholar]
  4. Argus, G.W. Infrageneric classification of Salix (Salicaceae) in the new world. Syst. Bot. Monogr. 1997, 52, 1–121. [Google Scholar] [CrossRef]
  5. Skvortsov, A.K. Willows of Russia and Adjacent Countries: Taxonomical and Geographical Revision; University of Joensuu: Joensuu, Finland, 1999. [Google Scholar]
  6. Warmiński, K.; Stolarski, M.J.; Gil, Ł.; Krzyżaniak, M. Willow bark and wood as a source of bioactive compounds and bioenergy feedstock. Ind. Crops Prod. 2021, 171, 113976. [Google Scholar] [CrossRef]
  7. Keoleian, G.A.; Volk, T.A. Renewable energy from willow biomass crops: Life cycle energy, environmental and economic performance. BPTS 2005, 24, 385–406. [Google Scholar] [CrossRef]
  8. Kuzovkina, Y.A.; Martin, W.; Marta, A.R.; John, C.; Sarah, H.; Ian, M.; Angelas, K.; Sviatlana, T.; Michel, L. Salix: Botany and Global Horticulture. Hortic. Rev. 2007, 34, 447–489. [Google Scholar] [CrossRef]
  9. Richardson, J.; Isebrands, J.G.; Ball, J.B. Ecology and physiology of poplars and willows. In Poplars and Willows: Trees for Society and the Environment; Richardson, J., Isebrands, J.G., Eds.; The Food and Agriculture Organization of United Nations and CABI: Rome, Italy, 2014; pp. 92–123. [Google Scholar] [CrossRef]
  10. Suda, Y.; Argus, G.W. Chromosome numbers of some north American Salix. Brittonia 1968, 20, 191–197. [Google Scholar] [CrossRef]
  11. Barcaccia, G.; Meneghetti, S.; Lucchin, M.; de-Jong, H. Genetic segregation and genomic hybridization patterns support an allotetraploid structure and disomic inheritance for Salix species. Diversity 2014, 6, 633–651. [Google Scholar] [CrossRef] [Green Version]
  12. Wei, S.; Yang, Y.; Yin, T. The chromosome-scale assembly of the willow genome provides insight into Salicaceae genome evolution. Hortic. Res. 2020, 7, 45. [Google Scholar] [CrossRef] [Green Version]
  13. Almeida, P.; Proux-Wera, E.; Churcher, A.; Soler, L.; Dainat, J.; Pucholt, P.; Nordlund, J.; Martin, T.; Ronnberg-Wastljung, A.C.; Nystedt, B.; et al. Genome assembly of the basket willow, Salix viminalis, reveals earliest stages of sex chromosome expansion. BMC Biol. 2020, 18, 78. [Google Scholar] [CrossRef]
  14. Zhang, J.; Yuan, H.; Li, Y.; Chen, Y.; Liu, G.; Ye, M.; Yu, C.; Lian, B.; Zhong, F.; Jiang, Y.; et al. Genome sequencing and phylogenetic analysis of allotetraploid Salix matsudana Koidz. Hortic. Res. 2020, 7, 201. [Google Scholar] [CrossRef] [PubMed]
  15. He, L.; Jia, K.H.; Zhang, R.G.; Wang, Y.; Shi, T.L.; Li, Z.C.; Zeng, S.W.; Cai, X.J.; Wagner, N.D.; Horandl, E.; et al. Chromosome-scale assembly of the genome of Salix dunnii reveals a male-heterogametic sex determination system on chromosome 7. Mol. Ecol. Resour. 2021, 21, 1966–1982. [Google Scholar] [CrossRef] [PubMed]
  16. Chen, J.H.; Huang, Y.; Brachi, B.; Yun, Q.Z.; Zhang, W.; Lu, W.; Li, H.N.; Li, W.Q.; Sun, X.D.; Wang, G.Y.; et al. Genome-wide analysis of Cushion willow provides insights into alpine plant divergence in a biodiversity hotspot. Nat. Commun. 2019, 10, 5230. [Google Scholar] [CrossRef] [PubMed] [Green Version]
  17. Bayer, P.E.; Golicz, A.A.; Scheben, A.; Batley, J.; Edwards, D. Plant pan-genomes are the new reference. Nat. Plants 2020, 6, 914–920. [Google Scholar] [CrossRef] [PubMed]
  18. Marroni, F.; Pinosio, S.; Morgante, M. Structural variation and genome complexity: Is dispensable really dispensable? Curr. Opin. Plant Biol. 2014, 18, 31–36. [Google Scholar] [CrossRef] [PubMed]
  19. Tettelin, H.; Masignani, V.; Cieslewicz, M.J.; Donati, C.; Medini, D.; Ward, N.L.; Angiuoli, S.V.; Crabtree, J.; Jones, A.L.; Durkin, A.S.; et al. Genome analysis of multiple pathogenic isolates of Streptococcus agalactiae: Implications for the microbial “pan-genome”. Proc. Natl. Acad. Sci. USA 2005, 102, 13950–13955. [Google Scholar] [CrossRef] [PubMed] [Green Version]
  20. Gao, L.; Gonda, I.; Sun, H.; Ma, Q.; Bao, K.; Tieman, D.M.; Burzynski-Chang, E.A.; Fish, T.L.; Stromberg, K.A.; Sacks, G.L.; et al. The tomato pan-genome uncovers new genes and a rare allele regulating fruit flavor. Nat. Genet. 2019, 51, 1044–1051. [Google Scholar] [CrossRef]
  21. Li, H.; Wang, S.; Chai, S.; Yang, Z.; Zhang, Q.; Xin, H.; Xu, Y.; Lin, S.; Chen, X.; Yao, Z.; et al. Graph-based pan-genome reveals structural and sequence variations related to agronomic traits and domestication in cucumber. Nat. Commun. 2022, 13, 682. [Google Scholar] [CrossRef]
  22. Zhao, Q.; Feng, Q.; Lu, H.; Li, Y.; Wang, A.; Tian, Q.; Zhan, Q.; Lu, Y.; Zhang, L.; Huang, T.; et al. Pan-genome analysis highlights the extent of genomic variation in cultivated and wild rice. Nat. Genet. 2018, 50, 278–284. [Google Scholar] [CrossRef] [Green Version]
  23. Tao, Y.; Luo, H.; Xu, J.; Cruickshank, A.; Zhao, X.; Teng, F.; Hathorn, A.; Wu, X.; Liu, Y.; Shatte, T.; et al. Extensive variation within the pan-genome of cultivated and wild sorghum. Nat. Plants 2021, 7, 766–773. [Google Scholar] [CrossRef]
  24. Gonzalez, E.; Brereton, N.J.; Marleau, J.; Guidi Nissim, W.; Labrecque, M.; Pitre, F.E.; Joly, S. Meta-transcriptomics indicates biotic cross-tolerance in willow trees cultivated on petroleum hydrocarbon contaminated soil. BMC Plant Biol. 2015, 15, 246. [Google Scholar] [CrossRef] [PubMed] [Green Version]
  25. Guo, N.; Fan, L.; Cao, Y.; Ling, H.; Xu, G.; Zhou, J.; Chen, Q.; Tao, J. Comparison of two willow genotypes reveals potential roles of iron-regulated transporter 9 and heavy-metal ATPase 1 in cadmium accumulation and resistance in Salix suchowensis. Ecotoxicol. Environ. Saf. 2022, 244, 114065. [Google Scholar] [CrossRef] [PubMed]
  26. Wilkerson, D.G.; Taskiran, B.; Carlson, C.H.; Smart, L.B. Mapping the sex determination region in the Salix F1 hybrid common parent population confirms a ZW system in six diverse species. G3 2022, 12, jkac071. [Google Scholar] [CrossRef] [PubMed]
  27. Bolger, A.M.; Lohse, M.; Usadel, B. Trimmomatic: A flexible trimmer for Illumina sequence data. Bioinformatics 2014, 30, 2114–2120. [Google Scholar] [CrossRef] [Green Version]
  28. Grabherr, M.G.; Haas, B.J.; Yassour, M.; Levin, J.Z.; Thompson, D.A.; Amit, I.; Adiconis, X.; Fan, L.; Raychowdhury, R.; Zeng, Q.; et al. Full-length transcriptome assembly from RNA-Seq data without a reference genome. Nat. Biotechnol. 2011, 29, 644–652. [Google Scholar] [CrossRef] [Green Version]
  29. Fu, L.; Niu, B.; Zhu, Z.; Wu, S.; Li, W. CD-HIT: Accelerated for clustering the next-generation sequencing data. Bioinformatics 2012, 28, 3150–3152. [Google Scholar] [CrossRef]
  30. Simao, F.A.; Waterhouse, R.M.; Ioannidis, P.; Kriventseva, E.V.; Zdobnov, E.M. BUSCO: Assessing genome assembly and annotation completeness with single-copy orthologs. Bioinformatics 2015, 31, 3210–3212. [Google Scholar] [CrossRef] [Green Version]
  31. Buchfink, B.; Xie, C.; Huson, D.H. Fast and sensitive protein alignment using DIAMOND. Nat. Methods 2015, 12, 59–60. [Google Scholar] [CrossRef]
  32. Yu, G.; Wang, L.G.; Han, Y.; He, Q.Y. ClusterProfiler: An R package for comparing biological themes among gene clusters. OMICS 2012, 16, 284–287. [Google Scholar] [CrossRef]
  33. Beier, S.; Thiel, T.; Munch, T.; Scholz, U.; Mascher, M. MISA-web: A web server for microsatellite prediction. Bioinformatics 2017, 33, 2583–2585. [Google Scholar] [CrossRef] [Green Version]
  34. Zheng, Y.; Jiao, C.; Sun, H.; Rosli, H.G.; Pombo, M.A.; Zhang, P.; Banf, M.; Dai, X.; Martin, G.B.; Giovannoni, J.J.; et al. iTAK: A program for genome-wide prediction and classification of plant transcription factors, transcriptional regulators, and protein kinases. Mol. Plant 2016, 9, 1667–1670. [Google Scholar] [CrossRef] [PubMed] [Green Version]
  35. Emms, D.M.; Kelly, S. OrthoFinder: Phylogenetic orthology inference for comparative genomics. Genome Biol. 2019, 20, 238. [Google Scholar] [CrossRef] [PubMed] [Green Version]
  36. Kazutaka, K.; Kazuharu, M.; Kei-ichi, K.; Takashi, M. MAFFT: A novel method for rapid multiple sequence alignment based on fast Fourier transform. Nucleic Acids Res. 2002, 30, 3059–3066. [Google Scholar] [CrossRef] [Green Version]
  37. Capella-Gutierrez, S.; Silla-Martinez, J.M.; Gabaldon, T. TrimAl: A tool for automated alignment trimming in large-scale phylogenetic analyses. Bioinformatics 2009, 25, 1972–1973. [Google Scholar] [CrossRef] [PubMed] [Green Version]
  38. Stamatakis, A. RAxML version 8: A tool for phylogenetic analysis and post-analysis of large phylogenies. Bioinformatics 2014, 30, 1312–1313. [Google Scholar] [CrossRef] [Green Version]
  39. Michael, J.S. R8s: Inferring absolute rates of molecular evolution and divergence times in the absence of a molecular clock. Bioinform. Appl. Note 2003, 19, 301–302. [Google Scholar]
  40. De-Bie, T.; Cristianini, N.; Demuth, J.P.; Hahn, M.W. CAFE: A computational tool for the study of gene family evolution. Bioinformatics 2006, 22, 1269–1271. [Google Scholar] [CrossRef] [Green Version]
  41. Altschul, S.F.; Gish, W.; Miller, W.; Myers, E.W.; Lipman, D.J. Basic local alignment search tool. J. Mol. Biol. 1990, 215, 403–410. [Google Scholar] [CrossRef]
  42. Li, B.; Dewey, C.N. RSEM: Accurate transcript quantification from RNA-Seq data with or without a reference genome. BMC Bioinform. 2011, 12, 323. [Google Scholar] [CrossRef] [Green Version]
  43. Love, M.I.; Huber, W.; Anders, S. Moderated estimation of fold change and dispersion for RNA-seq data with DESeq2. Genome Biol. 2014, 15, 550. [Google Scholar] [CrossRef] [Green Version]
  44. Li, Y.H.; Zhou, G.; Ma, J.; Jiang, W.; Jin, L.G.; Zhang, Z.; Guo, Y.; Zhang, J.; Sui, Y.; Zheng, L.; et al. De novo assembly of soybean wild relatives for pan-genome analysis of diversity and agronomic traits. Nat. Biotechnol. 2014, 32, 1045–1052. [Google Scholar] [CrossRef] [PubMed] [Green Version]
  45. Gordon, S.P.; Contreras-Moreira, B.; Woods, D.P.; Des Marais, D.L.; Burgess, D.; Shu, S.Q.; Stritt, C.; Roulin, A.C.; Schackwitz, W.; Tyler, L.; et al. Extensive gene content variation in the Brachypodium distachyon pan-genome correlates with population structure. Nat. Commun. 2017, 8, 2184. [Google Scholar] [CrossRef] [PubMed] [Green Version]
  46. Barcaccia, G.; Meneghetti, S.; Albertini, E.; Triest, L.; Lucchin, M. Linkage mapping in tetraploid willows: Segregation of molecular markers and estimation of linkage phases support an allotetraploid structure for Salix alba x Salix fragilis interspecific hybrids. Heredity 2003, 90, 169–180. [Google Scholar] [CrossRef]
  47. Zhao, Y.J.; Liu, X.Y.; Guo, R.; Hu, K.R.; Cao, Y.; Dai, F. Comparative genomics and transcriptomics analysis reveals evolution patterns of selection in the Salix phylogeny. BMC Genom. 2019, 20, 253. [Google Scholar] [CrossRef] [Green Version]
  48. Bhatti, A.; Shah, F.S.; Azhar, J.; Ahmad, S.; John, P. Pan-transcriptomics and its applications. In Pan-Genomics: Applications, Challenges, and Future Prospects; Soares, S.C., Sandip, T., Debmalya, B., Vasco, A., Eds.; Academic Press: Cambridge, MA, USA, 2020; pp. 343–356. [Google Scholar] [CrossRef]
  49. Pucholt, P.; Sjodin, P.; Weih, M.; Ronnberg-Wastljung, A.C.; Berlin, S. Genome-wide transcriptional and physiological responses to drought stress in leaves and roots of two willow genotypes. BMC Plant Biol. 2015, 15, 244. [Google Scholar] [CrossRef] [Green Version]
  50. Wang, Y.M.; Yang, Q.; Xu, H.; Liu, Y.J.; Yang, H.L. Physiological and transcriptomic analysis provide novel insight into cobalt stress responses in willow. Sci. Rep. 2020, 10, 2308. [Google Scholar] [CrossRef] [Green Version]
  51. Xu, D.P.; Li, J.Y.; Zhu, T.H.; Yang, H.J.; Zhuo, Z.H. Comparative transcriptome analysis of Salix cupularis under drought stress. Glob. Ecol. Conserv. 2021, 27, e01532. [Google Scholar] [CrossRef]
  52. Yanitch, A.; Brereton, N.J.B.; Gonzalez, E.; Labrecque, M.; Joly, S.; Pitre, F.E. Transcriptomic response of purple willow (Salix purpurea) to arsenic stress. Front. Plant Sci. 2017, 8, 1115. [Google Scholar] [CrossRef] [Green Version]
  53. Lin, L.; Wang, F.; Wu, M.; Wang, S. ddRAD Sequencing-Based Scanning of Genetic Variants in Sargassum fusiforme. J. Mar. Sci. Eng. 2022, 10, 958. [Google Scholar] [CrossRef]
  54. Verma, P.; Tiwari, P.; Singh, R.; Raghubanshi, A.S. Effect of rainfall variability on tree phenology in moist tropical deciduous forests. Environ. Monit. Assess. 2022, 194, 537. [Google Scholar] [CrossRef]
  55. Barkalov, V.Y.; Kozyrenko, M.M. Phylogenetic relationships of Salix L. subg. Salix species (Salicaceae) according to sequencing data of intergenic spacers of the chloroplast genome and ITS rDNA. Russ. J. Genet. 2014, 50, 828–837. [Google Scholar] [CrossRef]
  56. Zhou, J.; Jiao, Z.; Guo, J.; Wang, B.S.; Zheng, J. Complete chloroplast genome sequencing of five Salix species and its application in the phylogeny and taxonomy of the genus. Mitochondrial DNA B Resour. 2021, 6, 2348–2352. [Google Scholar] [CrossRef] [PubMed]
  57. Hardig, T.M.; Anttila, C.K.; Brunsfeld, S.J. A phylogenetic analysis of Salix (Salicaceae) based on matk and ribosomal DNA sequence data. J. Bot. 2010, 2010, 197696. [Google Scholar] [CrossRef] [Green Version]
  58. Fang, Z.; Zhao, S.; Skvortsov, A.K. Salicaceae. In Flora of China; Wu, Z.Y., Raven, P.H., Hong, D.Y., Eds.; Science Press & Missouri Botanical Garden Press: Beijing, China, 1999. [Google Scholar]
  59. Li, M.M.; Wang, D.Y.; Zhang, L.; Kang, M.H.; Lu, Z.Q.; Zhu, R.B.; Mao, X.X.; Xi, Z.X.; Tao, M. Intergeneric relationships within the family Salicaceae s.l. based on plastid phylogenomics. Int. J. Mol. Sci. 2019, 20, 3788. [Google Scholar] [CrossRef] [Green Version]
  60. Guo, Y.L. Gene family evolution in green plants with emphasis on the origination and evolution of Arabidopsis thaliana genes. Plant J. 2013, 73, 941–951. [Google Scholar] [CrossRef]
  61. Zmienko, A.; Samelak, A.; Kozlowski, P.; Figlerowicz, M. Copy number polymorphism in plant genomes. Theor. Appl. Genet. 2014, 127, 1–18. [Google Scholar] [CrossRef] [Green Version]
  62. Carretero-Paulet, L.; Librado, P.; Chang, T.H.; Ibarra-Laclette, E.; Herrera-Estrella, L.; Rozas, J.; Albert, V.A. High gene family turnover rates and gene space adaptation in the compact genome of the carnivorous plant Utricularia gibba. Mol. Biol. Evol. 2015, 32, 1284–1295. [Google Scholar] [CrossRef] [Green Version]
  63. Wang, P.; Moore, B.M.; Panchy, N.L.; Meng, F.; Lehti-Shiu, M.D.; Shiu, S.H. Factors influencing gene family size variation among related species in a plant family, Solanaceae. Genome Biol. Evol. 2018, 10, 2596–2613. [Google Scholar] [CrossRef] [Green Version]
  64. Geng, Y.; Guan, Y.; Qiong, L.; Lu, S.; An, M.; Crabbe, M.J.C.; Qi, J.; Zhao, F.; Qiao, Q.; Zhang, T. Genomic analysis of field pennycress (Thlaspi arvense) provides insights into mechanisms of adaptation to high elevation. BMC Biol. 2021, 19, 143. [Google Scholar] [CrossRef]
  65. Xu, L.; Cao, M.; Wang, Q.; Xu, J.; Liu, C.; Ullah, N.; Li, J.; Hou, Z.; Liang, Z.; Zhou, W.; et al. Insights into the plateau adaptation of Salvia castanea by comparative genomic and WGCNA analyses. J. Adv. Res. 2022, 42, 221–235. [Google Scholar] [CrossRef]
  66. Zhang, X.; Sun, Y.; Landis, J.B.; Shen, J.; Zhang, H.; Kuang, T.; Sun, W.; Sun, J.; Tiamiyu, B.B.; Deng, T.; et al. Transcriptomes of Saussurea (Asteraceae) provide insights into high-altitude adaptation. Plants 2021, 10, 1715. [Google Scholar] [CrossRef] [PubMed]
  67. Zhang, T.; Qiao, Q.; Novikova, P.Y.; Wang, Q.; Yue, J.; Guan, Y.; Ming, S.; Liu, T.; De, J.; Liu, Y.; et al. Genome of Crucihimalaya himalaica, a close relative of Arabidopsis, shows ecological adaptation to high altitude. Proc. Natl. Acad. Sci. USA 2019, 116, 7137–7146. [Google Scholar] [CrossRef] [Green Version]
  68. Xie, D.F.; Yu, Y.; Wen, J.; Huang, J.; Chen, J.P.; Li, J.; Zhou, S.D.; He, X.J. Phylogeny and highland adaptation of Chinese species in Allium section Daghestanica (Amaryllidaceae) revealed by transcriptome sequencing. Mol. Phylogenet. Evol. 2020, 146, 106737. [Google Scholar] [CrossRef]
  69. Lai, Z.F.; Yao, Y.F.; Lin, B.Z.; Lian, D.M.; Hong, J.J. Analysis of transcriptome response to low temperature stress in mesem-bryanthemum crystallinum Linn. Mol. Plant Breed. 2021, 19, 7348–7358. [Google Scholar] [CrossRef]
  70. Niu, Z.X.; Liu, L.J.; Pu, Y.Y.; Ma, L.; Wu, J.Y.; Hu, F.D.; Fang, Y.; Li, X.C.; Sun, W.C.; Wang, W.T.; et al. iTRAQ-based quantitative proteome analysis insights into cold stress of Winter Rapeseed (Brassica rapa L.) grown in the field. Sci. Rep. 2021, 11, 23434. [Google Scholar] [CrossRef] [PubMed]
  71. Liu, W.; Wang, Q.; Zhang, R.; Liu, M.; Wang, C.; Liu, Z.; Xiang, C.; Lu, X.; Zhang, X.; Li, X.; et al. Rootstock-scion exchanging mRNAs participate in the pathways of amino acids and fatty acid metabolism in cucumber under early chilling stress. Hortic. Res. 2022, 9, uhac031. [Google Scholar] [CrossRef] [PubMed]
  72. Gong, X.X.; Yan, B.Y.; Hu, J.; Yang, C.P.; Li, Y.J.; Liu, J.P.; Liao, W.B. Transcriptome profiling of rubber tree (Hevea brasiliensis) discovers candidate regulators of the cold stress response. Genes Genom. 2018, 40, 1181–1197. [Google Scholar] [CrossRef]
Figure 1. Transcriptome assembly and annotation for 16 willow species. (a,b) Comparison of average length (a) and N50 (b) between preliminarily transcript assemblies (PTAs) and representative transcript assemblies (RTAs). (c) BUSCO evaluation showing the completeness of transcript assembly. The ratios of three categories, complete (Comp), fragmented (Frag), and missing (Miss), are shown using a bar plot. (d) Annotation of willow transcriptome using seven public protein databases. (e) SSRs identified in the transcriptome of the 16 willow species. The pie chart shows the proportion of different SSRs, including dinucleotide (DI), trinucleotide (Tri), tetranucleotide (Tetra), pentanucleotide (Penta), and hexanucleotide (Hexa). (f) Transcription factors (TFs) identified in willow transcriptome. Boxplot shows the distribution of gene numbers in each TF family across the 16 species. The red dashed line represents the average value (50) of all TF families.
Forests 14 01182 g001
Figure 2. Characterization of the pan-transcriptome. (a) Composition of gene families in pan-transcriptome. The histogram shows the number of gene families with different frequencies in the 16 species. The pie chart shows the proportion of core, shell, and cloud gene families. (b) The top 10 GO terms in the biological process of the core, shell, and cloud gene families. (c) The proportion of core, shell, and cloud transcripts/genes in each willow species. (d) Comparison of nucleotide diversity between core and shell gene families (p value = 0.0001273, Wilcoxon Signed Rank Test). The black dot represents the average value. (e) Comparison of dN/dS between core and shell gene families (p value < 2.2 × 10⁻¹⁶, Wilcoxon Signed Rank Test). The black dot represents the average value.
Forests 14 01182 g002
Figure 3. The Phylogenetic tree of the 16 willow species. Significantly (p value ≤ 0.05) expanded and contracted gene families are indicated in red and black numbers, respectively. The species of same sections are shown in same colors. The branches with different bootstrap values are marked with circles, triangles, or stars to show the confidence level. Numbers in brackets indicate the number of species in each section.
Forests 14 01182 g003
Figure 4. The characteristics of variations in gene family size. (a) Distribution of the CVs (Coefficients of Variation) of gene family size in 29 bins. The bins were determined by the total gene family size of all 16 species. Red and blue points represent the 15th (P15) and 85th (P85) percentiles of each bin. The pink shade represents the region between the 15th and 85th percentile. The empty dots indicates outlier values. (b) The proportion of high (CV > P85), medium (P15 < CV < P85), and low (CV < P15th) variation gene families. (c) Significantly enriched GO terms of gene families with high variability in family size.
Forests 14 01182 g004
Figure 5. Clustering of gene families based on gene family size. (a) The heat map was generated using 220 gene families of Salix species. Columns represent different willow species, and rows represent gene families. (b,c) GO terms significantly enriched in gene family groups 1 (b) and 4 (c).
Forests 14 01182 g005
Figure 6. Clustering of orthologous genes based on gene expression levels. (a) The heat map was generated using the 644 orthologous genes of Salix species. Columns represent different willow species, and rows represent orthologous genes. (b) GO and KEGG enrichment analyses of orthologous genes in four sets. The GO terms of biological processes are labeled with B, and the KEGG pathways are labeled with K.
Forests 14 01182 g006
Table 1. Summary statistics of the 16 assembled Salix transcripts.
SpeciesSectionNumber of ReadsAssembled Transcript Base (bp)Number of TranscriptsAverage Length (bp)N50 (bp)
S. integra aCaesiae90,289,30038,665,40822,69317042131
S. matsudana aSalix78,431,90041,673,65029,19214282003
S. babylonica aSalix80,092,91441,933,68830,27813851966
S. myrtilloides aMyrtilloides77,083,22039,406,20123,05517092102
S. nankingensis aWilsonianae76,977,41440,332,55421,83918472333
S. psammophila aHelix79,908,59440,737,20324,35116732208
S. viminalis aVimen79,311,06238,145,27822,82916712054
S. wallichianaVetrix53,957,57831,552,15723,62213361799
S. tetraspermaTetraspermae53,257,84234,366,06426,65412891751
S. soulieiLindleyanae52,893,68431,923,83523,80713411806
S. brachistaLindleyanae122,921,91048,523,65929,54016432421
S. suchowensisHelix96,017,50240,259,40622,31718042357
S. dunniiWilsonianae89,665,69642,538,90622,00019342576
S. purpureaHelix157,916,44060,455,26033,29518162499
S. udensisVimen88,904,15839,661,86523,00417242242
S. koriyanagiHelix88,098,19039,836,06623,80816732223
a Sequenced in this study.
Disclaimer/Publisher’s Note: The statements, opinions and data contained in all publications are solely those of the individual author(s) and contributor(s) and not of MDPI and/or the editor(s). MDPI and/or the editor(s) disclaim responsibility for any injury to people or property resulting from any ideas, methods, instructions or products referred to in the content.

