Article

A Structural Equation Model Suggests That Soil Physical Properties Had the Greatest Negative Influence on the Competition Index of Dominant Trees of Pinus sylvestris var. Mongolia

1
Research Institute of Forestry Chinese Academy of Forestry, Beijing 100091, China
2
Qinghai Gonghe Desert Ecosystem and Research Station, Gonghe 813005, China
3
Institute of Ecological Protection and Restoration, Chinese Academy of Forestry Sciences, Beijing 100091, China
*
Author to whom correspondence should be addressed.
Forests 2023, 14(6), 1191; https://doi.org/10.3390/f14061191
Submission received: 17 April 2023 / Revised: 4 June 2023 / Accepted: 7 June 2023 / Published: 8 June 2023
(This article belongs to the Section Forest Ecology and Management)

Abstract

:
This study was conducted in a Pinus sylvestris var. Mongolia plantation within the Xiaotaojiagou watershed of the Winter Olympic venues (Chongli competition area) to explore the influence of forest growth factors, soil physical properties, soil nutrients, and other factors on the competition index (CI) of dominant trees in the plantation. A 20 m × 20 m sample square was established every 300 m, and a total of 20 plots were set. The Hegyi single-tree competition index model and structural equation model (SEM) were used to analyze the dominant tree CI and its association with the forest growth factor, soil nutrient content, and soil physical properties. The CI of Pinus sylvestris var. Mongolia showed a decreasing trend with increases in the forest growth factor, the soil nutrient content, and the soil physical properties. Soil physical properties had the greatest influence on the CI, with a significant negative correlation (p < 0.05) and a total effect of −0.91. The results indicate that the competition index of dominant trees is sensitive to changes in soil physical and chemical properties as well as growth indicators such as diameter at breast height, tree height, and crown width of Pinus sylvestris var. mongolica.

1. Introduction

Competition refers to the interaction between two or more plant organisms for the same environmental resources and energy. The competition between plants and their coexistence have been extensively studied in ecological research [1]. It is one of the main forms of intraspecific and interspecific relationships between plants, and it affects community structure composition, system stability, and the maintenance of community species diversity [1]. Numerous studies have demonstrated that competition is influenced by both biotic and abiotic factors [2,3]. For example, Dou Xiaowen et al. [4] and Looney et al. [5] showed that forest competition was negatively correlated with forest growth. To express the intensity of competition between trees, the concept of a competition index has been proposed [6], which reflects the intensity of the competition between forest species and is used to express the relationship between the demand for surrounding environmental resources and forest growth. In addition, Chen Lixin et al. [2] found that the dominant tree CI was significantly correlated with the soil nitrogen (N), phosphorus (P), and potassium (K) contents within red pine plantations. Through a structural equation analysis, Wang Yan et al. [7] found that the most reliable and stable relationship was competition indices and distance between trees, followed by competition indices and distance between trees, whereas the relationship between competition indices and forest canopy was less accurate.
The competition index can be divided into a distance-independent competition index and a distance-related competition index [8]. Current competition index research mainly uses three models: (1) the Hegyi single-tree competition index model [9], (2) an improved single-tree competition index model [10], and (3) the Lotka-Volterra competition model [11]. Among them, the Hegyi single-tree competition index model includes information such as tree size, distance, and spatial distribution. It is simple and intuitive to use, and competition indices can be measured [10]. It can also effectively describe the relationship between forest growth and the growing space, and it better reflects intraspecific and interspecific competition relationships [12].
Studying the relationship between the CI of trees and their influencing factors is not only useful for understanding the evolutionary trend of a forest’s structure and dynamics, but it also reveals the development and succession processes of communities. Such information provides important guidance for the sustainable management of forests, the transformation of forest stands, and the restoration and reconstruction of degraded ecosystems. However, the factors influencing the forest competition index not only have a positive or negative effect on the CI, but there is also a certain causal relationship between the factors [7], and it is necessary to comprehensively consider the inter-relationship between these factors to describe the relationship between the CI and the influencing factors.
The Structural Equation Model (SEM) is a composite statistical analysis method and is one of the three major statistical developments of recent years [13]. It combines factor analysis and multiple regression analysis to simultaneously handle multiple variables, analyze complex multivariate relationships, consider measurement errors related to complex concepts, and establish relationships between variables, especially causal relationships [14]. SEM is a comprehensive statistical data analysis method that is based on conducting a variable covariance matrix analysis of the relationship between multivariate data [15]. The model represents the observed and latent variables (which cannot be directly measured) and the relationships between each variable in the path diagram. In this regard, it constructs a theoretical model, uses generalized least squares (GLS) to estimate model parameters, and uses multiple fit indices to study and evaluate the model together [16]. For example, Sanaei et al. [17] constructed structural equations for forest age, slope, tree species diversity, and forest multifunctional and individual functions to explore the influence of different drivers on multifunction. Wang Yan et al. [7] showed through structural equation analysis that the competition indicators related to forest distance in the spruce coniferous and broad-wide mixed forest in the Changbai Mountain forest area were relatively stable and reliable, followed by the competition indicators related to the relative size of the forest, and the competition indicators related to the forest canopy were more volatile. The model is constantly revised until the most satisfactory fitting degree is achieved, and a final model is then obtained. The model is divided into a measurement model and a structural model. In the structural model, latent variables are those that cannot be directly observed, and they are often estimated using explicit variables; therefore, the measurement model establishes a relationship between the latent and explicit variables. The model ultimately derives the relationship between quantitative factors and that between qualitative factors.
The terrain in the upper and lower reaches of the Xiaotaojiagou watershed is relatively flat within the region of the Winter Olympic venues (Chongli competition area), and the slope direction is set to the southeast. In this study, the Hegyi single-tree competition index model was used to analyze the relationship between the dominant tree competition index of Pinus sylvestris var. Mongolia and forest growth factors, soil nutrients, and soil physical properties in the small watersheds. SEM was used to establish a causal model representing the relationship between the dominant tree competition index and the forest growth factors, soil nutrients, and soil physical properties, in addition to determining the effect of the influence of tree growth factors, soil physicochemical properties, and other factors on the forest CI in Pinus sylvestris var. Mongolia plantations. By revealing the effects of site conditions and forest growth factors on the intraspecific competition of Pinus sylvestris var. Mongolia, this study aimed to provide a theoretical basis and reference for the conservation and management of Pinus sylvestris var. Mongolia and the maintenance and restoration of biodiversity in the Xiaotaojiagou Watershed of the Winter Olympic Venues (Chongli Competition Area).
Therefore, the main objectives of this study were to determine how the total effects of forest growth factors, soil nutrients, and soil physical properties change the competition index of dominant trees, which factors have the greatest impact, and the causal relationship between forest growth, soil nutrients, and soil physical properties.

2. Materials and Methods
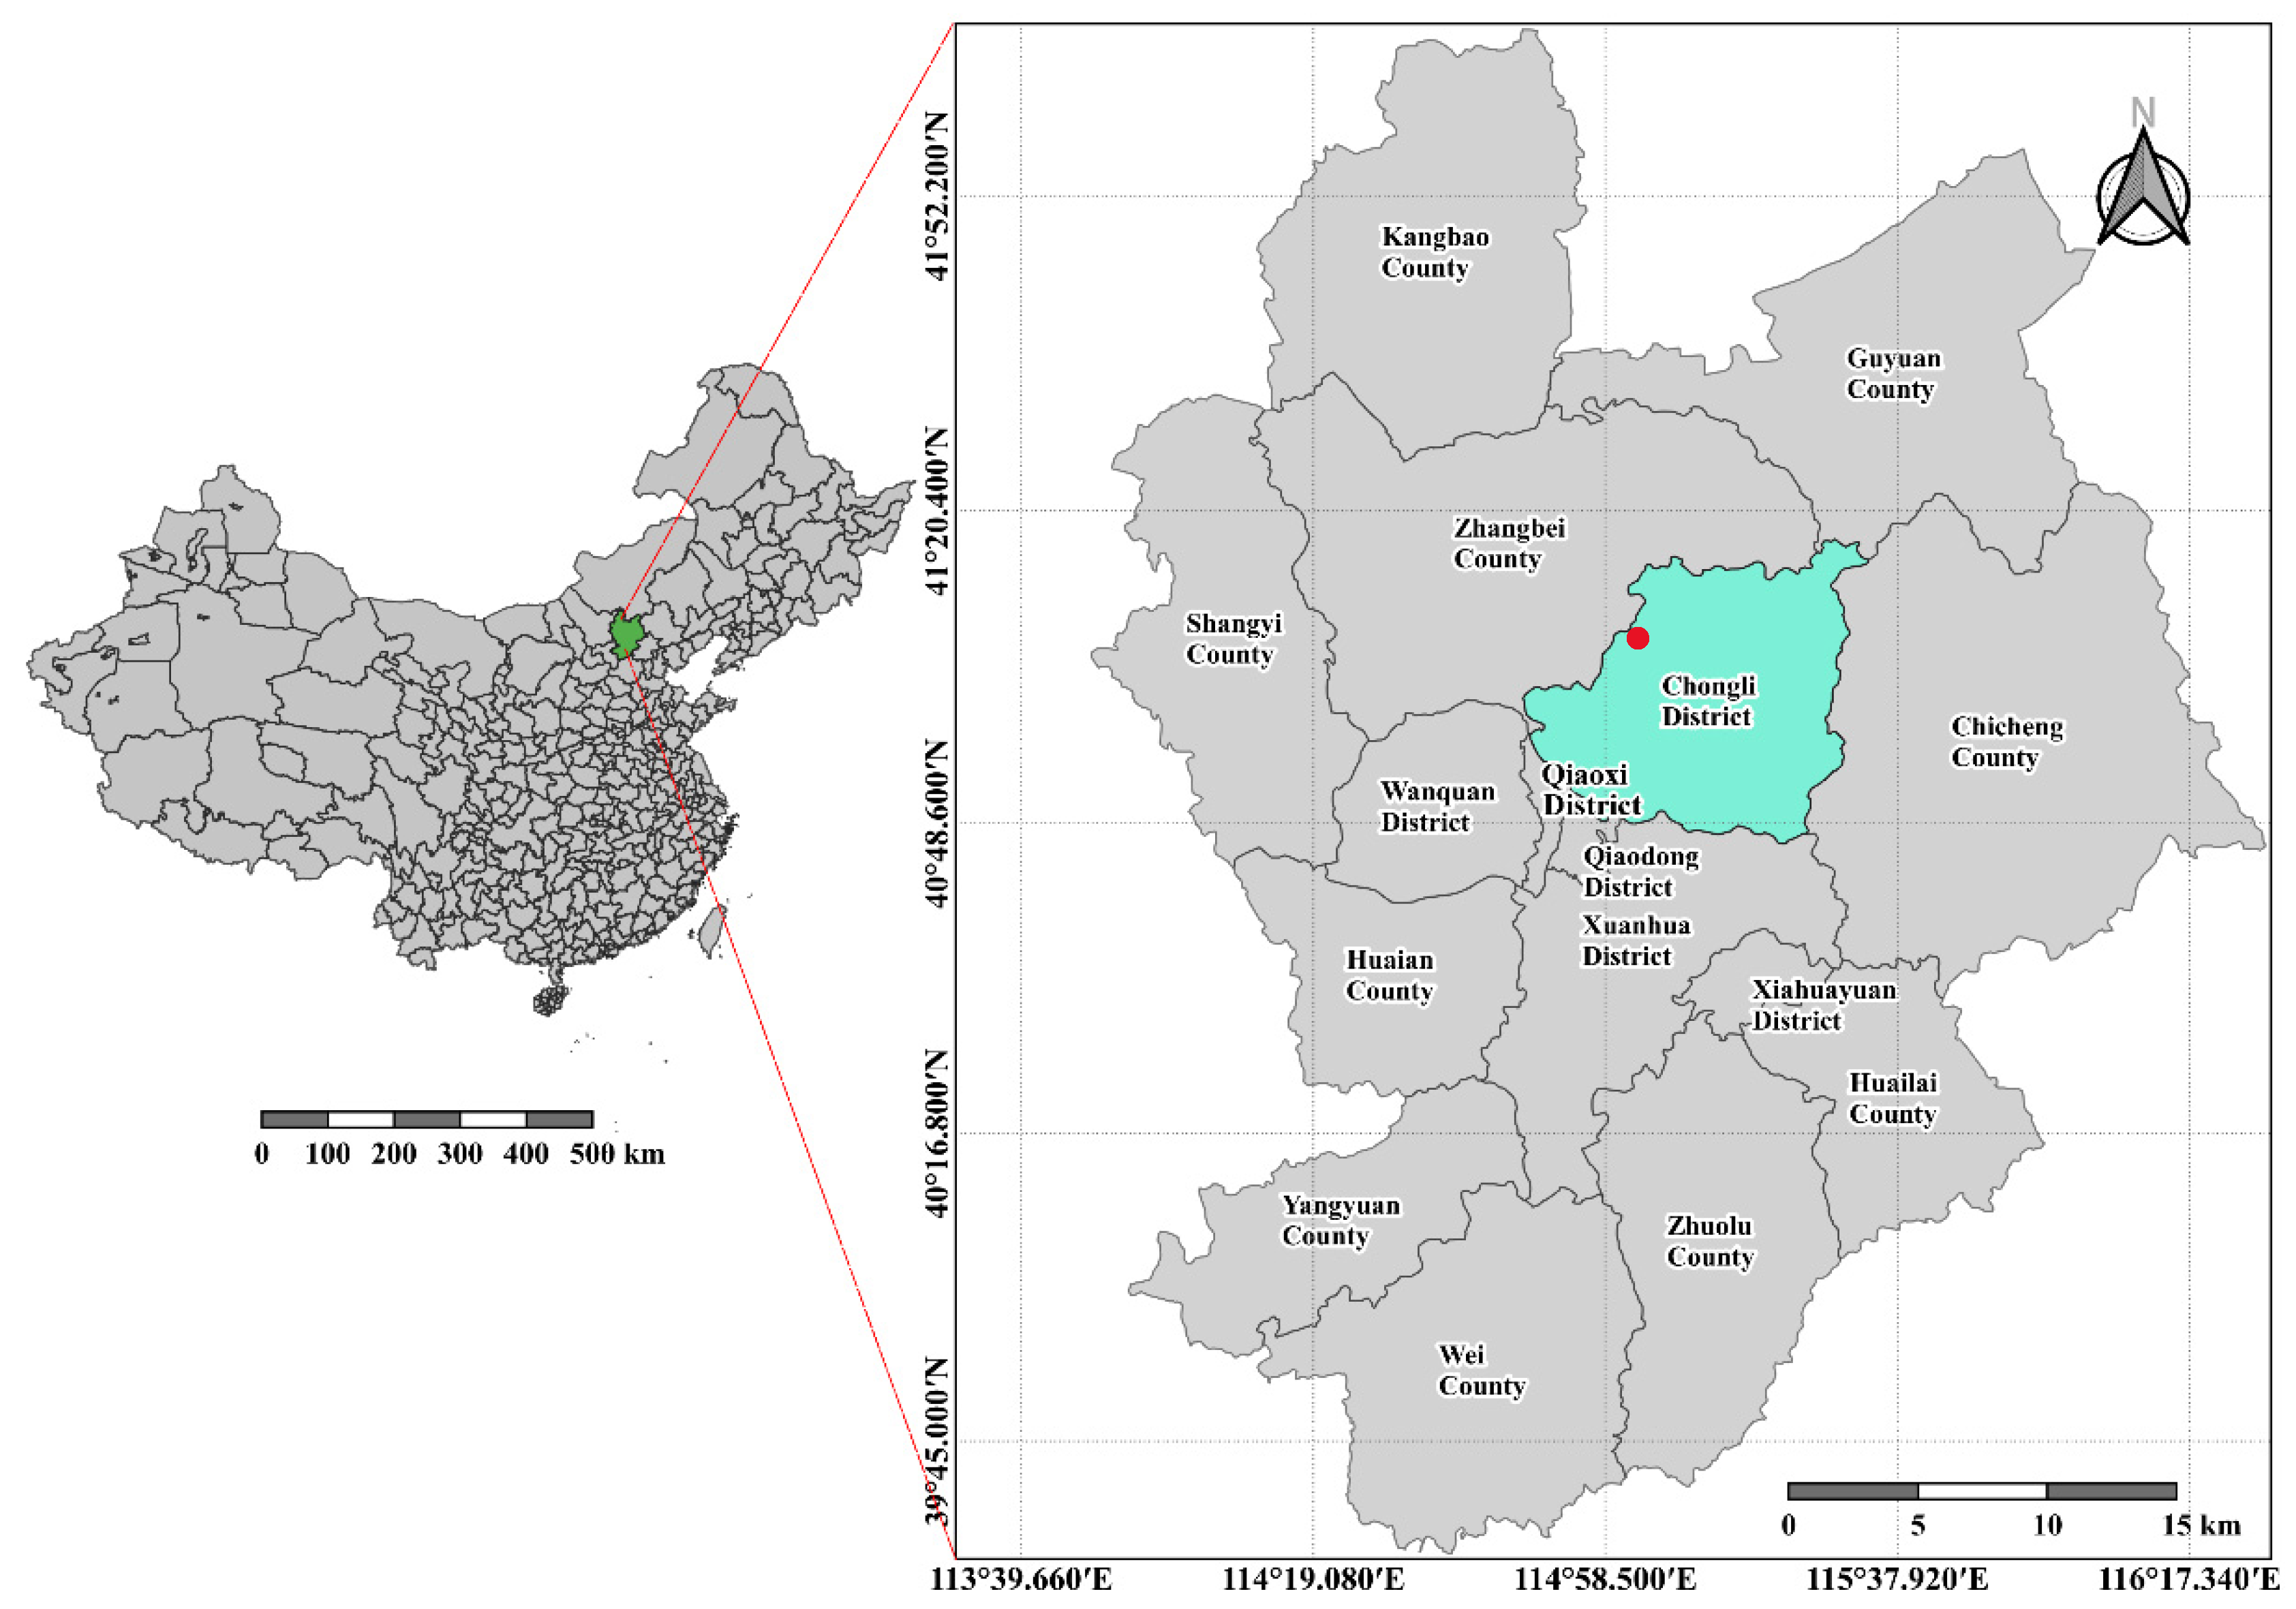
2.1. Study Location

The Winter Olympic venues (Chongli competition area) are located within the Xiaotaojiagou watershed in Chongli District, Zhangjiakou City, Northwest Hebei Province, within the upper reaches of the Qingshui River in northern China (115°02′–115°04′ E, 40°12′–41°08′ N). The topography and geomorphology are complex; the mountainous areas are earthy with poor slope erosion resistance; and the altitude ranges from 1200 m to 1500 m. The Xiaotaojiagou River Basin is located in a temperate subarid zone with an East Asian continental monsoon climate. The average temperature distribution is greatly affected by the topography; the average summer and winter temperatures are 19 °C and −12 °C, respectively. The landform is a transitional, mountainous area above and below the dam. Wild plants include sea buckthorn, bracken, bitter vegetables, mushrooms, yellow flowers, and peonies. The vegetation in the Xiaotaojiagou watershed is sparse, and the mountains are mostly barren with large areas of bare rock. These factors, combined with unreasonable reclamation and grazing practices, have seriously damaged the ecological environment of the area. A large number of conifer species (Pinus sylvestris var. Mongolia, Larch, and Pinus oleifera) in a mixed forest with shrubs have been artificially grown to restore and improve the ecological environment of the area since 2009 [18].
To assess the applicability of SEM, we decided to evaluate the small watersheds around the Winter Olympic venues; this area presents prominent ecological problems, such as soil erosion, in the area close to the Winter Olympic venues (such as Genting Ski Resort and Wanlong Ski Resort). This has occurred due to the low overall coverage of forest vegetation, the unscientific and reasonable structure and configuration of existing forest vegetation, the poor stability of forest stands, frequent human disturbance, and weak and scattered water and soil conservation engineering measures. The operational safety and normal operation of the Winter Olympic venues are thus threatened. To improve the local ecological environment and maintain the operational safety of the Winter Olympic venues, the Zhangjiakou Municipal Government of China predominantly grew Populus simonii and Pinus sylvestris var. Mongolia in artificial shelter forests [18]. The initial effect was remarkable, but after 2002, the local Populus simonii shelter forest began to degenerate and die, whereas the shelter forest of Pinus sylvestris var. Mongolia did not degrade [19]; therefore, Pinus sylvestris var. Mongolia was selected as the main species.

2.2. Sample Plot Setting and Investigation

Pinus sylvestris var. Mongolia is native to Daxing’anling, China. It is a shallow-rooted tree species that has strong cold tolerance and can grow at temperatures as low as −40 to −50 °C. It has minimal moisture requirements, strong stress resistance, a long life span, and provides good ecological and economic value; therefore, it is one of the main afforestation species that has been planted in the Sanbei Shelter Forest Afforestation Project. Field investigations were conducted in the Xiaotaojiagou watershed of Chongli District from upstream to downstream, and areas of relatively gentle terrain and relatively consistent internal topography were selected for sampling. Sampling plots measuring 20 m × 20 m were established at intervals of 300 m for a total of 20 m (Figure 1). The coordinates of each Pinus sylvestris var. Mongolia tree with a diameter at breast height (DBH) greater than 3 cm in each sample square were measured using a total station (TOPCON-GIS-602 AF) and taking the lower left side of the sample as the origin. The DBH of Pinus sylvestris var. Mongolia was measured using a measure of the chest diameter of the tree, and growth indicators (such as east-west crown width, north-south crown width, and tree height) were measured using a tape measure.

2.3. Selection of Dominant Trees

In each plot, we selected five healthy-growing Pinus sylvestris var. Mongolia trees as target trees, while the remaining trees were designated as competing trees [2]. We used the diameter at breast height (DBH), tree height, and crown width of the target trees as growth indicators. In our study, a total of 20 plots were established, and a total of 100 Pinus sylvestris var. Mongolia trees were selected as target trees.

2.4. Determination of Competing Trees

2.4.1. Sample Edge Correction

In order to reduce or even eliminate the edge effect, it was necessary to perform edge correction on the sample plot, and the eight-neighborhood translation method [20] was thus employed here. With the surveyed sample land as the center, the sample field was offset in eight directions (up, down, left, right, upper left, lower left, upper right, and lower right), and a total of nine sections were obtained after the offset.
In this study, Excel 2021 was used to initially process the research data in accordance with the relative coordinates of each tree in the plot. The trees were migrated to eight adjacent areas, and their coordinates were determined. Finally, all tree information data were imported into ArcGIS 10.2. A point layer was formed (a spatial distribution map of the trees) according to the relative coordinate information of the trees, in which the offset plot was used as competition trees and all the dominant trees in the original plot were used as object trees [21]. A schematic diagram is shown in Figure 2a.

2.4.2. Determination of Competition Units for Dominant Trees

This study used Voronoi diagrams to determine the competition units of trees, which improved the research accuracy while ensuring the maximum correlation between the target tree and the competing tree [22]. Specifically, based on the coordinate position information of trees, the function of creating Voronoi diagrams using neighborhood analysis in ArcGIS 10.2 was utilized to determine the spatial structure units of trees, and the corresponding competing trees were determined based on the number of edges of the Voronoi polygons [23].
The mathematical definition of a Voronoi diagram is: given n distinct points p i (i = 1, 2, 3, …, n) in a two-dimensional Euclidean space (plane), the plane is divided by the Formula (1), which is called the Voronoi diagram of the points p i (i = 1, 2, 3, …, n) as generators or seeds (Figure 2c).
V n p i = j 1 p | d p , p i < d p , p j
where, d p , p i is the Euclidean distance between p and p i .
The Voronoi diagram of a set of points p is a collection of two-dimensional regions in the plane, where each region consists of all points in the plane that are closer to a particular point in p than to any other point in p. The collection of all these regions, one for each point in p, forms the Voronoi diagram of the point set p. The Voronoi diagram divides the plane into n polygonal regions, each containing exactly one point p i . In this article, each Voronoi cell contains only one tree and is unique. The Voronoi diagram partitions the space into many cells based on the nearest attribute of the elements in the object set. For any convex polygon in the Voronoi diagram, the distance from any point within the polygon to the object point of that polygon is less than the distance to any other object point.
Furthermore, each Tyson polygon within the constructed diagram is the smallest component of the diagram. Here, this is the competing unit of the trees, where each Tyson polygon contains only one tree, which is the dominant tree, and the number of competing trees in the vicinity of the dominant tree is equal to the number of adjacent polygons (Figure 2b). Using the ArcGIS 10.2 Euclidean Distance Analysis tool [7], the distance between the dominant tree and competing trees was measured. The Euclidean distance algorithm was used to determine the distance from each source cell to each cell, and the shortest distance from the source cell to the cell was then taken.

2.5. Soil Sample Collection

As the slope of the plot faces southeast, soil samples were collected manually at 1-meter intervals in the east, south, west, north, and south-east directions from each dominant tree. Samples were collected using a stratified sampling method, with soil taken at depths of 0–10 cm, 10–20 cm, 20–30 cm, 30–40 cm, 40–50 cm, and 50–60 cm, and each layer collected in five replicates. Soil samples from each layer were mixed and placed in labeled sample bags, which were brought back to the laboratory, air-dried, ground, and sieved before measuring soil total phosphorus, total nitrogen, total potassium, available phosphorus, available nitrogen, available potassium, ammonium nitrogen, and nitrate nitrogen. The soil water content was determined by the drying method, while the capillary water-holding capacity, capillary porosity, and total porosity were determined using the ring knife method (ring knife volume (V) of 100 cm3) and the water immersion method [24] using the following formulas:
S   g / kg = m s m 3 m 3 m k × 1000
where S is the soil mass water content (g/kg), m s is the mass of wet soil with a ring cutter (g), m 3 is the quality of dry soil with a ring knife (g), and m k is the quality of the empty ring cutter (g).
S d   g / kg = m 1 m 3 m 3 m k × 1000
where S d is the maximum soil water capacity (g/kg), m 1 is the mass of wet soil with ring knife after 12 h of soaking (g).
S m   g / kg = m 2 m 3 m 3 m k × 1000
where S m (g/kg) is soil capillary water capacity and m 2 (g) is the mass of wet soil with a ring cutter after being laid on dry sand for 2 h.
S p % = 0.1 × S m × ρ b / ρ s
where S p % is capillary porosity, ρ b (mg/m3) is soil bulk density, and ρ s (mg/m3) is water density.
ρ b   g / cm 3 = m 3 m k V
where V (cm3) is the ring cutter volume.
S a p   % = 0.1 × S d S m × ρ b / ρ s
where S a p   % is soil non-capillary porosity.
S T   % = S a p + S p
where S T   % is the total porosity of soil % .

2.6. Data Processing

2.6.1. Construction of the Competition Index Model

The Hegyi competition index based on the Voronoi chart was used to calculate the competition index in this study, and the calculation formula [22] is as follows:
C I i = j = 1 n i d j d i L i j
where C I i is the competition index of the dominant tree, i; L i j is the distance between the dominant tree, i, and the competing tree, j; d i is the DBH of the dominant tree, i; d j is the DBH of the competing tree, j; and n i is the number of competing plants in the competition unit where the dominant tree, i, is located. In this study, the CI of each competitor tree against the dominant tree was first calculated, and the CI between multiple single trees was then added to obtain the intraspecific competition index of the dominant tree. The greater the CI, the stronger the competition.

2.6.2. Model Construction of Structural Equations

The calculation formulas are as follows [7]:
X = x ε + δ
Y = y η + φ
where X is the exogenous dominant variable vector of the observed value; Y is the endogenous dominant variable vector of the observed value; x and y are the factor loads of the indicator variables ( X and Y ); δ , φ is the measurement error of the exogenous explicit variables and endogenous explicit variables; ε indicates the cause of the exogenous latent variable; and η indicates the effect of the endogenous latent variable. The structural model reflects the relationship between the potential variables:
η = B η + Γ ε + ϑ
where B is the structural coefficient matrix of the relationship between endogenous latent variables; Γ is the structural coefficient matrix of the relationship between endogenous latent variables and exogenous latent variables; and ϑ is the disturbing factor or residual value in the structural model. A structural equation model path diagram was constructed based on this model and the maximum likelihood method.
The target tree growth factor (FGF), soil physical properties (PPS), and soil nutrients (SN) were considered exogenous potential variables. The observed variables associated with these were as follows: East-West crown width (E-CW), North-South crown width (N-CS), forest tree diameter at breast height (DBH), tree height (H), soil quality moisture content (SOW), soil capillary holding capacity (MW), soil capillary porosity (SCP), total soil porosity (TSP), nitrate nitrogen (NIN), ammonia nitrogen (AMN), available potassium (AK), available phosphorus (AP), available nitrogen (AN), total potassium (TK), total phosphorus (TP), and total nitrogen (TN). The dominant tree competition index (Ci) was considered an endogenous latent variable.
Excel 2020 and R were used to calculate the competition index of dominant trees [14], and Origin.2021 software was used to fit the competition index of dominant trees to forest growth factors, soil nutrients, and soil physical properties [22]. The Structural Equation Model (SEM) was established by R4.2.2 software [25], and graph analyses were conducted using Origin.2021 and R language software.

3. Results and Analysis

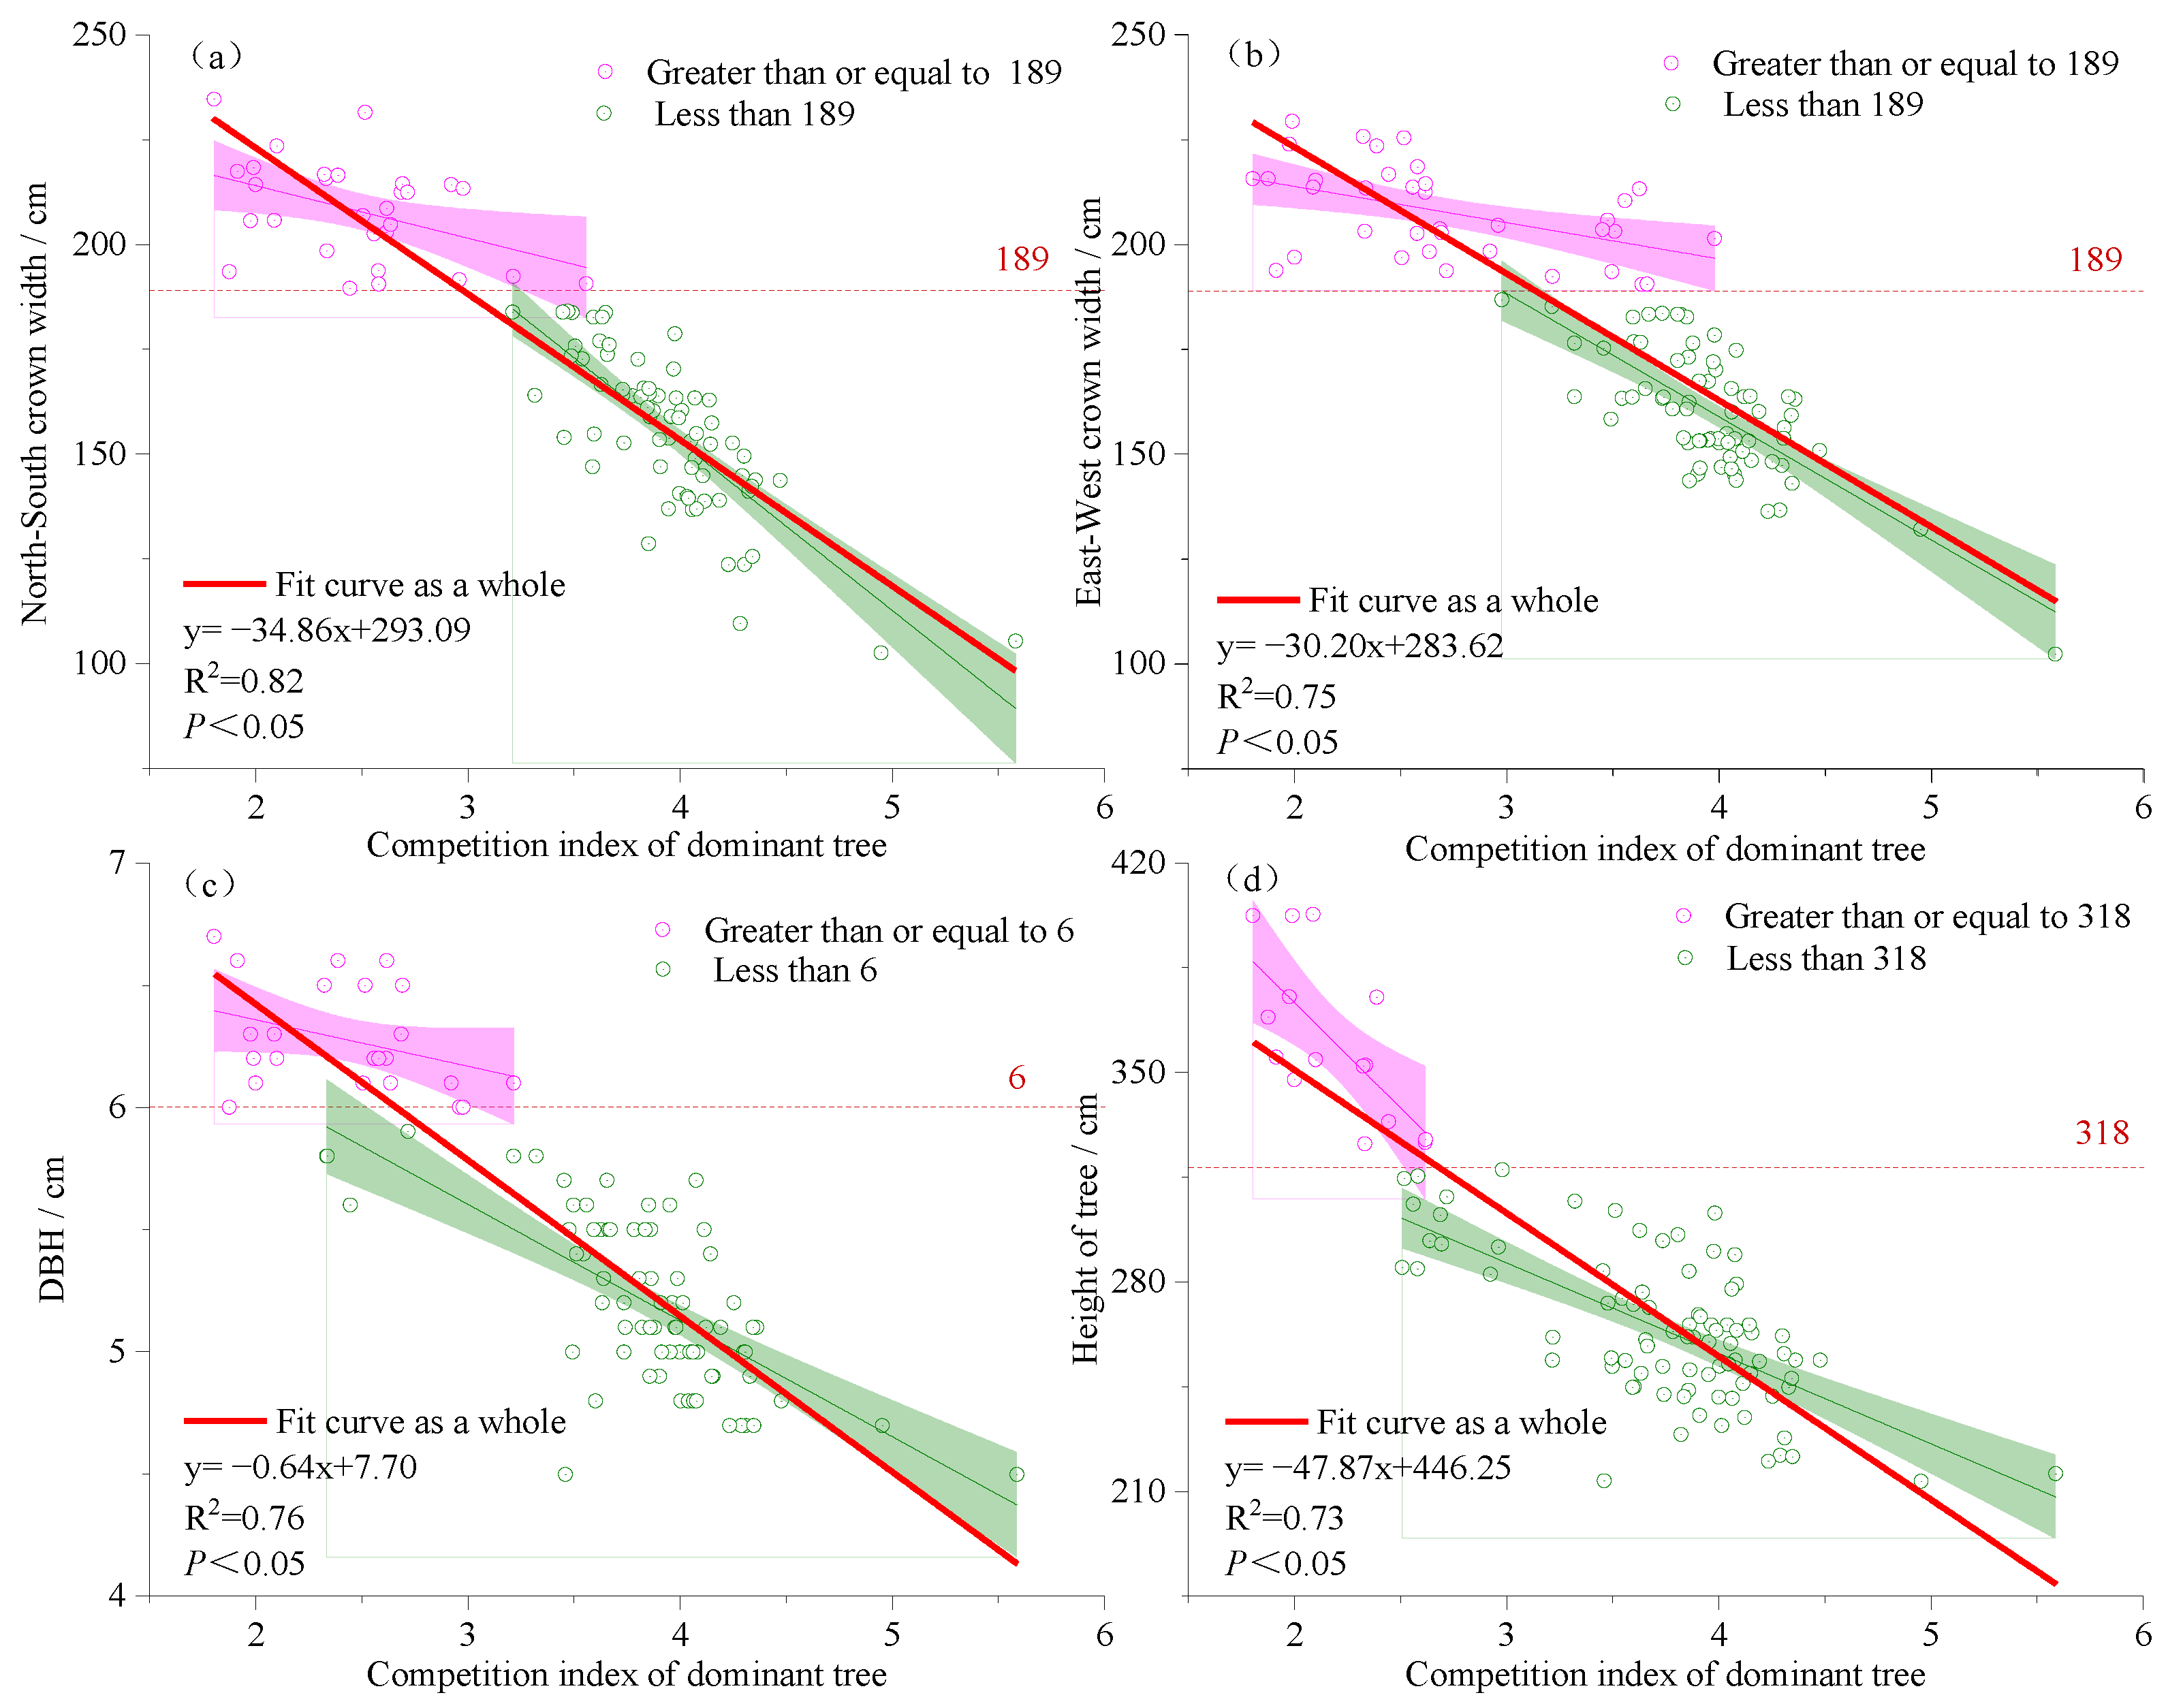
3.1. Fitting the Relationship between the Dominant Tree Competition Index and Stand Growth Factors

According to Table 1, the average east-west and north-south crown widths of dominant trees are 177.26 cm and 170.33 cm, respectively. The average DBH is 5.45 cm, and the average tree height is 277.65 cm.
According to Figure 3a,b, when the crown width of dominant trees reaches the critical value (189.0 cm), the range of competition indices for dominant trees is 2.98–5.58. However, when the crown width exceeds the critical value, the range of competition indices for dominant trees is 1.80–3.98. Therefore, the competition among trees relative to each other weakens, and the rate of decrease in CI tends to be slow. According to Figure 3c,d, when the DBH and height of the dominant tree species were less than critical values (6.0 cm and 318.0 cm, respectively), the competition index of the dominant tree species was in the range of 2.33–5.42 and 2.51–5.59, respectively. When the DBH and height of the dominant tree species were greater than the critical value, respectively, the competition index of the dominant tree species was in the range of 1.80–3.22 and 1.80–2.62, respectively. The competition among trees is relatively weak, and the rate of decrease in competition indices tends to be moderate.
At the initial stage of growth of dominant trees, with the growth and development of dominant trees, the DBH, tree height, crown width, plant demand for resources, and intraspecific competition increase, leading to drastic changes in their CI. With the growth of dominant trees, they eventually occupy the dominant ecological niche [2]. Therefore, there was a significant negative correlation between the competition index of dominant trees and their crown width, DBH, and height (Ra2 = 0.82, Rb2 = 0.75, Rc2 = 0.76, Rd2 = 0.73, p < 0.05).

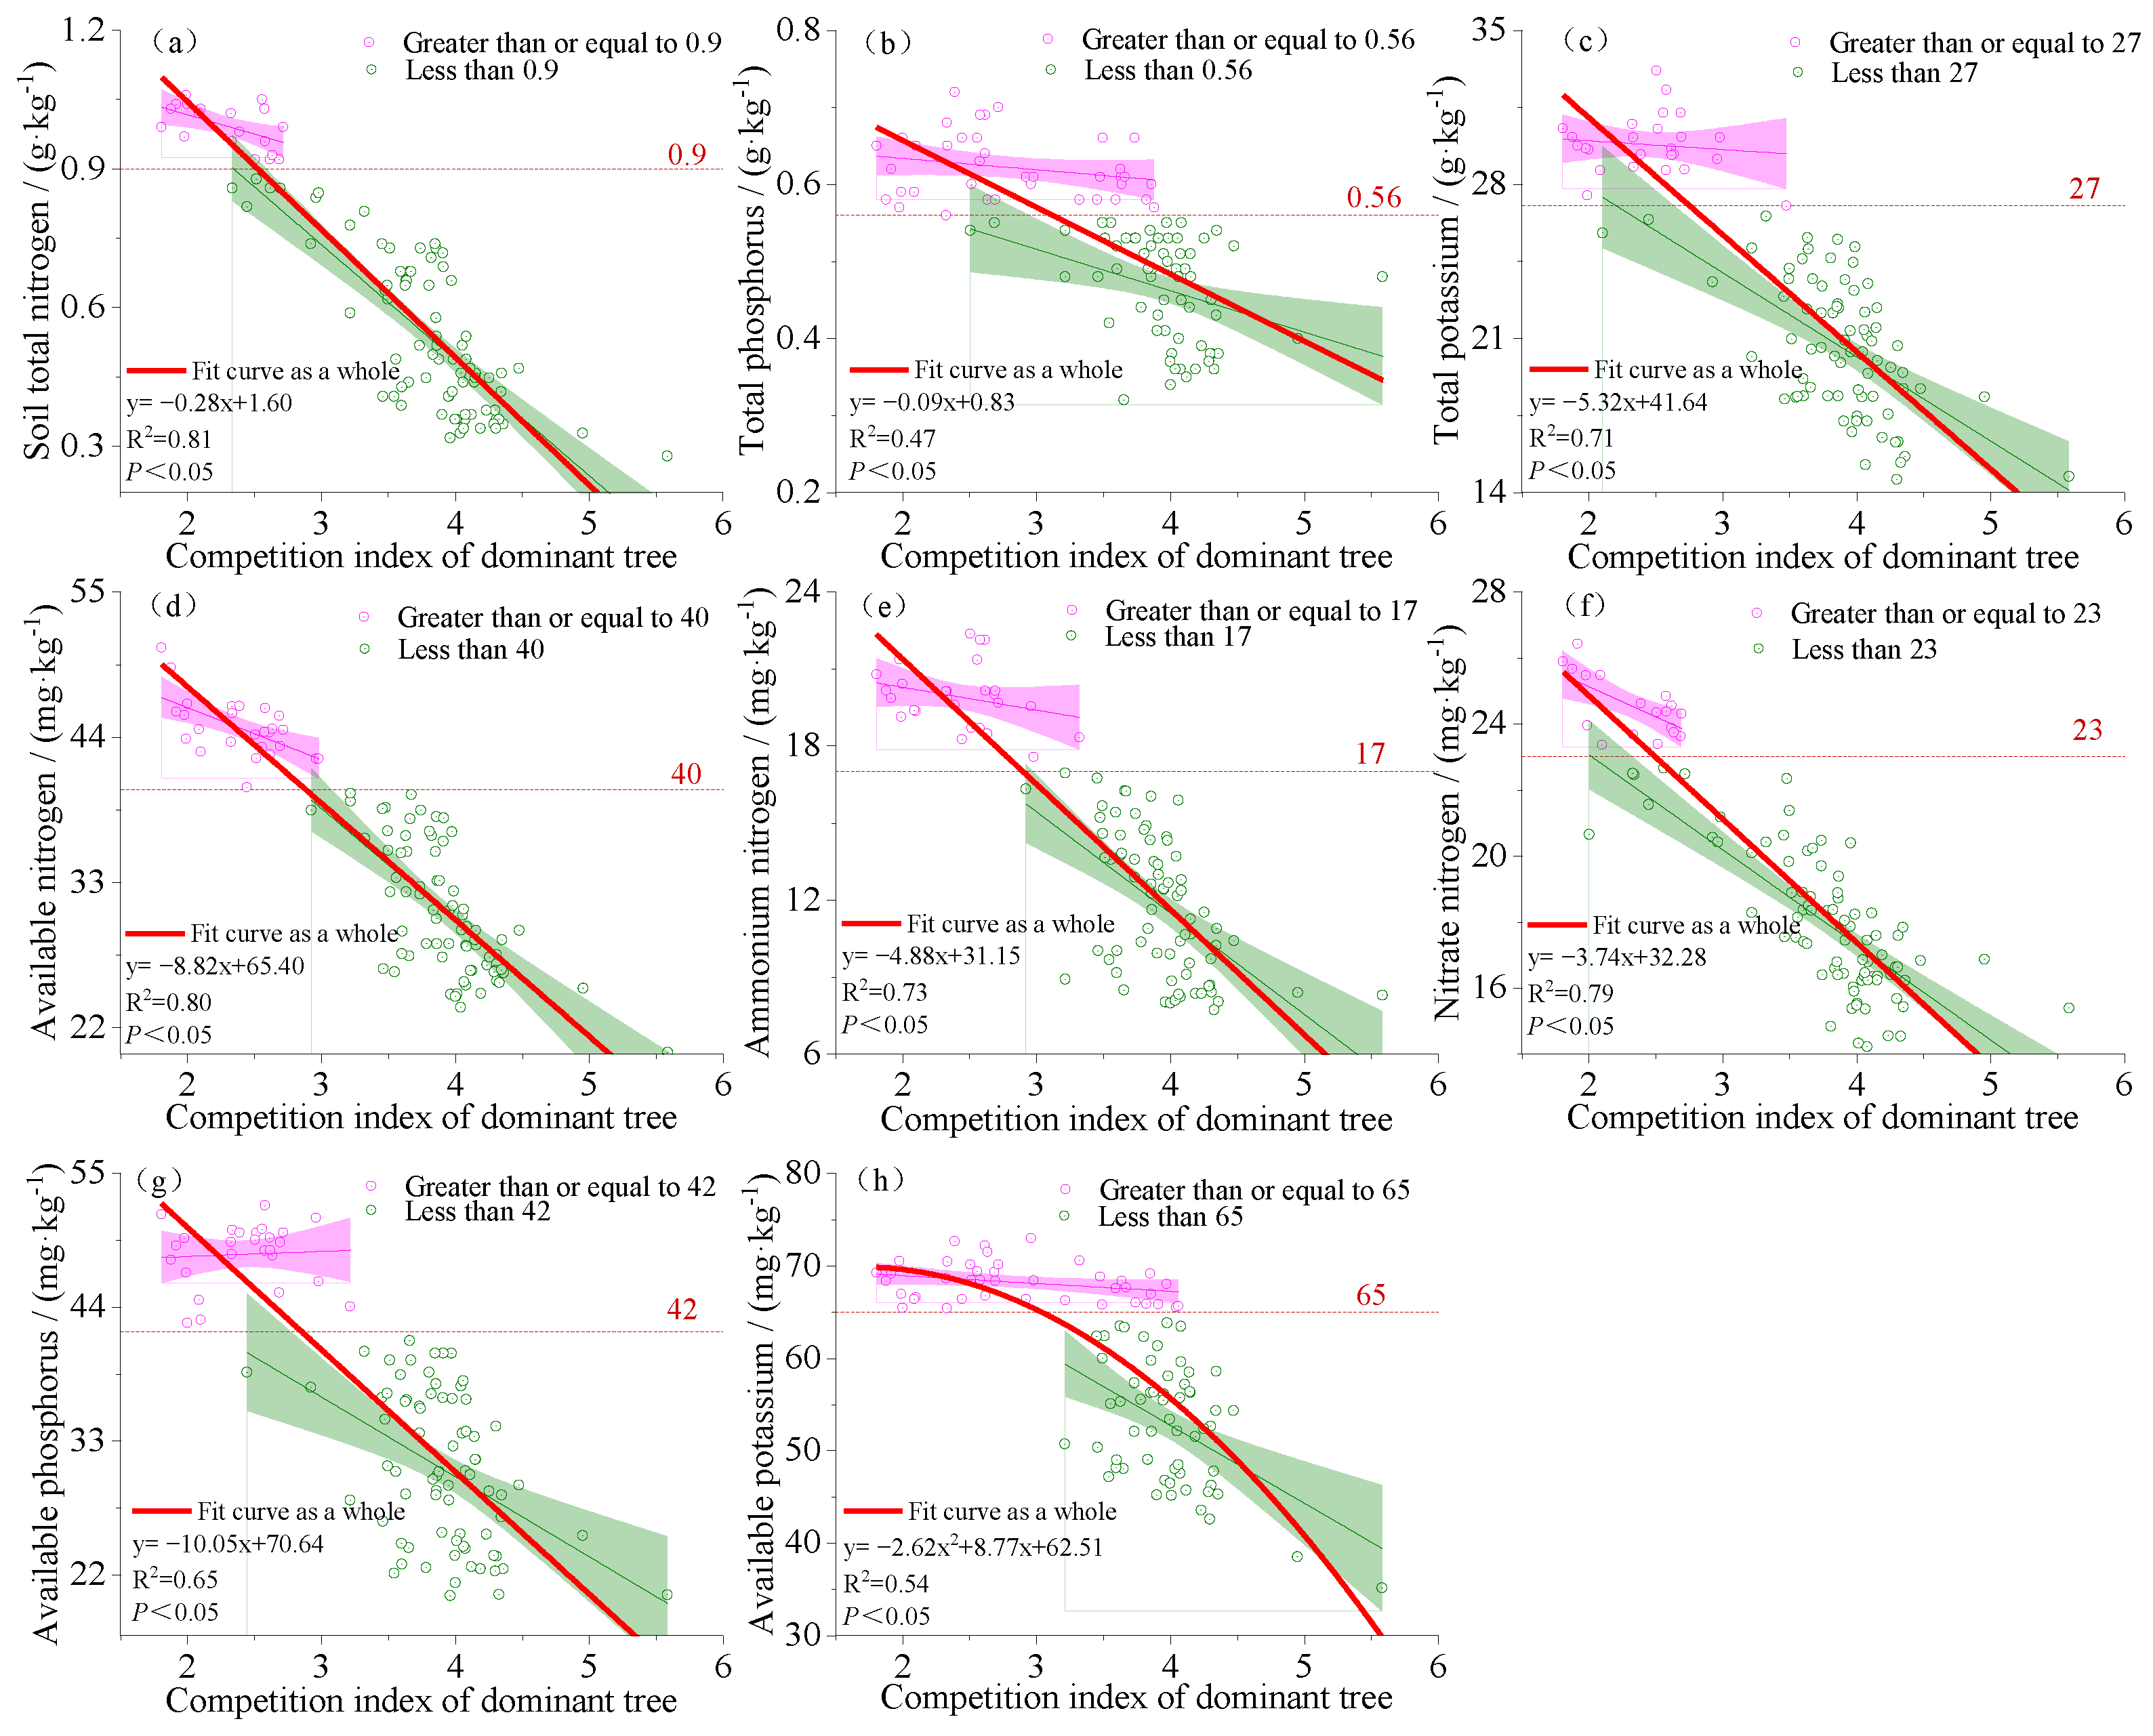
3.2. Fitting the Relationship between the Dominant Tree Competition Index and Soil Nutrient Factors

As shown in Figure 4, when the contents of TN, TP, TK, AN, AMN, NIN, AP, and AK in the soil are all less than their critical values (0.90 g/kg, 0.56 g/kg, 27.00 g/kg, 40.00 mg/kg, 17.00 mg/kg, 23.00 mg/kg, 42.00 mg/kg, and 65.00 mg/kg, respectively), the competition index of dominant trees ranges from 2.34–4.59, 2.51–5.59, 2.10–5.59, 2.92–4.95, 2.92–5.59, 2.00–4.95, 2.44–5.29, and falls within the range of 3.22–5.59. When the TN, TP, TK, AN, AMN, NIN, AP, and AK contents were greater than critical value, respectively, the competition index of dominant tree species was 1.80–2.72, 1.80–3.88, 1.92–2.98, 1.80–2.98, 1.84–3.28, 1.80–2.69, 1.80–3.21, and 1.80–4.06, respectively; the competition between trees was relatively weakened, and the rate of decline in the CI tended to be gentle. The competition index of dominant tree species decreased with increases in the soil TN, TP, TK, AN, AMN, NIN, AP, and AK contents. However, a turning point occurred when the AK content increased to a certain value, and the dynamic change followed the change law of the binary function, while the rest followed the change law of the univariate function. There is a clear correlation between the CI between plants and the supply of soil nutrients. Soil nutrients can indirectly affect plant competition by participating in plant physiological and biochemical activities. When available soil nutrients are lacking, plants will compete for limited nutrients, leading to intensified competition among plants [26]. Therefore, the dominant tree competition index was negatively correlated with soil TN (Ra2 = 0.81, p < 0.05), TP (Rb2 = 0.47, p < 0.05), TK (Rc2 = 0.71, p < 0.05), AN (Rd2 = 0.80, p < 0.05), AMN (Re2 = 0.73, p < 0.05), NIN (Rf2 = 0.79, p < 0.05), AP (Rg2 = 0.65, p < 0.05), and AK (Rh2 = 0.54, p < 0.05).

3.3. Fitting the Relationship between the Dominant Tree Competition Index and Soil Physical Factors

As shown in Figure 5, When the soil quality water content, soil capillary water holding capacity, soil capillary porosity (SCP), and total soil porosity (TSP) were lower than the critical value (139.00 g/kg, 250.00 g/kg, 36%, and 47%), respectively, the competition index of the dominant tree was in the range of 2.92–5.59, 2.10–5.59, 2.00–5.59, and 2.33–5.59. When the soil quality water content, soil capillary water holding capacity, SCP, and TSP were greater than the critical value, respectively, the competition index of the dominant tree was in the range of 1.80–3.32, 1.80–3.98, 1.80–3.32, and 1.80–2.72, respectively, the competition among trees was relatively weakened, and the rate of decline in the CI tended to be flat. The competition index of the dominant tree decreased with an increase in soil water content, soil capillary water holding capacity, SCP, and TSP. The competition index of the dominant tree was significantly and negatively correlated with the soil mass water content (Ra2 = 0.70, p < 0.05), soil capillary water capacity (Rb2 = 0.56, p < 0.05), soil capillary porosity (Rc2 = 0.63, p < 0.05), and soil total porosity (Rd2 = 0.78, p < 0.05).

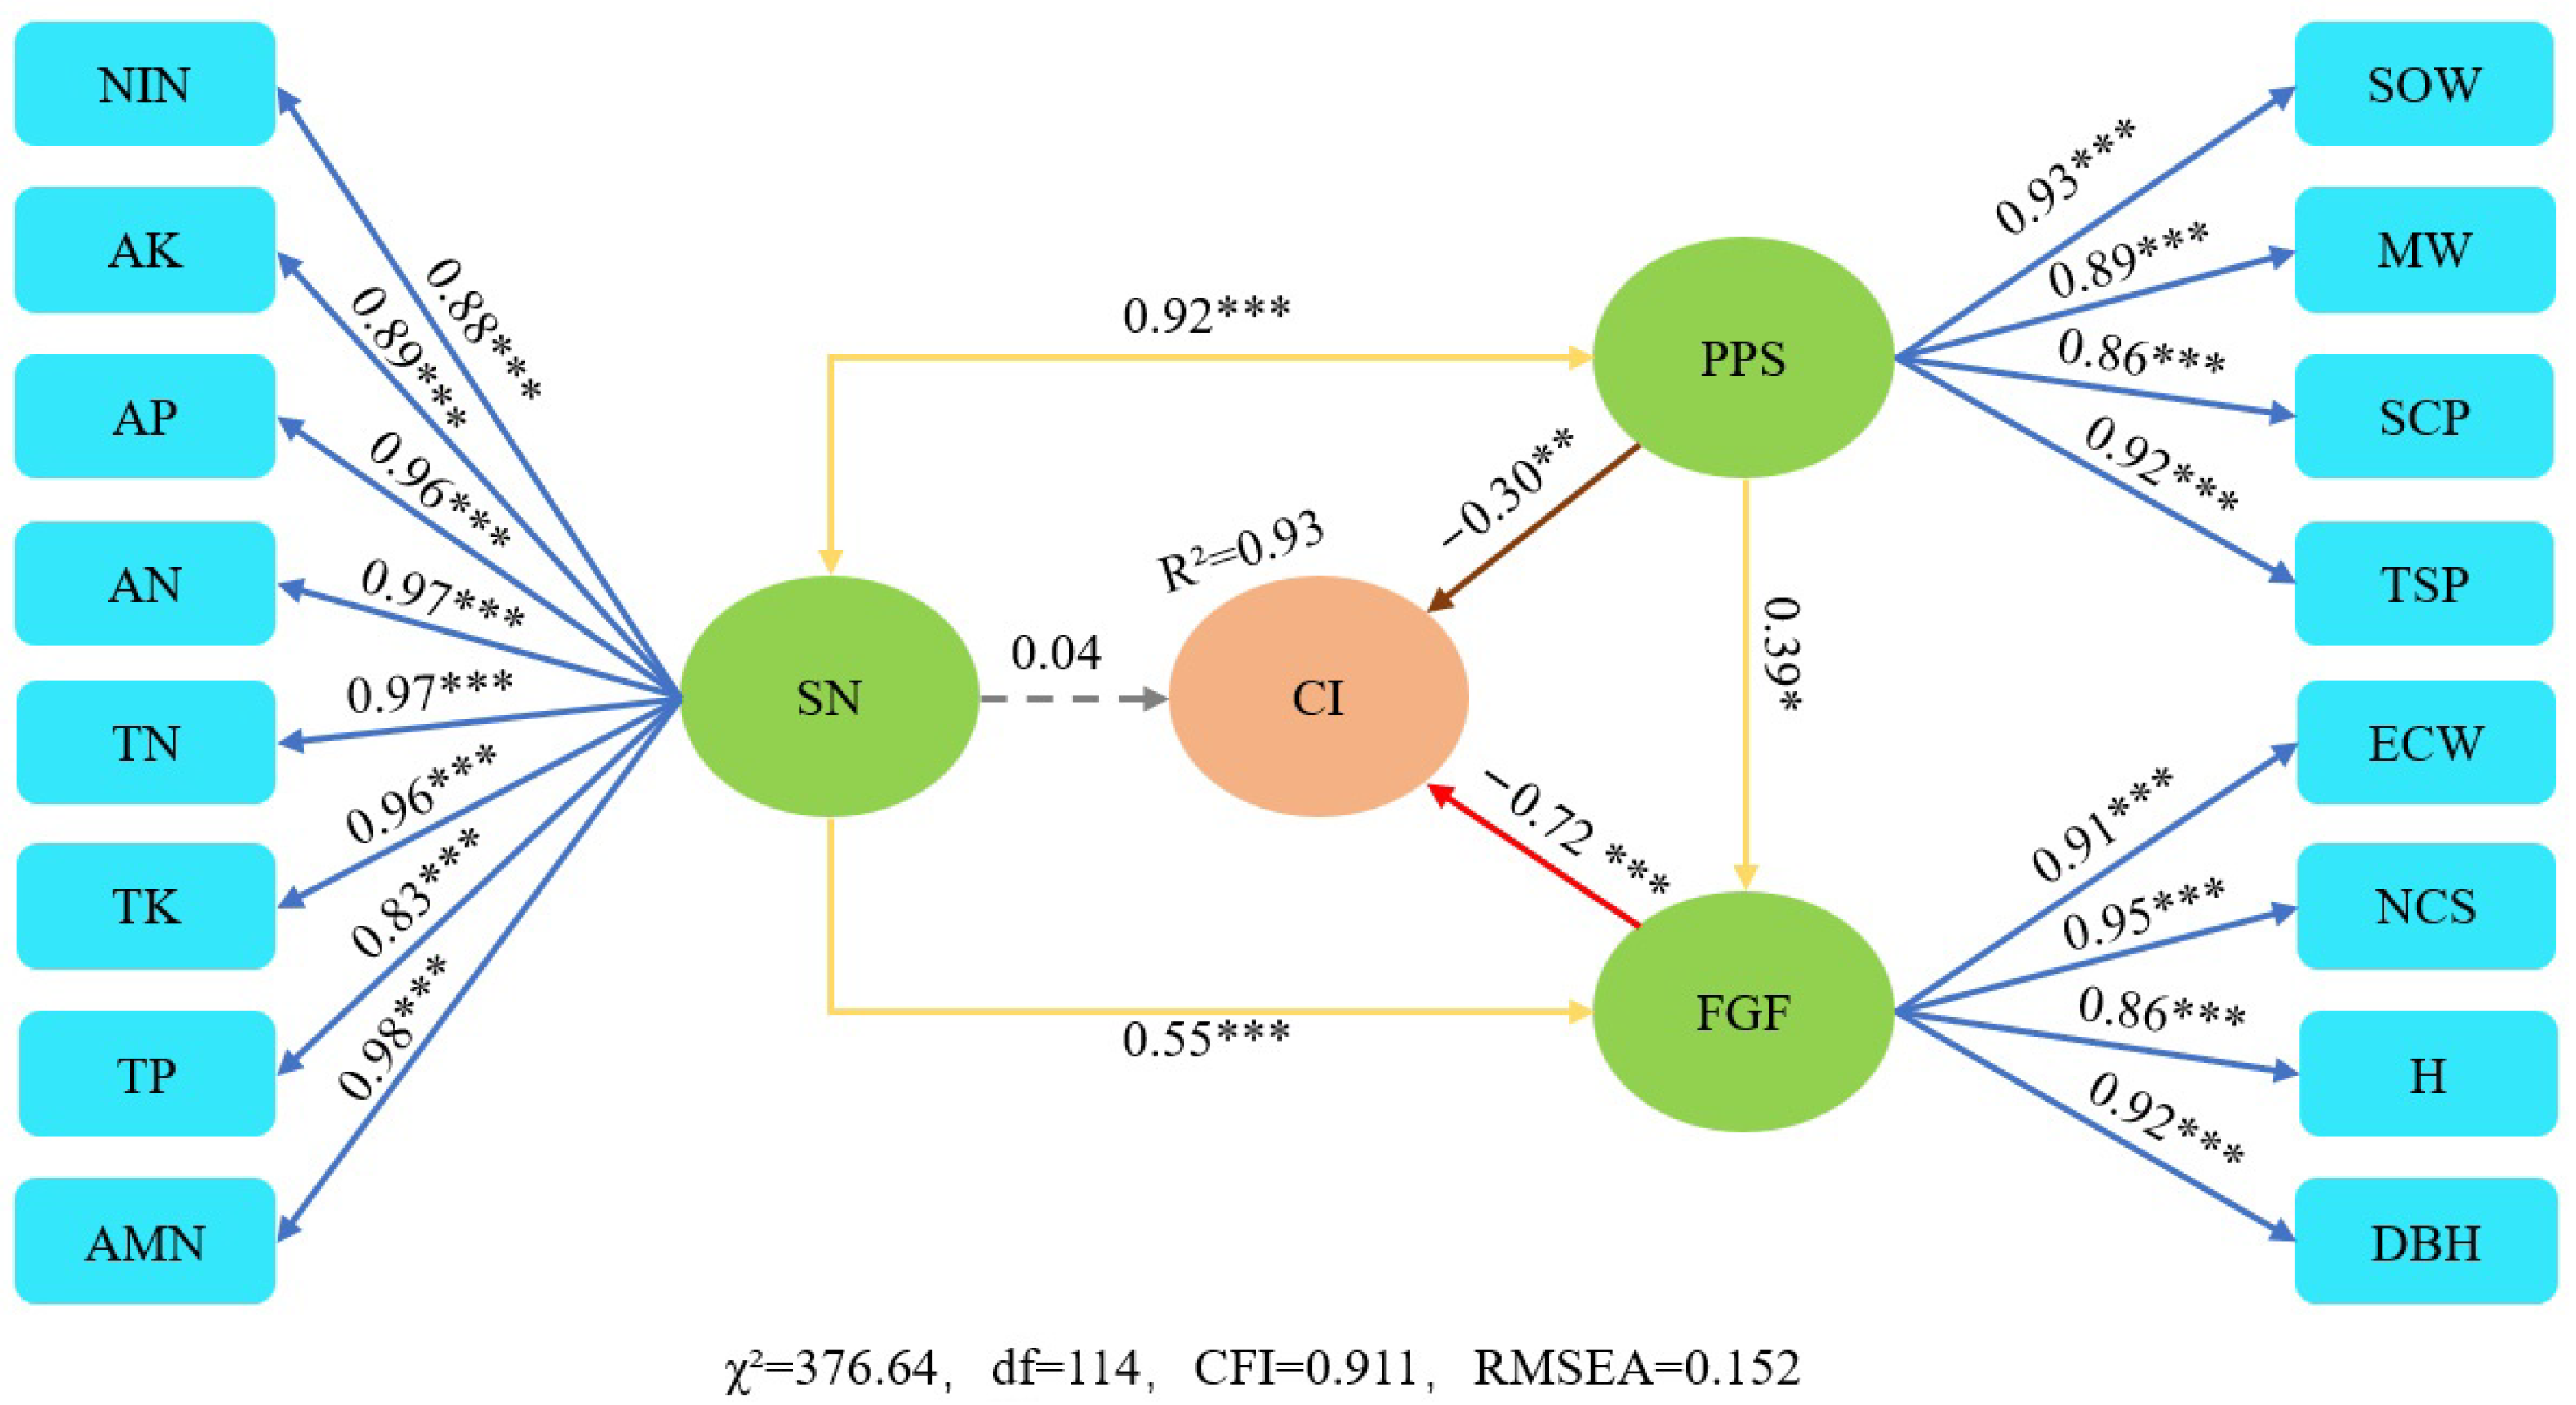
3.4. Structural Equation Model

A causal relationship was determined between the potential variables of soil nutrients (SN: NIN (Nitrate nitrogen), AMN (Ammonia nitrogen), AK (Available potassium), AP (Available phosphorus), AN (Available nitrogen), TK (Total potassium), TP (Total phosphorus), TN (Total nitrogen)), the soil physical properties (PPS: SOW (Soil quality moisture content), MW (Soil capillary holding capacity), SCP (Soil capillary porosity), TSP (Total soil porosity), and the forest growth factors (FGF: E-CW (East-West crown width), N-CS (North-South crown width), DBH (diameter at breast height), H (Tree height)) and their corresponding observation variables, and the observation variables had different degrees of impact on their potential variables (Figure 6). The effects of soil TN, TP, TK, AN, AP, AK, AMN, NIN, and other nutrients on the soil’s physical properties were significantly positive (p < 0.001), and AMN had the greatest effect, with a path coefficient of 0.98. The effects of the soil mass water content, soil capillary water-holding capacity, SCP, and TSP on the soil physical properties were all significantly positive (p < 0.001). The effect of the soil mass water content was the largest, with a path coefficient of 0.93, whereas that of SCP was the smallest, with a path coefficient of 0.86. The results showed that the North-South crown width, East-West crown width, tree height, and DBH of the dominant tree species had extremely significant positive effects on the tree growth factors (p < 0.001), where the influences of the North-South crown width > DBH > East-West crown width > TH had path coefficients of 0.95, 0.92, 0.91, and 0.86, respectively.
In addition to direct effect coefficients, there are also indirect effect coefficients between latent variables, and the sum of direct and indirect effect coefficients equals the total effect coefficient of a variable on an endogenous variable [7]. The coefficients in Figure 6 represent the direct influence coefficients. The calculation results are summarized in Table 2, which enables a better understanding of the direct, indirect, and total effects of the potential variables. According to the output results of the structural equation (Table 2), the two potential variables, soil nutrients and soil physical properties, had an impact on tree growth factors; however, the degree of impact varied. The greatest impact was on soil nutrients, which had a significant positive correlation effect on tree growth factors (p < 0.001) (direct effect of 0.55, indirect effect of 0.36, and total effect of 0.91), indicating that tree growth improved with good soil nutrient content. There was a significant positive correlation between the forest growth factors and the potential variables of the soil physical properties (p < 0.05) (with a direct effect of 0.39, an indirect effect of 0.51, and a total effect of 0.90). In addition, there was a positive correlation between the potential variables of the soil nutrients and the soil physical properties (with a direct effect of 0.92), but no indirect effect, indicating that soil nutrients and soil physical properties in the study area promote and develop each other, showing a significant positive correlation (p < 0.001).
There was a causal relationship between the potential variables of soil nutrients, soil physical properties, forest growth factors, and the competition index of dominant trees (Figure 6, Table 2). The potential soil nutrient variables had positive direct effects on the competition index of the dominant tree, but the correlation was not significant (p > 0.05). The direct effect was 0.04, the indirect effect was −0.70, and the total effect was −0.66, indicating that the competition index of dominant trees decreased with an increase in soil nutrients. The competition index of dominant trees was significantly negatively correlated with the potential variables of soil physical properties (p < 0.05), with a direct effect of −0.30, an indirect effect of −0.61, and a total effect of −0.91. The potential variables of forest growth factors had a negative impact on the CI, and there was a significantly negative correlation with the growth factors of trees (p < 0.001), with a direct effect of −0.72. There was no intercropping effect, indicating that the competition index of dominant trees was sensitive to changes in the soil physical properties and the tree growth indicators and that it would alter with changes in soil physical properties and tree growth factors.

4. Discussion

4.1. Relationship between Growth Factors of Dominant Trees and Competition Index

Through a regression analysis of the competition index of the dominant tree in Pinus sylvestris var. Mongolia plantations using the DBH, TH, and CW of the dominant tree, it was shown that the CI of target trees in the Pinus sylvestris var. Mongolia plantation and the DBH, TH, and CW of the dominant trees within the plantation were approximately subject to a univariate function relationship. These findings are inconsistent with the results of Chen Lixin et al. [2], Zilabi Maimu [27], and Shen Chenchen et al. [12] with respect to the relationship between forest growth indicators and the competition index. In a three-shed forest farm in Tonghua City and a red pine plantation in Linjiang City, Jilin Province, within the Zilabi Maimu nomination [27], Chen Lixin et al. [2] showed that the relationship between stand growth factors and the competition index was a quadratic function. Studies in Badaling have shown that the DBH, CW, and TH of Pinus tabulin plantations are closely related to the secondary or tertiary function of the competition intensity, and the competition intensity has been found to approximately obey exponential [28] and hyperbolic function relationships [29]. The plantation studied here was designed to restore vegetation in the watershed around the Winter Olympic venues (Chongli competition area) and improve the ecological quality; therefore, the tree species stand has a simple tree species structure and a single composition, and the stand is in an early stage of succession [30]. Therefore, as the Pinus sylvestris var. Mongolia plantation in the study area was man-made following the destruction of local vegetation, the relationship between the tree growth index and the CI obeys a univariate function.
Turner et al. proposed the dominance-suppression hypothesis in 1983, which states that there is greater variability in the individual sizes of trees in crowded or competing populations compared to noncompeting populations [31]. This study shows that the competition index of dominant Pinus sylvestris var. mongolica is significantly negatively correlated with its DBH, height, and east-west and north-south crown widths. Dou Xiaowen [4] applied the GCI and V_Hegyi competition index models to the relationship between forest growth and forest competition in coniferous and broadleaved-coniferous mixed forests in Tianmu Mountain National Nature Reserve in Zhejiang Province, and the results showed a negative correlation between tree growth and the competition index of dominant trees. Li Chao [32] found that the diameter at breast height of Pinus tabulosa plantations was negatively correlated with competition intensity, and Liu Wansheng et al. [3] found that the competition index within Mongolian oak species decreased with an increase in the diameter at breast height of the dominant tree. Chen Lixin et al. [2] found that the competition index of dominant trees in Pinus koraiensis plantations was significantly negatively correlated with diameter at breast height, tree height, east-west crown width, and north-south crown width, which is consistent with the results of this study. However, in our study, we found that there is a critical value in the relationship between growth indicators of Pinus sylvestris var. mongolica and the competition index of dominant trees. When the crown width, diameter at breast height, and tree height of Pinus sylvestris var. mongolica are greater than the critical value, the competition index changes little and the competitiveness tends to be stable. This may be because in the early stages of the development of dominant trees, their diameter at breast height, tree height, and crown width increase, the plants’ demands for resources increase, intraspecific or interspecific competition increases, and the competition index increases [33]. When a greater growth space and nutrient level are obtained, competitiveness is stronger [34], and the number of trees with a large diameter at breast height is small, but they become the dominant stand layer when their heights increase. As there is sufficient growth space in the dominant stand layer, competition between individuals weakens. Wang Qing et al. [35] found that when the diameter at breast height of Pinus massoniana was >20 cm, competition pressure decreased and remained low. Chai Zongzheng et al. [36] found that the diameter at breast height of trees in a natural secondary Pinus tabulosa forest in the western section of the Qinling Mountains ranged from 5 cm to 25 cm. In addition, the intraspecific competition intensity of the Pinus tabulosa population increased with an increase in the diameter at breast height, but the competition intensity gradually decreased when the diameter at breast height was ≥25 cm and the dominance-suppression hypothesis was tested.

4.2. Relationship between Soil Physical and Chemical Properties and Competition Index

Soil physical and chemical properties directly affect plant growth, and vegetation and soil are mutually coupled, developed, and constrained by each other (soil physical and chemical properties under different vegetation restoration models in South Asia). This study shows that there is a significant negative correlation between the CI of Pinus sylvestris var. mongolica and soil physical and chemical properties, which is consistent with the study by Wang Miaoying et al. [26] on the relationship between competition among common tree species seedlings and young trees and soil physical and chemical properties in subtropical areas. However, in our study, we found that there is a critical value in the relationship between soil physical and chemical properties and the CI of Pinus sylvestris var. mongolica. When the content of soil total nitrogen, total phosphorus, total potassium, available nitrogen, ammonium nitrogen, nitrate nitrogen, available phosphorus, available potassium, soil quality water content, soil capillary water holding capacity, soil capillary porosity, and soil total porosity are all greater than the critical value, the CI changes little and the competitiveness tends to be stable. This may be because as the dominant trees grow and develop, they absorb more nutrients from the soil [2]. When available soil nutrients are limited, plants will compete for limited water and mineral nutrients, leading to increased interspecific competition. However, as soil nutrient and moisture content increases, it can meet the growth needs of plants, and the intensity of interspecific competition decreases [2]. It may also be because, as trees grow, larger dominant tree species occupy suitable ecological niches and are able to grow and develop independently [37], while smaller trees have weaker survival capabilities. When the competition ability of small trees weakens to a certain extent and the nutrients and water absorption are not enough to sustain their survival, natural sparseness occurs [38]. Therefore, the change in the competition index tends to be smooth. This research result is consistent with the study by Chen Lixin et al. [2] on the relationship between competition index and soil physical and chemical properties in Pinus koraiensis plantations. This also verifies the “nutrient competition” hypothesis [39].

4.3. SEM Analysis

With changes in soil physical properties, microbial activity in the soil also changes, thereby affecting the nutrient content of the soil [26,40]. This indicates that soil nutrients and soil physical properties can mutually promote each other, developing a synergistic effect [41]. Studies have shown that there is a certain correlation between soil physical properties and soil nutrients [42,43]. According to the SEM analysis, soil nutrients and soil physical properties can promote each other and develop synergistically (Figure 6, Table 2), and available phosphorus, available potassium, and available nitrogen are the main factors affecting soil physical properties (Figures S1–S4). This is consistent with the research results of Pei Zhongxue et al. [42] and Noorbakhsh et al. [41] on the relationship between soil nutrients and soil physical properties. The SEM analysis shows that soil physical properties and soil nutrients have a positive impact on forest growth indicators (Figure 6, Table 2). Similarly, in our analysis of the relationship between forest growth indicators and soil physicochemical properties, we also found a significant positive correlation between them (p < 0.05). Among the soil physical properties, soil total porosity has the greatest impact on the dominant tree’s east-west and north-south crown width, tree height, and DBH (R2 values of 0.56, 0.59, 0.61, and 0.65, respectively) (Figures S5–S8). Among the soil nutrient contents, soil available nitrogen has the greatest impact on the dominant tree’s east-west and north-south crown width (R2 values of 0.70 and 0.72, respectively), while soil total nitrogen has the greatest impact on the dominant tree’s height (R2 = 0.62), and soil nitrate nitrogen has the greatest impact on the dominant tree’s DBH (R2 = 0.70) (Figures S9–S12). Deng Jifeng et al. [43] showed that soil nutrients have a good supporting effect on the growth of forest stand indicators such as tree height and diameter at breast height. Researchers Burke et al. [44] believed that soil is the main nutrient pool for vegetation, and soil physicochemical properties determine the growth and environmental conditions of vegetation and affect the growth and development of interspecific and intraspecific relationships within the plant community. Pang et al. [45] studied the relationship between the nutrient characteristics of multiple organs of forest vegetation and soil nutrient characteristics and found that the two are closely related, with soil nutrients contributing 56.4%, 41.4%, and 23.9% to the nutrient characteristics of different life forms of vegetation (trees, shrubs, and grasses), which is similar to the results of our study. According to the SEM analysis, the dominant trees of Pinus sylvestris var. mongolica have a direct negative impact on their CI for their crown width, DBH, and height, with no indirect impact. Soil physical properties significantly affect the CI of Pinus densiflora dominant trees, with both direct and indirect negative effects, but the indirect effect is stronger than the direct effect. Chen Lixin et al. [2] found that the growth indicators of dominant trees and soil physical properties of Pinus koraiensis are negatively correlated with CI intensity, and Wang Miaoying et al. [26] found that competition among common tree species in subtropical regions is negatively correlated with soil physical properties. These studies are consistent with the results of this study. This may be because as the dominant trees grow, their ability to absorb soil nutrients and water increases, allowing for more photosynthesis. Therefore, larger trees have stronger survival abilities, and smaller trees have weaker survival abilities. When the competitive ability of small trees weakens to a certain extent and the absorbed nutrients cannot sustain their own survival, natural thinning occurs [46].
According to the SEM analysis, the direct impact of soil nutrients on the competition index of dominant Pinus sylvestris var. mongolica trees is positive. Burke et al. [47] also found that the intensity of competition increases with an increase in nutrient levels. However, the SEM analysis shows that the indirect impact of soil nutrients on the competition index of dominant Pinus sylvestris var. mongolica trees is negative, and the indirect impact is greater than the direct impact, resulting in a total negative impact. This is because as the growth and development of dominant trees increase, the demand for spatial and soil resources increases. Under limited spatial and soil resource conditions, the competition index of plants decreases [48]. This is consistent with the research results of Wang Miaoying [26] and others, who found a negative correlation between soil organic carbon and nitrogen content and the competition intensity of common tree species in subtropical regions.

4.4. Future Research Directions and Prospects

By fitting the relationships between the competition index of the dominant Pinus sylvestris var. mongolica and growth factors from the Pinus sylvestris var. mongolica stand, soil nutrient factors, and soil physical properties, the influence of Pinus sylvestris var. mongolica stand growth factors on the competition index of the dominant Pinus sylvestris var. mongolica was found to be negative. However, as it is difficult to quantify competition at the stand level, the effect of this evaluation is limited [2]. Therefore, in future research, we intend to further study the relationship between the dominant tree competition index and influencing factors by studying the spatial structure of the stand.

5. Conclusions

This study constructed a model of competition index for dominant Pinus sylvestris var. mongolica trees and analyzed the linear relationship between the dominant tree competition index and growth factors, soil nutrients, and soil physical properties of the Pinus sylvestris var. mongolica forest using a multiple linear regression model. At the same time, a structural equation model was used to quantify the effects of growth factors, soil nutrients, and soil physical properties on the competition index of dominant Pinus sylvestris var. mongolica trees, as well as the degree of mutual regulation among these factors. Overall, the multiple linear regression model effectively established the relationship between growth factors, soil nutrients, soil physical properties, and the competition index of dominant Pinus sylvestris var. mongolica trees. The study found that factors, such as soil physical properties, have a negative impact on the competition index of dominant Pinus sylvestris var. mongolica trees and that the competition index is mainly affected by soil physical properties. This research provides a theoretical basis for the protection and management of Pinus sylvestris var. mongolica forests in the Xiaotaojiagou watershed and aims to improve the ecological environment of the Chongli Olympic venue, ensuring its safe operation.

Supplementary Materials

The following supporting information can be downloaded at: https://www.mdpi.com/article/10.3390/f14061191/s1, Figure S1: Fitting of soil nutrient and soil quality and water content, Figure S2: Fitting of soil nutrients and soil capillary capacity, Figure S3: Fitting of soil nutrients and soil capillary porosity, Figure S4: Fitting of soil nutrients and total soil porosity, Figure S5: Soil physical properties and the fitting of dominant tree crown width from East-West, Figure S6: Fitting of soil physical properties and North-South crown diameter of dominant trees, Figure S7: Fitting of soil physical properties and dominant tree height, Figure S8: Fitting of soil physical properties and DBH of dominant trees, Figure S9: Fitting of soil nutrient and dominant tree crown width from East-West, Figure S10: Fitting of soil nutrient and North-South crown diameter of dominant trees, Figure S11: Fitting of soil nutrient and dominant tree height, Figure S12: Fitting of soil nutrient and DBH of dominant trees.

Author Contributions

Conceptualization, J.Z. and Z.J.; data curation, J.Z.; formal analysis, J.Z.; funding acquisition, Z.J.; investigation, J.Z., Q.L., L.W. and D.H.; methodology, J.Z., Z.J., L.H. and Y.G.; project administration, J.Z., Z.J., Q.L. and L.H.; visualization, J.Z.; writing—original draft, J.Z.; writing—review and editing, J.Z., Z.J., Q.L., L.H., Y.G., L.W. and D.H. All authors have read and agreed to the published version of the manuscript.

Funding

The research was funded by the Key R&D projects in China (project No. 2020YFF0305905-5), the National Forestry and Grassland Administration of China Forestry and Grassland Science and Technology Innovation Development and Research Project (project No. 2021132007), and the Special Fund Project of the Forestry Research Institute of the Chinese Academy of Forestry Sciences (project No. LYSZX202003).

Data Availability Statement

The data is contained within the article.

Acknowledgments

We thank anonymous reviewers for their helpful comments, which improved the manuscript.

Conflicts of Interest

The authors declare no conflict of interest.

References

  1. Cortini, F.; Comeau, P.G. Evaluation of competitive effects of green alder, willow and other tall shrubs on white spruce and lodgepole pine in Northern Alberta. For. Ecol. Manag. 2008, 255, 82–91. [Google Scholar] [CrossRef]
  2. Chen, L.-X.; Ha, X.-M.; Duan, W.-B.; Han, D.H.; Li, C.Z.; Liu, Y.P.; Shen, H.L.; Zhang, P. Analysis on influencing factors of competitive index of dominant trees in Pinus koraiensis plantation. Acta Ecol. Sin. 2022, 42, 1777–1787. [Google Scholar] [CrossRef]
  3. Liu, W.S.; Li, X.; Chen, F.Y.; Zhu, M.T.; Mu, L.Q. Intraspecific and Interspecific Competition of Quercus mongolica Forest. Bull. Bot. Res. 2020, 40, 552–558. [Google Scholar]
  4. Dou, X.W.; Tang, M.P. Gravitational model-based competitive analysis of trees. Chin. J. Appl. Ecol. 2022, 33, 2695–2704. [Google Scholar] [CrossRef]
  5. Looney, C.E.; D’Amato, A.W.; Palik, B.J.; Fraver, S.; Kastendick, D.N. Size-growth relationship, tree spatial patterns, and tree-tree competition influence tree growth and stand complexity in a 160-year red pine chronosequence. For. Ecol. Manag. 2018, 424, 85–94. [Google Scholar] [CrossRef]
  6. Yuan, X.Z.; Chen, Z.L.; Liu, H. Competitions between wetland dominant plants in water-level fluctuation zone. Chin. J. Ecol. 2011, 30, 1863–1867. [Google Scholar] [CrossRef]
  7. Wang, Y.; Yang, H.; Li, Y.L.; Qiu, S. Tree competition index based on the structural equation model. J. Beijing For. Univ. 2015, 37, 28–37. [Google Scholar]
  8. Avery, T.E.; Burkhart, H.E. Forest Measurement, 3rd ed.; McGraw-Hill: New York, NY, USA, 1983. [Google Scholar]
  9. Du, X.F.; Tang, M.P.; Pan, J.Y.; Shen, Q.Y.; Yang, F. Study on competition index of different typical forest types on Lin′an region. Acta Ecol. Sin. 2020, 40, 4064–4072. [Google Scholar]
  10. Hegyi, F. A simulation model for managing jack pine stands. In Growth Models for Tree and Stand Simulation; Fries, J., Ed.; Royal College of Forestry: Stockholm, Sweden, 1974; pp. 74–90. [Google Scholar]
  11. Jiang, X.D. Research on the development and optimization of single wood models. Cent. South For. Inventory Plan. 1996, 15, 1–4. [Google Scholar]
  12. Shen, C.C.; Lei, X.D.; Wang, F.Y.; Ma, W.; Shen, J.B. Competitive States in Natural Middle-aged Forest of Mongolian Oak at Jincang Forest Farm. For. Res. 2012, 25, 339–345. [Google Scholar] [CrossRef]
  13. Li, S.H.; Bai, X.R. A summary of structural equation model. Coast. Enterp. Sci. Technol. 2009, 12, 40–42. [Google Scholar]
  14. Dai, L.; Ge, J.; Wang, L.; Zhang, Q.; Liang, T.; Bolan, N.; Lischeid, G.; Rinklebe, J. Influence of soil properties, topography, and land cover on soil organic carbon and total nitrogen concentration: A case study in Qinghai-Tibet plateau based on random forest regression and structural equation modeling. Sci. Total Environ. 2022, 821, 153440. [Google Scholar] [CrossRef] [PubMed]
  15. Tian, X.M.; Zheng, J.W.; Wang, D.Z.; Zhang, Z.D. Structural equation modeling analysis of theresponse of herbaceous species richness to landscape factors in a forest-steppe zone. Acta Ecol. Sin. 2018, 38, 4649–4656. [Google Scholar] [CrossRef]
  16. Liu, D. Research on the Impact Factor Analysis of Forest Ecosystem Service Function Based on the Structural Equation Modeling. Master’s Thesis, Beijing Forestry University, Beijing, China, 2012. [Google Scholar]
  17. Sanaei, A.; Ali, A.; Yuan, Z.; Liu, S.; Lin, F.; Fang, S.; Ye, J.; Hao, Z.; Loreau, M.; Bai, E.; et al. Context-dependency of tree species diversity, trait composition and stand structural attributes regulate temperate forest multifunctionality. Sci. Total Environ. 2020, 757, 43724. [Google Scholar] [CrossRef]
  18. Zheng, C.Y.; Xu, Z.Q.; Ma, C.M. The Factors Influencing the Poplar Shelterbelt Degradation in the Bashang Plateau of Northwest Hebei Province. For. Resour. Manag. 2018, 47, 9–15. [Google Scholar] [CrossRef]
  19. Du, H.F. Reasons for the degradation of Poplar trees in Hebei dam and its reconstruction technology. Environ. Dev. 2019, 31, 195+197. [Google Scholar] [CrossRef]
  20. Radtke, P.J.; Burkhart, H.W. A comparison of methods for edgebias compensation. Can. J. For. Res. 1998, 28, 942–945. [Google Scholar] [CrossRef]
  21. Hrinca, I. An optimal control problem for the lotka-volterra system with delay. Nonlinear Anal. Theory Methods Appl. 1997, 28, 247–262. [Google Scholar] [CrossRef]
  22. Tang, M.P.; Chen, Y.G.; Shi, Y.J.; Zhou, G.M.; Zhao, M.S. Intraspecific and Interspecific competition analysis of community dominant plant populations based on Voronoi diagram. Acta Ecol. Sin. 2007, 27, 4707–4716. [Google Scholar]
  23. Getzin, S.; Wiegand, K.; Wiegand, T.; Yizhaq, H.; Von Hardenberg, J.; Meron, E. Adopting a spatially explicit perspective to study the mysterious fairy circles of Namibia. Ecography 2015, 38, 1–11. [Google Scholar] [CrossRef]
  24. Zheng, B.Z. Technical Guidelines for Soil Analysis; China Agriculture Press: Beijing, China, 2013; ISBN 7-109-17317-8. [Google Scholar]
  25. Shi, Y.F.; Shi, S.H.; Huang, X.M. The application of structural equation modeling in ecology based on R. Chin. J. Ecol. 2022, 41, 1015–1023. [Google Scholar] [CrossRef]
  26. Wang, M.Y. Effects of Interspecific Competition of Tree Species on Plant and Soil Carbon and Nitrogen Contents in Subtropical forests. Ph.D. Thesis, East China Normal University, Shanghai, China, 2021. [Google Scholar] [CrossRef]
  27. Mai Mu Ti Ming, Z.L.B. Study on Modeling of Competition Indices of Pinus tabulaeformis Individual Trees at Badaling Area. Master’s Thesis, Beijing Forestry University, Beijing, China, 2012. [Google Scholar]
  28. Yin, D.S.; Ge, W.Z.; Zhang, F.H.; Shen, H.L. Competition relationship of populations of natural secondary Acer mono forest. Bull. Bot. Res. 2012, 32, 105–109. [Google Scholar]
  29. Zhang, Q.; Hong, W.; Wu, C.Z.; Hu, X.S.; Lin, Y.M. Studies on intraspecific and interspecific competition in natural communities of Tsuga longibracteata. Guihaia 2005, 25, 14–17. [Google Scholar]
  30. Zhang, L.J.; Hu, Y.B.; Zhao, Z.H.; Sun, C.Z. Spatial structure diversity of platycladus orientalis plantation in Beijing Jiulong Mountain. Chin. J. Ecol. 2015, 34, 60–69. [Google Scholar] [CrossRef]
  31. Li, B.; Chen, J.K.; Andrew, R.W. A Literature Review on Plant Competition. Chin. Bull. Bot. 1998, 15, 18–29. [Google Scholar]
  32. Li, C. Screening of Competition Index for Pinus tabulaeformis Plantations and the Impact of Factors on the Diversity of Understory Species. Master’s Thesis, Chinese Academy of Forestry, Beijing, China, 2019. [Google Scholar] [CrossRef]
  33. Condit, R.; Ashton, P.S.; Baker, P.; Bunyavejchewin, S.; Gunatilleke, S.; Gunatilleke, N.; Hubbell, S.P.; Foster, R.B.; Itoh, A.; LaFrankie, J.V.; et al. Spatial patterns in the distribution of tropical tree species. Science 2000, 288, 1414–1418. [Google Scholar] [CrossRef] [PubMed]
  34. Wang, Y.T.; Liu, P.; Wei, Z.P. The Relationship between DBH Growth and Competition Factors for Pinus tabulaeformis Plantation. J. Shenyang Agric. Univ. 2016, 47, 299–306. [Google Scholar]
  35. Wang, Q.; Pan, P.; OuYang, X.Z. Intraspecific and interspecific competition intensity in mixed plantation with different proportion of Pinus massoniana and Schima superba. Chin. J. Ecol. 2021, 40, 49–57. [Google Scholar] [CrossRef]
  36. Chai, Z.Z.; Wang, D.X.; Zhang, L.N.; Zhang, Y.; Huang, Q.P.; Wu, H. Intraspecific and interspecific competition of Pinus tablaeformis natural secondary forests in western section of Qinling Mountains. J. Northwest AF Univ. 2012, 40, 57–63. [Google Scholar] [CrossRef]
  37. Tu, H.R.; Li, J.F.; Liu, R.H.; Liang, S.C.; Lan, Z.N.; Zhang, X.Y.; Kang, X.D.; Jiang, Y. Spatial distribution patterns and association of Loropetalum chinense population in karst hills of Guilin, Southwest China. Chin. J. Appl. Ecol. 2019, 30, 2621–2630. [Google Scholar] [CrossRef]
  38. Li, H.D.; Shen, W.S.; Fang, Y.; Yan, S.G.; Zhang, H.; Zhao, W. Point pattern analysis of several psammophyte populations in the riparian ecotone in the middle reaches of Yarlung Zangbo River of Tibet, China. Chin. J. Plant Ecol. 2011, 35, 834–843. [Google Scholar] [CrossRef]
  39. Kuzyakov, Y. Review: Factors affecting rhizosphere priming effects. J. Plant Nutr. Soil Sci. 2002, 165, 296–382. [Google Scholar] [CrossRef]
  40. Yang, X. Coupling Relationships between Stand Structure and Soil and Water Conservation Functionin Based on Structural Equation Model. Master’s Thesis, Beijing Forestry University, Beijing, China, 2020. [Google Scholar] [CrossRef]
  41. Noorbakhsh, S.; Schoenau, J.; Si, B.C.; Zeleke, T. Soil Properties, Yield, and Landscape Relationships in South-Central Saskatchewan Canada. J. Plant Nutr. 2008, 31, 539–556. [Google Scholar] [CrossRef]
  42. Pei, Z.X.; Wu, Y.; Wang, Q.; Zhong, Z.L.; Ren, M.L.; Wei, C.H.; Lu, J.L.; Wang, W.J. Correlations between Soil Porosity-Related Parameters and Other Soil Parameters in Songnen Plain, Northeastern China. Res. Soil Water Conserv. 2016, 23, 134–138. [Google Scholar] [CrossRef]
  43. Deng, J.F.; Ding, G.D.; Wei, Y.W.; Zhao, G.P.; Zhang, R.H.; Deng, G.; Zhou, Y.B.; Yin, Y. Soil physiochemical properties and the relations with Mongolian pine growth in Southern Mu Us desert. J. Arid. Land Resour. Environ. 2017, 31, 160–166. [Google Scholar] [CrossRef]
  44. Burke, D.J.; Weintraub, M.N.; Hewins, C.R.; Kalisz, S. Relationship between soil enzyme activities, nutrient cycling and soil fungal communities in a northern hardwood forest. Soil Biol. Biochem. 2011, 43, 795–803. [Google Scholar] [CrossRef]
  45. Pang, Y.; Tian, J.; Liu, L.X.; Han, L.N.; Wang, D.X. Coupling of different plant functional group, soil, and litter nutrients in a natural secondary mixed forest in the Qinling Mountains, China. Environ. Sci. Pollut. Res. 2021, 28, 66272–66286. [Google Scholar] [CrossRef]
  46. Long, J.; Tang, M. The relationship between spatial structure and topographic factors in the evergreen broad-leaved forest of Tianmushan. J. Zhejiang AF Univ. 2021, 38, 47–57. [Google Scholar]
  47. Burke, D.J.; Weintraub, M.N.; Hewins, C.R.; Kalisz, S. The quest for a mechanistic understanding of resource competition in plant communities: The role of experiments. Funct. Ecol. 1991, 5, 241–253. [Google Scholar] [CrossRef]
  48. Bush, J.K.; Van Auken, O.W. Competition between Schizachyrium scoparium and Buchloe dactyloides: The role of soil nutrients. J. Arid. Environ. 2010, 74, 49–53. [Google Scholar] [CrossRef]
Figure 1. Location of the study area and the layout of the experimental plots.
Forests 14 01191 g001
Figure 2. Voronoi and translation diagram. (a) is a schematic diagram of the eight neighborhood translation method; (b) the red box in the figure selects the actual quadrat; (c) is a schematic diagram of Voronoi; the units of a and b are m; and (c) is an enlarged view of the Tyson polygon in (b).
Forests 14 01191 g002
Figure 3. Fitting forest growth factors to the CI. (a,b) represent the fitting relationship between crown width and CI, where (a) represents the crown width in the north-south direction, and (b) represents the crown width in the east-west direction. (c) represents the fitting relationship between diameter at breast height and CI, and (d) represents the fitting relationship between tree height and CI. The red dotted line indicates the critical value of the change in the competition index of the dominant trees. The pink area is the fitting function and its confidence interval when the crown width, diameter at breast height, and height of Pinus sylvestris var. mongolica exceed the critical values. The green area is the fitting function and its confidence interval when the crown width, diameter at breast height, and height of Pinus sylvestris var. mongolica are below the critical values. The solid red line shows the overall fit of the competition index of dominant trees of Pinus sylvestris var. Mongolia.
Forests 14 01191 g003
Figure 4. Fitting soil nutrients to the CI. (ah) represent the fitting relationships between soil total nitrogen, total phosphorus, total potassium, available nitrogen, ammonium nitrogen, nitrate nitrogen, available phosphorus, available potassium, and the CI. The pink area is the fitting function and its confidence interval when soil nutrients exceed the critical values. The green area is the fitting function and its confidence interval when soil nutrients are below the critical values. The solid red line shows the overall fit of the competition index of dominant trees of Pinus sylvestris var. Mongolia.
Forests 14 01191 g004
Figure 5. Fitting of soil physical properties to the competition index for the dominant trees. (ad) represent the fitting relationships between soil moisture content, Soil capillary holding capacity, soil capillary porosity, soil total porosity, and the CI. The pink area is the fitting function and its confidence interval when soil physical properties exceed the critical values. The green area is the fitting function and its confidence interval when soil physical properties are below the critical values. The solid red line shows the overall fit of the competition index of dominant trees of Pinus sylvestris var. Mongolia.
Forests 14 01191 g005
Figure 6. Competition exponential structural equation model. The red arrow represents the influence of the growth index of Pinus sylvestris var. Mongolia on the CI; the brown arrows represent the influence of soil physical properties on the CI; the gray dotted arrows represent the impact of soil nutrients on the CI; and the yellow arrows represent the influence between soil nutrients, soil physical properties, and growth indicators. The data between variables are the path coefficients of the observed variables. * significant correlation at the level of 0.05; ** significant correlation at the 0.01 level; *** significant correlation at the 0.001 level. The arrow in the Causality of Variables column refers to the relationship’s direction.
Forests 14 01191 g006
Table 1. Basic growth information of dominant Pinus sylvestris var. mongolica trees.
IndexAverage Value
Average DBH (cm)5.45
Average height (cm)277.65
East-West Crown width (cm)177.26
North-South Crown width (cm)170.33
Table 2. Indirect, direct, and total effects of latent variables.
Causality of VariablesDirect EffectIndirect EffectTotal Effect
Ci←SN0.04−0.70−0.66
Ci←PPS−0.30−0.61−0.91
Ci←FGF−0.720−0.72
PPS←SN0.9200.92
SN←PPS0.9200.92
FGF←SN0.550.360.91
FGF←PPS0.390.510.90
The arrow in the Causality of Variables column refers to the relationship’s direction.
Disclaimer/Publisher’s Note: The statements, opinions and data contained in all publications are solely those of the individual author(s) and contributor(s) and not of MDPI and/or the editor(s). MDPI and/or the editor(s) disclaim responsibility for any injury to people or property resulting from any ideas, methods, instructions or products referred to in the content.

