
Study on the Effect of Finger-Joints on the Strengths of Laminations from Fiber-Managed Eucalyptus nitens


Abstract
:1. Introduction
- Obtain the bending, tensile, shear, and bearing strength of sawn boards made from fiber-managed E. nitens with and without finger joints;
- Determine the finger joint’s efficiency of strengths;
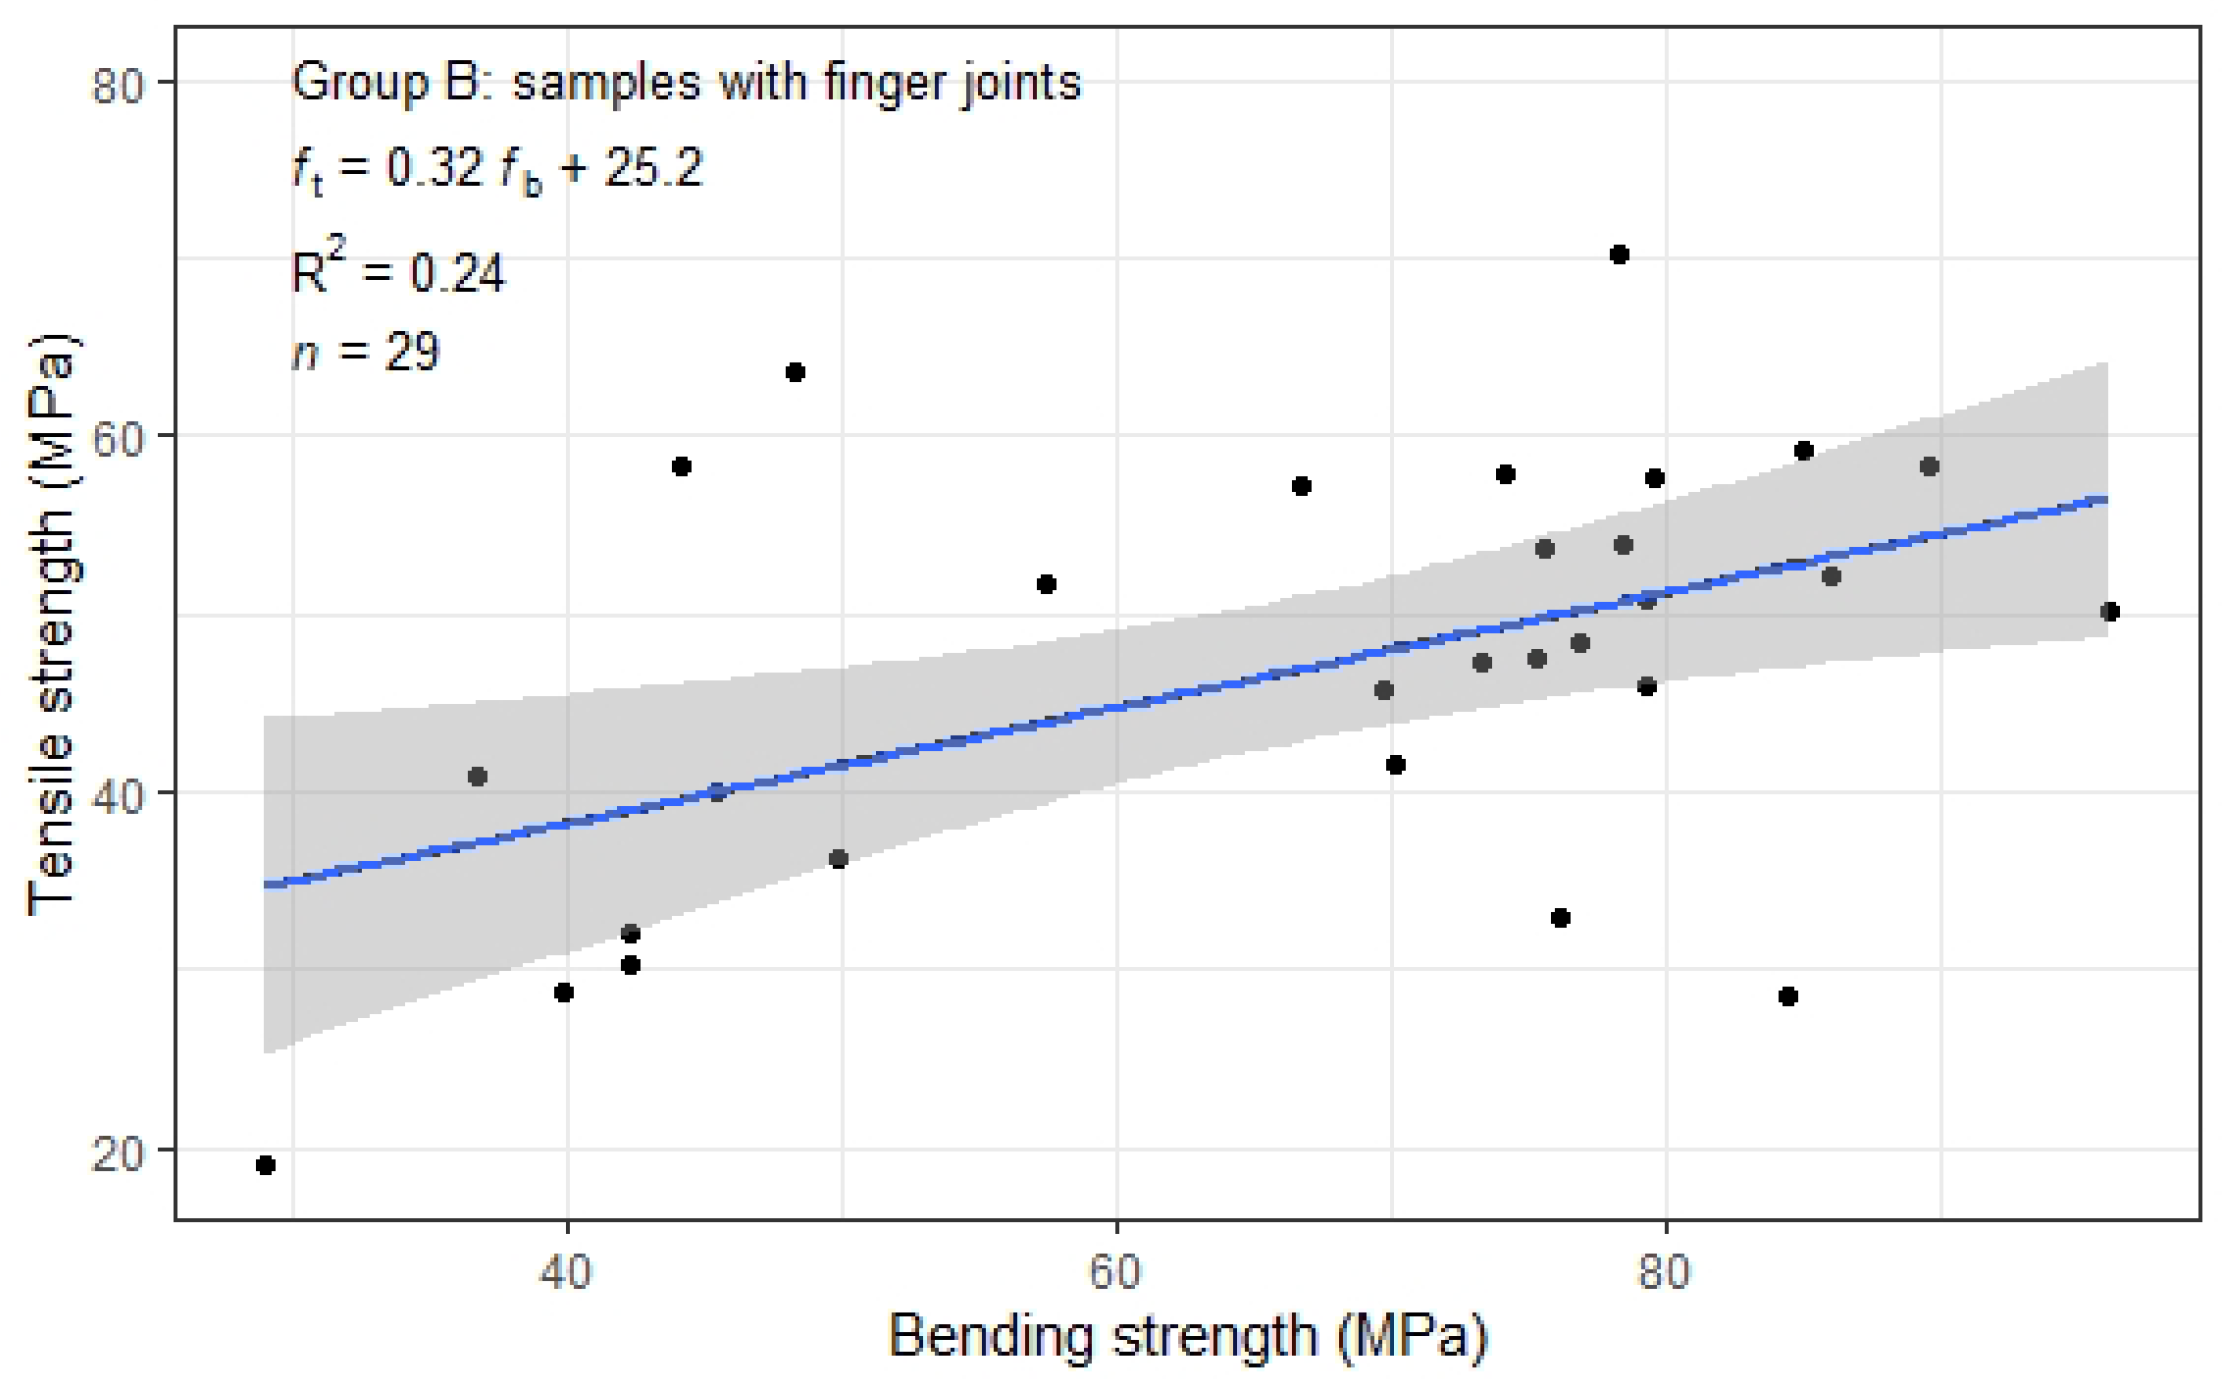
- Explore the correlation between bending and tensile strength;
- Predict the strengths by non-destructive properties.
2. Materials and Methods
2.1. Material
- Remove knots that were larger than 3/8 boards’ width;
- Remove want, pocket, and wane;
- Ensure that knots are away from the nearest end by more than 50 mm;
- Ensure that the lengths of the shook were less than 1.5 m and more than 0.3 m.
2.2. Finger-Joint Processing
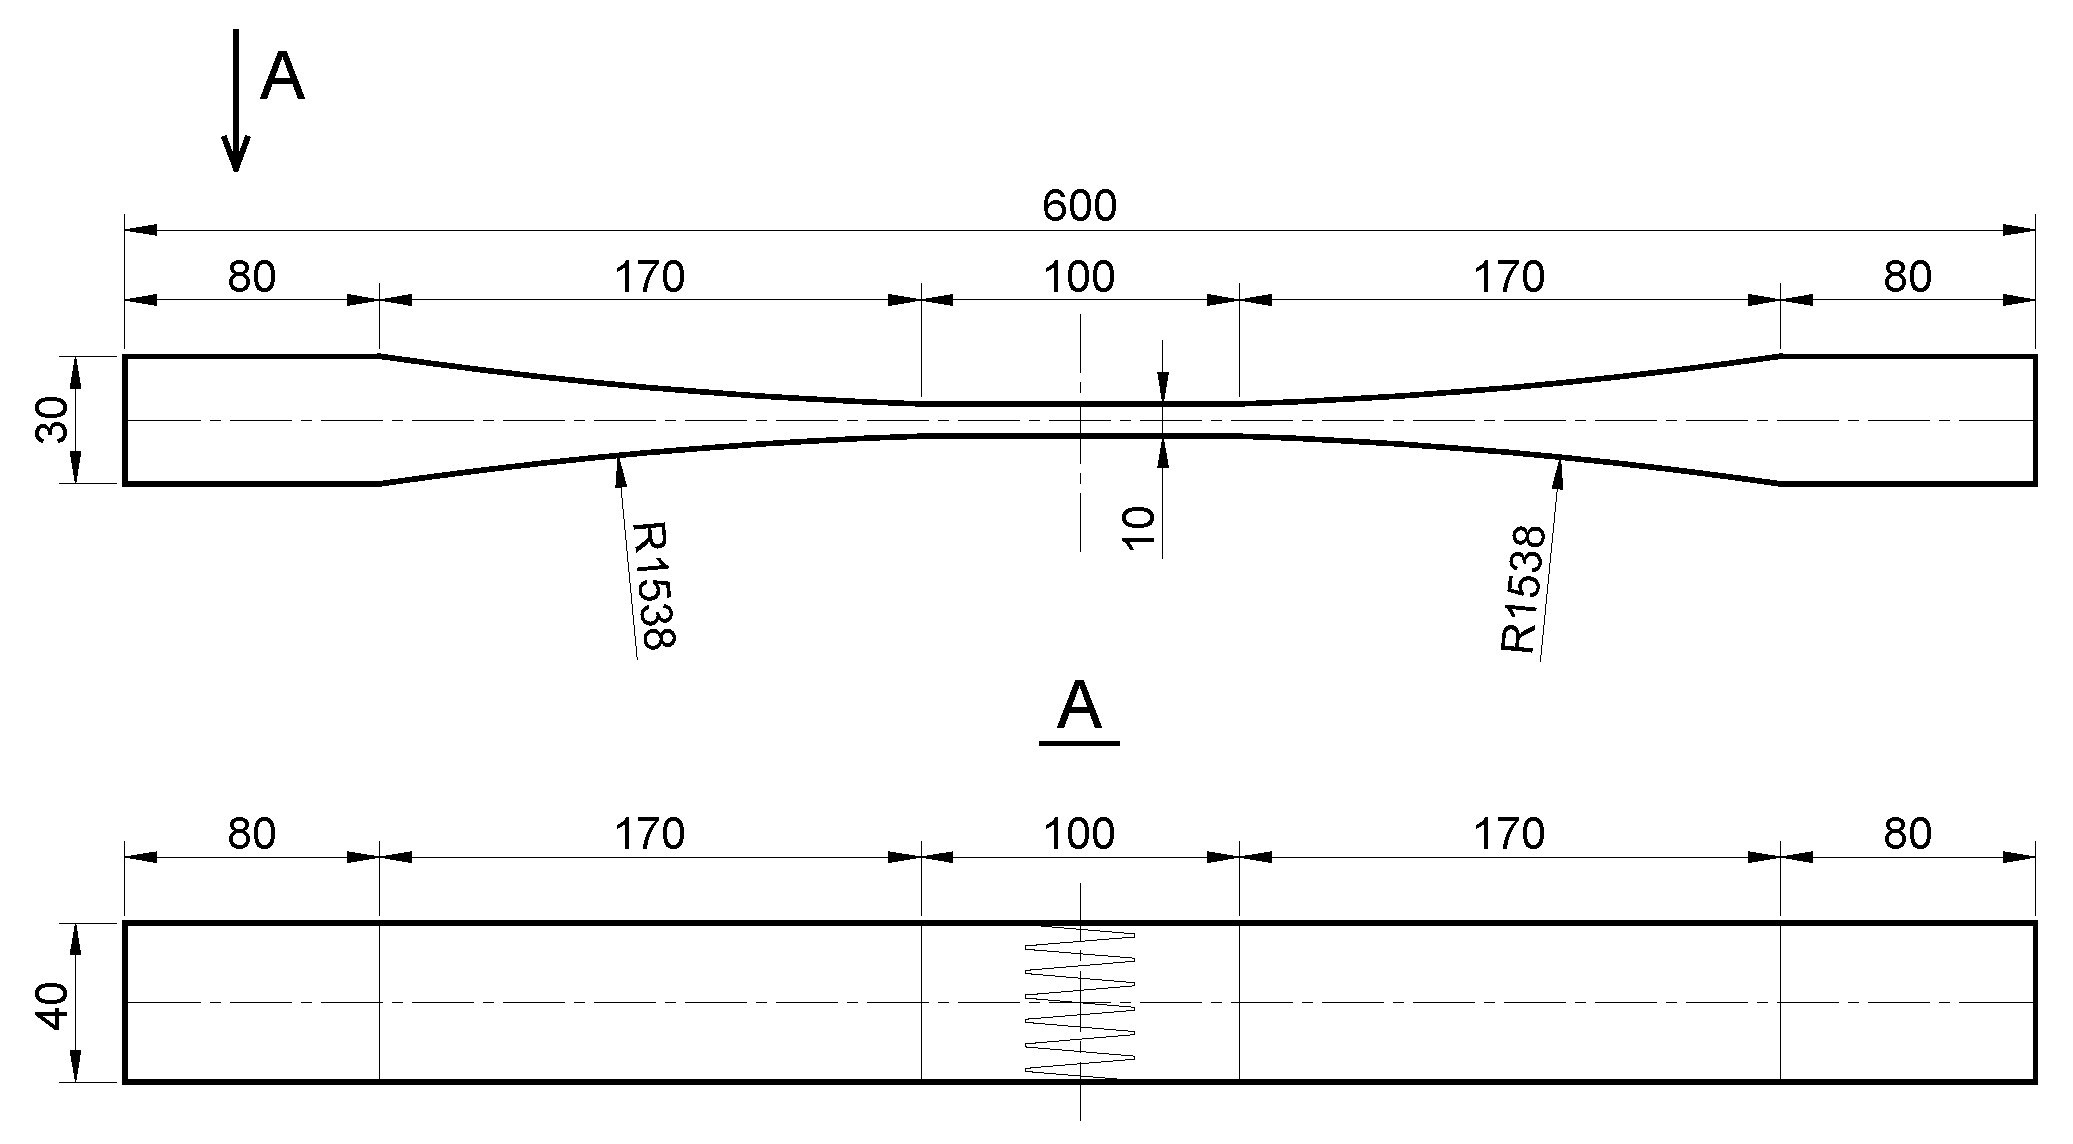
2.3. Preparation of the Samples
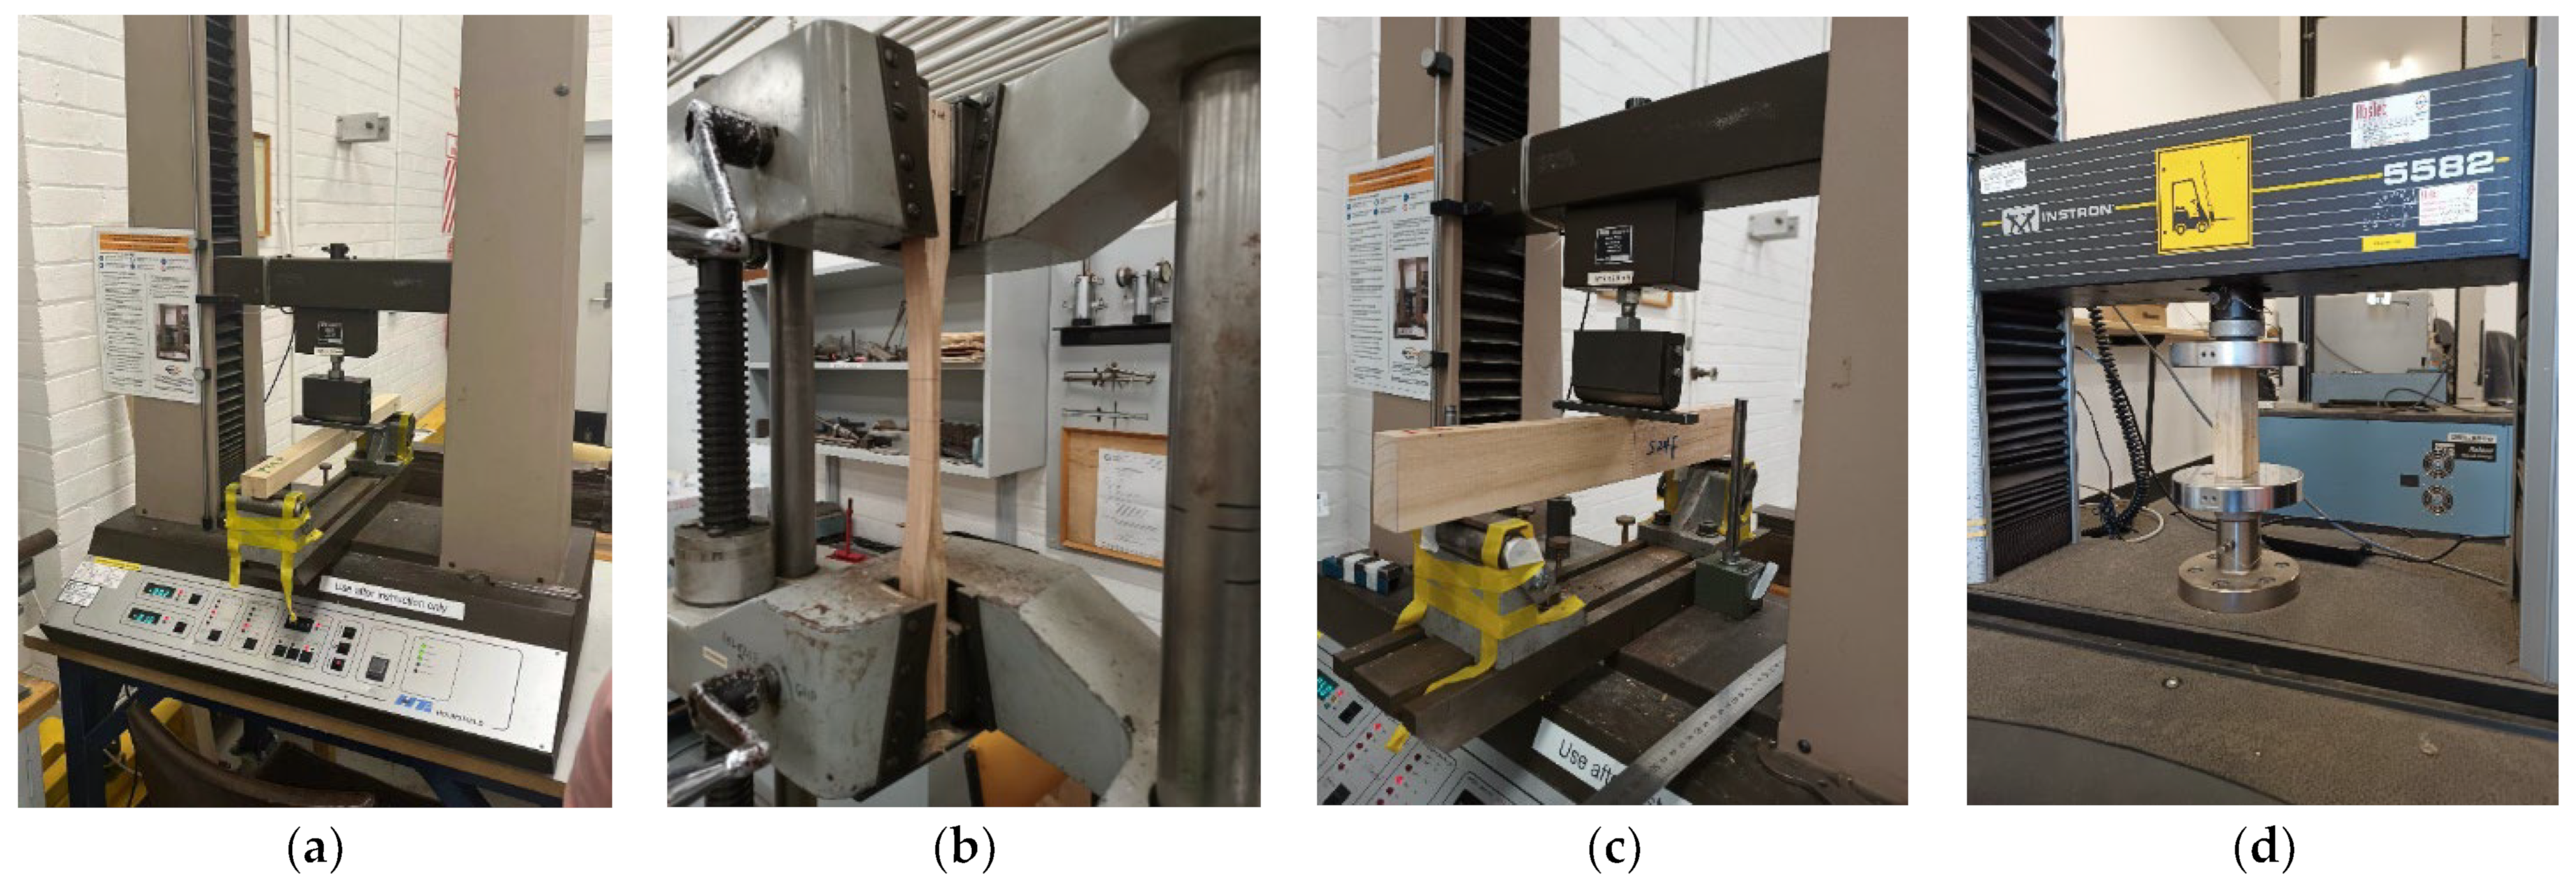
2.4. Mechanical Tests
2.5. Data Analysis
2.5.1. Statistical Comparison
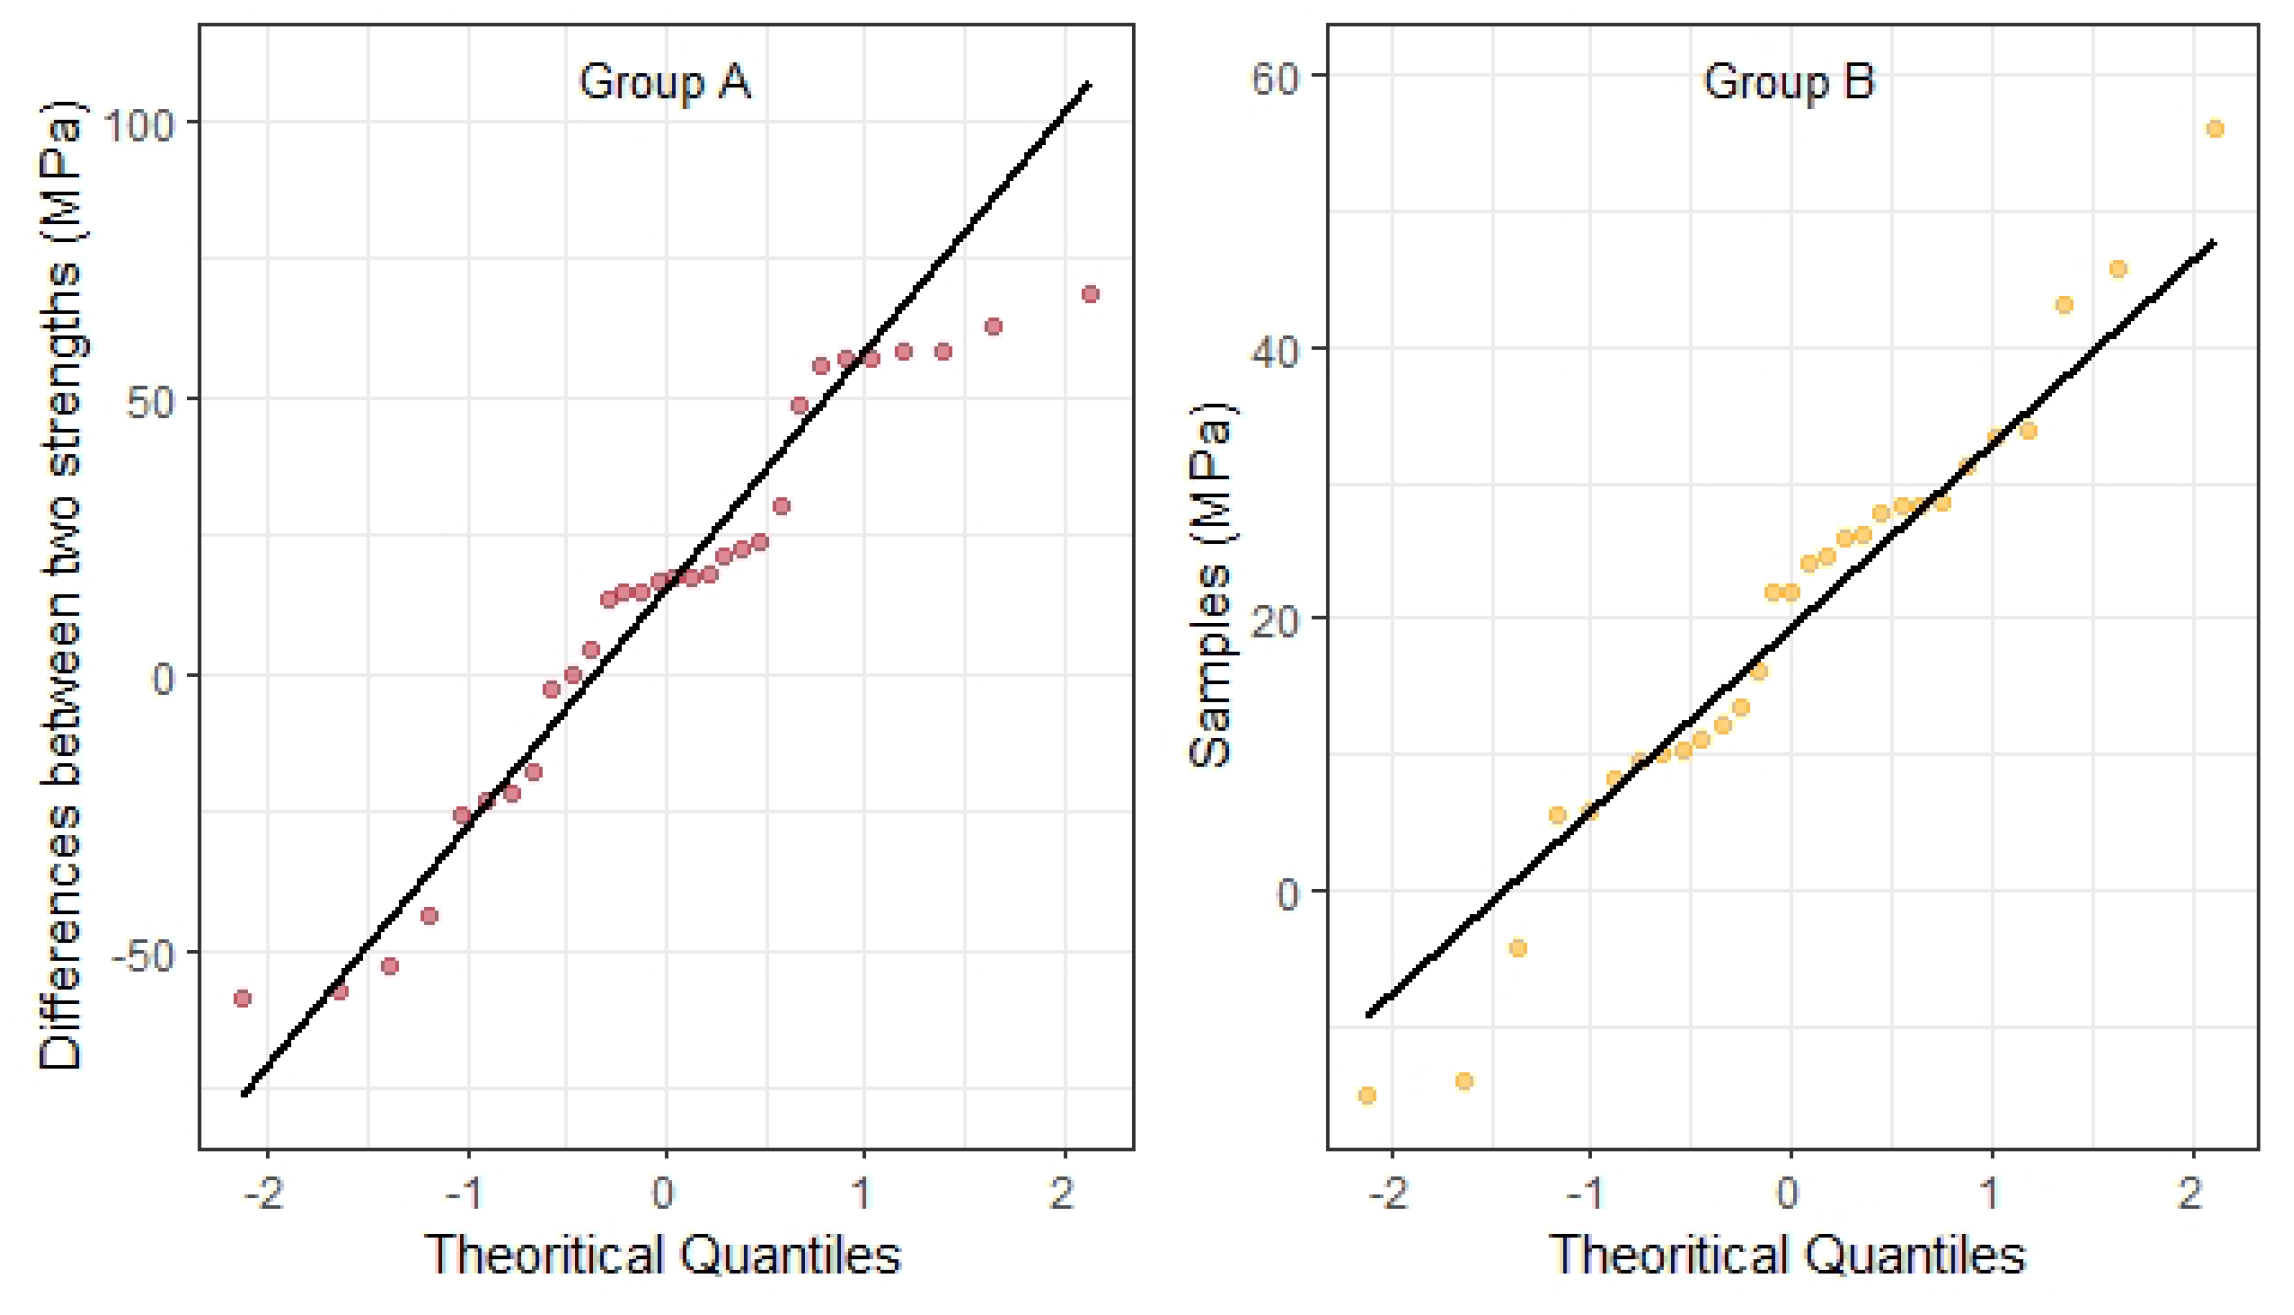
- The quantile–quantile (Q–Q) plots were produced to verify the normality distribution of the difference between paired bending and tensile strength;
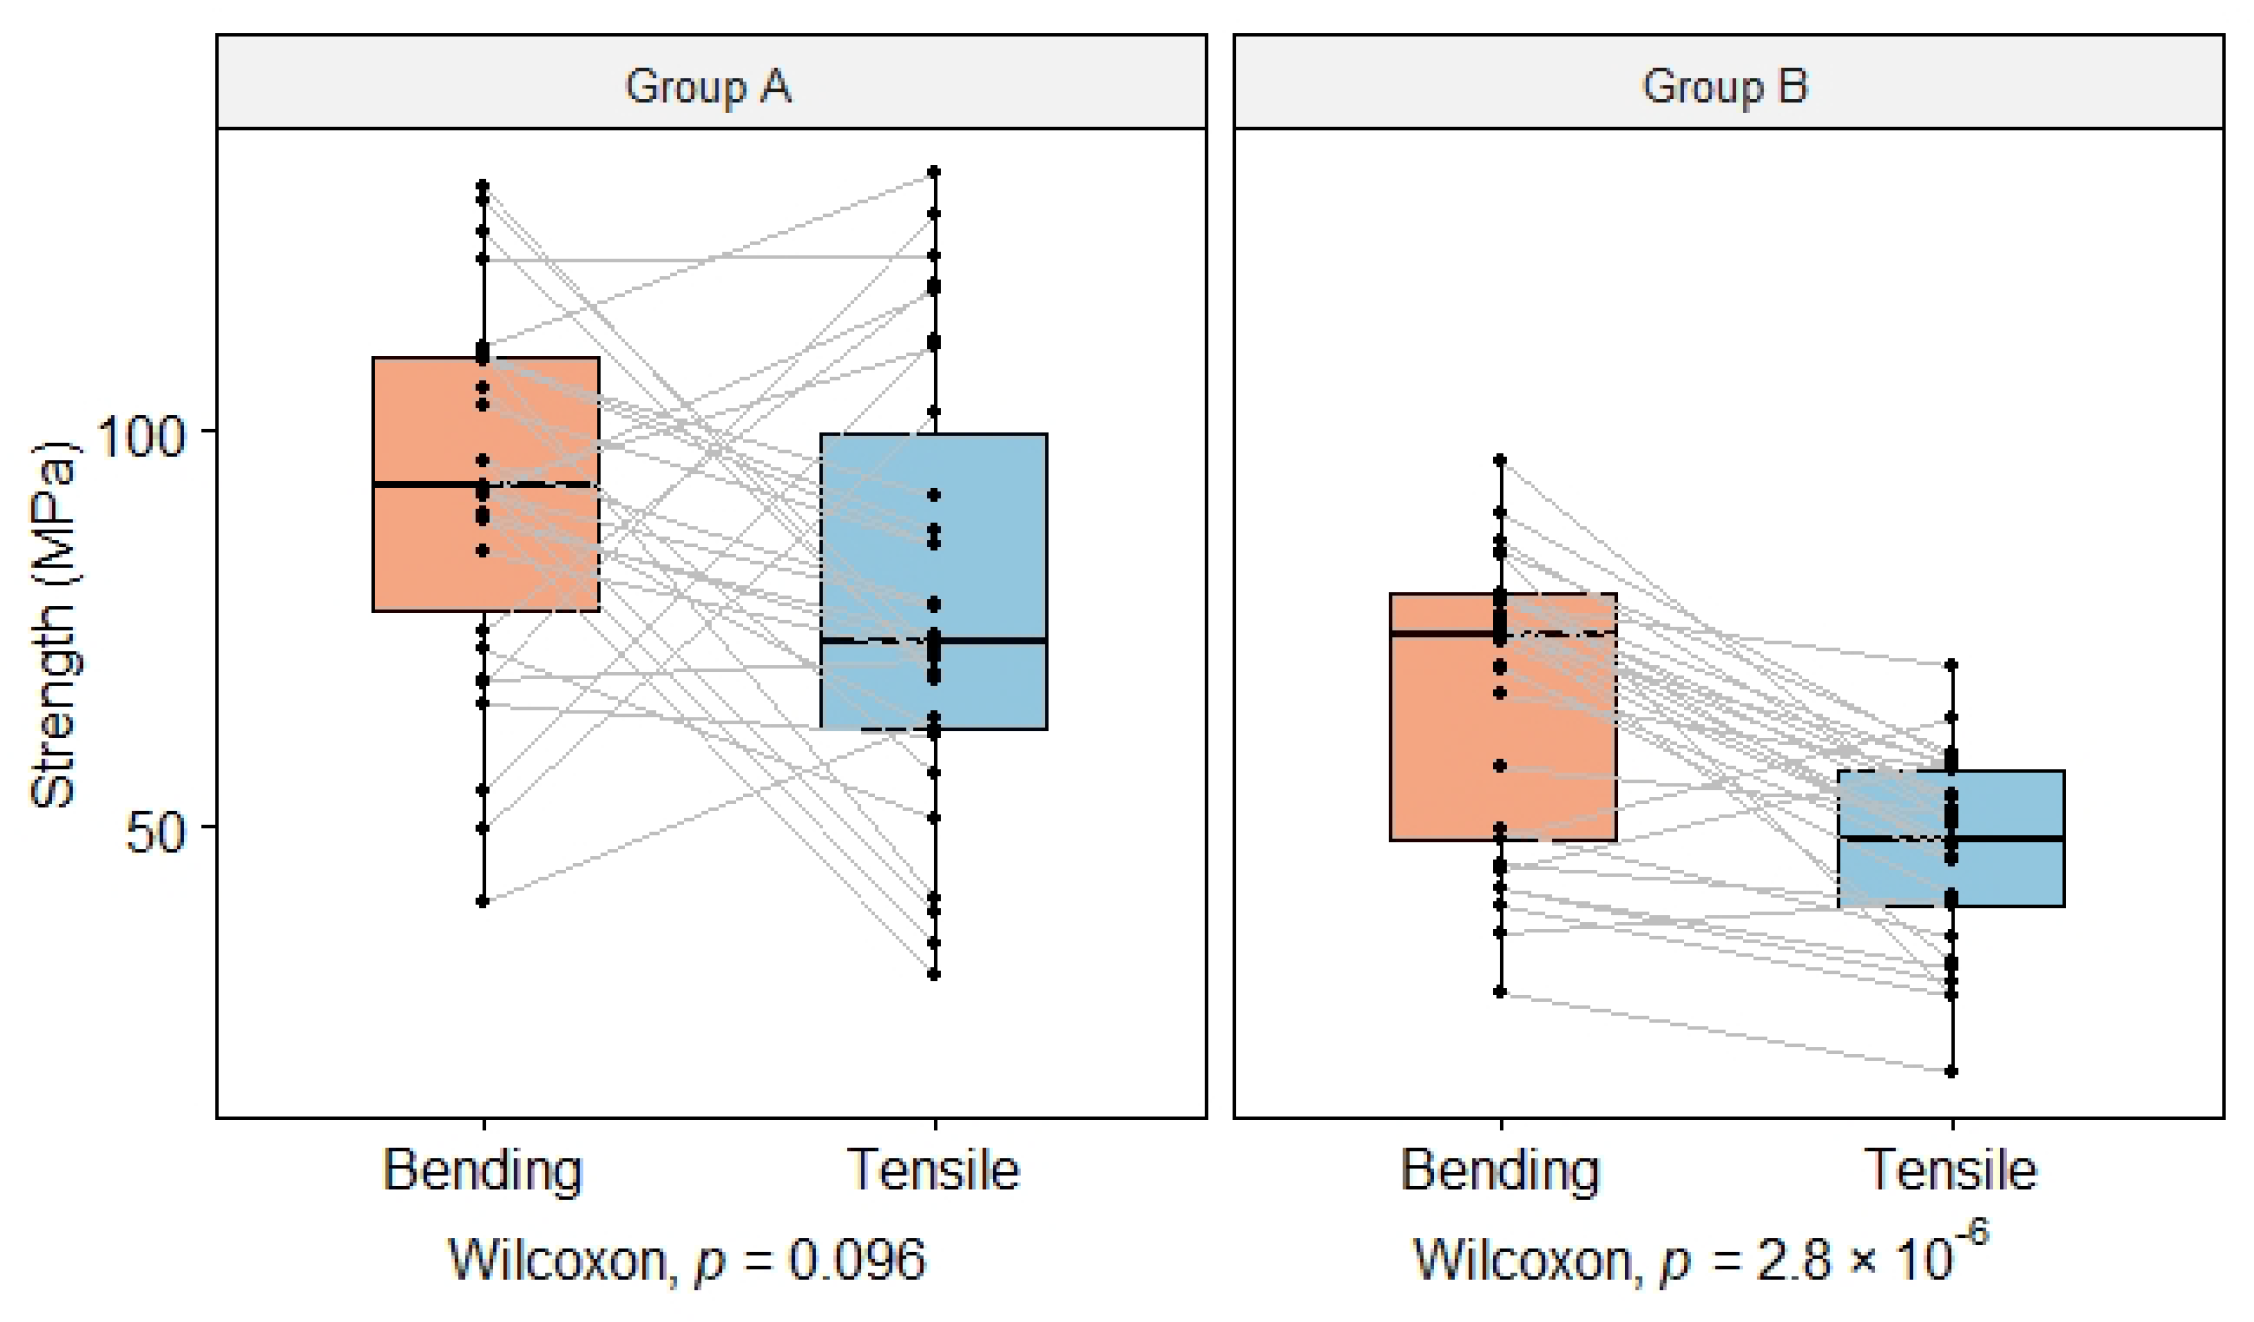
- Paired Wilcoxon tests (Wilcoxon signed-rank test) were performed across the sample groups. This test is used for non-normally distributed data.
- Pearson’s tests were conducted to calculate the correlation coefficients;
- Linear regressions were conducted to establish the relationships between bending and tensile strength of finger-jointed specimens.
- Shapiro–Wilk tests were conducted to verify the normality of the distribution of the residuals. This test is a more appropriate method for a small sample size (n < 50) [22].
2.5.2. Prediction of Strength
- Build the model NEST by general linear regression. Predictors combine factors (categorical) and covariates (continuous);
- Calculate Akaike’s information criterion (AIC) values of all the models to select the best model;
- Refit the best model to predict the strength values.
- Bending strength: the general linear model was established considering one factor and three covariates, including , , , and ;
- Tensile strength: the model was established considering the same factor and covariates with the bending strength model;
- Bearing strength: and were considered.
3. Results
3.1. Paired Bending and Tensile Test
3.1.1. Comparison of Strength between Groups
3.1.2. Prediction of the Strength
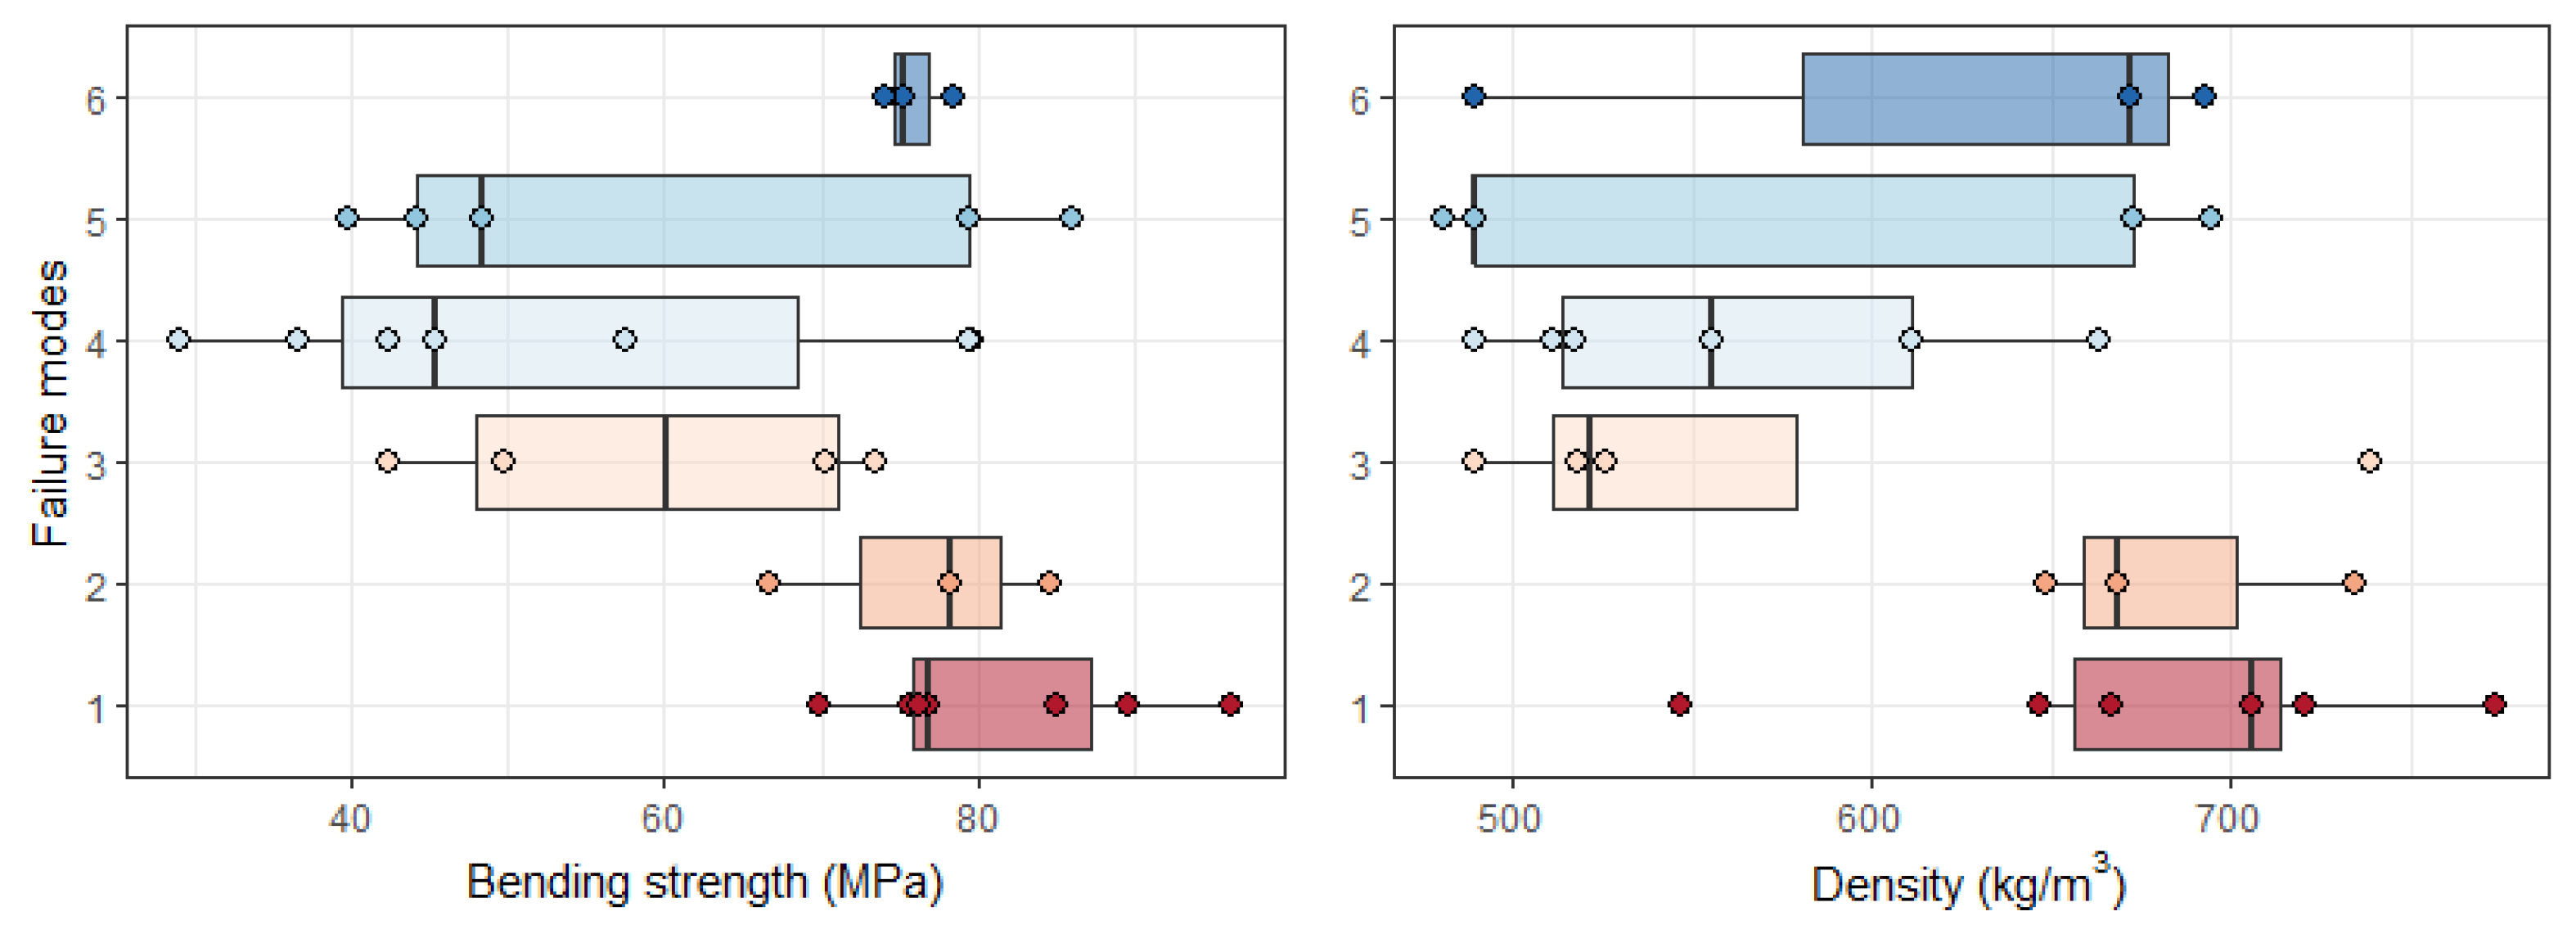
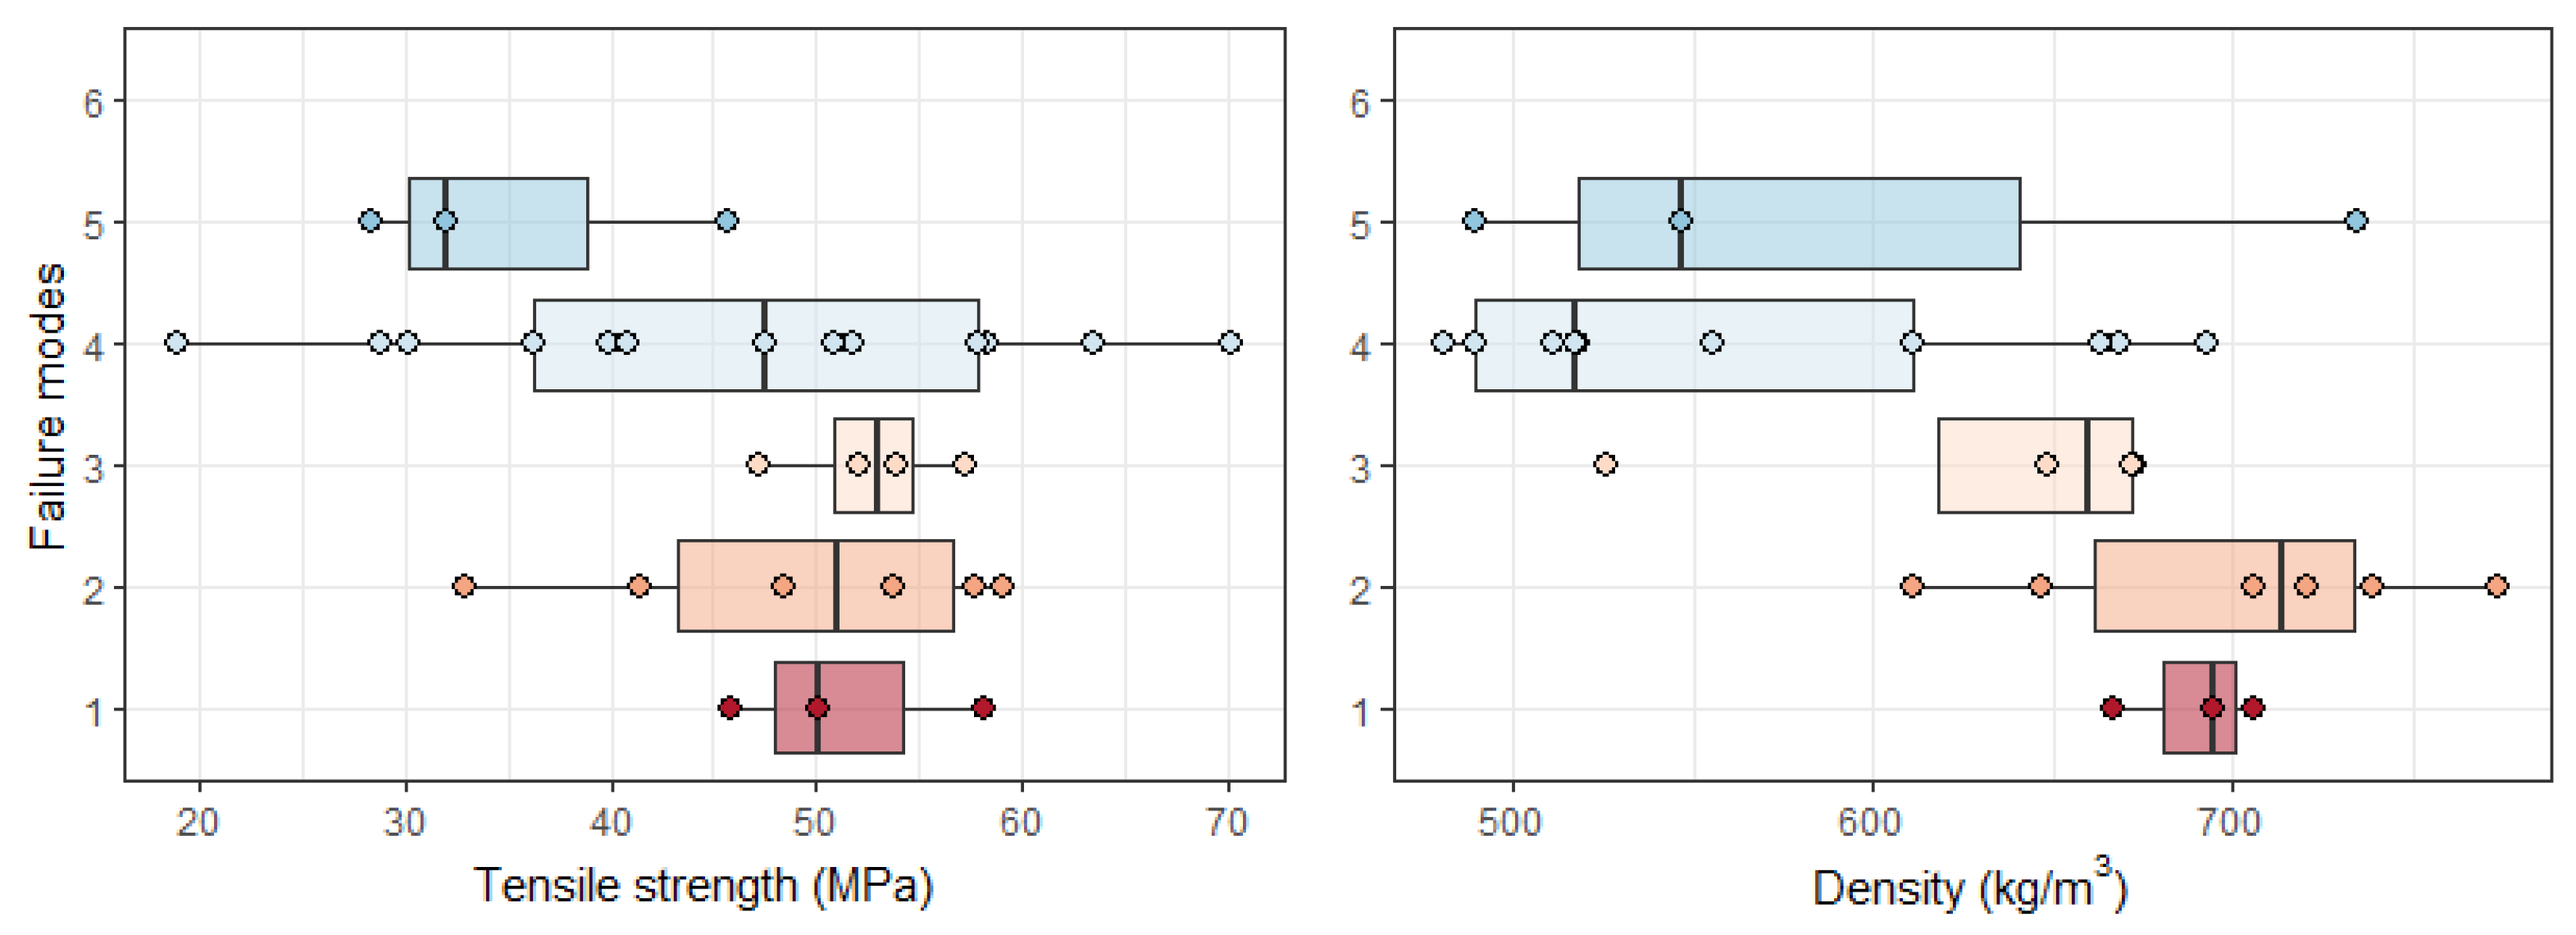
3.1.3. Failure Mode of the Samples with Finger Joints
3.2. Shear Test
3.3. Bearing Test (Parallel to the Grain)
3.3.1. Comparison of Strength between Groups
3.3.2. Prediction of Bearing Strength
3.3.3. Failure Mode
4. Discussion
4.1. Comparison with References
4.2. Comparison of Finger-Joint Efficiency with the Reduction Factor of Strength
5. Conclusions
- The finger-joint efficiency in bending, tensile, and bearing is 0.73, 0.62, and 0.86, respectively;
- The finger-jointed E. nitens boards are classified as F11 or MGP12 per Australian standards;
- The short-span test is inefficient in obtaining the shear strength of fiber-managed E. nitens boards, especially for the finger-jointed ones. However, the shear test results indicate that the shear beam performance of finger-jointed boards does not need to be considered;
- Paired bending and tensile tests show that the tensile strength of samples without finger joints is similar to bending strength on average, but those with finger joints are significantly lower than bending strength;
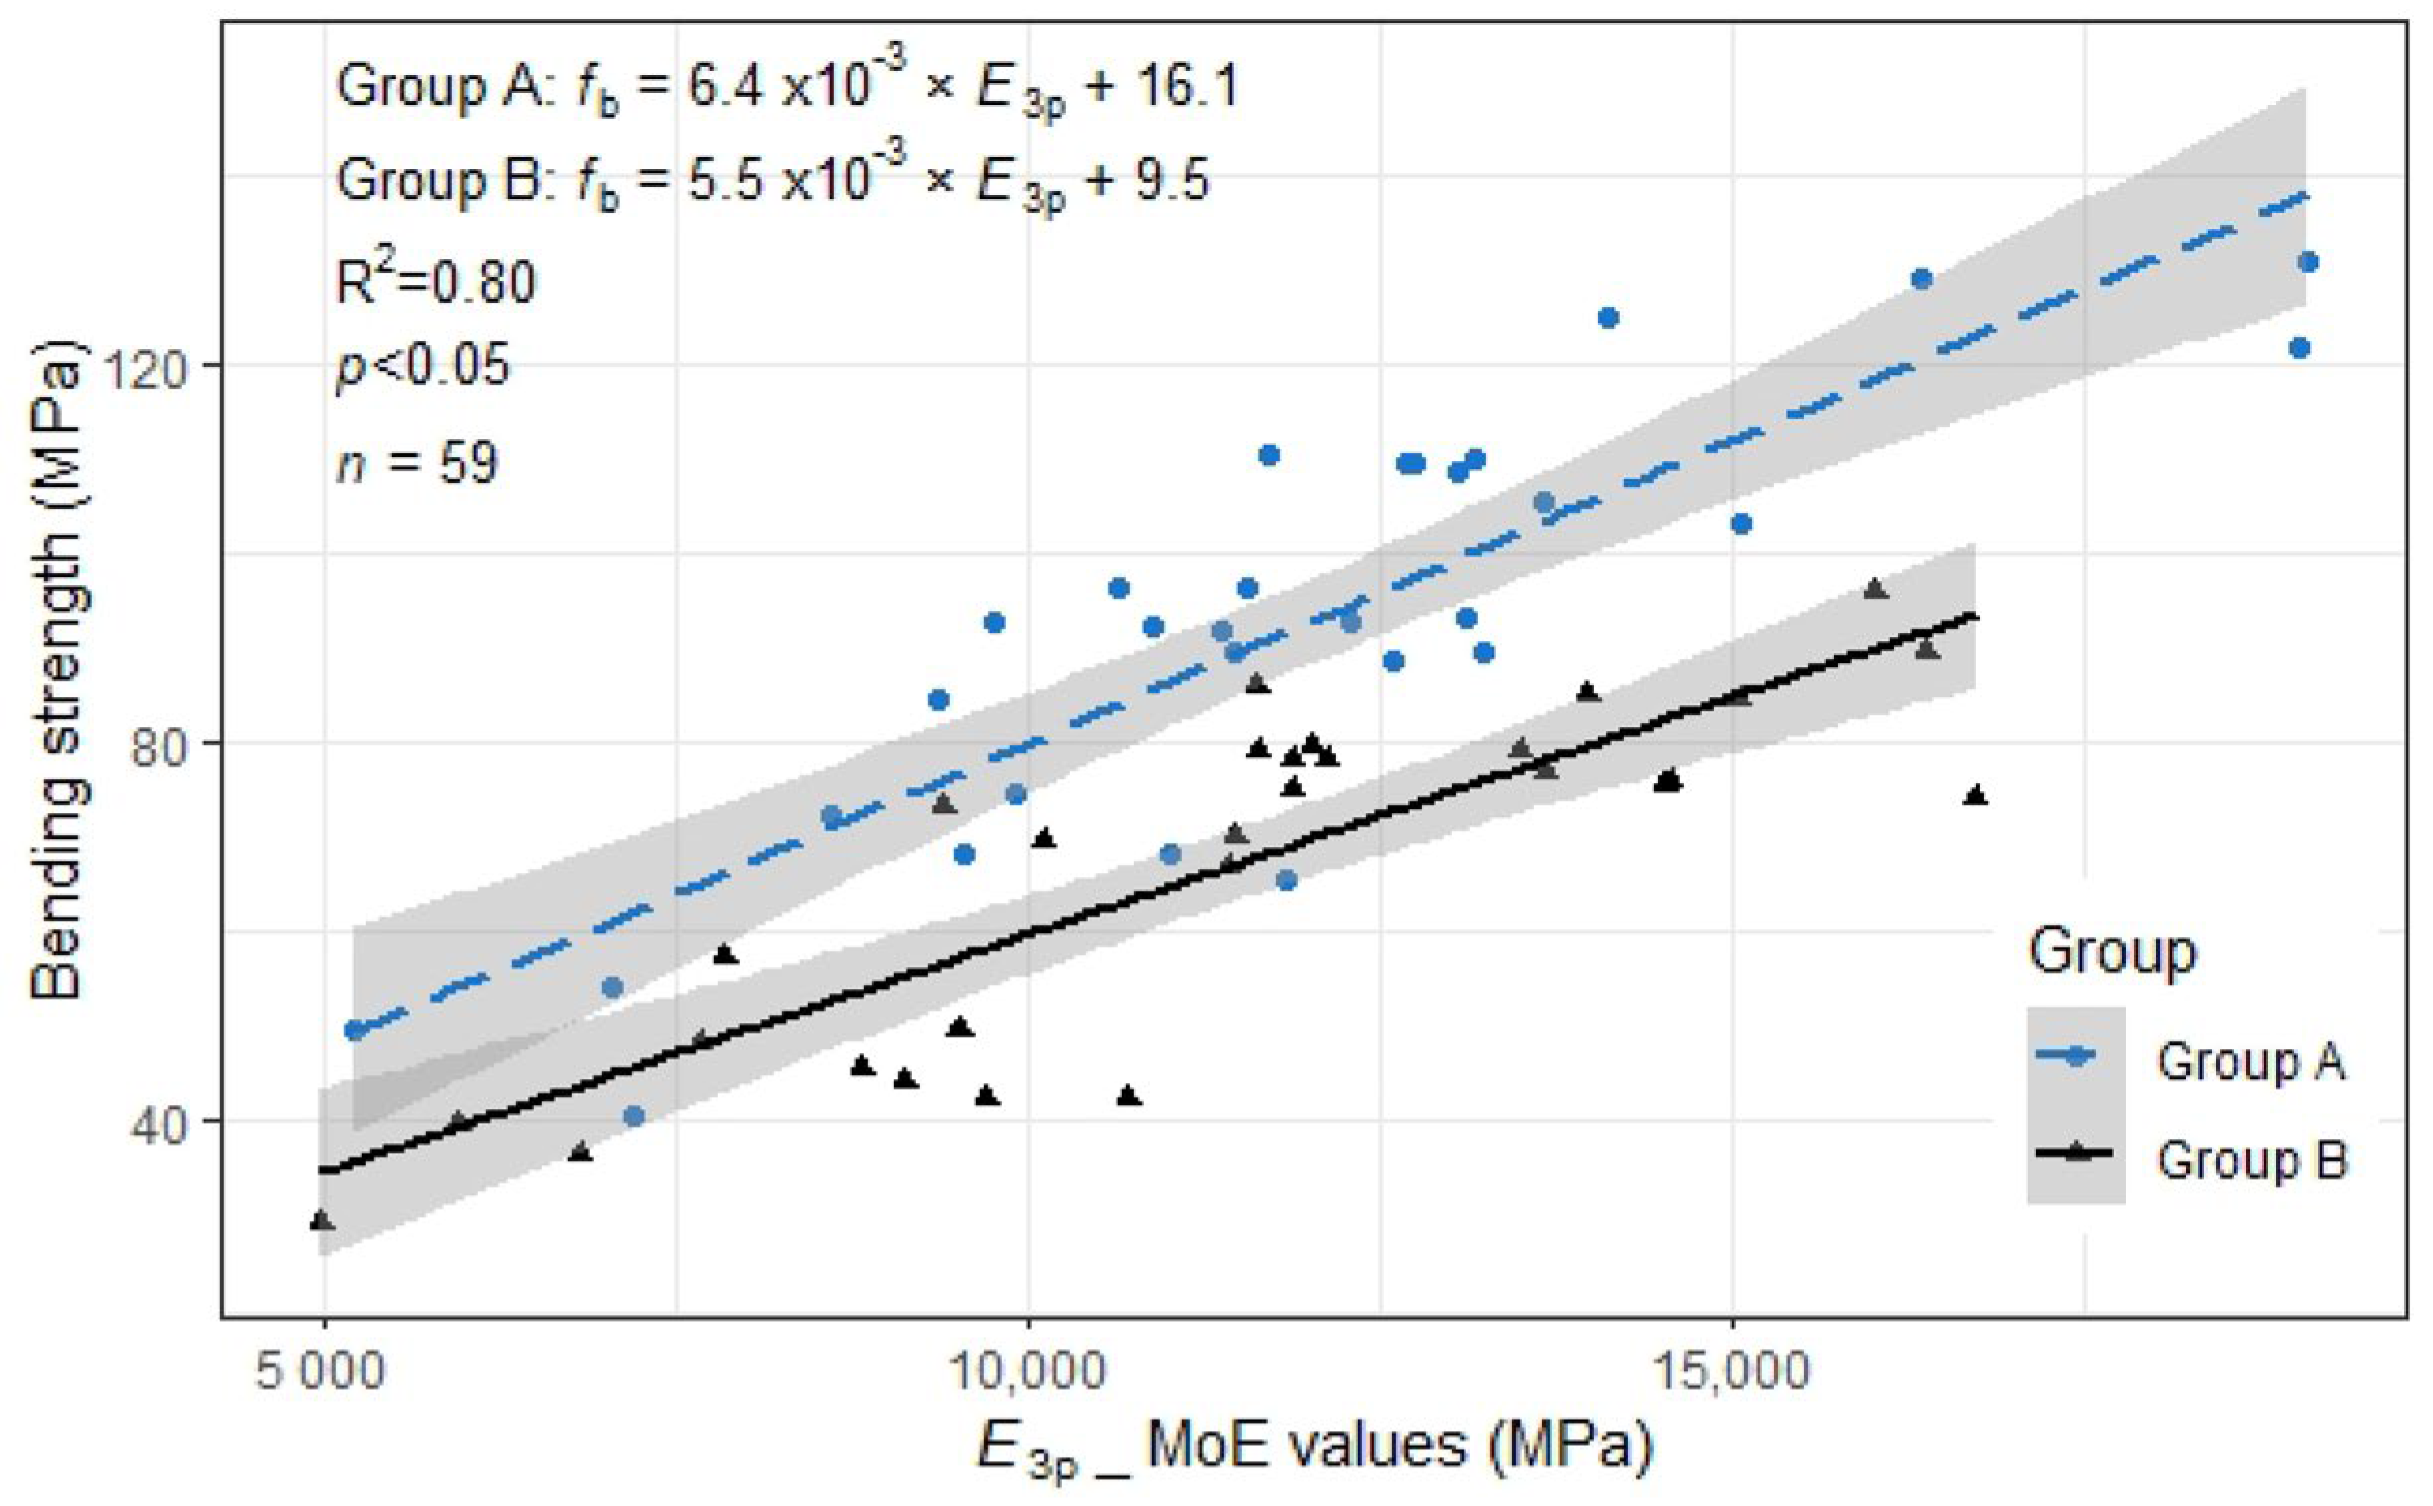
- Bending strength could be predicted by MoE value. The R2 value is 0.78;
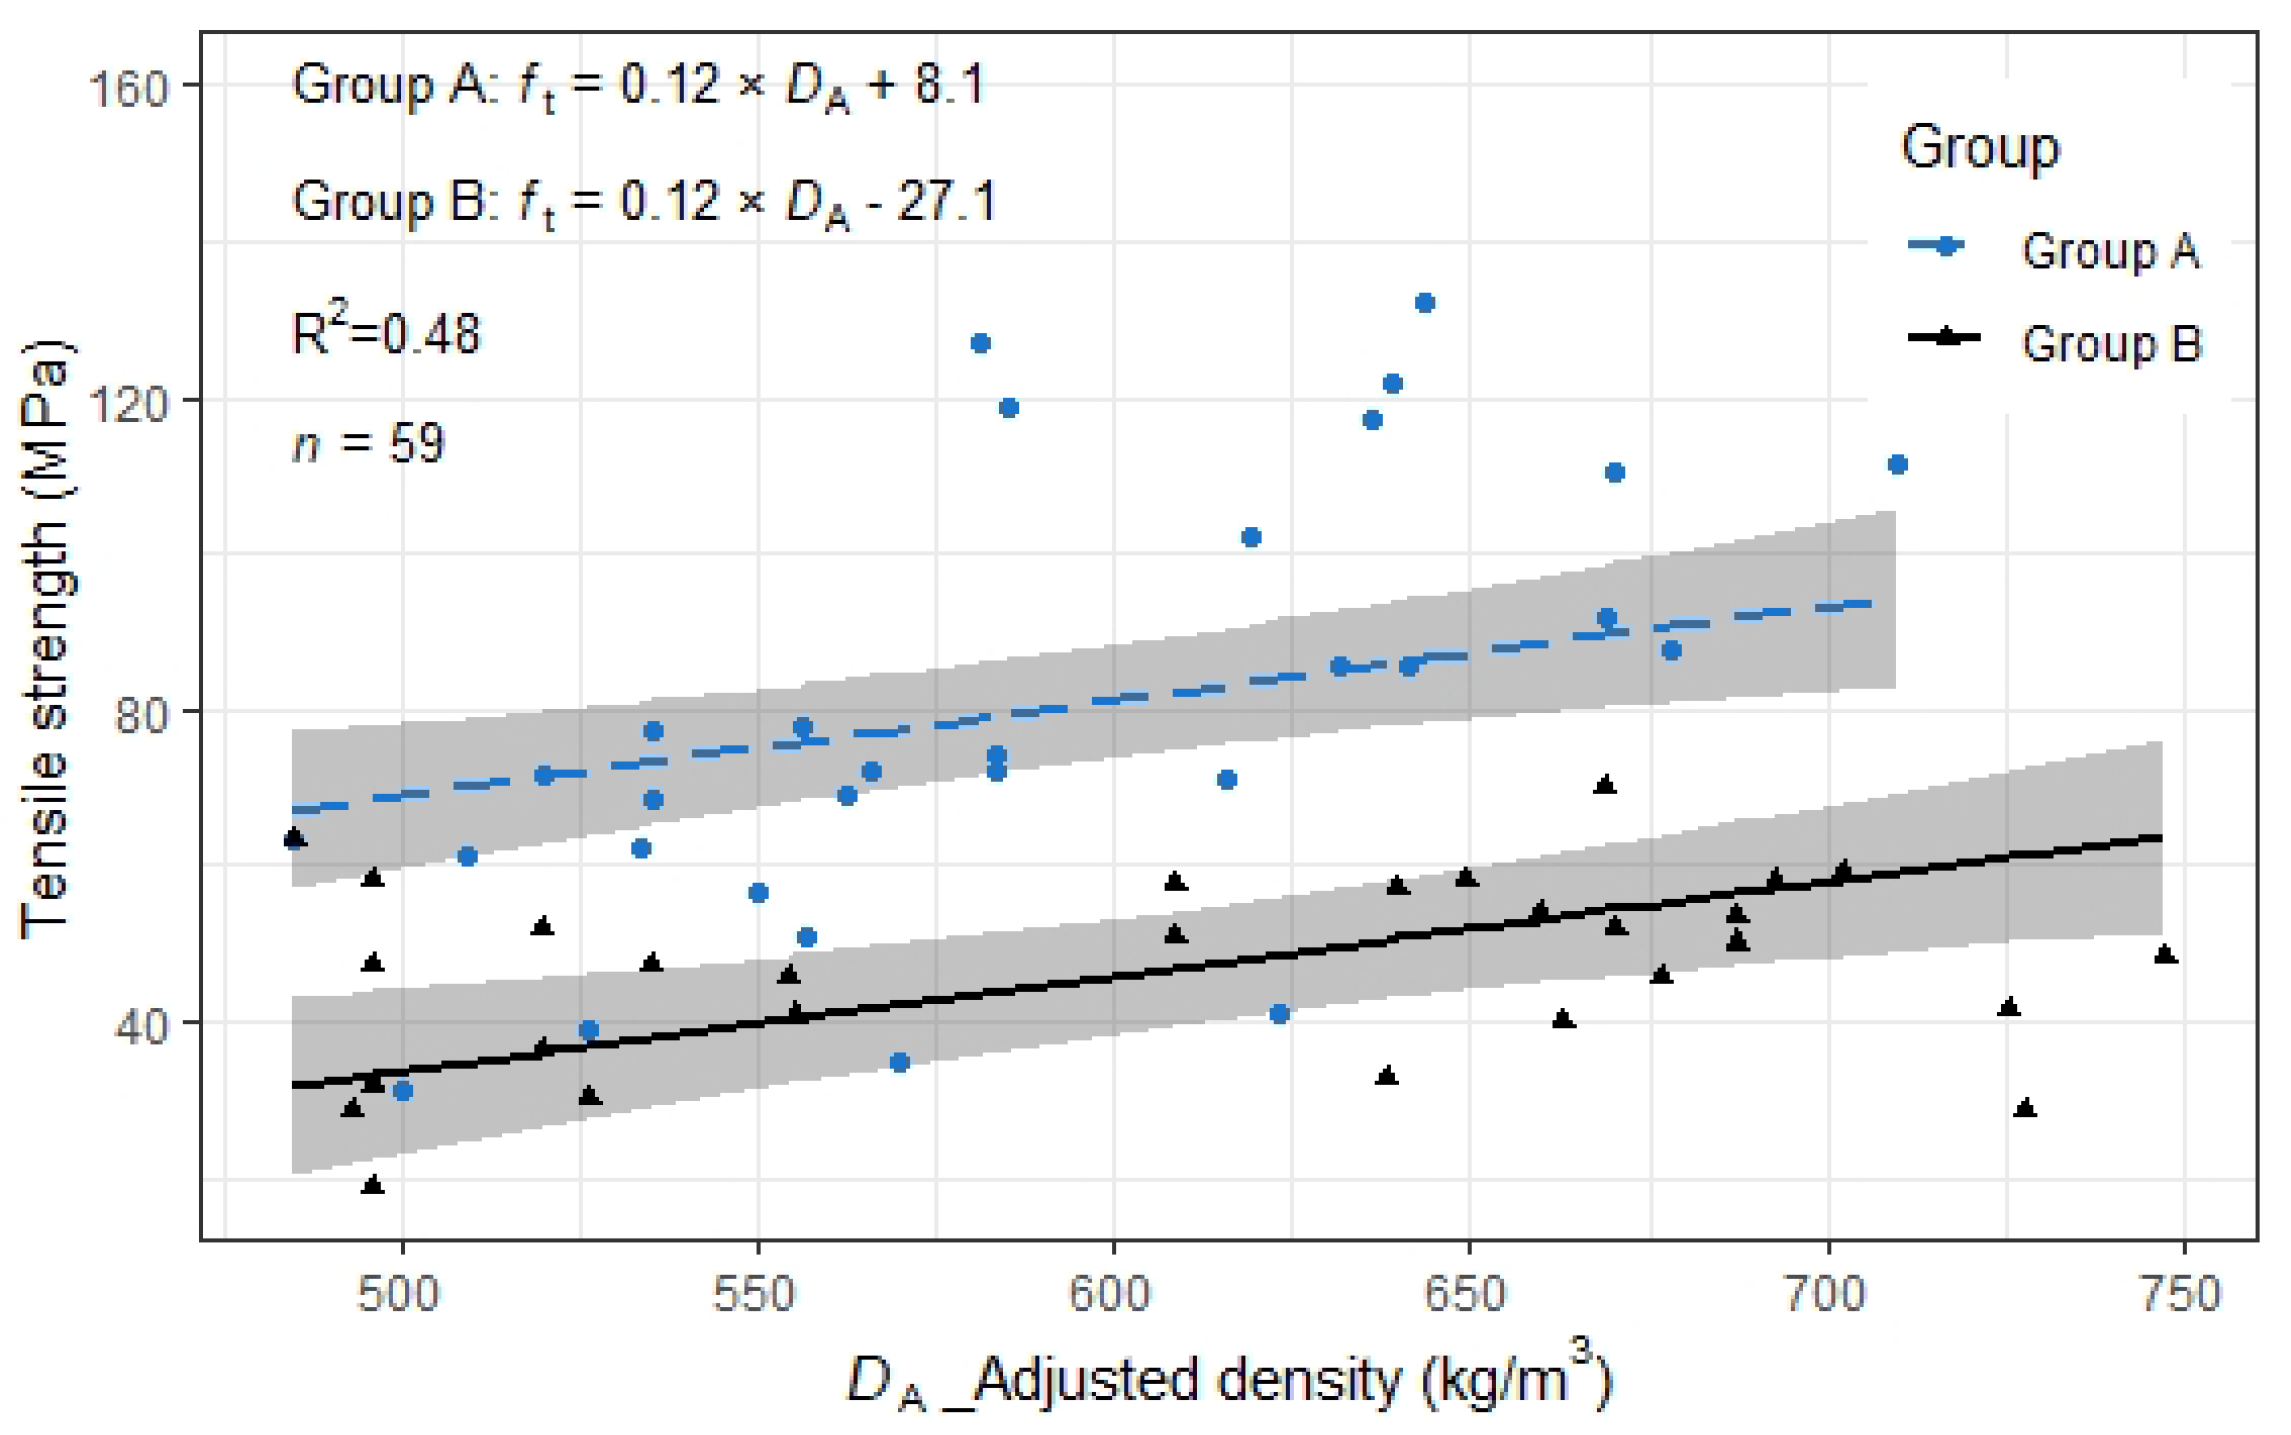
- Tensile and bearing strength are highly correlated to density. The R2 values are 0.47 and 0.75, respectively;
- Glue line failure occurred on one-third of the bending and tensile specimens as per AS 5068-2006. However, their strengths are not low.
Author Contributions
Funding
Data Availability Statement
Acknowledgments
Conflicts of Interest
Abbreviations
| 1C–PUR | One-component polyurethane |
| AIC | Akaike’s information criterion method |
| AIC value | Calculated by log-likelihood and the number of estimated parameters. |
| ANOVA | Analysis of variance |
| B1–B6 | Failure mode 1–6 as per AS5068-2006 in bending test |
| CI | Confidence interval |
| cor | Correlation coefficient |
| CV | Coefficient of variation |
| Density-adjusted moisture content to 12% | |
| df | Degrees of freedom |
| E. nitens | Eucalyptus nitens |
| FSP | Fibre saturation point |
| Sample’s groups | |
| IQR | Interquartile range |
| K | Number of estimated parameters |
| LL | Log-likelihood |
| MAE | Mean absolute error |
| MC | Moisture content |
| MoE | Modulus of elasticity |
| MSE | Mean square error |
| p | p value in statistical analysis |
| Q–Q plot | Quantile–quantile plot |
| RMSE | Root mean square error |
| SD | Standard deviation |
| T1–T5 | Failure mode 1–5 as per AS5068-2006 in the tensile test |
References
- Larcombe, M.J.; Potts, B.M.; Jones, R.C.; Steane, D.A.; Silva, J.C.E.; Vaillancourt, R.E. Managing Australia’s eucalypt gene pools: Assessing the risk of exotic gene flow. Proc. R. Soc. Vic. 2016, 128, 25. [Google Scholar] [CrossRef] [Green Version]
- Derikvand, M.; Nolan, G.; Jiao, H.; Kotlarewski, N.J. What to Do with Structurally Low-Grad Wood from Australia’s Plantation Eucalyptus; Building Application? BioResources 2016, 12, 4–7. [Google Scholar] [CrossRef] [Green Version]
- Martins, C.; Dias, A.M.P.G.; Cruz, H. Blue gum: Assessment of its potential for glued laminated timber beams. Eur. J. Wood Wood Prod. 2020, 78, 905–913. [Google Scholar] [CrossRef]
- Ong, C.B.; Ansell, M.P.; Chang, W.-S.; Walker, P. Bending properties of finger-jointed Malaysian dark red meranti. Int. Wood Prod. J. 2019, 10, 49–54. [Google Scholar] [CrossRef]
- Tran, V.-D.; Oudjene, M.; Méausoone, P.-J. FE analysis and geometrical optimization of timber beech finger-joint under bending test. Int. J. Adhes. Adhes. 2014, 52, 40–47. [Google Scholar] [CrossRef]
- Burdzik, W.M.G. Finger joint strength. A laminated beam strength predictor? S. Afr. For. J. 1997, 178, 39–45. [Google Scholar] [CrossRef]
- Ehrhart, T.; Steiger, R.; Lehmann, M.; Frangi, A. European beech (Fagus sylvatica L.) glued laminated timber: Lamination strength grading, production and mechanical properties. Eur. J. Wood Wood Prod. 2020, 78, 971–984. [Google Scholar] [CrossRef]
- Yang, J.L.; Waugh, G. Potential of plantation-grown eucalypts for structural sawn products. II. Eucalyptus nitens (Dean & Maiden) Maiden and E. regnans F. MuelL. Aust. For. 1996, 59, 99–107. [Google Scholar]
- Derikvand, M.; Kotlarewski, N.; Lee, M.; Jiao, H.; Nolan, G. Characterisation of Physical and Mechanical Properties of Unthinned and Unpruned Plantation-Grown Eucalyptus nitens H.Deane & Maiden Lumber. Forests 2019, 10, 194. [Google Scholar] [CrossRef] [Green Version]
- Chen, X.; Cheng, Y.; Chan, A.; Holloway, D.; Nolan, G. Anisotropic Tensile Characterisation of Eucalyptus nitens Timber above Its Fibre Saturation Point, and Its Application. Polymers 2022, 14, 2390. [Google Scholar] [CrossRef] [PubMed]
- Cheng, Y.; Chan, A.H.; Holloway, D.; Nolan, G. Anisotropic material behaviour under compression of Eucalyptus nitens with high moisture content. Constr. Build. Mater. 2021, 314, 124788. [Google Scholar] [CrossRef]
- Cheng, Y.; Nolan, G.; Holloway, D.; Kaur, J.; Lee, M.; Chan, A. Flexural characteristics of Eucalyptus nitens timber with high moisture content. Bioresources 2021, 16, 2921–2936. [Google Scholar] [CrossRef]
- Gutierrez, M.; Ettelaei, A.; Kotlarewski, N.; Lee, M. Structural Properties of Commercial Australian Plantation Hardwood CLT. Buildings 2023, 13, 208. [Google Scholar] [CrossRef]
- Lehmann, M.; Clerc, G.; Lehringer, C.; Strahm, T.; Volkmer, T. Investigation of the Bond Quality and the Finger Joint Strength of Beech Glulam. In Proceedings of the World Conference on Timber Engineering (WCTE), Seoul, Republic of Korea, 20–23 August 2018. [Google Scholar]
- Morin-Bernard, A.; Blanchet, P.; Dagenais, C.; Achim, A. Glued-laminated timber from northern hardwoods: Effect of finger-joint profile on lamellae tensile strength. Constr. Build. Mater. 2020, 271, 121591. [Google Scholar] [CrossRef]
- Amoah, M.; Kwarteng, F.O.; Dadzie, P.K. Bending properties and joint efficiency of some tropical hardwoods finger-jointed in green and dry states. J. Indian Acad. Wood Sci. 2014, 11, 57–64. [Google Scholar] [CrossRef]
- AS/NZS1328.1:1998; Glued Laminated Structural Timber Part 1: Performance Requirements and Minimum Production Requirements. SAI Global Limited Under Licence from Standards Australia Limited: Sydney, Australia, 1998.
- EN 14080:2013; Timber Structures—Glued Laminated Timber and Glued Solid Timber—Requirements. CEN: Brussels, Belgium, 2013.
- AS5068-2006; Timber-Finger Joints in Structural Products—Production Requirements. SAI Global Limited Under Licence from Standards Australia Limited: Sydney, Australia, 2006.
- ASTM(D3500-14); Standard Test Methods for Structural Panels in Tension. World Trade Organization Technical Barriers to Trade (TBT) Committee: Geneva, Switzerland, 2014.
- AS/NZS4063.1:2010; Characterization of Structural Timber Test Methods. SAI Global Limited Under Licence from Standards Australia Limited: Sydney, Australia, 2010.
- Mishra, P.; Pandey, C.M.; Singh, U.; Gupta, A.; Sahu, C.; Keshri, A. Descriptive statistics and normality tests for statistical data. Ann. Card. Anaesth. 2019, 22, 67–72. [Google Scholar] [PubMed]
- Lara-Bocanegra, A.J.; Majano-Majano, A.; Crespo, J.; Guaita, M. Finger-Joint Performance in Engineered Laminated Products Made of Eucalyptus Globulus; Vienna University of Technology: Vienna, Austria, 2016. [Google Scholar]
- Bahtiar, E.T.; Erizal, E.; Hermawan, D.; Nugroho, N.; Hidayatullah, R. Experimental Study of Beam Stability Factor of Sawn Lumber Subjected to Concentrated Bending Loads at Several Points. Forests 2022, 13, 1480. [Google Scholar] [CrossRef]
- Aicher, S.; Stapf, G. Glulam from European White Oak: Finger Joint Influence on Bending Size Effect. In Materials and Joints in Timber Structures; Aicher, S., Reinhardt, H.W., Garrecht, H., Eds.; Springer: Dordrecht, The Netherlands, 2014; pp. 641–656. [Google Scholar]
- Muthumala, C.K.; De Silva, S.; Arunakumara, K.K.I.U.; Alwis, P.L.A.G. Failure Modes and Compression Strength of Seven Finger-Jointed Wood Species from Sri Lanka. J. Fail. Anal. Prev. 2021, 21, 2215–2223. [Google Scholar] [CrossRef]
- AS1720.1-2010; Timber Structures—Part 1: Design Method. SAI Global Limited Under Licence from Standards Australia Limited: Sydney, Australia, 2010.
- Hou, J.; Taoum, A.; Nolan, G.; Kotlarewski, N. Study of the relationship between flatwise and edgewise modulus of elasticity of plantation fibre-managed E. nitens sawn boards. Constr. Build. Mater. 2022, 349, 128774. [Google Scholar] [CrossRef]


| Label | Unit | Value |
|---|---|---|
| end pressure | MPa | 3.0–7.0 |
| pressing time | s | 20 |
| glue spread rate | g/m2 | 140–180 |
| curing time | min | 40 |
| No. | Test | Dimensions (mm) | Group A | Group B |
|---|---|---|---|---|
| 1 | Bending (paired) Tensile (paired, waisted section) | 30 × 40 × 600 | 30 | 29 |
| 2 | 30 × 40 × 600 | 30 | 29 | |
| 3 | Shear | 30 × 65 × 600 | 30 | 29 |
| 4 | Bearing | 30 × 45 × 120 | 30 | 30 |
| Test | Reference Standard | Modulus | Strength | Speed (mm/min) | Diagram |
|---|---|---|---|---|---|
| Bending (paired) | AS 5068-2006 [19] | 15 |  | ||
| Tensile (paired) | ASTM D 3500-14 [20] for Test method; AS 5068-2006 [19] for classification of the failure mode. | / | 15 | 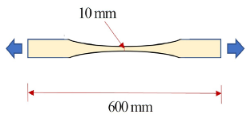 | |
| Shear | AS/NZS 4063.1: 2010 [21] | / | 15 | 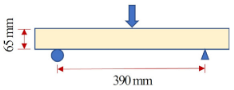 | |
| Bearing | AS/NZS 4063.1: 2010 [21] | / | 10 | 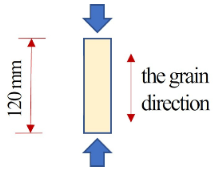 |
| Parameters | Items | Units | Group A | Group B |
|---|---|---|---|---|
| n | Bending | / | 30 | 29 |
| Tensile | / | 30 | 29 | |
| Mean | kg/m3 | 587.2 | 607.1 | |
| MC | Mean | % | 11.9 | 12.3 |
| Mean | MPa | 11,816.7 | 13,230.2 | |
| Mean | MPa | 11,904.2 | 11,348.4 | |
| SD | MPa | 3068.1 | 3088.9 | |
| CV | % | 0.26 | 0.27 | |
| Mean | MPa | 92.1 | 67.4 | |
| SD | MPa | 22.9 | 18.4 | |
| CV | % | 0.25 | 0.27 | |
| Mean | MPa | 79.6 | 49.2 | |
| SD | MPa | 28.0 | 12.1 | |
| CV | % | 0.35 | 0.25 |
| Strength | Statics | Group A | Group B |
|---|---|---|---|
| n | / | 30 | 29 |
| Bending strength | Median | 92.9 | 74.1 |
| IQR | 31.9 | 31.0 | |
| Tensile strength | Median | 73.2 | 48.4 |
| IQR | 37.3 | 17.3 |
| Model | K | LL | AIC | ΔAIC |
|---|---|---|---|---|
| 1 + + | 4 | −224.8 | 458.4 | 0.0 |
| 1 + + + + | 6 | −223.2 | 460.0 | 1.6 |
| 1 + + + | 5 | −224.6 | 460.3 | 1.9 |
| 1 + + + | 5 | −224.6 | 460.3 | 2.0 |
| Item | Value | |
|---|---|---|
| df | 55 | |
| Intercept | p-value | 0.06 |
| t-value | 1.94 | |
| p-value | <0.05 | |
| t-value | 9.35 | |
| Group-Group B | p-value | 0.57 |
| t-value | −0.57 | |
| -Group B | p-value | 0.16 |
| t-value | −1.43 | |
| Model evaluation | R2 | 0.80 |
| MSE | 115.2 | |
| RMSE | 10.7 | |
| MAE | 8.8 | |
| Model | K | LL | AIC | ΔAIC |
|---|---|---|---|---|
| 1 + + | 4 | −258.9 | 526.5 | 0.0 |
| 1 + | 5 | −258.2 | 527.6 | 1.1 |
| 1 + | 5 | −258.9 | 528.8 | 2.4 |
| 1 + | 6 | −257.8 | 529.3 | 2.8 |
| 1 + | 5 | −259.5 | 530.1 | 3.6 |
| 1 + | 4 | −260.8 | 530.3 | 3.8 |
| Item | Value | |
|---|---|---|
| df | 56 | |
| Intercept | p-value | 0.71 |
| t-value | 0.4 | |
| p-value | <0.05 | |
| t-value | 3.4 | |
| -Group B | p-value | <0.05 |
| t-value | −6.7 | |
| Model evaluation | R2 | 0.48 |
| MSE | 379.0 | |
| RMSE | 19.5 | |
| MAE | 14.1 | |
| Failure Modes | Typical Failure | Group A | Group B | ||
|---|---|---|---|---|---|
| Quantity | Quantity | ||||
| Bending failure |  | 16 | 5.2 | 29 | 3.7 |
| Shear failure |  | 14 | 6.0 | 0 | / |
| In total | 30 | 5.6 | 29 | 3.7 | |
| Items | Units | Group A | Group B | |
|---|---|---|---|---|
| n | Number of specimens | / | 14 | 29 |
| Mean | kg/m3 | 626.9 | 628.2 | |
| MC | Mean | % | 13.3 | 13.2 |
| Mean | MPa | 14,793.8 | 14,011.7 | |
| Mean | MPa | 6.0 | >3.7 | |
| SD | MPa | 1.1 | / | |
| CV | % | 0.19 | / | |
| Items | Units | Group A | Group B | |
|---|---|---|---|---|
| n | Number of specimens | / | 30 | 30 |
| Mean | kg/m3 | 642.6 | 615.6 | |
| MC | Mean | % | 11.3 | 10.4 |
| Mean | MPa | 63.3 | 54.7 | |
| SD | MPa | 7.8 | 9.3 | |
| CV | % | 0.12 | 0.17 | |
| Item | Value | |
|---|---|---|
| df | 57 | |
| Intercept | p-value | 0.78 |
| t-value | −0.3 | |
| p-value | <0.05 | |
| t-value | 11 | |
| -C | p-value | <0.05 |
| t-value | −4.6 | |
| Model evaluation | R2 | 0.75 |
| MSE | 22.8 | |
| RMSE | 4.8 | |
| MAE | 3.8 | |
| Parameters | Failure Modes | |||
|---|---|---|---|---|
| Rolling Shear | End Failure | Shear | ||
| Group A | Number of specimens | 11 | 15 | 4 |
| Mean of | 658.3 | 627.6 | 591.1 | |
| Mean of | 61.6 | 64.6 | 63.0 | |
| Group B | Number of specimens | 29 | 0 | 1 |
| Mean of | 609.7 | / | 580.7 | |
| Mean of | 54.7 | / | 53.6 | |
| Strength | 1 | 2 | 3 | 4 | 5 | 6 | 7 | 8 | 9 |
|---|---|---|---|---|---|---|---|---|---|
| E. nitens This Study | Oak_LS10 (a) [25] | Beech_T33 (b) [7] | White Ash [15] | Grandis [26] | Meranti [4] | Australian Standard (c) [27] | |||
| E. nitens | F 11 | MGP12 | |||||||
| 67.4 | 66.8 | 78.9 | / | / | 59.4 | 35.2 | 31 | 28 | |
| 48.1 | 43.9 | 59.1 | 46.4 | / | / | 25.9 | 18 | 12 | |
| 54.7 | / | / | / | 32.8 | / | 39.1 | 22 | 30 | |
Disclaimer/Publisher’s Note: The statements, opinions and data contained in all publications are solely those of the individual author(s) and contributor(s) and not of MDPI and/or the editor(s). MDPI and/or the editor(s) disclaim responsibility for any injury to people or property resulting from any ideas, methods, instructions or products referred to in the content. |
© 2023 by the authors. Licensee MDPI, Basel, Switzerland. This article is an open access article distributed under the terms and conditions of the Creative Commons Attribution (CC BY) license (https://creativecommons.org/licenses/by/4.0/).
Share and Cite
Hou, J.; Taoum, A.; Kotlarewski, N.; Nolan, G. Study on the Effect of Finger-Joints on the Strengths of Laminations from Fiber-Managed Eucalyptus nitens. Forests 2023, 14, 1192. https://doi.org/10.3390/f14061192
Hou J, Taoum A, Kotlarewski N, Nolan G. Study on the Effect of Finger-Joints on the Strengths of Laminations from Fiber-Managed Eucalyptus nitens. Forests. 2023; 14(6):1192. https://doi.org/10.3390/f14061192
Chicago/Turabian StyleHou, Jian, Assaad Taoum, Nathan Kotlarewski, and Gregory Nolan. 2023. "Study on the Effect of Finger-Joints on the Strengths of Laminations from Fiber-Managed Eucalyptus nitens" Forests 14, no. 6: 1192. https://doi.org/10.3390/f14061192