Abstract
The Three Gorges Reservoir Area (TGRA) in China has extensive non-timber product plantations (NTPP), in which integrated management based on intensive fertilization and weeding were required to maintain and improve yields for a long time. Uncertainties still existed regarding the compound effects of environment and the long-term integrated management on soil organic carbon content (SOC) in NTPP. Data from 341 sampling plots covering six primary NTPP types were collected to investigate the influence of environment and management on topsoil (0–10 cm) SOC of NTPP using a coupled algorithm based on machine learning and structural equation modeling. Results showed significant differences and spatial variabilities in SOC content among different types of NTPP. Integrated management accounted for approximately 53% of the accumulation of topsoil organic carbon, surpassing the total contribution of topography, climate, vegetation, and soil properties in NTPP of TGRA. SOC content increased with available nitrogen for NTPP at all altitudes in TGRA. The study highlighted the potential of enhancing SOC storage through adaptive integrated management in NTPP of vast areas. Improving soil organic carbon stock in large area of non-timber production plantations would benefit the realization of carbon neutralization in next decades.
1. Introduction
Owing to deforestation and cultivation on sloping lands, the Three Gorges Reservoir Area (TGRA) had experienced severe soil erosion and continuous land degradation for almost a century [1,2]. Afforestation and reforestation have been performed in large areas of TGRA under the process of ecological restoration projects in China since 2000 [3,4]. The sloping farmlands had been progressively replaced by non-timber product plantations (NTPP), such as tea gardens, citrus orchards, walnut orchards, pepper gardens, plum plantations, chestnut plantations, and others [5], accounting for 32.2% of the agricultural lands in TGRA [6]. NTPP was mainly planted at elevations ranging from 200 to 1500 m, which overlapped with the areas of the most intense anthropogenic activities in TGRA. Integrated management had been applied to NTPP for improving crop yields for over two decades, including fertilization, weeding, irrigation, and pesticide application. These practices extraordinarily promoted regional economic and social development in TGRA [7,8]. Nitrogen was the most frequently used fertilizer, accounting for 64.4% of annual fertilization in this area [6]. Integrated management measures, especially fertilization, also intensified soil disturbance, which altered the physical properties, chemical components, even microbial activity in the soil. The fertilizer management might have had a significant impact soil organic carbon storage in the NTPP because the altered soil properties and microbial activity in the fertilized soil could influence the accumulation of soil organic carbon (SOC) [9,10,11,12].
The accumulation of soil organic carbon was strongly influenced by environmental components of topography, soil property, vegetation, and climate [13,14,15], such as soil acidity, temperature, and precipitation [16,17,18,19,20]. For plantations, the impact of integrated management on soil organic carbon was worthy to be considered for two reasons: first, integrated management could significantly increase SOC content by increasing the source of soil organic matter; for instance, fertilization and weeding had substantially increased SOC content in Chinese hickory plantations [21,22,23]; on the other hand, inappropriate management could lead to soil degradation and excessive erosion, which could hinder the aggregation of soil organic carbon [24,25]. In fact, comprehensive effects of environment and management on SOC in plantations happened simultaneously worldwide. Unfortunately, it had been rarely investigated that the compound effects of environment and management on SOC content [26].
As a sensitive and vulnerable ecoregion, TGRA has received widespread attention for soil erosion and non-point source pollution [27,28]. NTPP had become a fundamental component of the ecological reserve in TGRA because of their ecological and economic importance. Achieving a harmonious balance between productivity and carbon storage of NTPP would be a priority for future anthropogenic management [29]. Consequently, it was essential and meaningful to assess the comprehensive impacts of both environment and integrated management on the SOC content of NTPP in TGRA via a quantitative analysis.
The hypothesis was that integrated management could enhance soil carbon storage of NTPP with the compound effects of environment in TGRA. To test this hypothesis, multiple factors and their effects were analyzed based on 341 sampling sites from primary NTPP in this area. The main objectives of this study were to (i) investigate spatial variability of SOC content among NTPP; (ii) identify possible driving factors affecting the accumulation of SOC via advanced modeling algorithms in NTPP; and (iii) reveal the impact pathways of both environment and management on SOC stock in the topsoil of NTPP in TGRA. Understanding the compound effects of environment and management on SOC could enable the probability of improving SOC stock and optimizing the integrated management strategy in NTPP for both TGRA and other areas under the background of carbon neutralization.
2. Materials and Methods
2.1. Study Area
The Three Gorges Reservoir Area (28°56′–31°44′ N, 106°16′–111°28′ E) lies at the end of the upper reaches of the Yangtze River, where Three Gorges Dam, the world’s largest dam, was constructed. It spans 20 counties of Chongqing and Hubei, with an area of 10,000 km2 (Figure 1). This area is characterized by karst mountains and hills. The distribution of water and heat conditions is spatially and temporally uneven due to topographical heterogeneity. The climate is subjected to subtropical monsoons, with hot and rainy summers and mild and humid winters. The annual mean temperature ranges from 17 to 19 °C, while the annual precipitation is 1000–1025 mm [4]. The primary zonal soils are Vertisols, Cambisols, Calcisols, and Gleysols [30]. There are multiple vegetation types along elevation altitudes, including evergreen broadleaved forest, mixed broadleaved forest, deciduous broadleaved forest, evergreen coniferous forest, shrub, and grassland along altitude gradients. Since this hilly area has limited capability for growing crops, the government has actively enforced the afforestation and reforestation project as NTPP was planted widely in the area to address ecological challenges and promote economic development [1,31]. The dominant types of NTPP in the region include citrus orchards, tea gardens, walnut orchards, pepper gardens, plum plantations, and chestnut plantations [5]. Citrus was widely planted, accounting for 18.9% of the local planted area. Other plantations were sporadically distributed in the areas close to croplands and residence places.
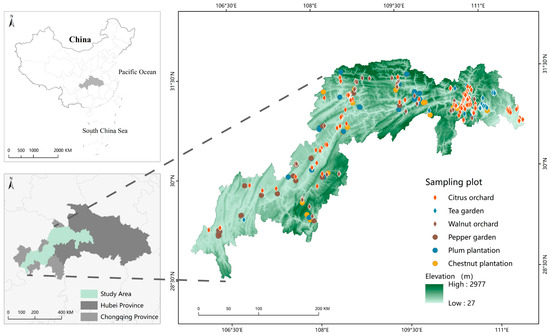
Figure 1.
The study area and sampling plots.
2.2. Integrated Management
The NTPP had been an important economic resource. Integrated management of NTPP was used to ensure economic benefits in the rural areas of TGRA. The primary means of managing local NTPP included fertilization, irrigation, and weeding, with varying combinations in different plantations (Table 1). Ditching was mainly used in NTPP for fertilization to increase the persistence of fertilizer, which was applicable to crops, while foliar fertilization was mainly used for tea gardens.

Table 1.
Integrated management of non-timber product plantations (NTPP) in Three Gorges Reservoir Area (TGRA).
2.3. Soil Sampling and Laboratory Analysis
Soil sampling of non-timber plantation plots was accomplished in 2021 for a comprehensive investigation across the NTPP. A total of 341 plots (20 m × 20 m) were inventoried based on terrain characteristics, including citrus orchards, tea gardens, walnut orchards, pepper gardens, plum plantations, and chestnut plantations (Figure 1). In these plots, stratified soil samples of 0–5 cm, 5–10 cm, or 0–10 cm were collected from 4 sampling points along an S-shaped line using a soil auger (inner diameter = 5 cm) via the quadrat method. The soil samples were taken back to the laboratory, air-dried, and sieved through a 2 mm sieve to determine the soil physical and chemical properties.
Soil organic carbon content (SOC, g kg−1) was determined by the potassium dichromate oxidation-diluted heat method [32]. In this study, 0.5 g of soil were soaked in a 10-milliliter solution of K2Cr2O7 (1 mol L−1), which was subsequently diluted to 250 milliliters using water. To initiate the titration process, 12 drops of an appropriate indicator were introduced, and the sample was titrated with an FeSO4 (0.5 mol L−1) solution. Total nitrogen (TN, g kg−1) content was determined using an elemental analyzer (Euro EA, Hekatech GMBH, Wegberg, Germany). Total phosphorus (TP, g kg−1) and Total potassium (TK, g kg−1) contents were determined by employing plasma emission spectroscopy (IRIS Intrepid II XSP, Thermo Fisher Scientific, Waltham, MA, USA) after the digestion of the samples with an HNO3-HClO4-HF solution. For the determination of available nitrogen content (AN, mg kg−1), the soil samples were converted to NH4+ under NaOH conditions (1.8 mol L−1). The NH4+ ions were collected in an H3BO3 solution (2%), and the resulting mixture was subsequently titrated with a standard HCl solution (0.01 mol L−1). The soil available phosphorus content (AP, mg kg−1) was analyzed using a continuous flow analyzer (Analytical AA3 Auto Analyzer, SEAL, Norderstedt, Germany) after extraction with an HCl-H2SO4 solution. The available potassium content (AK, mg kg−1) was analyzed using plasma emission spectroscopy (IRIS Intrepid II XSP, Thermo Fisher Scientific, USA) after the digestion of the samples with an NH4OAc (1 mol L−1) solution. Soil pH was determined with a pH meter using a soil to water ratio of 1:2.5 [33]. The equal area quadratic spline was introduced to provide standardized 0–10 cm soil property values for further modeling [34].
2.4. Covariance Selection
Based on soil forming theory, soil organic carbon was mainly affected by parent material, soil properties, terrain, biology, climate, and even human interferences [35,36,37]. Data of mentioned elements were collected to analyze the impact of both environmental and human factors on SOC, which was processed for validating the hypothesis. SOC in the topsoil was predicted based on multiple possible influencing factors in NTPP of TGRA (Table 2). Since fertilization was one of the primary management strategies in this area, soil nutrition characteristics were used as management indicators, including the content of nitrogen, phosphorus, and potassium contents in the topsoil. All data were extracted and processed for subsequent analysis.
Table 2.
List of soil organic carbon content (SOC) modeling covariates for NTPP in TGRA.
Table 2.
List of soil organic carbon content (SOC) modeling covariates for NTPP in TGRA.
| Variable Types | Specific Variable (Unit) | Data Source and Time Span | Reference |
|---|---|---|---|
| Soil properties | pH | Sampling plots 2021 | [38] |
| Soil texture: sand, clay, silt proportion in soil (%) | China Soil Texture Map 1995 | [39] | |
| Integrated management | TN, TK, TP (g kg−1); AN, AK, AP (mg kg−1) | Sampling plots 2021 | [19] |
| Topography | Elevation (m); Slope (°); Aspect (°) | NASADEM_HGT 30 m 2021 | [40] |
| Climate | MAT (°C) GSMT (°C) | ERA5 monthly dataset 2011–2021 | [41] |
| MAP (mm) GSMP (mm) | Version 4 of the CRU TS 2011–2021 | [42] | |
| Vegetation | NPP (kgC m−2 year−1) | MOD17A3HGF v061 2021 | [43] |
Soil texture was provided by the Data Center for Resources and Environmental Sciences, Chinese Academy of Sciences (RESDC). Topographic covariates were computed using NASADEM_HGT of 30 m resolution (NASA Jet Propulsion Laboratory, 2020). Elevation, slope, and aspect were extracted for all sampling plots. Annual mean Temperature (MAT) was extracted from the ERA5 monthly averaged dataset. Annual mean precipitation (MAP) was extracted from Version 4 of the CRU TS monthly high-resolution gridded multivariate climate dataset. The mean temperature of the growing season (GSMT; from April to September) and growing season precipitation (GSMP) were also calculated from 2011 to 2021. Mean net primary productivity (NPP) values of vegetation were calculated based on annual NPP values from 2011 to 2021 in the study area, which were derived from Modis MOD17A3HGF v061 at a resolution of 500 m.
2.5. Modeling Approaches
Random forests (RF) and the structural equation modeling (SEM) were combined to address the possible relationships between SOC and multiple influencing factors in NTPP. RF was used to identify the specific important factors among candidates. RF is a versatile machine-learning methodology that works efficiently for regression and classification [44]. The RF algorithm has been widely applied in forest ecology—for instance, forest biomass estimation, forest resource classification, and species distribution prediction [45,46,47]. Then, the structural equation modeling (SEM) was used to measure the direct and indirect impact pathways of the significant factors on SOC. SEM is a generalized linear model to represent the relationships between observed and dependent variables [48]. Although SEM was initially developed for social sciences [49,50], its powerful computing capacity in the contributing mechanism of the variables enabled its wide usage in ecology studies at both regional and larger scales [51,52,53].
The data of all potential candidates were inspected before modeling. The collinearity among all variables was diagnosed via the variance inflation factor (VIF) tests as Equation (1).
where is the coefficient of determination obtained by fitting a regression model for the i-th independent variable on the other p − 2 independent variables. Variables with a VIF value greater than 5 were discarded, while variables with high independence were retained.
The RF modeling was processed via “Random Forest Regressor” of the “scikit-learn” library in Python to identify the significant indicators of SOC in TNPP of TGRA [54]. Three types of parameters were inevitably set for RF, including “n_estimators” (number of estimators), “max_depth” (maximum modeling depth) and “max_features” (the maximum features), respectively.
The controlling factors of SOC were listed in the structural equation model (SEM) to test direct and indirect pathways. All possible influencing pathways were considered until obtaining the final models [55]. The SEM analysis was performed using Amos version 21.0 [56].
2.6. Model Validation and Evaluation
The coefficient of determination (R2) measures the proportion of variance in the response variable that can be explained by the predictor variables in a regression model [57]. The higher values close to 1 indicate better model fitting. The acceptable R2 was larger than 0.5 for most SOC related models [39]. The values R2 of the SOC models were calculated as Equation (2):
where and denote the average of the observations and predictions of using the fitted model.
The chi-square value (χ2) was a key measure of accuracy in SEM, with smaller values indicating better fitting [56]. Since χ2 was sensitive to the sample size, the comparative fit index (CFI) was also used to evaluate the modeling accuracy. Higher CFI values larger than 0.9 were expected for accurate modeling.
3. Results
3.1. Spatial Distribution of SOC in Multiple NTPP
Three altitude gradients were observed from the NTPP sampling plots, including low altitude (<500 m asl.), medium altitude (500–1000 m asl.), and high altitude (>1000 m asl.), since these plantations were planted within a certain altitude range. In fact, these plantations were thoughtfully managed from the beginning of afforestation and reforestation project in TGRA. The spatial distribution of SOC in NTPP was depicted in Figure 2a, where the topsoil SOC increased with the rising altitude for citrus orchards, tea plantations, plum plantations, and chestnut plantations. Among all types of plantations, tea plantations had the highest SOC (18.54 ± 7.25 g kg−1), followed by chestnut plantations (15.58 ± 9.53 g kg−1), while pepper plantations had the lowest SOC (11.28 ± 4.82 g kg−1). SOC in the citrus orchard was at a moderate level and remained relatively constant across these altitude gradients. Walnut orchards were only found at mid to high altitudes, while pepper plantations were only grown at low to mid altitudes.
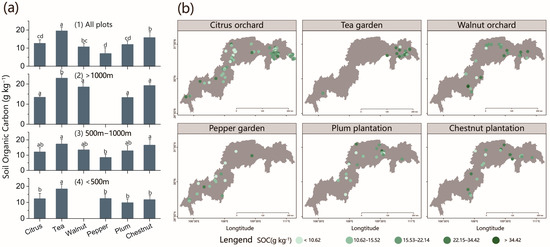
Figure 2.
Spatial variation of SOC content in the topsoil (0–10 cm) of NTPP in TGRA. (a) Mean SOC contents of different NTPP types along altitude gradients. Different letters indicate the significance of differences at p < 0.05. (b) Spatial variation of SOC contents among different NTPP types.
Topsoil (0–10 cm) organic carbon content showed distinct spatial patterns for each plantation type (Figure 2b), indicating significant spatial heterogeneity. Specifically, citrus orchards and chestnut plantations displayed higher SOC content in the eastern and western regions, whereas lower content was observed in the central area. Tea gardens were concentrated in the east part of TGRA, with high SOC content in this region. Walnut orchards displayed higher SOC in the eastern and southern regions. Pepper gardens and plum plantations, on the other hand, exhibited relatively low SOC content across this area.
3.2. The Significance of Environment and Management to SOC
With the number of estimators, the maximum modeling depth, and the maximum features assigned as 800, 8, and 34, the best random forest model explained 92.3% (p < 0.001) of the variation of topsoil SOC in NTPP (Figure 3a). Five significant variables with contribution >5% were derived from all types of influencing factors, including AN (management), elevation (topography), pH (soil property), GSMT (climate), and NPP (vegetation) (Figure 4a). Overall, AN, one of the management factors, was the most important factor controlling non-timber plantation SOC with a feature importance of 53.5%. Its significance was followed by elevation, pH, GSMT, and NPP, accounting for 22.1%, 8.6%, 8.1%, and 7.7% of the variation, respectively.
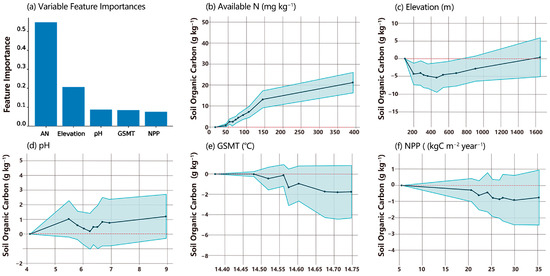
Figure 3.
Feature importance of significant variables in SOC modeling and the corresponding partial dependence plots. Panel (a) shows the feature importance of significant variables in SOC modeling based on Random Forest. Panels (b–f) depict the partial dependence of SOC on available nitrogen (AN), elevation, soil pH, growing season mean temperature (GSMT), and net primary productivity (NPP), respectively.
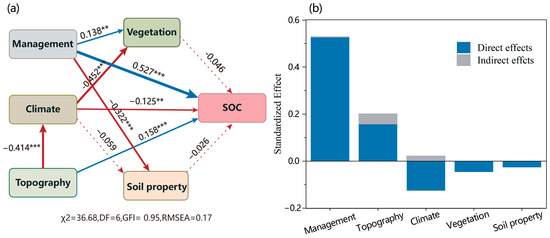
Figure 4.
Result of structural equation model for SOC. (a) Structural equation modeling (SEM) indicates how management (AN), topography (elevation), climate (GSMT), vegetation (NPP), and soil property (pH) affect the SOC. Solid blue and red arrows indicate significant positive and negative correlations, respectively (p < 0.05), and dashed blue and red arrows indicate insignificant positive and negative trends, respectively. The numbers next to the arrows are standardized path coefficients; χ2, chi-square; DF, degrees of freedom; GFI, goodness-of-fit index; RMSEA, root mean square error of approximation, n = 341. ** Significant correlation at p < 0.01; *** Significant correlation at p < 0.001. (b) Standardized effects of predictor variables on SOC (direct and indirect standardized effects).
Figure 3 illustrated significant non-linear relationships between the SOC of NTPP in this study. A positive correlation between AN and SOC of NTPP was observed since SOC content increased dramatically as the increasing AN content till 150 mg kg−1 in the topsoil while the trend slowed down slightly thereafter (Figure 3b). SOC of NTPP varied along the elevation, with apparent decreasing trends at low elevations < 500 m and then rising tendencies for medium and high elevations (Figure 3c). The complex effects of pH on SOC of NTPP fluctuated along the topsoil pH values (Figure 3d). Generally, the pH values in the range of 5–5.5 and greater than 6.5 were favorable for SOC accumulation in the topsoil of NTPP in TGRA. SOC decreased significantly when GSMT was higher than 14 °C (Figure 3e). Obvious negative dependence of SOC on NPP was also found for NTPP in this study (Figure 3f).
3.3. The Impact Pathways of Environment and Management
In SEM, the path coefficient (β) measures the direct or indirect association between two individual variables. A larger β value indicates a stronger relationship between the variables. SEM results were presented with quantified contributions of significant variables (Figure 4a). The best developed model presented the smallest χ2 value at 36.68 and the largest CFI value at 0.95. The contributions of integrated management (as AN), topography (as elevation), climate (as GSMT), vegetation (as NPP), and soil property (as pH) are depicted in Figure 4. Consistent with RF modeling results, SEM showed a strong positive relationship between the management and SOC content in the topsoil. Three types of variables (management, topography, and climate) exhibited both direct and indirect effects on the SOC content (Figure 4b). The management had the strongest total effects on the SOC content (β = 0.527), followed by the topography index (β = 0.158) and climate (β = −0.125). Management had negative effects on SOC through vegetation (β = −0.046) and soil properties (β = −0.026), but the overall effect remained positive. The topography had positive effects on SOC, which were counterbalanced by climate (β = −0.414), leading to a relatively strong negative indirect effect on SOC (β = −0.125). The negative effects of high temperature on SOC were consistently observed in both direct and indirect ways.
4. Discussion
4.1. Spatial Distributions of SOC in NTPP
TGRA was characterized by a notable vertical distribution of vegetation [58]. The dominant plantation was sheltering forest, with certain amount of shrub and barren grassland above 1000 m asl. In contrast, the primary plantation was NTPP around or below 1000 m asl, with sporadic crops such as peanuts, maize, and sweet potatoes. The topography played a vital role in determining temperature and moisture regimes. Topography affected the distribution of SOC sequestration processes through influencing the microclimate of specific sites, which was also observed in NTPP at the hilly area [59,60]. Significant spatial variation in SOC content was observed along the elevation gradient in this study, confirming the significant influences of topographic factors on SOC. On the other hand, this spatial pattern might result from the design of afforestation, as certain elevation ranges were initially selected for planting certain plantations. This apparent spatial patterns of SOC along altitude gradients could provide a clear guide for further management practices, which aimed at improving the soil carbon stock of these plantations.
Consistent with the positive trends of SOC contents from low elevations to high elevations, high temperatures could limit the accumulation of soil organic carbon of these plantations as found in northern China and many other areas [37,52]. The vegetation cover of non-timber product plantations showed weaker correlations with the soil organic carbon contents in this area, which might result from growing and yielding that could frequently change the vegetation cover during different periods. In summary, the significant spatial pattern of SOC along the altitudinal gradient was influenced by both environmental factors and human management.
4.2. Effects of Integrated Management on SOC in NTPP
SOC accumulation was characterized by both carbon inputs and decomposition rates [61,62], which were influenced by climate, such as temperature, precipitation, soil pH, and soil moisture [16,63]. In this study, SOC content in NTPP were found to be influenced by integrated management, as well as topography and climate, despite these environmental factors displaying weaker or negative impacts. These results demonstrated the importance of fertilization as a major driver of SOC stock in topsoil [21,24,64,65,66], which was consistent with the hypothesis that integrated management could be beneficial for soil organic carbon stock.
Afforestation and reforestation contributed 247 Tg CO2 y−1 over the last two decades in China, but the potential area for additional afforestation could be limited after 2020 [67]. Carbon stock increased rapidly in young forests but reached a relatively stable status in older forests [68,69]. Meanwhile, agroforestry has emerged as a promising approach to increase SOC storage and ecological conservation [70]. In fact, land of TGRA survived from extra fertilization for over two decades, resulting in high N residues [27]. Across the N fertilizer gradients, SOC in unprotected particulate organic matter (POM) fractions increased with residue inputs [71]. The integrated management of fertilizer application would be a direct and effective measure of carbon stock for the NTPP in the TGRA.
4.3. The Contributions of NTPP to Soil Carbon Stock
This study revealed significant variations in the SOC among different tree species in TGRA, which could be attributed to the management practices of individual species. Notably, tea plantations showed the highest SOC stock compared to other types, and this could be attributed to the following reasons: the low-intensity pattern of cropping adopted in tea plantations effectively mitigated nutrient loss [72]; and the avoidance of deep tillage practices and use of foliar fertilizers were conducive to soil carbon storage in tea plantations [73]. Chestnut plantations would also contribute outstandingly to soil carbon stock since the unfertilized chestnut plantations had rather high soil organic carbon contents in this area. Applicable fertilization could be used in this plantation then. In addition, citrus orchards, the largest plantation in TGRA, had considerable potential for carbon stock at all altitudes. Rational intercropping could significantly increase the topsoil organic carbon content in citrus orchards located in TGRA [74].
The long-term effects of management practice would enhance SOC content in NTPP [23]. Therefore, comprehensive strategies would be necessary to increase SOC storage and the productivity of NTPP. Such strategies included selecting suitable tree species, improving the site conditions, enhancing land conservation, and implementing adaptative management practices [75,76]. The findings in TGRA could provide more successful examples of balancing productivity and soil carbon storage with integrated management.
4.4. Implications and Applications
The results have important implications for forest management and carbon sink strategies. Fertilization appeared to be a key management practice for enhancing SOC content in NTPP [66]. However, the long-term effects of fertilization on soil fertility and ecosystem functioning required careful evaluation, as excessive fertilizer application could have negative impacts on soil quality and biodiversity [46,77,78].
Given the limit of the additional area for future afforestation and reforestation after 2020, increasing carbon storage on afforested land is an important issue nationwide [67,79]. With upgraded management practices, SOC stock in NTPP could be improved. This study highlighted the potential of carbon storage in China’s vast NTPP plantations via applicable management. The contribution of non-timber product plantations to terrestrial carbon storage would be highlighted as well as their productivity and economic values. Further studies may be necessary since long-term observations would be more convincing.
5. Conclusions
The study utilized a coupled approach that combined a machine learning algorithm and structural equation modeling to investigate the spatial distribution and environmental and human impact pathways of the topsoil organic carbon of NTPP in TGRA. The results indicated that the SOC of NTPP had a clear spatial pattern in TGRA, with an increase in SOC content as the altitude rose. The study observed that integrated management practices, particularly fertilizer application, had a significant and direct positive impact on SOC in the non-timber plantations among influencing factors. The research confirmed the hypothesis that integrated management could effectively enhance soil carbon storage in NTPP plantations in TGRA, highlighting the sustainability of carbon storage potentials in non-timber product plantations. These results provided important insights for increasing the soil carbon sink of NTPP across large areas, especially with adequate and appropriate integrated management. The findings enable the probability of balanced productivity and soil carbon storage for non-timber product plantations through appropriate management, which could provide more basic knowledge for adaptive plantation management strategies in the future. Improving soil organic carbon storage of large plantations in China would contribute outstandingly to forest carbon storage for the target of carbon neutralization.
Author Contributions
Conceptualization, C.S. and Z.H.; methodology, C.S.; software, J.C.; validation, C.S.; formal analysis, J.C.; investigation, Z.H., C.L., W.X. and L.Z.; resources, Z.H. and W.X.; data curation, J.C.; writing—original draft preparation, J.C.; writing—review and editing, Z.H., C.S. and Z.F.; visualization, J.C.; supervision, W.X.; project administration, Z.H. and C.S.; funding acquisition, Z.H. All authors have read and agreed to the published version of the manuscript.
Funding
The study was funded by the Special Investigation Foundation of Basic Resources, Ministry of Science and Technology of the People’s Republic of China, grant number 2021FY100800.
Data Availability Statement
All data will be released after 2025 according to the requirement of Ministry of Science and Technology of the People’s Republic of China.
Acknowledgments
The authors would like to thank Jiajia Zhang for the assistance in laboratory analysis and Yansong Mao for the image modification. Sincere appreciation is expressed to the editors and anonymous reviewers for their comments and intellectual contributions.
Conflicts of Interest
The authors declare no conflict of interest.
References
- Fu, B.; Wu, B.; Lue, Y.; Xu, Z.; Cao, J.; Niu, D.; Yang, G.; Zhou, Y. Three Gorges Project: Efforts and Challenges for the Environment. Prog. Phys. Geogr. 2010, 34, 741–754. [Google Scholar] [CrossRef]
- Bao, Y.; He, X.; Wen, A.; Gao, P.; Tang, Q.; Yan, D.; Long, Y. Dynamic Changes of Soil Erosion in a Typical Disturbance Zone of China’s Three Gorges Reservoir. Catena 2018, 169, 128–139. [Google Scholar] [CrossRef]
- Fang, J.; Guo, Z.; Hu, H.; Kato, T.; Muraoka, H.; Son, Y. Forest Biomass Carbon Sinks in East Asia, with Special Reference to the Relative Contributions of Forest Expansion and Forest Growth. Glob. Chang. Biol. 2014, 20, 2019–2030. [Google Scholar] [CrossRef] [PubMed]
- Teng, M.; Huang, C.; Wang, P.; Zeng, L.; Zhou, Z.; Xiao, W.; Huang, Z.; Liu, C. Impacts of Forest Restoration on Soil Erosion in the Three Gorges Reservoir Area, China. Sci. Total Environ. 2019, 697, 134164. [Google Scholar] [CrossRef] [PubMed]
- Zhang, J.J.; Lei, L.; Xiao, W.F.; Liu, C.F.; Zhu, J.H.; Huang, Z.L.; Zeng, L.X. Soil organic carbon characteristics of economic forest in Three Gorges Reservoir Area. Terr. Ecosyst. Conserv. 2022, 2, 22–30. (In Chinese) [Google Scholar]
- CNEMC. Bulletin of Ecological and Environmental Monitoring of the Three Gorges Project in the Yangtze River (2016). Available online: http://webinterface.cnemc.cn/zjsxgcstyhjjcbgzjsxgcstyhjjcbg2092941.jhtml. (accessed on 20 February 2023).
- Zhang, T.; Yang, Y.; Ni, J.; Xie, D. Construction of an integrated technology system for control agricultural non-point source pollution in the Three Gorges Reservoir Areas. Agric. Ecosyst. Environ. 2020, 295, 106919. [Google Scholar] [CrossRef]
- Zhou, H.; Luo, X.; Wang, S.; Wang, Z.; Chen, Y.; Li, X.; Tan, Z. Findings on agricultural cleaner production in the Three Gorges Reservoir Area. Heliyon 2023, 9, e14477. [Google Scholar] [CrossRef]
- Liu, E.; Yan, C.; Mei, X.; He, W.; Bing, S.H.; Ding, L.; Liu, Q.; Liu, S.; Fan, T. Long-Term Effect of Chemical Fertilizer, Straw, and Manure on Soil Chemical and Biological Properties in Northwest China. Geoderma 2010, 158, 173–180. [Google Scholar] [CrossRef]
- Li, J.; Cooper, J.M.; Li, Y.; Yang, X.; Zhao, B. Soil Microbial Community Structure and Function Are Significantly Affected by Long-Term Organic and Mineral Fertilization Regimes in the North China Plain. Appl. Soil Ecol. 2015, 96, 75–87. [Google Scholar] [CrossRef]
- Qin, J.; Liu, H.; Zhao, J.; Wang, H.; Zhang, H.; Yang, D.; Zhang, N. The Roles of Bacteria in Soil Organic Carbon Accumulation under Nitrogen Deposition in Stipa Baicalensis Steppe. Microorganisms 2020, 8, 326. [Google Scholar] [CrossRef]
- Wang, C.; Xue, L.; Dong, Y.; Jiao, R. Soil Organic Carbon Fractions, C-Cycling Hydrolytic Enzymes, and Microbial Carbon Metabolism in Chinese Fir Plantations. Sci. Total Environ. 2021, 758, 143695. [Google Scholar] [CrossRef]
- Crowther, T.W.; Todd-Brown, K.E.; Rowe, C.W.; Wieder, W.R.; Carey, J.C.; Machmuller, M.B.; Snoek, B.; Fang, S.; Zhou, G.; Allison, S.D. Quantifying Global Soil Carbon Losses in Response to Warming. Nature 2016, 540, 104–108. [Google Scholar] [CrossRef] [PubMed]
- Zhang, Y.; Jiang, Y.; Jia, Z.; Qiang, R.; Gao, Q. Identifying the scale-controlling factors of soil organic carbon in the cropland of Jilin province, China. Ecol. Indic. 2022, 139, 108921. [Google Scholar] [CrossRef]
- Wiesmeier, M.; Urbanski, L.; Hobley, E.; Lang, B.; von Lützow, M.; Marin-Spiotta, E.; van Wesemael, B.; Rabot, E.; Ließ, M.; Garcia-Franco, N. Soil Organic Carbon Storage as a Key Function of Soils-A Review of Drivers and Indicators at Various Scales. Geoderma 2019, 333, 149–162. [Google Scholar] [CrossRef]
- Sutfin, N.A.; Wohl, E.E.; Dwire, K.A. Banking Carbon: A Review of Organic Carbon Storage and Physical Factors Influencing Retention in Floodplains and Riparian Ecosystems. Earth Surf. Process. Landf. 2016, 41, 38–60. [Google Scholar] [CrossRef]
- Han, X.; Gao, G.; Li, Z.; Chang, R.; Jiao, L.; Fu, B. Effects of Plantation Age and Precipitation Gradient on Soil Carbon and Nitrogen Changes Following Afforestation in the Chinese Loess Plateau. Land Degrad. Dev. 2019, 30, 2298–2310. [Google Scholar] [CrossRef]
- Tan, Q.; Han, W.; Li, X.; Wang, G. Clarifying the Response of Soil Organic Carbon Storage to Increasing Temperature through Minimizing the Precipitation Effect. Geoderma 2020, 374, 114398. [Google Scholar] [CrossRef]
- Qi, D.; Wieneke, X.; Tao, J.; Zhou, X.; Desilva, U. Soil PH Is the Primary Factor Correlating with Soil Microbiome in Karst Rocky Desertification Regions in the Wushan County, Chongqing, China. Front. Microbiol. 2018, 9, 1027. [Google Scholar] [CrossRef]
- Lu, X.; Gilliam, F.S.; Guo, J.; Hou, E.; Kuang, Y. Decrease in Soil PH Has Greater Effects than Increase in Above-ground Carbon Inputs on Soil Organic Carbon in Terrestrial Ecosystems of China under Nitrogen Enrichment. J. Appl. Ecol. 2022, 59, 768–778. [Google Scholar] [CrossRef]
- Maillard, É.; Angers, D.A. Animal Manure Application and Soil Organic Carbon Stocks: A Meta-analysis. Glob. Chang. Biol. 2014, 20, 666–679. [Google Scholar] [CrossRef]
- Hartmann, M.; Frey, B.; Mayer, J.; Mäder, P.; Widmer, F. Distinct Soil Microbial Diversity under Long-Term Organic and Conventional Farming. ISME J. 2015, 9, 1177–1194. [Google Scholar] [CrossRef] [PubMed]
- Xue, L.; Ren, H.; Brodribb, T.J.; Wang, J.; Yao, X.; Li, S. Long Term Effects of Management Practice Intensification on Soil Microbial Community Structure and Co-Occurrence Network in a Non-Timber Plantation. For. Ecol. Manag. 2020, 459, 117805. [Google Scholar] [CrossRef]
- Bender, S.F.; Wagg, C.; van der Heijden, M.G. An Underground Revolution: Biodiversity and Soil Ecological Engineering for Agricultural Sustainability. Trends Ecol. Evol. 2016, 31, 440–452. [Google Scholar] [CrossRef]
- Guillaume, T.; Holtkamp, A.M.; Damris, M.; Brümmer, B.; Kuzyakov, Y. Soil Degradation in Oil Palm and Rubber Plantations under Land Resource Scarcity. Agric. Ecosyst. Environ. 2016, 232, 110–118. [Google Scholar] [CrossRef]
- Chen, S.; Wang, W.; Xu, W.; Wang, Y.; Wan, H.; Chen, D.; Tang, Z.; Tang, X.; Zhou, G.; Xie, Z.; et al. Plant Diversity Enhances Productivity and Soil Carbon Storage. Proc. Natl. Acad. Sci. USA 2018, 115, 4027–4032. [Google Scholar] [CrossRef] [PubMed]
- Shen, Z.; Qiu, J.; Hong, Q.; Chen, L. Simulation of Spatial and Temporal Distributions of Non-Point Source Pollution Load in the Three Gorges Reservoir Region. Sci. Total Environ. 2014, 493, 138–146. [Google Scholar] [CrossRef]
- Chu, L.; Sun, T.; Wang, T.; Li, Z.; Cai, C. Temporal and spatial heterogeneity of soil erosion and a quantitative analysis of its determinants in the Three Gorges Reservoir Area, China. Int. J. Environ. Res. Public. Health 2020, 17, 8486. [Google Scholar] [CrossRef]
- Farooq, T.H.; Shakoor, A.; Wu, X.; Li, Y.; Rashid, M.H.U.; Zhang, X.; Gilani, M.M.; Kumar, U.; Chen, X.; Yan, W. Perspectives of Plantation Forests in the Sustainable Forest Development of China. iForest-Biogeosci. For. 2021, 14, 166–174. [Google Scholar] [CrossRef]
- Wu, C.; Zhou, Z.; Xiao, W.; Wang, P.; Teng, M.; Huang, Z. Estimation of Soil Erosion in the Three Gorges Reservoir Area of China Using RUSLE, Remote Sensing and GIS. J. Food Agric. Environ. 2011, 9, 728–734. [Google Scholar]
- Xu, X.; Tan, Y.; Yang, G. Environmental Impact Assessments of the Three Gorges Project in China: Issues and Interventions. Earth-Sci. Rev. 2013, 124, 115–125. [Google Scholar] [CrossRef]
- Nelson, D.W.; Sommers, L. Total Carbon, Organic Carbon, and Organic Matter. Methods Soil Anal. Part 2 Chem. Microbiol. Prop. 1983, 9, 539–579. [Google Scholar]
- Bao, S.D. Soil and Agriculture Chemistry Analysis, 3rd ed.; Agriculture Press: Beijing, China, 2000. (In Chinese) [Google Scholar]
- Malone, B.P.; McBratney, A.; Minasny, B.; Laslett, G. Mapping Continuous Depth Functions of Soil Carbon Storage and Available Water Capacity. Geoderma 2009, 154, 138–152. [Google Scholar] [CrossRef]
- Jenny, H. Factors of Soil Formation: A System of Quantitative Pedology; Courier Corporation: Chelmsford, MA, USA, 1994. [Google Scholar]
- Sun, T.; Wang, Y.; Hui, D.; Jing, X.; Feng, W. Soil Properties Rather than Climate and Ecosystem Type Control the Vertical Variations of Soil Organic Carbon, Microbial Carbon, and Microbial Quotient. Soil Biol. Biochem. 2020, 148, 107905. [Google Scholar] [CrossRef]
- Beillouin, D.; Cardinael, R.; Berre, D.; Boyer, A.; Corbeels, M.; Fallot, A.; Feder, F.; Demenois, J. A Global Overview of Studies about Land Management, Land-use Change, and Climate Change Effects on Soil Organic Carbon. Glob. Chang. Biol. 2022, 28, 1690–1702. [Google Scholar] [CrossRef]
- Lu, Q.; Tian, S.; Wei, L. Digital Mapping of Soil PH and Carbonates at the European Scale Using Environmental Variables and Machine Learning. Sci. Total Environ. 2022, 856, 159171. [Google Scholar] [CrossRef]
- Liu, F.; Wu, H.; Zhao, Y.; Li, D.; Yang, J.L.; Song, X.; Shi, Z.; Zhu, A.X.; Zhang, G.L. Mapping high resolution National Soil Information Grids of China. Sci. Bull. 2022, 67, 328–340. [Google Scholar] [CrossRef]
- NASA Jet Propulsion Laboratory. NASADEM Merged DEM Global 1 Arc Second V001. NASA EOSDIS Land Process. DAAC 2020. Available online: https://lpdaac.usgs.gov/products/nasadem_hgtv001. (accessed on 25 February 2023).
- Hersbach, H.; Bell, B.; Berrisford, P.; Biavati, G.; Horányi, A.; Muñoz Sabater, J.; Nicolas, J.; Peubey, C.; Radu, R.; Rozum, I. ERA5 Monthly Averaged Data on Single Levels from 1979 to Present. Copernic. Clim. Change Serv. C3S Clim. Data Store CDS 2019, 10, 252–266. [Google Scholar] [CrossRef]
- Harris, I.; Osborn, T.J.; Jones, P.; Lister, D. Version 4 of the CRU TS Monthly High-Resolution Gridded Multivariate Climate Dataset. Sci. Data 2020, 7, 109. [Google Scholar] [CrossRef]
- Running, S.; Zhao, M. MODIS/Terra Net Primary Production Gap-Filled Yearly L4 Global 500m SIN Grid V006. 2019. V061 NASA EOSDIS Land Process. DAAC 2021. Available online: https://lpdaac.usgs.gov/products/mod17a3hgfv006/ (accessed on 23 February 2023).
- Breiman, L. Random Forests. Mach. Learn. 2001, 45, 5–32. [Google Scholar] [CrossRef]
- Derrien, M.; Yang, L.; Hur, J. Lipid Biomarkers and Spectroscopic Indices for Identifying Organic Matter Sources in Aquatic Environments: A Review. Water Res. 2017, 112, 58–71. [Google Scholar] [CrossRef] [PubMed]
- Shearman, T.M.; Varner, J.M.; Hood, S.M.; Cansler, C.A.; Hiers, J.K. Modelling Post-Fire Tree Mortality: Can Random Forest Improve Discrimination of Imbalanced Data? Ecol. Model. 2019, 414, 108855. [Google Scholar] [CrossRef]
- Chen, L.; Wang, Y.; Ren, C.; Zhang, B.; Wang, Z. Assessment of Multi-Wavelength SAR and Multispectral Instrument Data for Forest Aboveground Biomass Mapping Using Random Forest Kriging. For. Ecol. Manag. 2019, 447, 12–25. [Google Scholar] [CrossRef]
- Ullman, J.B.; Bentler, P.M. Structural Equation Modeling. In Handbook of Psychology, 2nd ed.; John Wiley & Sons, Inc.: Hoboken, NJ, USA, 2012; Volume 2. [Google Scholar] [CrossRef]
- Gefen, D.; Rigdon, E.E.; Straub, D. Editor’s Comments: An Update and Extension to SEM Guidelines for Administrative and Social Science Research. MIS Q. 2011, 35, iii–xiv. [Google Scholar] [CrossRef]
- Tarka, P. An Overview of Structural Equation Modeling: Its Beginnings, Historical Development, Usefulness and Controversies in the Social Sciences. Qual. Quant. 2018, 52, 313–354. [Google Scholar] [CrossRef] [PubMed]
- Song, B.L.; Yan, M.J.; Hou, H.; Guan, J.H.; Shi, W.Y.; Li, G.Q.; Du, S. Distribution of Soil Carbon and Nitrogen in Two Typical Forests in the Semiarid Region of the Loess Plateau, China. Catena 2016, 143, 159–166. [Google Scholar] [CrossRef]
- Zhou, Y.; Hartemink, A.E.; Shi, Z.; Liang, Z.; Lu, Y. Land Use and Climate Change Effects on Soil Organic Carbon in North and Northeast China. Sci. Total Environ. 2019, 647, 1230–1238. [Google Scholar] [CrossRef]
- Zhao, X.; Tian, P.; Liu, S.; Yin, P.; Sun, Z.; Wang, Q. Mean Annual Temperature and Carbon Availability Respectively Controlled the Contributions of Bacterial and Fungal Residues to Organic Carbon Accumulation in Topsoil across China’s Forests. Glob. Ecol. Biogeogr. 2022, 32, 120–131. [Google Scholar] [CrossRef]
- Pedregosa, F.; Varoquaux, G.; Gramfort, A.; Michel, V.; Thirion, B.; Grisel, O.; Blondel, M.; Prettenhofer, P.; Weiss, R.; Dubourg, V. Scikit-Learn: Machine Learning in Python. J. Mach. Learn. Res. 2011, 12, 2825–2830. [Google Scholar]
- Næs, T.; Romano, R.; Tomic, O.; Måge, I.; Smilde, A.; Liland, K.H. Sequential and Orthogonalized PLS (SO-PLS) Regression for Path Analysis: Order of Blocks and Relations between Effects. J. Chemom. 2021, 35, e3243. [Google Scholar] [CrossRef]
- Thakkar, J.J. Applications of Structural Equation Modelling with AMOS 21, IBM SPSS. Struct. Equ. Model. Appl. Res. Pract. AMOS R. 2020, 285, 35–89. [Google Scholar] [CrossRef]
- Nagelkerke, N.J. A Note on a General Definition of the Coefficient of Determination. Biometrika 1991, 78, 691–692. [Google Scholar] [CrossRef]
- Zeng, L.X.; Xiao, W.F.; Huang, Z.L.; Lei, J.P.; Wang, P.C.; Tan, B.W. Relationship between environmental factors and soil erosion with different patterns of returning farmland to forest in the Three Gorges Reservoir Area. Resour. Environ. Yangtze Basin 2014, 23, 146–152. (In Chinese) [Google Scholar]
- Rita, A.; Bonanomi, G.; Allevato, E.; Borghetti, M.; Cesarano, G.; Mogavero, V.; Rossi, S.; Saulino, L.; Zotti, M.; Saracino, A. Topography Modulates Near-Ground Microclimate in the Mediterranean Fagus Sylvatica Treeline. Sci. Rep. 2021, 11, 8122. [Google Scholar] [CrossRef]
- Fernandez-Romero, M.L.; Lozano-Garcia, B.; Parras-Alcantara, L. Topography and Land Use Change Effects on the Soil Organic Carbon Stock of Forest Soils in Mediterranean Natural Areas. Agric. Ecosyst. Environ. 2014, 195, 1–9. [Google Scholar] [CrossRef]
- De Deyn, G.B.; Cornelissen, J.H.; Bardgett, R.D. Plant Functional Traits and Soil Carbon Sequestration in Contrasting Biomes. Ecol. Lett. 2008, 11, 516–531. [Google Scholar] [CrossRef]
- Díaz, S.; Hector, A.; Wardle, D.A. Biodiversity in Forest Carbon Sequestration Initiatives: Not Just a Side Benefit. Curr. Opin. Environ. Sustain. 2009, 1, 55–60. [Google Scholar] [CrossRef]
- Davidson, E.A.; Trumbore, S.E.; Amundson, R. Soil Warming and Organic Carbon Content. Nature 2000, 408, 789–790. [Google Scholar] [CrossRef]
- Eclesia, R.P.; Jobbagy, E.G.; Jackson, R.B.; Biganzoli, F.; Piñeiro, G. Shifts in Soil Organic Carbon for Plantation and Pasture Establishment in Native Forests and Grasslands of South America. Glob. Chang. Biol. 2012, 18, 3237–3251. [Google Scholar] [CrossRef]
- Qin, H.; Chen, J.; Wu, Q.; Niu, L.; Li, Y.; Liang, C.; Shen, Y.; Xu, Q. Intensive Management Decreases Soil Aggregation and Changes the Abundance and Community Compositions of Arbuscular Mycorrhizal Fungi in Moso Bamboo (Phyllostachys Pubescens) Forests. For. Ecol. Manag. 2017, 400, 246–255. [Google Scholar] [CrossRef]
- Xu, C.; Xu, X.; Ju, C.; Chen, H.Y.H.; Wilsey, B.J.; Luo, Y.; Fan, W. Long-term, Amplified Responses of Soil Organic Carbon to Nitrogen Addition Worldwide. Glob. Chang. Biol. 2021, 27, 1170–1180. [Google Scholar] [CrossRef] [PubMed]
- Lu, N.; Tian, H.; Fu, B.; Yu, H.; Piao, S.; Chen, S.; Li, Y.; Li, X.; Wang, M.; Li, Z. Biophysical and Economic Constraints on China’s Natural Climate Solutions. Nat. Clim. Chang. 2022, 12, 847–853. [Google Scholar] [CrossRef]
- Zhang, X.; Sun, N.; Wu, L.; Xu, M.; Bingham, I.J.; Li, Z. Effects of enhancing soil organic carbon sequestration in the topsoil by fertilization on crop productivity and stability: Evidence from long-term experiments with wheat-maize cropping systems in China. Sci. Total Environ. 2016, 562, 247–259. [Google Scholar] [CrossRef] [PubMed]
- Liang, F.; Li, J.; Yang, X.; Huang, S.; Cai, Z.; Gao, H.; Ma, J.; Cui, X.; Xu, M. Three-decade long fertilization-induced soil organic carbon sequestration depends on edaphic characteristics in six typical croplands. Sci. Rep. 2016, 6, 30350. [Google Scholar] [CrossRef]
- Zhang, X.M.; Brandt, M.; Yue, Y.M.; Tong, X.W.; Wang, K.L.; Fensholt, R. The Carbon Sink Potential of Southern China After Two Decades of Afforestation. Earths Future 2022, 10, e2022EF002674. [Google Scholar] [CrossRef] [PubMed]
- Brown, K.H.; Bach, E.M.; Drijber, R.A.; Hofmockel, K.S.; Jeske, E.S.; Sawyer, J.E.; Castellano, M.J. A Long-Term Nitrogen Fertilizer Gradient Has Little Effect on Soil Organic Matter in a High-Intensity Maize Production System. Glob. Chang. Biol. 2014, 20, 1339–1350. [Google Scholar] [CrossRef]
- Kamau, D.M.; Spiertz, J.H.J.; Oenema, O. Carbon and Nutrient Stocks of Tea Plantations Differing in Age, Genotype and Plant Population Density. Plant Soil. 2008, 307, 29–39. [Google Scholar] [CrossRef]
- Gui, H.; Fan, L.; Wang, D.; Yan, P.; Li, X.; Pang, Y.; Zhang, L.; Zamanian, K.; Shi, L.; Xu, J.; et al. Variations in Soil Nutrient Dynamics and Bacterial Communities After the Conversion of Forests to Long-Term Tea Monoculture Systems. Front. Microbiol. 2022, 13, 896530. [Google Scholar] [CrossRef]
- Zhang, Y.; Ni, J.; Yang, J.; Zhang, T.; Xie, D. Citrus Stand Ages Regulate the Fraction Alteration of Soil Organic Carbon under a Citrus/Stropharua Rugodo-Annulata Intercropping System in the Three Gorges Reservoir Area, China. Environ. Sci. Pollut. Res. 2017, 24, 18363–18371. [Google Scholar] [CrossRef]
- Baskent, E.Z. Assessment and Improvement Strategies of Sustainable Land Management (SLM) Planning Initiative in Turkey. Sci. Total Environ. 2021, 797, 149183. [Google Scholar] [CrossRef]
- Di Sacco, A.; Hardwick, K.A.; Blakesley, D.; Brancalion, P.H.; Breman, E.; Cecilio Rebola, L.; Chomba, S.; Dixon, K.; Elliott, S.; Ruyonga, G. Ten Golden Rules for Reforestation to Optimize Carbon Sequestration, Biodiversity Recovery and Livelihood Benefits. Glob. Chang. Biol. 2021, 27, 1328–1348. [Google Scholar] [CrossRef] [PubMed]
- Wu, L.; Jiang, Y.; Zhao, F.; He, X.; Liu, H.; Yu, K. Increased Organic Fertilizer Application and Reduced Chemical Fertilizer Application Affect the Soil Properties and Bacterial Communities of Grape Rhizosphere Soil. Sci. Rep. 2020, 10, 9568. [Google Scholar] [CrossRef] [PubMed]
- Jia, R.; Zhou, J.; Chu, J.; Shahbaz, M.; Yang, Y.; Jones, D.L.; Zang, H.; Razavi, B.S.; Zeng, Z. Insights into the Associations between Soil Quality and Ecosystem Multifunctionality Driven by Fertilization Management: A Case Study from the North China Plain. J. Clean. Prod. 2022, 362, 132265. [Google Scholar] [CrossRef]
- Ge, Q.; Dai, J.; He, F.; Pan, Y.; Wang, M. Land Use Changes and Their Relations with Carbon Cycles over the Past 300 a in China. Sci. China Ser. Earth Sci. 2008, 51, 871–884. [Google Scholar] [CrossRef]


Disclaimer/Publisher’s Note: The statements, opinions and data contained in all publications are solely those of the individual author(s) and contributor(s) and not of MDPI and/or the editor(s). MDPI and/or the editor(s) disclaim responsibility for any injury to people or property resulting from any ideas, methods, instructions or products referred to in the content. |
© 2023 by the authors. Licensee MDPI, Basel, Switzerland. This article is an open access article distributed under the terms and conditions of the Creative Commons Attribution (CC BY) license (https://creativecommons.org/licenses/by/4.0/).