Abstract
Climate change is a major driver of cyclical and seasonal changes in alpine phenology. This study investigated how climate change affects vegetation phenology’s spatial and temporal responses on the Qinghai–Tibet plateau (QTP) from 1981 to 2020. We used the daily two-band enhanced vegetation index (EVI2) at a 0.05° spatial resolution for 1981–2014, 16-day moderate resolution imaging spectroradiometer (MODIS) enhanced vegetation index data for 2000–2020 at 250 m spatial resolution, and climate records from 106 meteorological stations from 1981 to 2020 to construct linear regression models and Mann–Kendall point test to understand the changes on QTP vegetation in response to climate change. We found that the temperature in April, July, and September controls vegetation growth, and spring precipitation (p < 0.05) influences the length of the growing period, with a partial correlation coefficient of −0.69. Over the past 40 years, temperature and precipitation changes on the QTP have not shown abrupt shifts despite the increasingly warm and dry spring climate. We observed a meridional distribution trend in the correlation between precipitation and alpine vegetation greening, browning and the length of the growing period. In regions experiencing strong warming, vegetation growth was hindered by a lack of precipitation. We conclude that climatic factors alone cannot fully explain the changing trends in vegetation phenology across the QTP.
1. Introduction
From 1951 to 2012, the global mean surface temperature experienced an increase of 0.15 °C per decade. During the same period, precipitation over the mid-latitude land areas of the Northern Hemisphere increased [1]. Climate change has led to rapid warming and decreased humidity, impacting the structure and functions of the terrestrial ecosystem to varying degrees over the past few decades [2,3,4,5]. Vegetation phenology is the seasonal patterns of biological events and the factors influencing them, especially meteorological phenomena [6,7]. Climate change is an important driver of changes in phenology, affecting surface roughness, community composition, vegetation productivity, and the exchange of water, heat, and carbon in the soil–vegetation–atmosphere system [8,9]. In the context of global warming, understanding ecological change and quantifying the impact of climate change on terrestrial ecosystems is currently an important research direction.
The QTP, known as the earth’s third pole, is the world’s highest and largest plateau. Between 1960 and 2010, the warming rate on the QTP increased by 0.2 °C per decade, surpassing the warming rates observed in the Northern Hemisphere, Southern Hemisphere, and globally [10]. This accelerated warming rate has prompted research on vegetation phenology, focusing on understanding the spatiotemporal patterns, the relationship between phenology and climate, and developing methods to detect key phenological dates from remotely sensed time-series data.
Recent studies have highlighted that continuous warming does not necessarily lead to the sustainable development of plant phenology, mainly due to the varied impacts of climate on phenology [4,5,11,12,13,14,15,16,17]. Specifically, researchers have found that the hydrothermal conditions during the early stages of vegetation growth are the primary drivers of vegetation development. Chen et al. [10] identified temperature as the primary factor affecting grassland vegetation greening on the Tibetan Plateau, while precipitation also played a key role in a few areas. Piao et al. [11] analyzed grassland vegetation greening between 1981 and 2006 on the QTP and reported two greening periods influenced by spring temperature: an earlier trend from 1981 to 1999 and a delayed trend from 1999 to 2006. Yu et al. [18] observed a delayed greening trend after 1995, attributed to prolonged grassland vegetation dormancy in the alpine meadows and alpine steppes on the QTP. Similarly, Shen et al. [15] demonstrated that warming spring temperatures affected the onset of vegetation greening in the eastern QTP and other regions with abundant water. A 1 °C increase in spring temperature could advance vegetation greening by an average of 4.1 days [19]. Luedeling et al. [20] found that spring temperature has a greater impact on grassland vegetation greening than winter temperature on the QTP. While numerous studies have investigated vegetation phenology trends and mechanisms on the QTP, the diverse climate events, complex topography, varying vegetation types, and extensive coverage of the plateau contribute to the ongoing scientific debates about the specific factors controlling phenological changes in the region. More importantly, several studies overlooked the spatiotemporal difference typical of the QTP and the cumulative effects of climatic events on vegetation phenology, and this study fills this knowledge gap. In addition, empirical studies on vegetation browning and changes in the length of the growing season in response to climate change are relatively scarce in the literature.
This paper investigates the spatiotemporal response of phenology (greening, browning and length of growing season) to climate change on the QTP. We used the daily two-band enhanced vegetation index (EVI2) at a spatial resolution of 0.05° for the years 1981–2014 and 16-day moderate resolution imaging spectroradiometer (MODIS) enhanced vegetation index data for the years 2000–2020 at a resolution of 250 m. Further, we collected climate records from 106 meteorological stations from 1981 to 2020 on the QTP to construct linear regression models and used the Mann–Kendall mutation point test to assess the effect of climate change on alpine phenology over the study period. Thus, we aim to gain insights into the mechanisms regulating grassland productivity, in order to optimize grazing practices, and promote resource conservation on the QTP.
2. Materials and Methods
2.1. Study Area
The QTP is located in southwestern China (26°00′12″ N–39°46′50″ N and 73°18′52″ E–104°46′59″ E). It is the highest plateau in the world, characterized by several mountains that divide it into numerous basins, wide valleys, and lakes. It is often called the “roof of the world” and the source of several major rivers in Asia. The climate on the QTP is influenced by its elevation and the monsoonal winds from the Indian Ocean. Consequently, a thermal and moisture gradient exists from southeast to northwest, and the plateau can be categorized into four major climatic regions: the humid temperate region, the temperate and sub-alpine sub-humid region, the temperate and sub-alpine semiarid region, and the temperate and arid alpine region [21]. The average annual air temperature decreased from 15.5 °C in the southeast to −5.0 °C in the northwest, while the average annual total precipitation decreased from 1764 mm in the southeast to 16 mm in the northwest between 1981 and 2006. These climatic variations across the plateau determine vegetation distribution. The dominant vegetation types from southeast to northwest include forests, shrubs, meadows, steppes, and deserts. There are also intrazonal vegetation types, such as alpine and cultivated vegetation. Notably, meadows and steppes account for approximately 55% of the total area on the plateau.
2.2. Datasets
2.2.1. Remote Sensing Data
The daily two-band enhanced vegetation index (EVI2) global long-term dataset was generated by calculating the EVI from red and near-infrared reflectance. The data was derived from the daily land surface reflectance records in the AVHRR LTDR (advanced very high-resolution radiometer long-term data record) and the MODIS CMG (moderate resolution imaging spectroradiometer composite monthly global) datasets [22,23]. The daily EVI2 dataset was obtained from the University of Arizona in HDF (hierarchical data format), covering 34 years from 1981 to 2014, with a spatial resolution of 0.05°. The dataset can be accessed at the University of Arizona’s website (http://vip.arizona.edu/viplab_data_explorer, accessed on 11 July 2021). We used the MOD13Q1 EVI obtained from the USGS (United States Geological Survey) website (https://lpdaac.usgs.gov/, accessed on 18 July 2021) to extend the EV12 dataset to 2020. By establishing a linear regression relationship between MOD13Q1 EVI and EVI2, a new EVI dataset was generated at a spatial resolution of 0.05° for the years 1981 to 2020. The new dataset enabled the monitoring of vegetation phenology and activities in different ecosystems over the long term in the study area.
2.2.2. Meteorological Data
This study employed climate records from 106 meteorological stations in the QTP, including the monthly average temperature and precipitation from 1981 to 2020. The data were obtained from the China Meteorological Data Sharing Service Network.
2.3. Methods
2.3.1. Phenological Information Extraction
To accurately capture subtle features and changes in EVI2 data, the Savitzky–Golay (SG) filtering method was employed, which utilizes local fitting as its primary approach. By applying SG filtering, the EVI2 curve was reconstructed. The SG filtering technique was introduced by Savitzky and Golay, in 1964 [24], as a weighted moving average filter, and it is calculated using Equation (1). The dynamic threshold method, as reported by Jönsson and Eklundh [25], was utilized to extract phenological information related to grassland vegetation. This approach enabled us to analyze the period from 1981 to 2010. Vegetation greening and browning thresholds were set at 10 and 20%, respectively.
2.3.2. ANUSPLIN Meteorological Interpolation
ANUSPLIN is a widely used software for fitting climate data surfaces based on the thin plate spline theory [26,27,28,29]. This method incorporates a linear covariant sub-model that considers the relationship between temperature, elevation, precipitation and coastline, except ordinary spline-independent variables. The linear sub-model modules are automatically based on the available data.
The ANUSPLIN system, written in FORTRAN, consists of eight program modules. This study used the SPLINA and LAPGRD modules to determine the final interpolation schemes. A twice-spline method was employed for temperature interpolation, using longitude and latitude as independent variables and altitude as the covariate. After square root conversion processing, precipitation was interpolated by cubic spline, taking longitude, latitude, and altitude as independent variables. These techniques were used to obtain monthly mean temperature and precipitation with a grid size of 1km from 1981 to 2020.
2.3.3. Theil–Sen’s Median Slope
Theil–Sen’s median slope algorithm analyzes a sequence’s trend by calculating pairs of time series with n samples (n(n − 1)/2 pairs). It is an alternative to linear least square regression. One advantage of Theil–Sen’s median slope algorithm is its non-parametric nature, which helps mitigate the effect of outliers on statistical results. According to Hoaglin et al. [30], Theil–Sen’s median slope estimation is robust and remains unaffected by up to 29% of the samples that may contain outliers. We applied Theil–Sen’s median slope to the QTP and divided the results into six zones. These zones are early greening, delayed greening, advanced browning, delayed browning, shortened growth length, and extended growth length. This division allowed for the exploration of how different grassland growth responds to climate variability across the QTP region.
2.3.4. Mann–Kendall Two-Side Test
For each element xi, the number of ri elements xi preceding it (i > j) was calculated so that rank (xi) > rank (xj). The test statistic was calculated as:
The distribution function of t was assumed to be asymptotically Gaussian with:
where E(Sk) was the mathematical expectation of Sk, the average accumulated Sk, and Var(Sk) was the variance of Sk. H0 was rejected for high values of UFk:
The graphical representation of all UFk, where 1 ≤ k ≤ N, was denoted by C1. The same principle was applied to the retrograde series to localize the onset of changes, and the graphical representation of the retrograde series UBk was denoted by C2. Examining the intersection of curves C1 and C2 made it possible to identify the occurrence of changes, indicating abrupt shifts in the dataset. The year corresponding to this intersection represents the onset of the observed change. Absolute values of Fk > 1.96 were considered to signal the presence of a trend or significant change in the time series.
2.3.5. Spatiotemporal Response of Phenology to Temperature and Precipitation Change
The vegetation greening, browning, and growth length images were segmented based on the different zones of Theil–Sen’s median slope. To investigate how monthly precipitation and temperature impact phenological patterns, we assessed the relationship between greening, browning, growth length and climatic factors such as temperature and precipitation. Further, we examined monthly mean temperature and accumulated precipitation data from one to four months before observing changes in vegetation greening, and from one to nine months before observing changes in vegetation browning or growth length, as shown in Table 1. We analyzed the relationship between vegetation phenology (greening, browning, and growth length) and climate variables (monthly mean temperature and accumulated precipitation) using 55-time combinations of the independent variable (See Table 1). We calculated correlation coefficients and partial correlation coefficients to determine the maximum correlation coefficient, presented as the strongest correlation between vegetation phenology and climate.

Table 1.
The independent variables and dependent variables used to test the relationship between greening, browning, growth length and climatic factors.
3. Results
3.1. Temporal Response of Phenology to Temperature and Precipitation Changes
Table 2 shows the correlation and partial correlation coefficients between temperature and precipitation across the phenological stages in different regions. In the region with early onset of greening, there was a (p < 0.05) negative correlation and partial correlation between vegetation greening and average temperature from April to May. Additionally, there was a (p < 0.05) positive correlation between vegetation greening and precipitation, but no partial correlation was observed. These findings indicate that the primary drivers of advanced greening were warming and increased humidity during spring in that specific region. Further, when the effect of temperature on greening was not considered, the impact of spring precipitation on vegetation greening was not evident. In contrast, the effect of spring temperature on grassland greening was weaker in the delayed greening region than that in the early greening region, and precipitation did not affect grassland growth in the latter area.
Table 2.
Correlation and partial correlation coefficients between phenology and different combinations of temperature and precipitation.
We found a (p < 0.05) negative correlation between browning and the average temperature in July, with −0.59 and −0.57 correlation and partial correlation coefficients, respectively. This implies that as the temperature increases, grassland browning occurs early. In the delayed region, increased precipitation during August or temperature during September delays grassland browning. There was a positive correlation (0.56) and partial correlation (0.51) between the temperature in September and grassland browning. The correlation (0.51) and partial correlation (0.17) between the precipitation in August and grassland browning indicated that precipitation did not affect vegetation browning when the temperature was not considered.
The length of the vegetation growing period was primarily driven by greening and browning. In the region with a relatively short growing season, the increase in temperature during July played a significant role in reducing the length of the growing season, with the correlation and partial correlation coefficients of −0.58 and −0.54, respectively. Surprisingly, we did not observe the effect of precipitation on these regions’ shortened vegetation growing period. In the region with extended vegetation growing period, temperature and precipitation affected vegetation browning similarly. However, the effect of precipitation on the length of the vegetation growing period was higher during the previous months than that in August or September.
Generally, spring temperature influences vegetation greening, providing further insight into the constraint of spring temperature on grassland greening. Meanwhile, the response of vegetation greening to spring precipitation was slower in the delayed region than in the early region. The summer temperature was a strong factor limiting vegetation browning and the length of the growing period in regions with early browning and short growing seasons. The lag response of browning to precipitation was shorter than for the growing period.
Based on the data presented in Table 2, we conducted the Mann–Kendall abrupt point test to investigate the trend of change in temperature and precipitation over the QTP, leveraging Theil–Sen’s median slope classes. Figure 1 shows the precipitation and temperature in the early greening region decreased before 1990, increased after 1990 based on the UF curve, and (p < 0.05) increased after 2005. The temperature trend in the delayed greening region was consistent with that in the early greening region, while precipitation showed a decreasing trend. The precipitation in the advanced browning and shortened vegetation growing period areas decreased until 2005 and slightly increased after 2005. The temperature variations in these two regions were similar to those observed in vegetation greening areas. However, the UBk and UFk curves did not intersect at a specific point, indicating the absence of a sudden change in temperature and precipitation trends across the QTP.
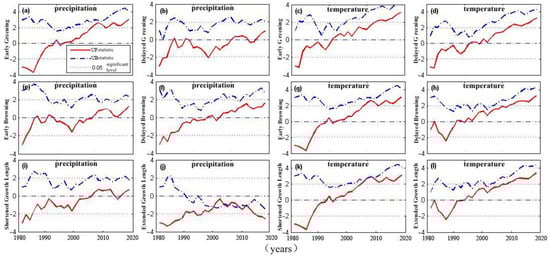
Figure 1.
Mann–Kendall abrupt point test of temperature and precipitation based on Theil–Sen’s trend estimation across the QTP ((a–d) are Mann–Kendall abrupt point test of precipitation and temperature in early greening region or delayed greening region; (e–h) are the abrupt point test of precipitation and temperature in early browning region or delayed browning region; (i–l) are the abrupt point test of precipitation and temperature in shortened growth length region or extended growth length region. The lines are UFk curves, and the blue lines are UFk curves).
3.2. Spatial Response of Phenology to Temperature and Precipitation Changes
There was a negative correlation between grassland greening and temperature in some parts of Gannan, Sichuan, and eastern Tibet, encompassing 26% of the total pixels (Figure 2). Conversely, the regions exhibiting a positive correlation between grassland greening and temperature were mainly located in the southwest and northwest parts of the plateau, representing 20% of the total pixels. In contrast, approximately 55% of the total pixels showed no significant correlation (p > 0.05), with values ranging from −0.36 to 0.36 (Figure 2a). Regarding the relationship between grassland greening and precipitation, 19% of the total pixels in eastern Qinghai and western Gansu recorded a negative correlation, ranging from −1 to −0.36. Furthermore, about 20% of the entire region exhibited correlation coefficients ranging from 0.36 to 1 for grassland greening and precipitation, mainly concentrated in northern Tibet.
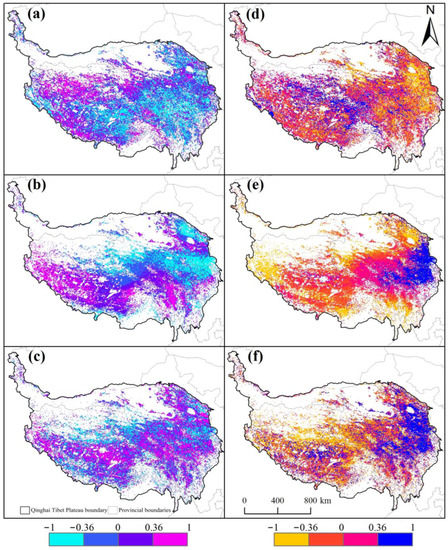
Figure 2.
Spatial distribution of maximum correlation coefficient between grassland phenology (vegetation greening, browning, and the length of the growing period), temperature and precipitation on the QTP (a–c) are the maximum correlation coefficients between vegetation greening, browning and growing period length, and temperature, respectively; (d–f) are the maximum correlation coefficients between the vegetation greening, browning and growing period length, and precipitation, respectively).
The grassland browning and temperature relationship showed a radial zonality pattern with increasing trends. In the eastern part of the QTP, 22% of the pixels had correlation coefficients below 0.36, while in the western and southwestern QTP, 21% had coefficients above 0.36 (Figure 2b). The correlation between grassland browning and precipitation showed a decreasing trend with positive, neutral, and negative correlations from east to west. The eastern and southeastern Qinghai and western Gansu had 15% pixels with coefficients ranging from 0.36 to 1, 62% pixels were neutral in western Sichuan, central Tibet, and southern Qinghai, and 23% pixels with correlation coefficients ranging from −0.36 to −1 were found in Ngari, the northern Qinghai Lake, and Nyingchi.
The distribution of correlation coefficients between the length of the growing period and temperature in northwest Tibet was primarily in the range of −1 to −0.36, encompassing 19% of the total pixels. In contrast, regions with correlation coefficients between the length of the growing period and temperature ranging from 0.36 to 1 accounted for 31% of the total pixels. The remaining 49% of pixels showed no significant (p > 0.05) correlation between the growing period length and temperature. The regions with correlation coefficients of 0.36 to 1 between the growing period length and precipitation were concentrated in the Qinghai Lake basin, eastern and southeastern Qinghai, and eastern Tibet. Additionally, there were scattered areas in western Tibet, totaling 29% of the total pixels. On the other hand, 27% of the total pixels exhibited a negative correlation between growing season length and precipitation in the Northern Tibetan Plateau.
4. Discussion
This study investigated how temperature and precipitation influence vegetation greening, browning and length of growing period. We found that both temperature and precipitation impact these aspects of vegetation, but the time taken for the response to occur varies. Previous studies have shown that higher temperature and precipitation levels in the QTP can reduce vegetation’s hydrothermal stress and extend its growth by enhancing grassland vegetation activity [31,32,33].
Table 2 shows regional variations in the relationship between phenology and climate across different spatial scales. Besides the observed impact of temperature and precipitation on grassland growth in our study, solar radiation, soil moisture, evapotranspiration, and species characteristics are other influencing factors on grassland growth reported in the literature [34]. Thus, the trends observed in vegetational changes cannot be adequately explained solely by temperature and precipitation.
According to Piao et al. [11], the changes in vegetation greening aligned with changes in spring temperature. The authors reported an increasing trend in vegetation greening before 1998, followed by a decreasing trend from 1998 to 2006. In this study, we did not find any abrupt change in spring temperature across the QTP during the study period (Figure 3). This may be related to variations in the methodological approach used in the previous and present studies.
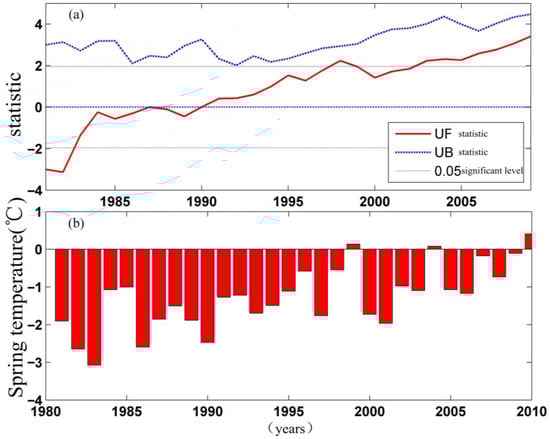
Figure 3.
Mann–Kendall abrupt point test of spring temperature across the QTP from 1981 to 2010 ((a) is the Mann–Kendall abrupt point test of spring temperature from 1981–2010 in Qinghai Tibet Plateau; (b) is histogram of spring temperature from 1981–2010 in Qinghai Tibet Plateau).
The regions experiencing advanced vegetation browning and shortened growth length exhibited noticeable warming and drying trends. Compared to the prominent warming trend, the decrease in precipitation makes it challenging for plants to meet water requirements under these warmer conditions, resulting in early vegetation browning and shorter growth lengths. This disparity could contribute to the lack of correlation between vegetation browning, growth length, and precipitation.
The climate changes observed in the regions with delayed greening were consistent with those in the advanced browning and shortened growth length regions. Notably, the Mann–Kendall abrupt point test for climatic conditions of vegetation habitats in the study area lends credence to the correlation analysis. Our results show that changes in growth length were influenced by greening and browning. The relationship between growth length and climate change alone is insufficient to explain the underlying response mechanisms of growth length to climate change fully and effectively. For example, the area with extended growth length exhibited decreased precipitation and increased temperature, suggesting that further research is needed to enhance our understanding of this relationship.
5. Conclusions
This study analyzed the spatiotemporal response of phenology to climate change on the Qinghai–Tibetan Plateau (QTP) using two datasets: the daily two-band enhanced vegetation index (EVI2) at a spatial resolution of 0.05° for 1981–2014 and the 16-day moderate resolution imaging spectroradiometer (MODIS) enhanced vegetation index data at a spatial resolution of 250 m for 2000–2020. We combined these datasets to create a new EVI dataset from 1981 to 2020 at a spatial resolution of 0.05°.
Our findings indicate that vegetation growth on the QTP is primarily driven by temperature in April, July, and September. Changes in vegetation browning and growth length in regions with delayed browning and extended length are controlled by autumn temperature and spring precipitation. Over the past 40 years, the spring climate on the QTP has become increasingly warm and dry, but these changes have not been sudden.
We observed regional differences in the climate’s impact on vegetation growth. In areas experiencing strong warming, vegetation growth is hampered by a lack of precipitation. Moreover, we found that climatic factors alone are insufficient to fully explain the changing trends in vegetation phenology. Our study demonstrates the complex relationship between climate change and vegetation phenology on the QTP. While temperature and precipitation play significant roles, regional variations and other factors contribute to the changing trends in vegetation growth.
Author Contributions
Conceptualization S.C. and J.Z.; writing and data curation, S.C. and K.X.; methodology, J.Z.; checking and review, Y.C. All authors have read and agreed to the published version of the manuscript.
Funding
This study was funded by Innovative Talent Promotion Plan–Youth Science and Technology New Star Project of Shaanxi Province (2023KJXX-119), Key Research and Development Program of Shaanxi Province (2022ZDLSF06-09), the National Natural Science Foundation of China (Grant Number 31802123).
Data Availability Statement
Not applicable.
Conflicts of Interest
The authors declare no conflict of interest.
References
- IPCC. Summary for policymakers. In Climate Change 2014: Impacts, Adaptation, and Vulnerability. Part A: Global and Sectoral Aspects. Contribution of Working Group II to the Fifth Assessment Report of the Intergovernmental Panel on Climate Change; Field, C.B., Barros, V.R., Dokken, D.J., Mach, K.J., Mastrandrea, M.D., Bilir, T.E., Chatterjee, M., Ebi, K.L., Estrada, Y.O., Genova, R.C., et al., Eds.; Cambridge University Press: New York, NY, USA, 2014; pp. 1–32. [Google Scholar]
- Fu, Y.H.; Campioli, M.; Deckmyn, G.; Janssens, I.A. Sensitivity of leaf unfolding to experimental warming in three temperate tree species. Agric. For. Meteorol. 2013, 181, 125–132. [Google Scholar] [CrossRef]
- Fan, D.; Zhu, W.; Zheng, Z.; Zhang, D.; Pan, Y.; Jiang, N.; Zhou, X. Change in the green-up dates for Quercus mongolica in Northeast China and its climate-driven mechanism from 1962 to 2012. PLoS ONE 2015, 10, e0130516. [Google Scholar] [CrossRef]
- Wang, H.; Liu, D.; Lin, H.; Montenegro, A.; Zhu, X. NDVI and vegetation phenology dynamics under the influence of sunshine duration on the Tibetan Plateau. Int. J. Climatol. 2015, 35, 687–698. [Google Scholar] [CrossRef]
- Ding, M.J.; Li, L.H. Temperature dependence of variations in the end of the growing season from 1982 to 2012 on the Qinghai-Tibet Plateau. GIScience Remote Sens. 2016, 53, 147–163. [Google Scholar] [CrossRef]
- Augspurger, C.; Cheeseman, J.; Salk, C. Light gains and physiological capacity of understorey woody plants during phenological avoidance of canopy shade. Funct. Ecol. 2005, 19, 537–546. [Google Scholar] [CrossRef]
- Chuine, I. A unified model for budburst of trees. J. Theor. Biol. 2000, 207, 337–347. [Google Scholar] [CrossRef]
- Richardson, A.D.; Anderson, R.S.; Arain, M.A.; Barr, A.G.; Bohrer, G.; Chen, G.; Chen, J.M.; Ciais, P.; Davis, K.J.; Desai, A.R.; et al. Terrestrial biosphere models need better representation of vegetation phenology: Results from the North American Carbon Program Site Synthesis. Glob. Chang. Biol. 2012, 18, 566–584. [Google Scholar] [CrossRef]
- Cao, R.; Chen, J.; Shen, M.; Tang, Y. An improved logistic method for detecting spring vegetation phenology in grasslands from MODIS EVI time-series data. Agric. For. Meteorol. 2015, 200, 9–20. [Google Scholar] [CrossRef]
- Chen, X.; An, S.; Inouye, D.W.; Schwartz, M.D. Temperature and snowfall trigger alpine vegetation green-up on the world’s roof. Glob. Chang. Biol. 2015, 21, 3635–3646. [Google Scholar] [CrossRef]
- Piao, S.; Cui, M.; Chen, A.; Wang, X.; Ciais, P.; Liu, J.; Tang, Y. Altitude and temperature dependence of change in the spring vegetation green-up date from 1982 to 2006 in the Qinghai-Xizang Plateau. Agric. For. Meteorol. 2011, 151, 1599–1608. [Google Scholar] [CrossRef]
- Shen, M.G. Spring phenology was not consistently related to winter warming on the Tibetan Plateau. Proc. Natl. Acad. Sci. USA 2011, 108, E91–E92. [Google Scholar] [CrossRef] [PubMed]
- Jin, Z.; Zhuang, Q.; He, J.S.; Luo, T.; Shi, Y. Phenology shift from 1989 to 2008 on the Tibetan Plateau: An analysis with a process-based soil physical model and remote sensing data. Clim. Chang. 2013, 119, 435–449. [Google Scholar] [CrossRef]
- Zhang, G.; Zhang, Y.; Dong, J.; Xiao, X. Green-up dates in the Tibetan Plateau have continuously advanced from 1982 to 2011. Proc. Natl. Acad. Sci. USA 2013, 110, 4309–4314. [Google Scholar] [CrossRef] [PubMed]
- Shen, M.; Zhang, G.; Cong, N.; Wang, S.; Kong, W.; Piao, S. Increasing altitudinal gradient of spring vegetation phenology during the last decade on the Qinghai-Tibet Plateau. Agric. For. Meteorol. 2014, 189–190, 71–80. [Google Scholar] [CrossRef]
- Tian, Y.H.; Chen, X.Q.; Lin, X.Q. Temperature and geographic attribution of change in the Taraxacum mongolicum growing season from 1990 to 2009 in eastern China’s temperate zone. Int. J. Biometeorol. 2015, 59, 1437–1452. [Google Scholar]
- Ding, M.J.; Li, L.H.; Nie, Y.; Chen, Q.; Zhang, Y.L. Spatio-temporal variation of spring phenology in Tibetan Plateau and its linkage to climate change from 1982 to 2012. J. Mt. Sci. 2016, 13, 83–94. [Google Scholar] [CrossRef]
- Yu, H.Y.; Luedeling, E.; Xu, J.C. Winter and spring warming result in delayed spring phenology on the Tibetan Plateau. Proc. Natl. Acad. Sci. USA 2010, 107, 22151–22156. [Google Scholar] [CrossRef]
- Gao, Y.; Zhou, X.; Wang, Q.; Wang, C.; Zhan, Z.; Chen, L.; Yan, J.; Qu, R. Vegetation net primary productivity and its response to climate change during 2001–2008 in the Tibetan Plateau. Sci. Total Environ. 2013, 444, 356–362. [Google Scholar] [CrossRef]
- Luedeling, E.; Yu, H.; Xu, J. Replies to Shen, Chen et al., and Yi and Zhou: Linear regression analysis misses effects of winter temperature on Tibetan vegetation. Proc. Natl. Acad. Sci. USA 2011, 108, E95. [Google Scholar] [CrossRef]
- Domros, M.; Peng, G.B. The Climate of China; Springer: Berlin/Heidelberg, Germany, 1988; pp. 253–257. [Google Scholar]
- Huete, A.R.; Didan, K.; Shimabukuro, Y.E.; Ratana, P.; Saleska, S.R.; Hutyra, L.R.; Yang, W.; Nemani, R.R.; Myneni, R. Amazon rainforests green-up with sunlight in dry season. Geophys. Res. Lett. 2006, 33, L06405. [Google Scholar] [CrossRef]
- Jiang, Z.; Huete, A.R.; Didan, K.; Miura, T. Development of a two-band enhanced vegetation index without a blue band. Remote Sens. Environ. 2008, 112, 3833–3845. [Google Scholar] [CrossRef]
- Cong, N.; Piao, S.; Chen, A.; Wang, X.; Lin, X.; Chen, S.; Han, S.; Zhou, G.; Zhang, X. Spring vegetation green-up date in China inferred from SPOT NDVI data: A multiple model analysis. Agric. For. Meteorol. 2012, 165, 104–113. [Google Scholar] [CrossRef]
- Jonsson, P.; Eklundh, L. Seasonality extraction by function fitting to time-series of satellite sensor data. IEEE Trans. Geosci. Remote Sens. 2002, 40, 1824–1832. [Google Scholar] [CrossRef]
- Price, D.T.; McKenney, D.W.; Nalder, I.A.; Hutchinson, M.F.; Kesteven, J.L. A comparison of two statistical methods for spatial interpolation of Canadian monthly mean climate data. Agric. For. Meteorol. 2000, 101, 81–94. [Google Scholar] [CrossRef]
- Yang, P.; Ren, G.; Liu, W. Spatial and Temporal Characteristics of Beijing Urban Heat Island Intensity. J. Appl. Meteorol. Clim. 2013, 52, 1803–1816. [Google Scholar] [CrossRef]
- Fu, M.; Wang, J.; Zhu, Y.; Zhang, Y. Evaluation of the Protection Effectiveness of Natural Protected Areas on the Qinghai–Tibet Plateau Based on Ecosystem Services. Int. J. Environ. Res. Public Health 2023, 20, 2605. [Google Scholar] [CrossRef] [PubMed]
- Song, Y.; Liang, T.; Zhang, L.; Hao, C.; Wang, H. Spatio-Temporal Changes and Contribution of Human and Meteorological Factors to Grassland Net Primary Productivity in the Three-Rivers Headwater Region from 2000 to 2019. Atmosphere 2023, 14, 278. [Google Scholar] [CrossRef]
- Hoaglin, D.C.; Mosteller, F.; Tukey, J.W. Understanding Robust and Exploratory Data Analysis; Wiley: New York, NY, USA, 2000. [Google Scholar]
- Zhuang, Q.; He, J.; Lu, Y.; Ji, L.; Xiao, J.; Luo, T. Carbon dynamics of terrestrial ecosystems on the Tibetan Plateau during the 20th century: An analysis with a process-based biogeochemical model. Glob. Ecol. Biogeogr. 2010, 19, 649–662. [Google Scholar] [CrossRef]
- Nichols, J.E.; Peteet, D.M.; Moy, C.M.; Castañeda, I.S.; McGeachy, A.; Perez, M. Impacts of climate and vegetation change on carbon accumulation in a south-central Alaskan peatland assessed with novel organic geochemical techniques. Holocene 2014, 24, 1146–1155. [Google Scholar] [CrossRef]
- Rhee, J.; Im, J.; Carbone, G.J. Monitoring agricultural drought for arid and humid regions using multi-sensor remote sensing data. Remote Sens. Environ. 2010, 114, 2875–2887. [Google Scholar] [CrossRef]
- Karnieli, A.; Agam, N.; Pinker, R.T.; Anderson, M.; Imhoff, M.L.; Gutman, G.G.; Panov, N.; Goldberg, A. Use of NDVI and Land Surface Temperature for Drought Assessment: Merits and Limitations. J. Clim. 2010, 23, 618–633. [Google Scholar] [CrossRef]
Disclaimer/Publisher’s Note: The statements, opinions and data contained in all publications are solely those of the individual author(s) and contributor(s) and not of MDPI and/or the editor(s). MDPI and/or the editor(s) disclaim responsibility for any injury to people or property resulting from any ideas, methods, instructions or products referred to in the content. |
© 2023 by the authors. Licensee MDPI, Basel, Switzerland. This article is an open access article distributed under the terms and conditions of the Creative Commons Attribution (CC BY) license (https://creativecommons.org/licenses/by/4.0/).