Article

Forest Conversion Changes Soil Particulate Organic Carbon and Mineral-Associated Organic Carbon via Plant Inputs and Microbial Processes

1
Key Laboratory of Sustainable Forest Ecosystem Management-Ministry of Education, School of Forestry, Northeast Forestry University, Harbin 150040, China
2
College of Life Science and Technology, Central South University of Forestry and Technology, Changsha 410004, China
*
Author to whom correspondence should be addressed.
Forests 2023, 14(6), 1234; https://doi.org/10.3390/f14061234
Submission received: 30 May 2023 / Revised: 5 June 2023 / Accepted: 13 June 2023 / Published: 14 June 2023
(This article belongs to the Section Forest Soil)

Abstract

:
Primary forest conversion greatly influences soil organic carbon (SOC) sequestration. However, our understanding of how primary forest conversion affects SOC fractions and chemical component evenness remains limited. We examined how primary forest conversion (from primary mixed broadleaved Korean pine forest to secondary broadleaved forest and coniferous plantation) affects free particulate OC (POC), aggregate-occluded POC, mineral-associated OC (MAOC), and their chemical component evenness via plant inputs (e.g., litter and fine roots) and microbial properties (e.g., microbial biomass and residue C) in Northeast China. Primary forest conversion led to a large increase in litter and fine root quality (lower C/N ratio), SOC, and MBC of secondary forests and a reduction in litter and fine root quantity and quality, SOC, MBC, and microbial residue C of plantations, which drove changes in POC and MAOC. As a result, after conversion to secondary forests, free POC decreased by 20.3% and aggregate-occluded POC increased by 57.2%. After conversion to plantations, free POC increased by 49.1%, while aggregate-occluded POC and MAOC decreased by 42.4% and 9.0%, respectively. Free POC was negatively correlated with fine root biomass. Aggregate-occluded POC and MAOC were positively correlated with litter and fine root quality, MBC, and microbial residue C. Meanwhile, forest conversion decreased the evenness of free and aggregate-occluded POC chemical components in secondary forests, with O-alky C being higher and aromatic C being lower, while MAOC was not affected by forest conversion. The evenness of free and aggregate-occluded POC chemical components was associated with litter and fine root quality, and that of MAOC was associated with MBC and microbial residue C. High-quality plant inputs benefit OC sequestration in soil aggregates and MAOM through microbial assimilation and residue accumulation after primary forest conversion. Future forest management should consider tree species with high-quality input as a possible compensation for climate change by sequestering more OC in soil aggregates.

1. Introduction

Undisturbed primary forests store large amounts of organic carbon (OC) in the soil, making them a valuable carbon sink for mitigating climate change [1,2]. Nowadays, a growing number of primary forests are being converted to plantations, secondary forests, and other land uses due to climate change and human disturbance [3,4,5]. It causes a reduction in soil organic carbon (SOC) storage and changes the formation pathway and stability of SOC, greatly affecting SOC sequestration [6,7,8]. Particulate OC (POC) and mineral-associated OC (MAOC) are well-documented fractions for better understanding SOC dynamics under climate change [5,9]. POC is mainly made up of lightweight plant materials that are relatively undecomposed, and it is sensitive to environmental changes [9,10]. MAOC consists of single molecules leached directly and microbial residues associated with soil minerals [11,12]. There exists another group of POC occluded within aggregates or entrapped in soil pores, which could confer an aggregate level of persistence [9,13]. Unfortunately, this part of SOC has always been overlooked in studies, limiting our full understanding of SOC accumulation and vulnerability under forest conversion.
Plant C inputs, microbial turnover, and soil physical and chemical protection are the main drivers of POC and MAOC variations after primary forest conversion [5,14]. Tropical primary forests converted to rubber plantations and secondary forests altered POC and MAOC because of plant C input depletion and stable C pool decomposition [5]. High-quality plant inputs enriched with nitrogen can boost soil microbe growth and aggregate promoter (such as earthworms and roots) activity [15,16,17], facilitating aggregate-occluded POC formation. Additionally, high-quality plant inputs enhance microbial C utilization efficiency and are readily assimilated into microbial products [11,18,19]. These microbial products preferentially associate with soil clay and minerals as MAOC [19]. In contrast, low-quality plant inputs contain more molecules that are recalcitrant to most microorganisms and are usually left in the soil as POC without protection [19]. Belowground C inputs from roots are more efficient in stable soil C formation than aboveground C inputs [20]. On the one hand, fine roots occur naturally in the soil, and their growth directly contributes to aggregate formation and OC entrapment [21]. On the other hand, root exudates and dead fine roots were stabilized as MAOC by the rhizosphere’s in vivo microbial turnover pathway [20,22]. Compared to fine roots, C inputs from aboveground litter are preferentially formed as POC by leaching and soil fauna disturbance [10,22,23]. The quantity and quality of plant C inputs from litter and fine roots, along with soil aggregate structures and microbial C use efficiency, are the first to be affected by primary forest conversion, followed by soil C stocks and stability [24]. To date, there is still a lack of a clear understanding of how primary forest conversion affects free POC, aggregate-occluded POC, and MAOC accumulation, and the explicit controlling mechanisms.
Soil organic carbon accumulation and persistence are closely linked to the evenness of SOC chemical component distribution [25,26]. High evenness of SOC chemical composition can reduce SOC loss risk under environmental changes by increasing the microbial cost–benefit ratio [25,26]. In contrast, lower evenness corresponds to a higher or lower abundance of individual components [26]. It facilitates soil biota specialization and more effective decomposition investment strategies [27]. Tree species composition and functional diversity impact SOC chemical component evenness [26]. Mixed forests with nitrogen fixation tree species had a higher evenness of SOC chemical components than pure plantations [28]. Additionally, soil aggregate entrapment, mineral adsorption, and microbial decomposition selectively remove or protect specific molecules, affecting SOC chemical component evenness [29,30]. Thus, we speculate that free POC, aggregate-occluded POC, and MAOC would have different chemical component evenness and respond differently to primary forest conversion.
The temperate mixed broadleaved-Korean pine (Pinus koraiensis) forest is the zonal climax vegetation in northeast China. In the past few decades, numerous primary mixed broadleaved-Korean pine forests have been converted to secondary broadleaved forests and coniferous plantations due to increased timber demand [31]. The Heilongjiang Liangshui National Nature Reserve has multiple forest stands with different management regimes within a restricted geographical region where extensive research has been done on soil carbon and nutrient cycling for forest carbon budget estimation under forest conversion [24,31,32,33]. As a continuation of previous research findings on primary forest conversion in this region, we conducted this study to examine how primary forest conversion impacts SOC functional fractions in terms of plant inputs and microbial turnover. We aimed to identify the role of forest conversion-driven plant inputs and microbial turnover on soil carbon storage, refining soil carbon modeling. We measured the distribution of free and aggregate-occluded POC and MAOC as well as their chemical component evenness using a density-size fractionation method combined with 13C NMR spectroscopy. Litter and fine roots, soil microbial biomass C, and residue C accumulation were also measured. We hypothesized that (1) the variation in free and aggregate-aggregated POC and their chemical component evenness is driven by litter and fine root traits, and (2) the accumulation of MAOC and its chemical component evenness are mainly related to microbial properties, i.e., carbon assimilation and residue accumulation.

2. Materials and Methods

2.1. Site Description and Sampling

This study was conducted in the Heilongjiang Liangshui National Nature Reserve (47°10′50″ N, 128°53′20″ E) in northeastern China. The nature reserve covers an area of 121.33 km2, with an approximate growing stock of 1.88 million m3 and an average canopy coverage of 98%. The climate is continental monsoon, with a mean annual temperature of −0.3 °C, a mean annual precipitation of 676 mm, and an average annual evaporation of 805 mm. The growing season is relatively short, with 100–120 days without frost. The dark brown forest soil with a loamy texture and high organic matter content was developed from granitic bedrock and is classified as Albi-Boric Argosol in the Chinese Soil Taxonomy. We selected three forest types, including primary mixed broadleaved-Korean pine forests that have experienced little or no human disturbance and two mid-aged regenerating forests, i.e., secondary birch forests and larch plantations. The secondary birch forests have been naturally regenerated on previously harvested areas without any silvicultural treatment or logging residue removal. The larch plantations are monocultural stands established after logging and subsequent site preparation, including removal of logging debris, and seedlings of Larix gmelinii were planted on the clear-cut sites. These forests are similar in topography, regional climate, and original vegetation.
Given the availability of forest sites for sampling, we selected six different locations in the reserve to establish sampling plots for each forest type. Therefore, a total of 18 stands with similar site conditions were included, all of which were on a middle-down slope of approximately 15° with a southwest slope aspect. In each stand, a 30 m × 30 m plot was established in May 2020, and the basic characteristics of the three forest types based on the plot inventory are summarized in Table 1. Eight soil cores were randomly sampled from organic (0–5 cm) and mineral (5–15 cm) soil layers within each plot using a soil auger (inner diameter: 5 cm) and thoroughly mixed into one composite sample per soil depth. All soil samples were sieved with a 2 mm screen and divided into two parts: one part was refrigerated at 4 °C to measure soil microbial biomass carbon, and the other part was air-dried at room temperature to analyze soil physical and chemical properties. Forest litter in each plot was collected using eight litter traps (1 m × 1 m) with 1 mm mesh in each plot between May and November 2020. The collected litter samples were oven-dried to a consistent weight at 60 °C for litter production and chemical property determination. Fine roots were collected from the topsoil (0–15 cm) of each plot using a root auger (inner diameter of 5 cm). All living and dead fine roots (<2 mm) of the woody plants were removed and then washed with deionized water. The collected fine root samples were oven-dried to a constant mass at 60 °C for biomass and chemical property determination.

2.2. Soil and Plant Input Property Analyses

SOC, total nitrogen (TN), forest litter, and fine root OC and N contents were determined by dry combustion using an EA1108 CHN Elemental Analyzer (Fisons Instruments, Wiesbaden, Germany). Soil pH was analyzed (1:2.5 soil/water) using a laboratory pH meter. Soil MBC was determined using the chloroform fumigation extraction method with 0.05 mol/L K2SO4 as an extractant [34]. The concentration of MBC was analyzed using a Multi 3100 N/C TOC analyzer (Analytik Jena, Jena, Germany). The ratio of MBC to SOC was used to determine the capacity of microbes to assimilate carbon [35]. Soil amino sugars were analyzed using an Agilent 7890B GC (Agilent Technologies, Santa Clara, CA, USA) [36]. Microbial residues C, including fungal and bacterial residues C, can be quantified by the concentrations of the amino sugar biomarkers glucosamine (GluN), galactosamine (GalN), and muramic acid (MurN) [37]. The fungal and bacterial residue C was calculated as follows:
F u n g a l   r e s i d u e   C g   k g 1 = G l u N × 9 2 × M u r N × 179.2 251.2 × 9
B a c t e r i a l   r e s i d u e   C g   k g 1 = M u r N × 45
where 179.2 and 251.2 are the molecular weights of GluN and MurN, respectively, and values of 9 and 45 are conversion factors [38,39]. Total microbial residue C was calculated as the sum of fungal residue C and bacterial residue C. The ratio of microbial residue C to SOC was used to estimate the relative contribution of microbial residue C to SOC.

2.3. Soil Organic Matter Fractionation

Soil organic matter (SOM) was divided into three components by using a combination of size and density fractionation, a modification of the fractionation method described by [40]. Briefly, 20 g of soil sample was floated in a sodium iodide (NaI) solution (ρ = 1.8 g ml−1) to separate the free particulate organic matter (POM; density < 1.8 g ml−1). Then, the remaining soil sample was suspended in 80 mL of the NaI solution and dispersed ultrasonically with an energy input of 486 J g−1 using a sonicator (Sonifier 300, Shanghai Sheng Analytical Ultrasonic Instrument Co., Ltd., Shanghai, China) with an 8 mm diameter tip in a 150 mL tube in ice water to obtain the aggregate-occluded POM (density < 1.8 g ml−1). The sediment was then wet-sieved to obtain mineral-associated organic matter (MAOM; particle size < 53 μm). These SOM components were washed at least three times with distilled water, oven-dried at 60 °C, weighed, and ball-milled for OC and N determination and subsequent analysis.

2.4. Solid-State 13C CPMAS NMR Spectroscopy Analyses

The chemical compositions of SOC and its components were measured with solid-state 13C cross-polarization magic-angle spinning NMR spectroscopy analysis. Briefly, soils were pretreated with 10% hydrofluoric acid solution 3 times [41], and 13C NMR spectra were recorded on an NMR spectrometer (AVANCE III 400, Bruker BioSpin AG, Fällanden, Switzerland) equipped with a 4 mm standard bore CP-MAS probe using a ramp-cross-polarization pulse program with a spinning rate of 5 kHz. The frequency was 50.32 MHz. The contact time was 1 ms, and the recycle delay was 1 s for all components. Depending on the OC content of the samples, between 2000 and 250,000 scans were accumulated, and a line broadening between 0 and 50 Hz was applied. For the calibration of the 13C chemical shifts, tetramethylsilane was used and set to 0 ppm. After baseline correction, four chemical shift regions, alkyl C (0–45 ppm), O-alkyl C (45–110 ppm), aromatic C (110–165 ppm), and carboxyl C (165–215 ppm), were defined and calculated for their relative abundance. Representative 13C NMR spectra of the HF-treated soils are shown in Figure S1. The evenness of C chemical components was calculated using Pielou’s evenness index (J′): J′ = H′/Hmax [26]. H′ is Shannon diversity, and Hmax is the maximum probable value of H′. Hmax is equivalent to Ln S. S =4. H′ = −∑pi log2 pi, where pi = ni/N, ni is the abundance of the ith C chemical component, and N is the overall abundance. A lower evenness of organic C chemical components implies a high or low abundance of some specific chemical components. In contrast, higher evenness implies more evenly distributed C groups in organic C chemical components [26].

2.5. Statistical Analyses

One-way ANOVA with the least squares difference (LSD) test was used to determine the significant differences in litter production, litter C/N ratio, fine root biomass, fine root C/N ratio, soil pH, SOC, TN, soil C/N ratio, MBC, microbial residue C, fungal residue C, bacterial residue C, free POC, aggregate-occluded POC, MAOC, and their chemical component evenness. Linear regressions were applied to identify significant factors controlling SOC components and their proportions in SOC. Structural equation modeling (SEM) was performed using AMOS 24.0 (IBM, Armonk, NY, USA) to explore the direct and indirect relationships between SOC components, plant inputs, and soil microbial properties. Model fit was assessed using the χ2 test, comparative fit index (CFI), and root square mean error of approximation (RMSEM). Principal component analyses (PCAs) were used to examine whether OC chemical component evenness was significantly associated with forest litter, fine roots, and soil microbial properties.

3. Results

3.1. Forest Litter, Fine Roots, and Soil Properties Affected by Primary Forest Conversion

Compared with primary mixed forests, secondary forests had lower litter and fine root C/N ratios, while coniferous plantations produced less litter and fine root biomass (Table 1). Secondary forests had higher SOC and TN and lower C/N ratios, whereas coniferous plantations had lower SOC and TN than primary mixed forests (Table 1). Secondary forests increased MBC but not microbial residue C, fungal residue C, or bacterial residue C (Figure 1a–d). Microbial residue C and especially fungal residue C contributions were reduced in secondary forests (Figure 1f,g). In coniferous plantations, both MBC and microbial residue C and their contributions were reduced (Figure 1e–h).

3.2. OC Components and Their Chemical Components Affected by Primary Forest Conversion

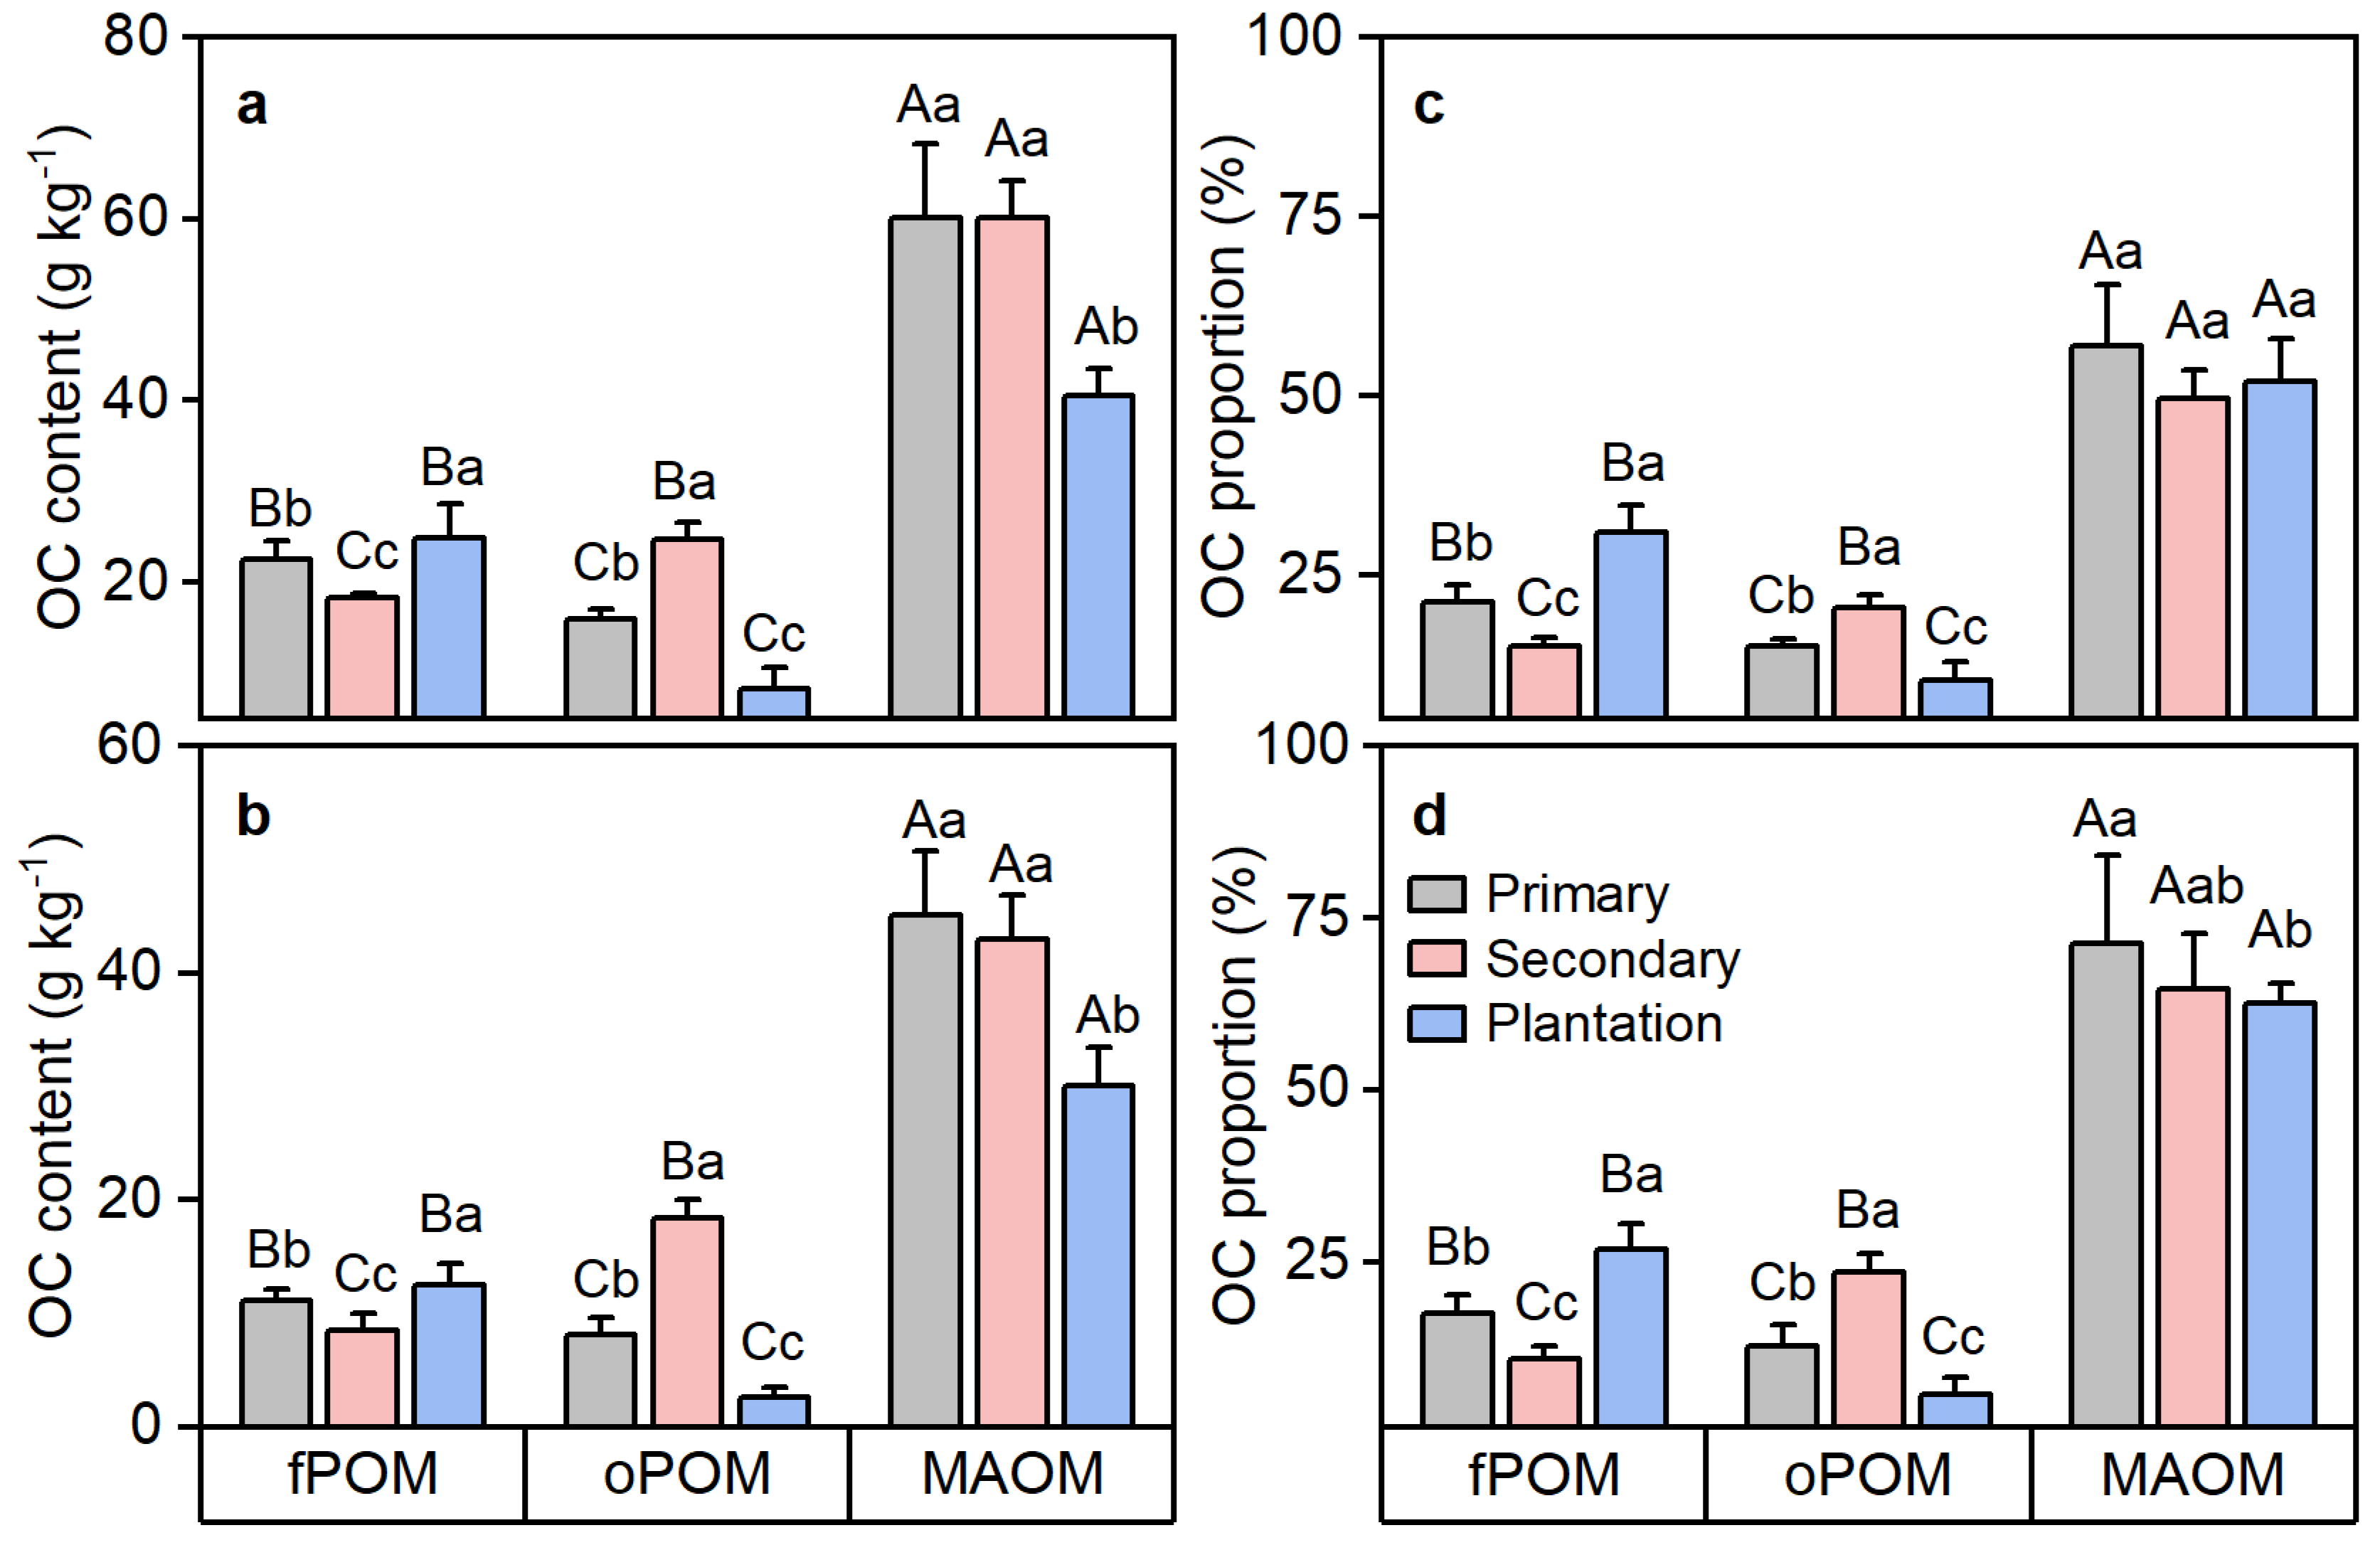
In these forest soils, MAOM had the highest OC content and proportion, ranging from 30.1%–60.2% and 44.5%–83.9%, respectively (Figure 2). Free POM and aggregated-occluded POM represented 8.6%–36.3% and 3.3%–26.7% of SOC, respectively (Figure 2c,d). Forest conversion significantly altered the OC distribution in SOC components, resulting in the free POM as a proportion of SOC decreasing by 33.1% and the aggregated-occluded POM increasing by 57.2% in the secondary forests; however, the free POM as a proportion of SOC increased by 49.1%, the aggregated-occluded POM decreased by 42.4%, and MAOM decreased by 9.0% in the coniferous plantations compared to those in the primary forests (Figure 2c,d).
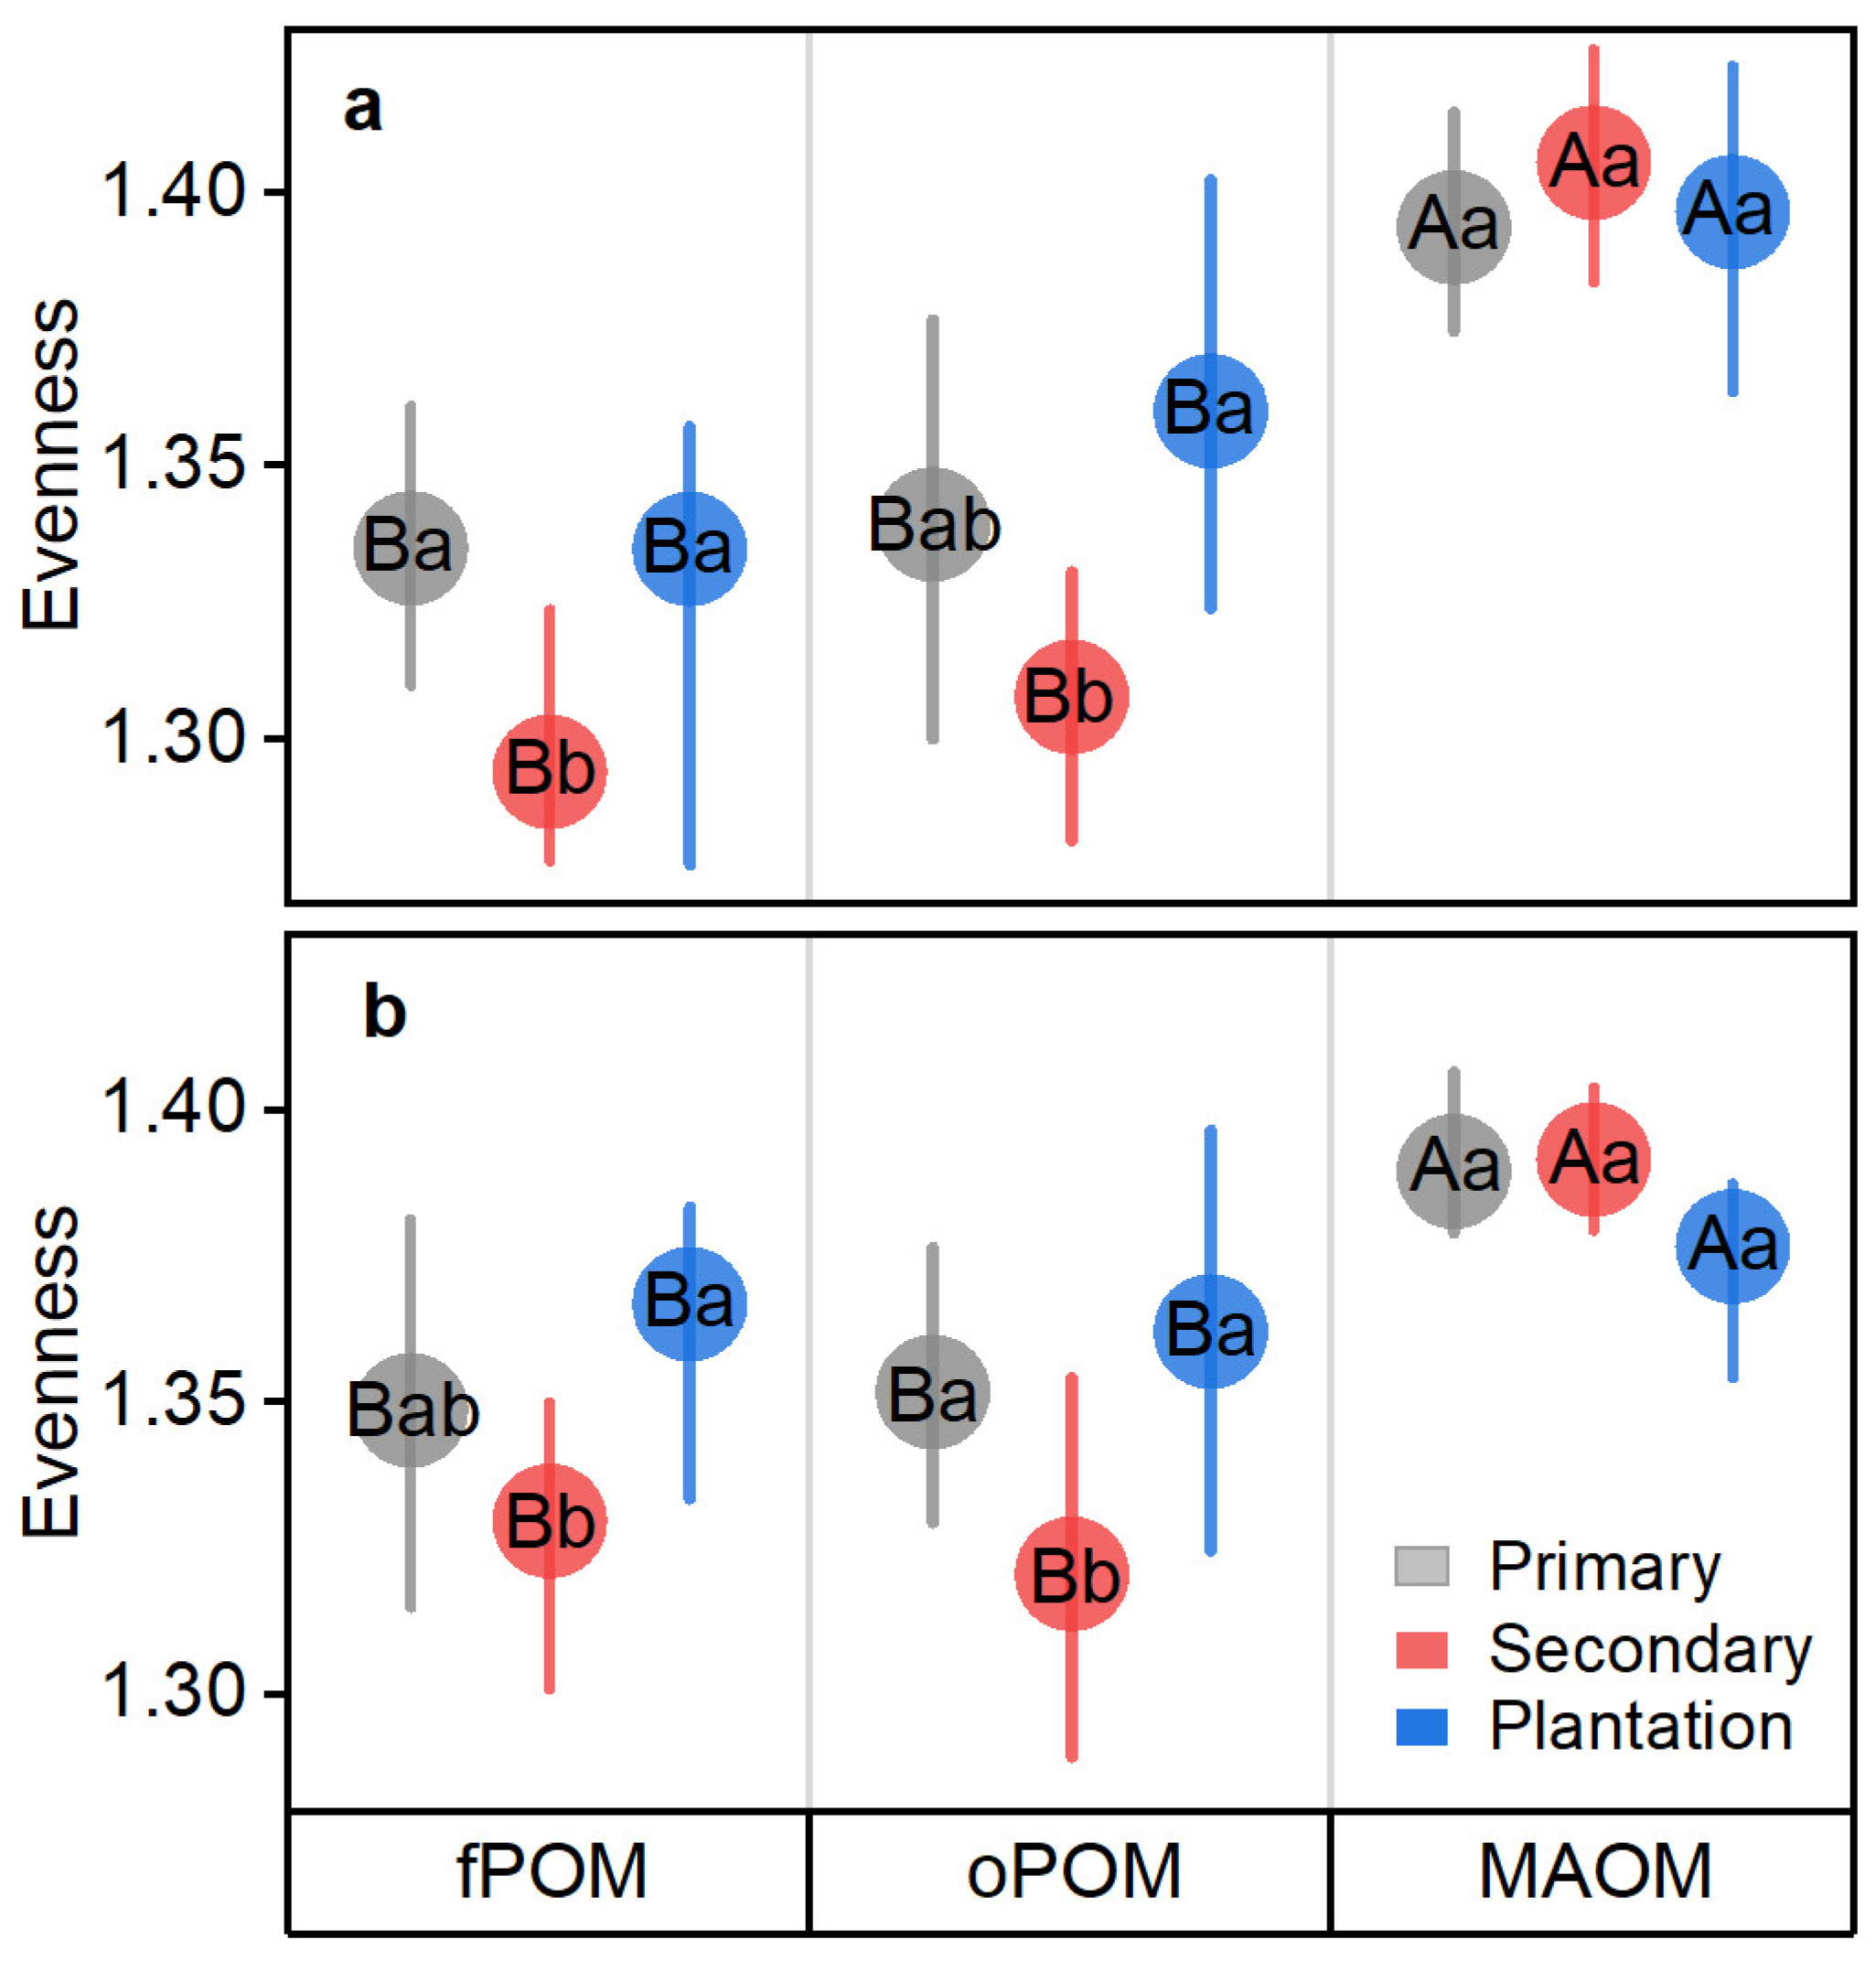
Compared with primary mixed forests, secondary forests increased O-alkyl C but decreased aromatic C in free and aggregate-occluded POM (Table 2). In contrast, coniferous plantations decreased O-alkyl C but increased aromatic C in free and aggregate-occluded POM. MAOC had higher chemical component evenness than free and aggregate-occluded POC (Figure 3). The chemical component evenness of free and aggregate-occluded POC in secondary forests was lower than that in other forest types (Figure 3). Meanwhile, the chemical components and evenness of MAOM remained unchanged across different forest types (Table 2; Figure 3).

3.3. Controls on POC and MAOC Accumulation after Primary Forest Conversion

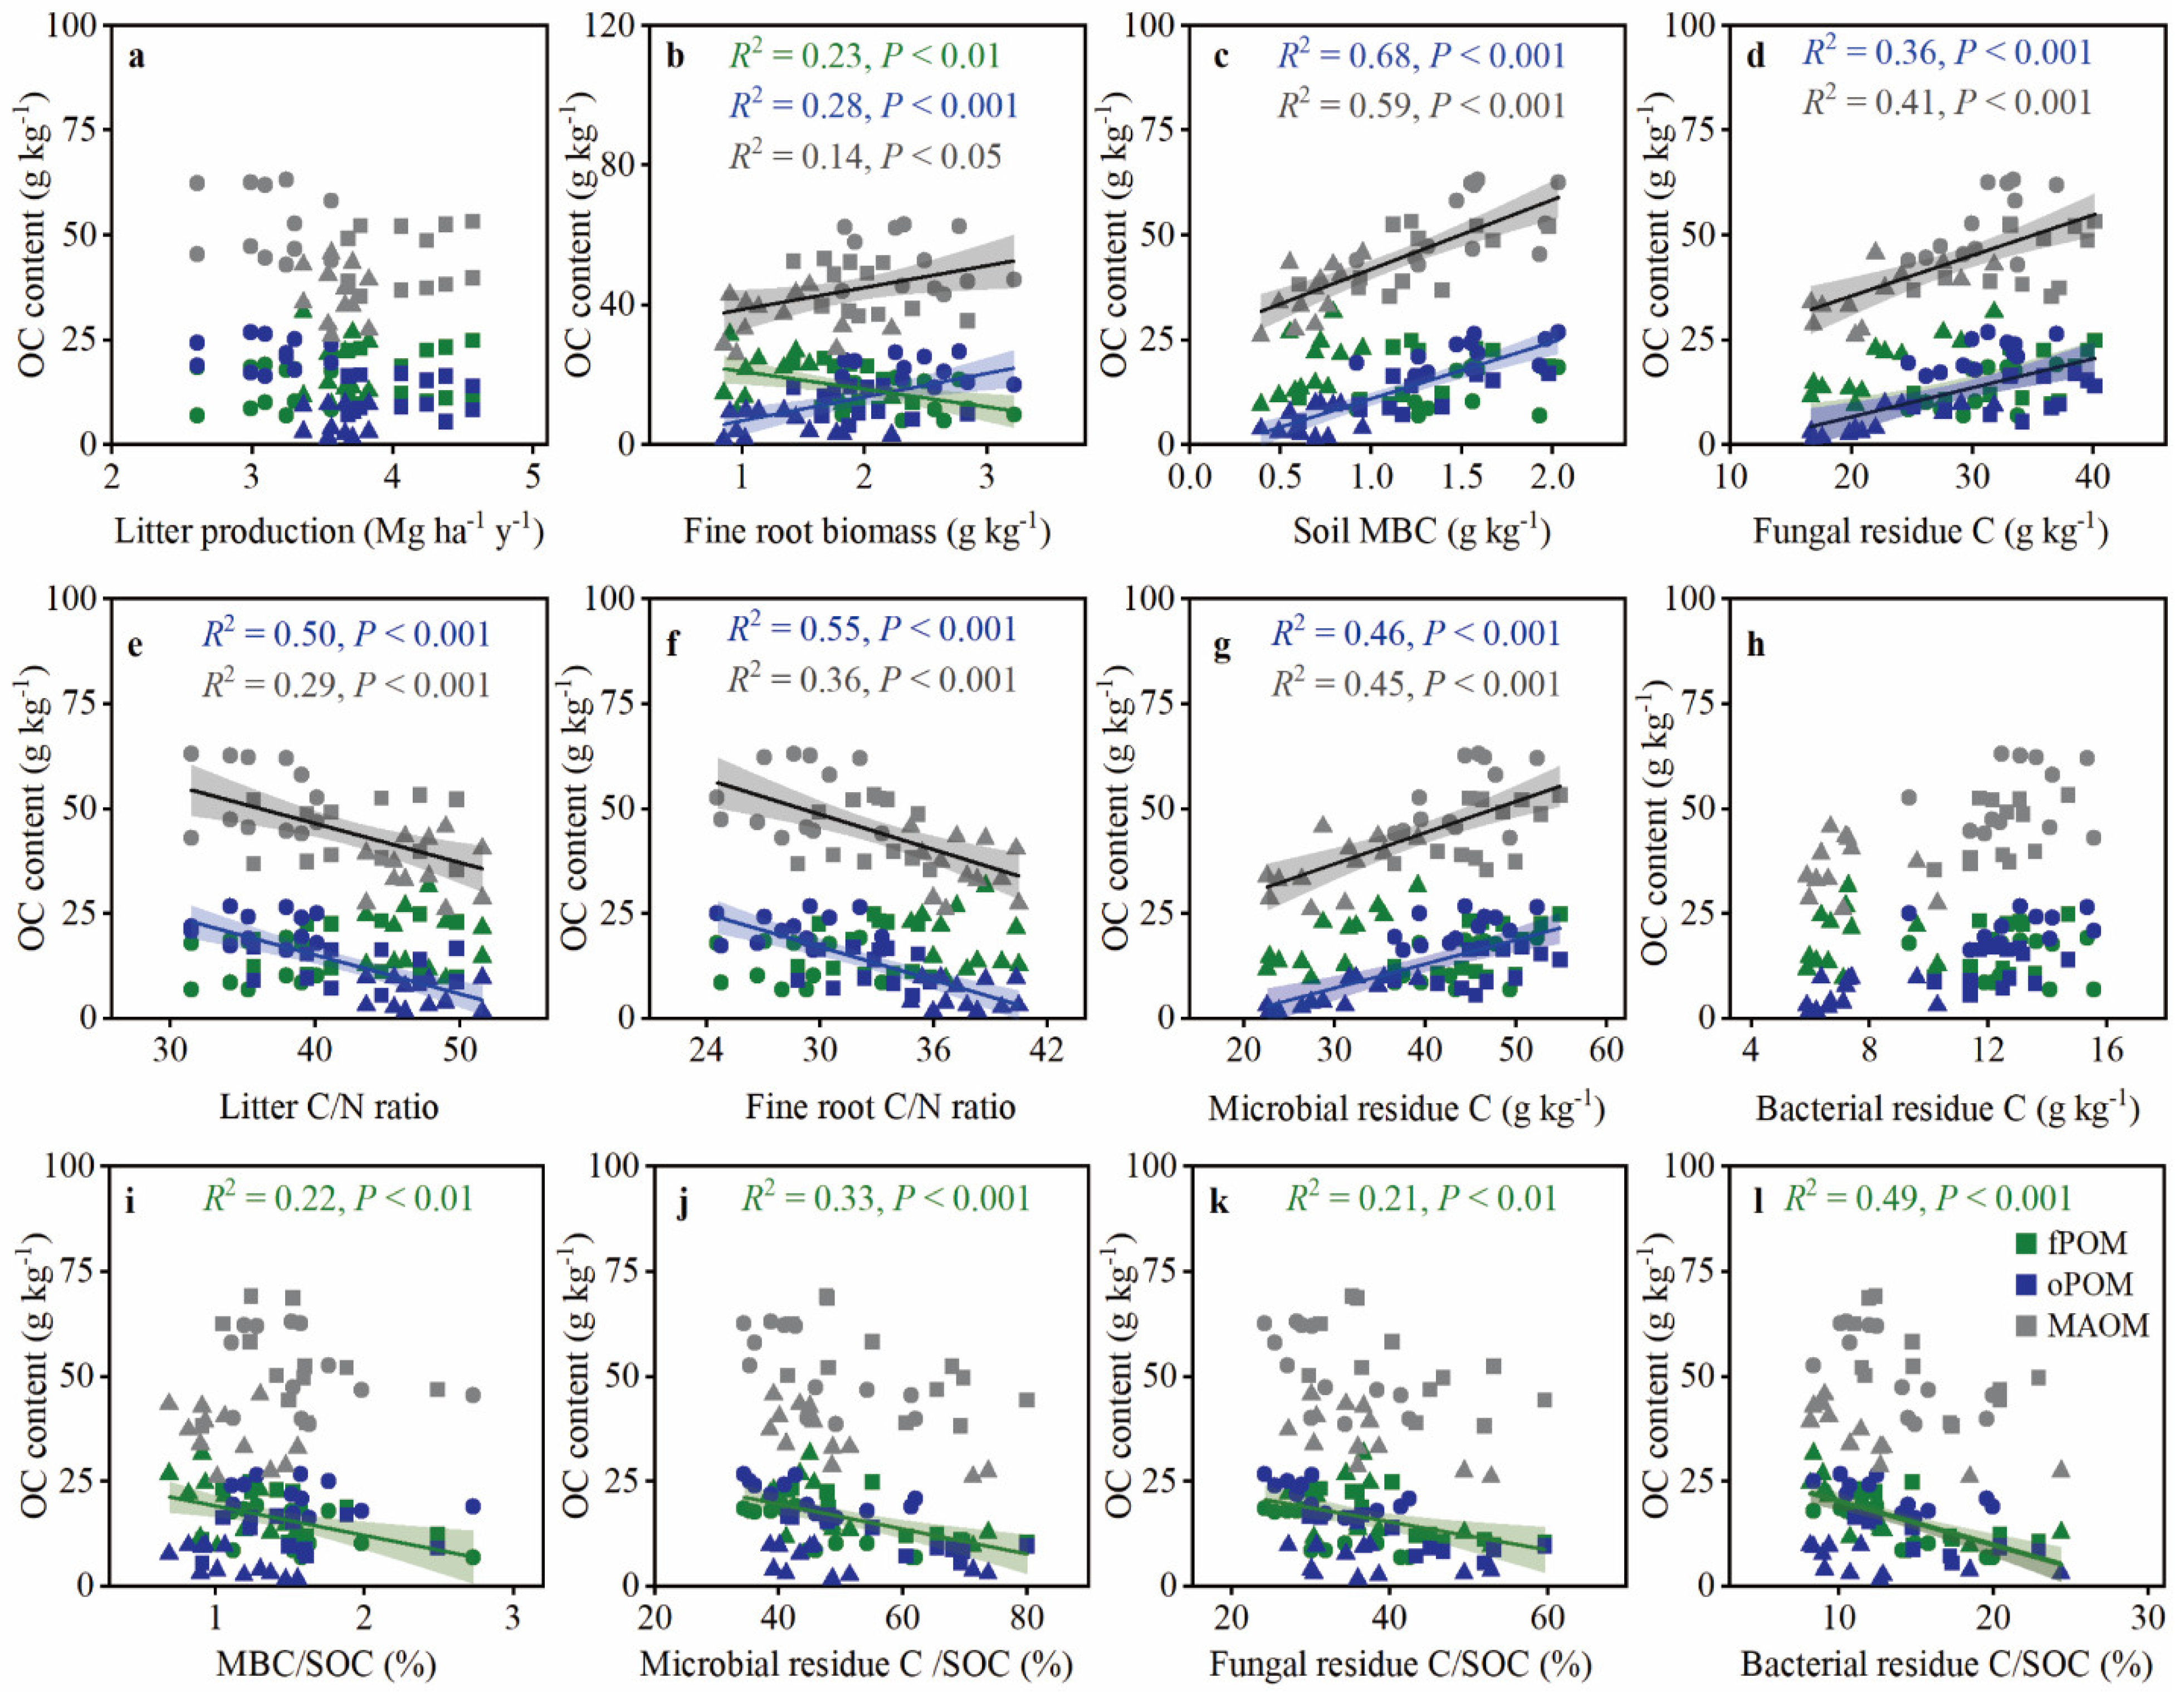
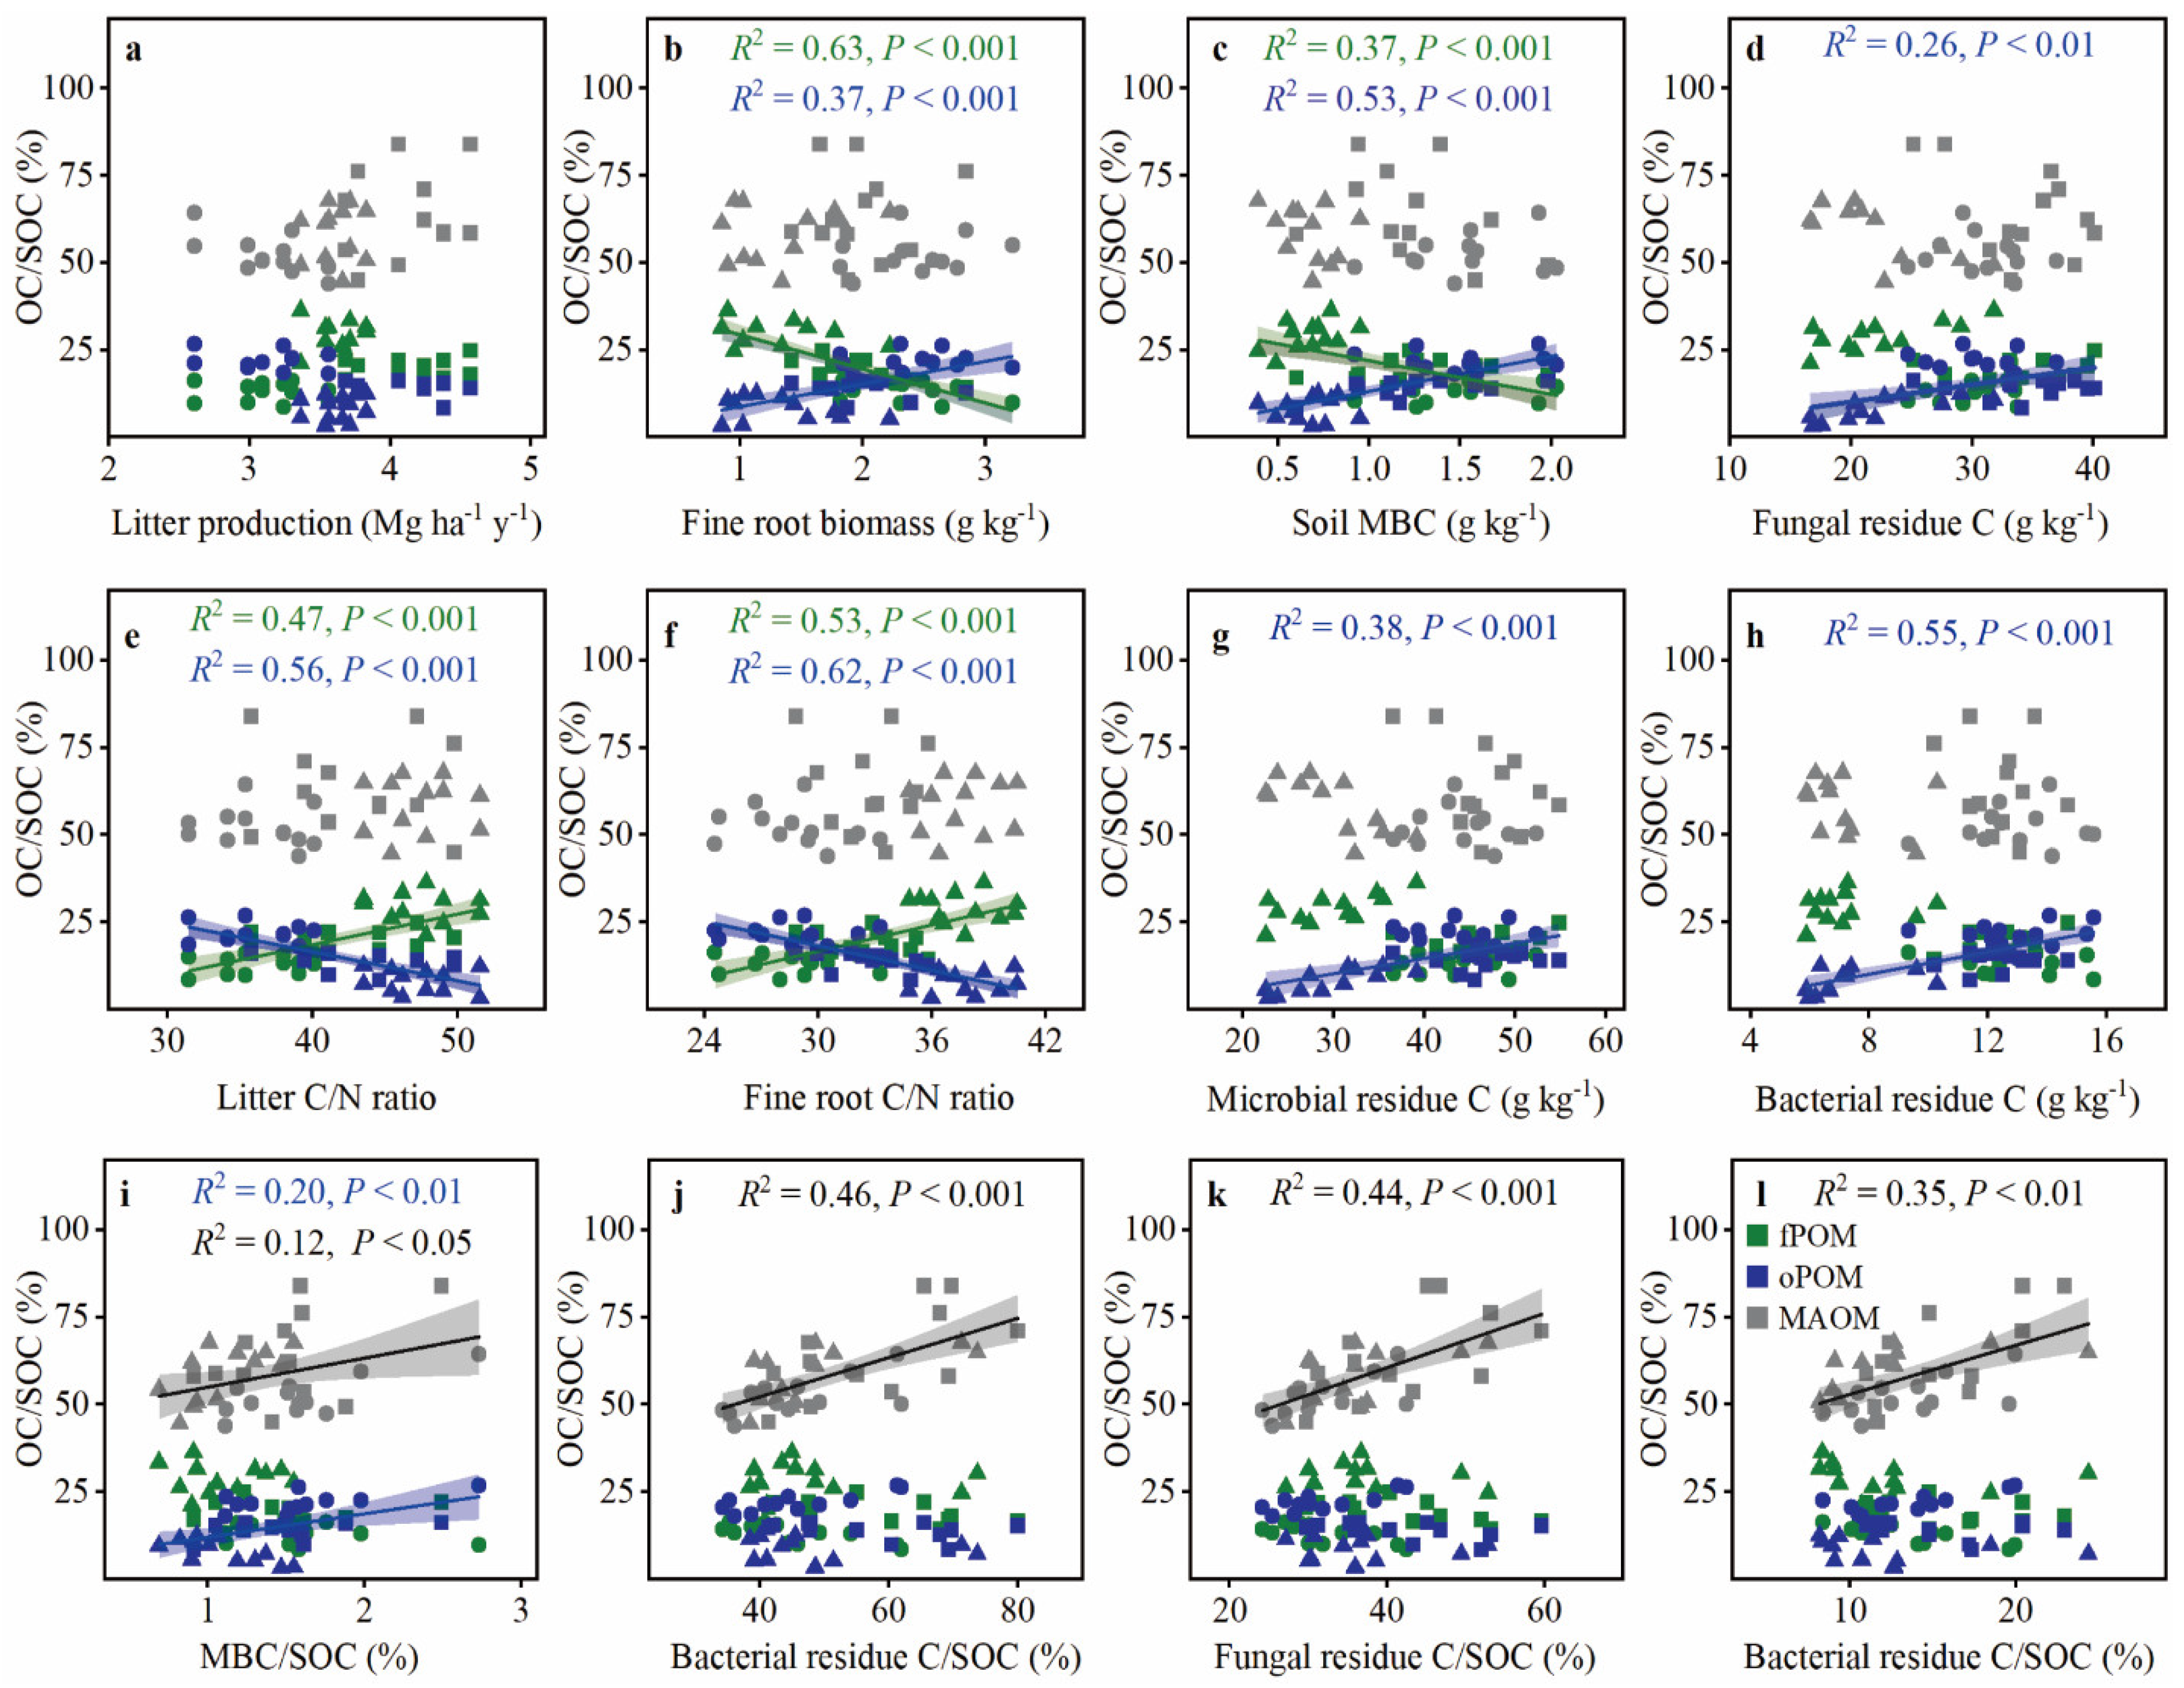
The aggregated-occluded POC and MAOC had positive relationships with fine root biomass, MBC, microbial residue C, and fungal residue C but had negative relationships with litter and fine root C/N ratios (Figure 4b–d,g). There were negative relationships between free POC and fine root biomass, MBC/SOC, and microbial residue C contributions (Figure 4b,i–l). Free POC as a proportion of SOC decreased with fine root biomass and the MBC/SOC ratio but increased with litter and fine root C/N ratios (Figure 5). Aggregate-occluded POC as a proportion of SOC increased with fine root biomass, MBC, microbial residue C, fungal residue C, and the MBC/SOC ratio but decreased with litter and fine root C/N ratios (Figure 5). MAOC as a proportion of SOC increased with the ratios of MBC/SOC, microbial residue C/SOC, fungal residue C/SOC, and bacterial residue C/SOC (Figure 5).
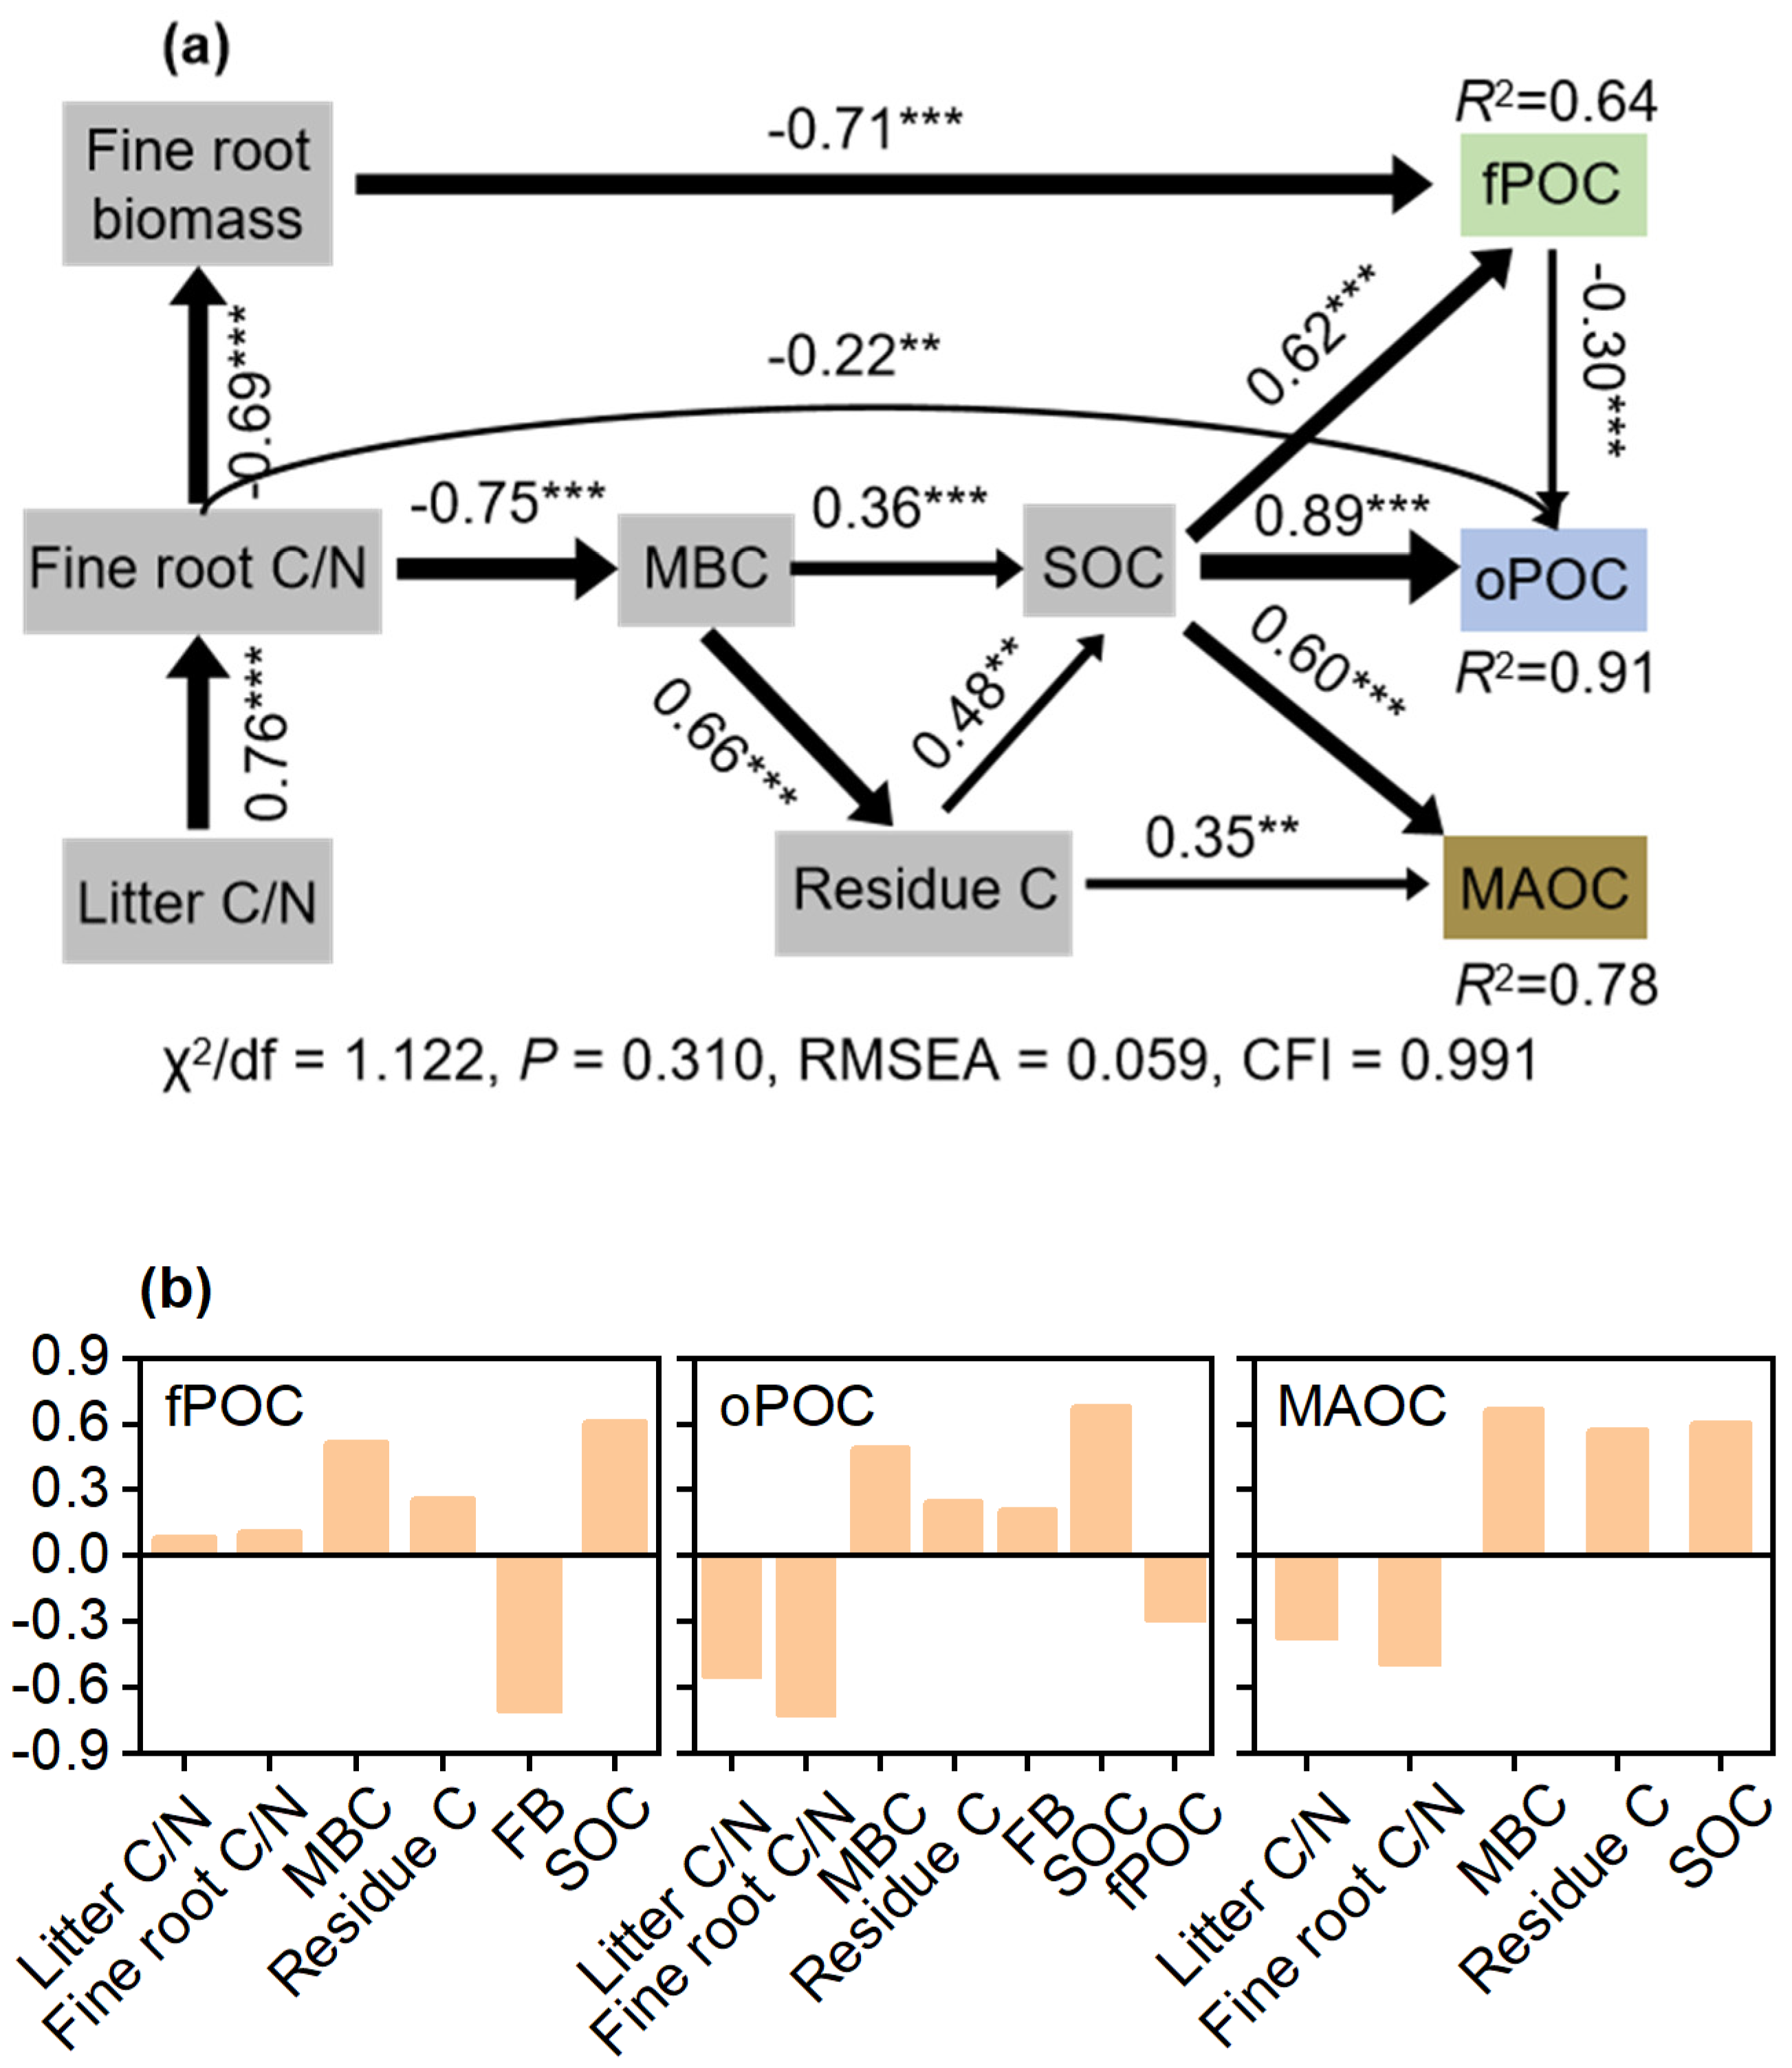
The SEM indicated that litter and fine root C/N ratios had negative impacts on fine root biomass and MBC (Figure 6a). Free POC was negatively and positively affected by fine root biomass and SOC, respectively (Figure 6a). Aggregate-occluded POC was negatively affected by the fine root C/N ratio and free POC, and positively affected by SOC (Figure 6a). MAOC was positively influenced by SOC and microbial residue C (Figure 6a). Fine root biomass, fine root C/N ratio, and MBC were most influential in controlling free POC, aggregate-occluded POC, and MAOC accumulation, respectively (Figure 6b).
Using the litter, fine root, and soil microbial properties analyzed above, changes in the evenness of the POC and MAOC chemical components with forest conversion were evaluated using principal component analysis (PCA, Figure 7). The resultant PCs explained 63.8% of the variance, primarily through PC1, which was driven primarily by litter and fine root C/N ratios, soil MBC, and microbial residue C. The evenness of free and aggregate-occluded POC chemical components was mainly related to litter and fine root C/N ratios, while that of MAOC was associated with microbial properties.

4. Discussion

4.1. Primary Forest Conversion Affects POC and MAOC through Plant Input and Soil Microbial Properties

Changes in SOC components induced by primary forest conversion are largely determined by plant input traits, soil microbial properties, and physicochemical properties [6,42,43]. In this study, free POC decreased and aggregate-occluded POC increased after primary mixed forests conversion to secondary broadleaved forests. In contrast, aggregate-occluded POC and MAOC decreased and free POC increased after primary mixed forest conversion to coniferous plantations (Figure 2). These results were contrary to studies reporting that cPOC, fPOC, and heavy fraction OC decreased after the conversion of natural evergreen broad-leaved forests in the subtropics to secondary mixed broadleaved-coniferous forests and intensively managed plantations [6,44,45]. Compared to subtropical secondary mixed broadleaved-coniferous forests, the secondary broadleaved forests in this study were composed of broadleaved tree species with higher quality plant inputs (i.e., lower C/N ratio of litter and fine roots; Table 1). Higher quality plant inputs can promote the formation of aggregate and mineral-protected SOC [16,24,46].
Secondary broadleaved forest soil contained less free POC than primary mixed forest soil (Figure 2) due to the high quality of plant litter inputs. This is supported by the positive correlation between litter and fine root C/N ratios and free POC (Figure 4 and Figure 5). High-quality plant inputs have high biodegradability [24]. The litter and fine roots in secondary broadleaved forests contain more N and nutrients, which support soil MBC increments [47]. This contributes to the rapid decomposition of plant debris as free POC (Figure 2). In contrast to secondary broadleaved forests, coniferous plantations contain low N content in litter and fine roots (Table 1) and provide low-quality substrate inputs resistant to microbial decay [48], facilitating the accumulation of free POC unprotected in soil (Figure 2). SEM results showed that fine root biomass was most influential in controlling free POC, negatively affecting its accumulation (Figure 6), supporting the idea that belowground inputs facilitate stable soil C formation [20].
The inputs of high-quality plant substrates can increase microbial substrate use efficiency and the retention of plant-derived C belowground [18,24,47]. Aggregate-occluded POC and MAOC were higher in the primary mixed forests and secondary broadleaved forests than in the coniferous plantations (Figure 2), suggesting that high-quality plant inputs are beneficial to stable SOC accumulation. We found that the MBC/SOC ratio was higher in the primary mixed forests and secondary broadleaved forests than in the coniferous plantations, implying higher microbial abilities to assimilate C [35]. Soil microorganisms assimilate easily decomposable plant-derived C into microbial-derived C, such as metabolites and necromass, which are important precursors for the formation of stable SOC [12]. Microbial-derived C is estimated as the ratio of residue C to SOC [47]. In this study, the ratio of microbial residue C/SOC was higher than 30%, and fungal residue C was responsible for over 70% of the total microbial residue C (Figure 1 and Figure S2). This demonstrated that microbial assimilation, especially fungal assimilation, is the dominant decomposition process. Long-term microbial assimilation leads to the continuous accumulation of microbial residues and metabolites in the soil, which can be stabilized through encapsulation by aggregation and interactions with soil minerals [12,18,46]. The SEM results also confirmed that litter and fine root quality altered the accumulation of MAOC through soil microbial C assimilation and residue accumulation (Figure 6). Therefore, from the perspective of long-term C sequestration, it is necessary to introduce broadleaved tree species that benefit OC sequestration in aggregates and minerals to coniferous plantations after primary forest conversion.

4.2. Changed Chemical Component Evenness of POC but Not MAOC after Primary Forest Conversion

Forest conversion changes OC chemical component evenness mainly via plant residue input and microbial decomposition [26,28]. In this study, primary forest conversion altered the chemical component evenness of free and aggregate-occluded POC (Figure 3), mainly due to variation in litter and fine root quality (Figure 7). Free and aggregate-occluded POC are mostly composed of partially undecomposed plant materials such as litter and fine root residues [9,49,50]. Therefore, the alteration of POC chemical components after tree species conversion could be linked to the characteristics of chemical compositions in litter and fine root residues [28]. High-quality broadleaved residues contained more carbohydrates and cellulose (i.e., compounds containing O-alkyl C) than coniferous residues [51], resulting in higher O-alkyl C and lower aromatic C of free and aggregate-occluded POC in secondary forest soils (Table 2). Such changes in O-alkyl C and aromatic C led to a reduction in the evenness of the chemical components of free POC and aggregate-occluded POC in secondary forests (Figure 3).
The evenness of MAOC chemical components did not change with primary mixed forest conversion (Figure 3), showing its resistance to disturbance. MAOC is formed by the interaction of microbial products and low-molecular-weight molecules with soil minerals, which is mainly driven by microbial assimilation and residue accumulation [10,12]. In this study, MAOC chemical component evenness was mainly related to MBC and microbial residues (Figure 7). Mineral adsorption and microbial decomposition selectively remove or protect specific molecules, resulting in MAOC chemical component evenness that is higher than that of free or aggregate-occluded POC (Figure 3). This result supports the ‘chemical convergence hypothesis’, which claims that initial differences in plant residue chemistry are expected to converge over the course of decomposition [52,53,54]. In a 9-year residue decomposition study, plant residue composition converged on an array of common compounds when microbial assimilation became dominant [55]. Thus, microbial-controlled MAOC chemical composition stability during forest conversion contributes to long-term SOC sequestration under disturbances.

5. Conclusions

We studied free POC, aggregate-occluded POC, MAOC, and their evenness of chemical components after primary mixed broadleaved Korean pine forests conversion to secondary broadleaved forests and coniferous plantations in Heilongjiang, Northeast China. The results showed that the conversion of primary forests decreased free POC but increased aggregate-occluded POC in secondary forests and increased free POC but decreased aggregate-occluded POC and MAOC in plantations. Increasing litter and fine root quality, MBC, and microbial residue C positively affected aggregate-occluded POC and MAOC, whereas increasing fine root biomass negatively affected free POC. Furthermore, increased litter and fine root quality lowered the evenness of the chemical components of free and aggregate-occluded POC, with high O-alkyl C and low aromatic C in secondary forests. Despite plant inputs and microbial properties changing, the chemical component evenness of MAOC is still high and unchanged following primary forest conversion. This study improved our understanding of soil C dynamics mechanisms resulting from primary forest conversion. Future forest management should consider tree species with high-quality input as a possible compensation for climate change by sequestering more OC in soil aggregates.

Supplementary Materials

The following supporting information can be downloaded at: https://www.mdpi.com/article/10.3390/f14061234/s1, Figure S1: Representative 13C NMR spectra of the HF–treated free POC, aggregate–occluded POC and MAOC in the 0–5 cm and 5–15 cm soil layers under three forest types. K, primary mixed broadleaf-Korean pine forest; S, secondary broadleaved forest; P, coniferous plantation.; Figure S2: Fungal residue C (a) and bacterial residue C (b) as a proportion of microbial residue C in the 0–5 cm and 5–15 cm soil layers under the three forest types.

Author Contributions

Conceptualization, F.G., X.C. and Y.S.; Methodology, F.G., X.C., M.C. and Y.S.; Validation, X.C.; Formal analysis, F.G., M.C. and Y.S.; Investigation, M.C. and Y.S.; Writing—original draft, F.G.; Writing—review & editing, F.G., X.C., M.C. and Y.S.; Supervision, X.C.; Project administration, X.C.; Funding acquisition, F.G. and X.C.. All authors have read and agreed to the published version of the manuscript.

Funding

This research was funded by National Natural Science Foundation of China, grant number 32101502.

Data Availability Statement

Not applicable.

Acknowledgments

We thank Wei Lin and Xingping Liu for field and laboratory assistance and Zijiang Jiang for solid-state 13C NMR measurements.

Conflicts of Interest

The authors declare no conflict of interest.

References

  1. Zhou, G.; Liu, S.; Li, Z.; Zhang, D.; Tang, X.; Zhou, C.; Yan, J.; Mo, J. Old-growth forests can accumulate carbon in soils. Science 2006, 314, 1417. [Google Scholar] [CrossRef] [PubMed] [Green Version]
  2. Pan, Y.; Birdsey, R.A.; Fang, J.; Houghton, R.; Kauppi, P.E.; Kurz, W.A.; Phillips, O.L.; Shvidenko, A.; Lewis, S.L.; Canadell, J.G.; et al. A large and persistent carbon sink in the world’s forests. Science 2011, 333, 988–993. [Google Scholar] [CrossRef] [PubMed] [Green Version]
  3. Gibson, L.; Lee, T.M.; Koh, L.P.; Brook, B.W.; Gardner, T.A.; Barlow, J.; Peres, C.A.; Bradshaw, C.J.; Laurance, W.F.; Lovejoy, T.E.; et al. Primary forests are irreplaceable for sustaining tropical biodiversity. Nature 2011, 478, 378–381. [Google Scholar] [CrossRef] [PubMed]
  4. Han, M.; Zhu, B. Changes in soil greenhouse gas fluxes by land use change from primary forest. Glob. Change Biol. 2020, 26, 2656–2667. [Google Scholar] [CrossRef] [PubMed] [Green Version]
  5. Li, T.; Cheng, H.; Li, Y.; Mou, Z.; Zhu, X.; Wu, W.; Zhang, J.; Kuang, L.; Wang, J.; Hui, D.; et al. Divergent accumulation of amino sugars and lignins mediated by soil functional carbon pools under tropical forest conversion. Sci. Total Environ. 2023, 881, 163204. [Google Scholar] [CrossRef]
  6. Luo, X.; Hou, E.; Chen, J.; Li, J.; Zhang, L.; Zang, X.; Wen, D. Dynamics of carbon, nitrogen, and phosphorus stocks and stoichiometry resulting from conversion of primary broadleaf forest to plantation and secondary forest in subtropical China. Catena 2020, 193, 104606. [Google Scholar] [CrossRef]
  7. Lin, Z.; Li, Y.; Tang, C.; Luo, Y.; Fu, W.; Cai, X.; Li, Y.; Yue, T.; Jiang, P.; Hu, S.; et al. Converting natural evergreen broadleaf forests to intensively managed moso bamboo plantations affects the pool size and stability of soil organic carbon and enzyme activities. Biol. Fertil. Soils 2018, 54, 467–480. [Google Scholar] [CrossRef]
  8. Ghorbani, M.; Amirahmadi, E.; Konvalina, P.; Moudrý, J.; Kopecký, M.; Hoang, T.N. Carbon Pool Dynamic and Soil Microbial Respiration Affected by Land Use Alteration: A Case Study in Humid Subtropical Area. Land 2023, 12, 459. [Google Scholar] [CrossRef]
  9. Lavallee, J.M.; Soong, J.L.; Cotrufo, M.F. Conceptualizing soil organic matter into particulate and mineral-associated forms to address global change in the 21st century. Glob. Change Biol. 2020, 26, 261–273. [Google Scholar] [CrossRef] [Green Version]
  10. Cotrufo, M.F.; Soong, J.L.; Horton, A.J.; Campbell, E.E.; Haddix, M.L.; Wall, D.H.; Parton, W.J. Formation of soil organic matter via biochemical and physical pathways of litter mass loss. Nat. Geosci. 2015, 8, 776–779. [Google Scholar] [CrossRef]
  11. Lehmann, J.; Kleber, M. The contentious nature of soil organic matter. Nature 2015, 528, 60–68. [Google Scholar] [CrossRef]
  12. Liang, C.; Schimel, J.P.; Jastrow, J.D. The importance of anabolism in microbial control over soil carbon storage. Nat. Microbiol. 2017, 2, 17105. [Google Scholar] [CrossRef] [PubMed]
  13. Rui, Y.; Jackson, R.D.; Cotrufo, M.F.; Sanford, G.R.; Spiesman, B.J.; Deiss, L.; Culman, S.W.; Liang, C.; Ruark, M.D. Reply to Lajtha and Silva: Agriculture and soil carbon persistence of grassland-derived Mollisols. Proc. Natl. Acad. Sci. USA 2022, 119, e2204142119. [Google Scholar] [CrossRef]
  14. Zhang, F.; Chen, X.; Yao, S.; Ye, Y.; Zhang, B. Responses of soil mineral-associated and particulate organic carbon to carbon input: A meta-analysis. Sci. Total Environ. 2022, 829, 154626. [Google Scholar] [CrossRef] [PubMed]
  15. Bossuyt, H.; Six, J.; Hendrix, P.F. Protection of soil carbon by microaggregates within earthworm casts. Soil Biol. Biochem. 2005, 37, 251–258. [Google Scholar] [CrossRef]
  16. Angst, Š.; Mueller, C.W.; Cajthaml, T.; Angst, G.; Lhotáková, Z.; Bartuška, M.; Špaldoňová, A.; Frouz, J. Stabilization of soil organic matter by earthworms is connected with physical protection rather than with chemical changes of organic matter. Geoderma 2017, 289, 29–35. [Google Scholar] [CrossRef]
  17. Six, J.; Bossuyt, H.; Degryze, S.; Denef, K. A history of research on the link between (micro)aggregates, soil biota, and soil organic matter dynamics. Soil Tillage Res. 2004, 79, 7–31. [Google Scholar] [CrossRef]
  18. Cotrufo, M.F.; Wallenstein, M.D.; Boot, C.M.; Denef, K.; Paul, E. The Microbial Efficiency-Matrix Stabilization (MEMS) framework integrates plant litter decomposition with soil organic matter stabilization: Do labile plant inputs form stable soil organic matter? Glob. Change Biol. 2013, 19, 988–995. [Google Scholar] [CrossRef] [Green Version]
  19. Ridgeway, J.R.; Morrissey, E.M.; Brzostek, E.R. Plant litter traits control microbial decomposition and drive soil carbon stabilization. Soil Biol. Biochem. 2022, 175, 108857. [Google Scholar] [CrossRef]
  20. Sokol, N.W.; Bradford, M.A. Microbial formation of stable soil carbon is more efficient from belowground than aboveground input. Nat. Geosci. 2019, 12, 46–53. [Google Scholar] [CrossRef]
  21. Six, J.; Elliott, E.T.; Paustian, K. Soil macroaggregate turnover and microaggregate formation:A mechanism for C sequestration under no-tillage agricuture. Soil Biol. Biochem. 2000, 32, 2099–2103. [Google Scholar] [CrossRef]
  22. Sokol, N.W.; Sanderman, J.; Bradford, M.A. Pathways of mineral-associated soil organic matter formation: Integrating the role of plant carbon source, chemistry, and point of entry. Glob. Change Biol. 2019, 25, 12–24. [Google Scholar] [CrossRef] [PubMed] [Green Version]
  23. Zhang, Y.; Tang, Z.; You, Y.; Guo, X.; Wu, C.; Liu, S.; Sun, O.J. Differential effects of forest-floor litter and roots on soil organic carbon formation in a temperate oak forest. Soil Biol. Biochem. 2023, 180, 109017. [Google Scholar] [CrossRef]
  24. Gao, F.; Cui, X.; Sang, Y.; Song, J. Changes in soil organic carbon and total nitrogen as affected by primary forest conversion. For. Ecol. Manag. 2020, 463, 118013. [Google Scholar] [CrossRef]
  25. Lehmann, J.; Hansel, C.M.; Kaiser, C.; Kleber, M.; Maher, K.; Manzoni, S.; Nunan, N.; Reichstein, M.; Schimel, J.P.; Torn, M.S.; et al. Persistence of soil organic carbon caused by functional complexity. Nat. Geosci. 2020, 13, 529–534. [Google Scholar] [CrossRef]
  26. Wang, H.; Ding, Y.; Zhang, Y.; Wang, J.; Freedman, Z.B.; Liu, P.; Cong, W.; Wang, J.; Zang, R.; Liu, S. Evenness of soil organic carbon chemical components changes with tree species richness, composition and functional diversity across forests in China. Glob. Change Biol. 2023, 29, 2852–2864. [Google Scholar] [CrossRef] [PubMed]
  27. Kögel-Knabner, I. The macromolecular organic composition of plant and microbial residues as inputs to soil organic matter: Fourteen years on. Soil Biol. Biochem. 2017, 105, A3–A8. [Google Scholar] [CrossRef]
  28. Wang, H.; Liu, S.; Song, Z.; Yang, Y.; Wang, J.; You, Y.; Zhang, X.; Shi, Z.; Nong, Y.; Ming, A.; et al. Introducing nitrogen-fixing tree species and mixing with Pinus massoniana alters and evenly distributes various chemical compositions of soil organic carbon in a planted forest in southern China. For. Ecol. Manag. 2019, 449, 117477. [Google Scholar] [CrossRef]
  29. Lv, J.; Zhang, S.; Wang, S.; Luo, L.; Cao, D.; Christie, P. Molecular-Scale Investigation with ESI-FT-ICR-MS on Fractionation of Dissolved Organic Matter Induced by Adsorption on Iron Oxyhydroxides. Environ. Sci. Technol. 2016, 50, 2328–2336. [Google Scholar] [CrossRef]
  30. Kleber, M.; Bourg, I.C.; Coward, E.K.; Hansel, C.M.; Myneni, S.C.B.; Nunan, N. Dynamic interactions at the mineral–organic matter interface. Nat. Rev. Earth Environ. 2021, 2, 402–421. [Google Scholar] [CrossRef]
  31. Han, M.; Shi, B.; Jin, G. Conversion of primary mixed forest into secondary broadleaved forest and coniferous plantations: Effects on temporal dynamics of soil CO2 efflux. Catena 2018, 162, 157–165. [Google Scholar] [CrossRef]
  32. Shi, B.; Gao, W.; Jin, G. Effects on rhizospheric and heterotrophic respiration of conversion from primary forest to secondary forest and plantations in northeast China. Eur. J. Soil Biol. 2015, 66, 11–18. [Google Scholar] [CrossRef]
  33. Gao, L.; Cui, X.; Hill, P.W.; Guo, Y. Uptake of various nitrogen forms by co-existing plant species in temperate and cold-temperate forests in northeast China. Appl. Soil Ecol. 2020, 147, 103398. [Google Scholar] [CrossRef]
  34. Jenkinson, D. Measuring soil microbial biomass. Soil Biol. Biochem. 2004, 36, 5–7. [Google Scholar] [CrossRef]
  35. Sun, T.; Wang, Y.; Hui, D.; Jing, X.; Feng, W. Soil properties rather than climate and ecosystem type control the vertical variations of soil organic carbon, microbial carbon, and microbial quotient. Soil Biol. Biochem. 2020, 148, 107905. [Google Scholar] [CrossRef]
  36. Zhang, X.; Amelung, W. Gas chromatographic determination of muramic acid, glucosamine, mannosamine, and galactosamine in soils. Soil Biol. Biochem. 1996, 28, 1201–1206. [Google Scholar] [CrossRef]
  37. Engelking, B.; Flessa, H.; Joergensen, R.G. Shifts in amino sugar and ergosterol contents after addition of sucrose and cellulose to soil. Soil Biol. Biochem. 2007, 39, 2111–2118. [Google Scholar] [CrossRef]
  38. Deng, F.; Liang, C. Revisiting the quantitative contribution of microbial necromass to soil carbon pool: Stoichiometric control by microbes and soil. Soil Biol. Biochem. 2022, 165, 108486. [Google Scholar] [CrossRef]
  39. Appuhn, A.; Joergensen, R. Microbial colonisation of roots as a function of plant species. Soil Biol. Biochem. 2006, 38, 1040–1051. [Google Scholar] [CrossRef]
  40. Golchin, A.; Oades, J.M.; Skjemstad, J.O.; Clarke, P. Study of free and occluded particulate organic matter in soils by solid state 13C CP/MAS NMR spectroscopy and scanning electron microscopy. Aust. J. Soil Res. 1994, 32, 285–309. [Google Scholar] [CrossRef]
  41. Schmidt, M.W.I.; Knicker, H.; Hatcher, P.G.; Kögel-Knabner, I. Improvement of 13C and 15N CPMAS NMR spectra of bulk soils, particle size fractions and organic material by treatment with 10% hydrofluoric acid. Eur. J. Soil Sci. 1997, 48, 319–328. [Google Scholar] [CrossRef]
  42. Guo, L.B.; Gifford, R.M. Soil carbon stocks and land use change: A meta analysis. Glob. Change Biol. 2002, 8, 345–360. [Google Scholar] [CrossRef]
  43. Feng, J.; He, K.; Zhang, Q.; Han, M.; Zhu, B. Changes in plant inputs alter soil carbon and microbial communities in forest ecosystems. Glob. Change Biol. 2022, 28, 3426–3440. [Google Scholar] [CrossRef] [PubMed]
  44. Wang, H.; Jin, J.; Yu, P.; Fu, W.; Morrison, L.; Lin, H.; Meng, M.; Zhou, X.; Lv, Y.; Wu, J. Converting evergreen broad-leaved forests into tea and Moso bamboo plantations affects labile carbon pools and the chemical composition of soil organic carbon. Sci. Total Environ. 2020, 711, 135225. [Google Scholar] [CrossRef]
  45. Yuan, Z.; Jin, X.; Xiao, W.; Wang, L.; Sun, Y.; Guan, Q.; Meshack, A.O. Comparing soil organic carbon stock and fractions under natural secondary forest and Pinus massoniana plantation in subtropical China. Catena 2022, 212, 106092. [Google Scholar] [CrossRef]
  46. Angst, G.; Mueller, K.E.; Eissenstat, D.M.; Trumbore, S.; Freeman, K.H.; Hobbie, S.E.; Chorover, J.; Oleksyn, J.; Reich, P.B.; Mueller, C.W. Soil organic carbon stability in forests: Distinct effects of tree species identity and traits. Glob. Change Biol. 2019, 25, 1529–1546. [Google Scholar] [CrossRef] [PubMed]
  47. Shao, P.; Liang, C.; Lynch, L.; Xie, H.; Bao, X. Reforestation accelerates soil organic carbon accumulation: Evidence from microbial biomarkers. Soil Biol. Biochem. 2019, 131, 182–190. [Google Scholar] [CrossRef]
  48. Knops, J.M.H.; Naeem, S.; Reich, P.B. The impact of elevated CO2, increased nitrogen availability and biodiversity on plant tissue quality and decomposition. Glob. Change Biol. 2007, 13, 1960–1971. [Google Scholar] [CrossRef]
  49. Cotrufo, M.F.; Haddix, M.L.; Kroeger, M.E.; Stewart, C.E. The role of plant input physical-chemical properties, and microbial and soil chemical diversity on the formation of particulate and mineral-associated organic matter. Soil Biol. Biochem. 2022, 168, 108648. [Google Scholar] [CrossRef]
  50. Miltner, A.; Bombach, P.; Schmidt-Brucken, B.; Kastner, M. SOM genesis: Microbial biomass as a significant source. Biogeochemistry 2012, 111, 15. [Google Scholar] [CrossRef]
  51. Wang, H.; Liu, S.-R.; Mo, J.-M.; Wang, J.-X.; Makeschin, F.; Wolff, M. Soil organic carbon stock and chemical composition in four plantations of indigenous tree species in subtropical China. Ecol. Res. 2010, 25, 1071–1079. [Google Scholar] [CrossRef]
  52. Wickings, K.; Grandy, A.S.; Reed, S.C.; Cleveland, C.C. The origin of litter chemical complexity during decomposition. Ecol. Lett. 2012, 15, 1180–1188. [Google Scholar] [CrossRef] [PubMed]
  53. Grandy, A.S.; Neff, J.C. Molecular C dynamics downstream: The biochemical decomposition sequence and its impact on soil organic matter structure and function. Sci. Total Environ. 2008, 404, 297–307. [Google Scholar] [CrossRef] [PubMed]
  54. Wang, X.; Sun, B.; Mao, J.; Sui, Y.; Cao, X. Structural convergence of maize and wheat straw during two-year decomposition under different climate conditions. Environ. Sci. Technol. 2012, 46, 7159–7165. [Google Scholar] [CrossRef]
  55. Wang, X.; Liang, C.; Mao, J.; Jiang, Y.; Bian, Q.; Liang, Y.; Chen, Y.; Sun, B. Microbial keystone taxa drive succession of plant residue chemistry. ISME J. 2023, 17, 748–757. [Google Scholar] [CrossRef]
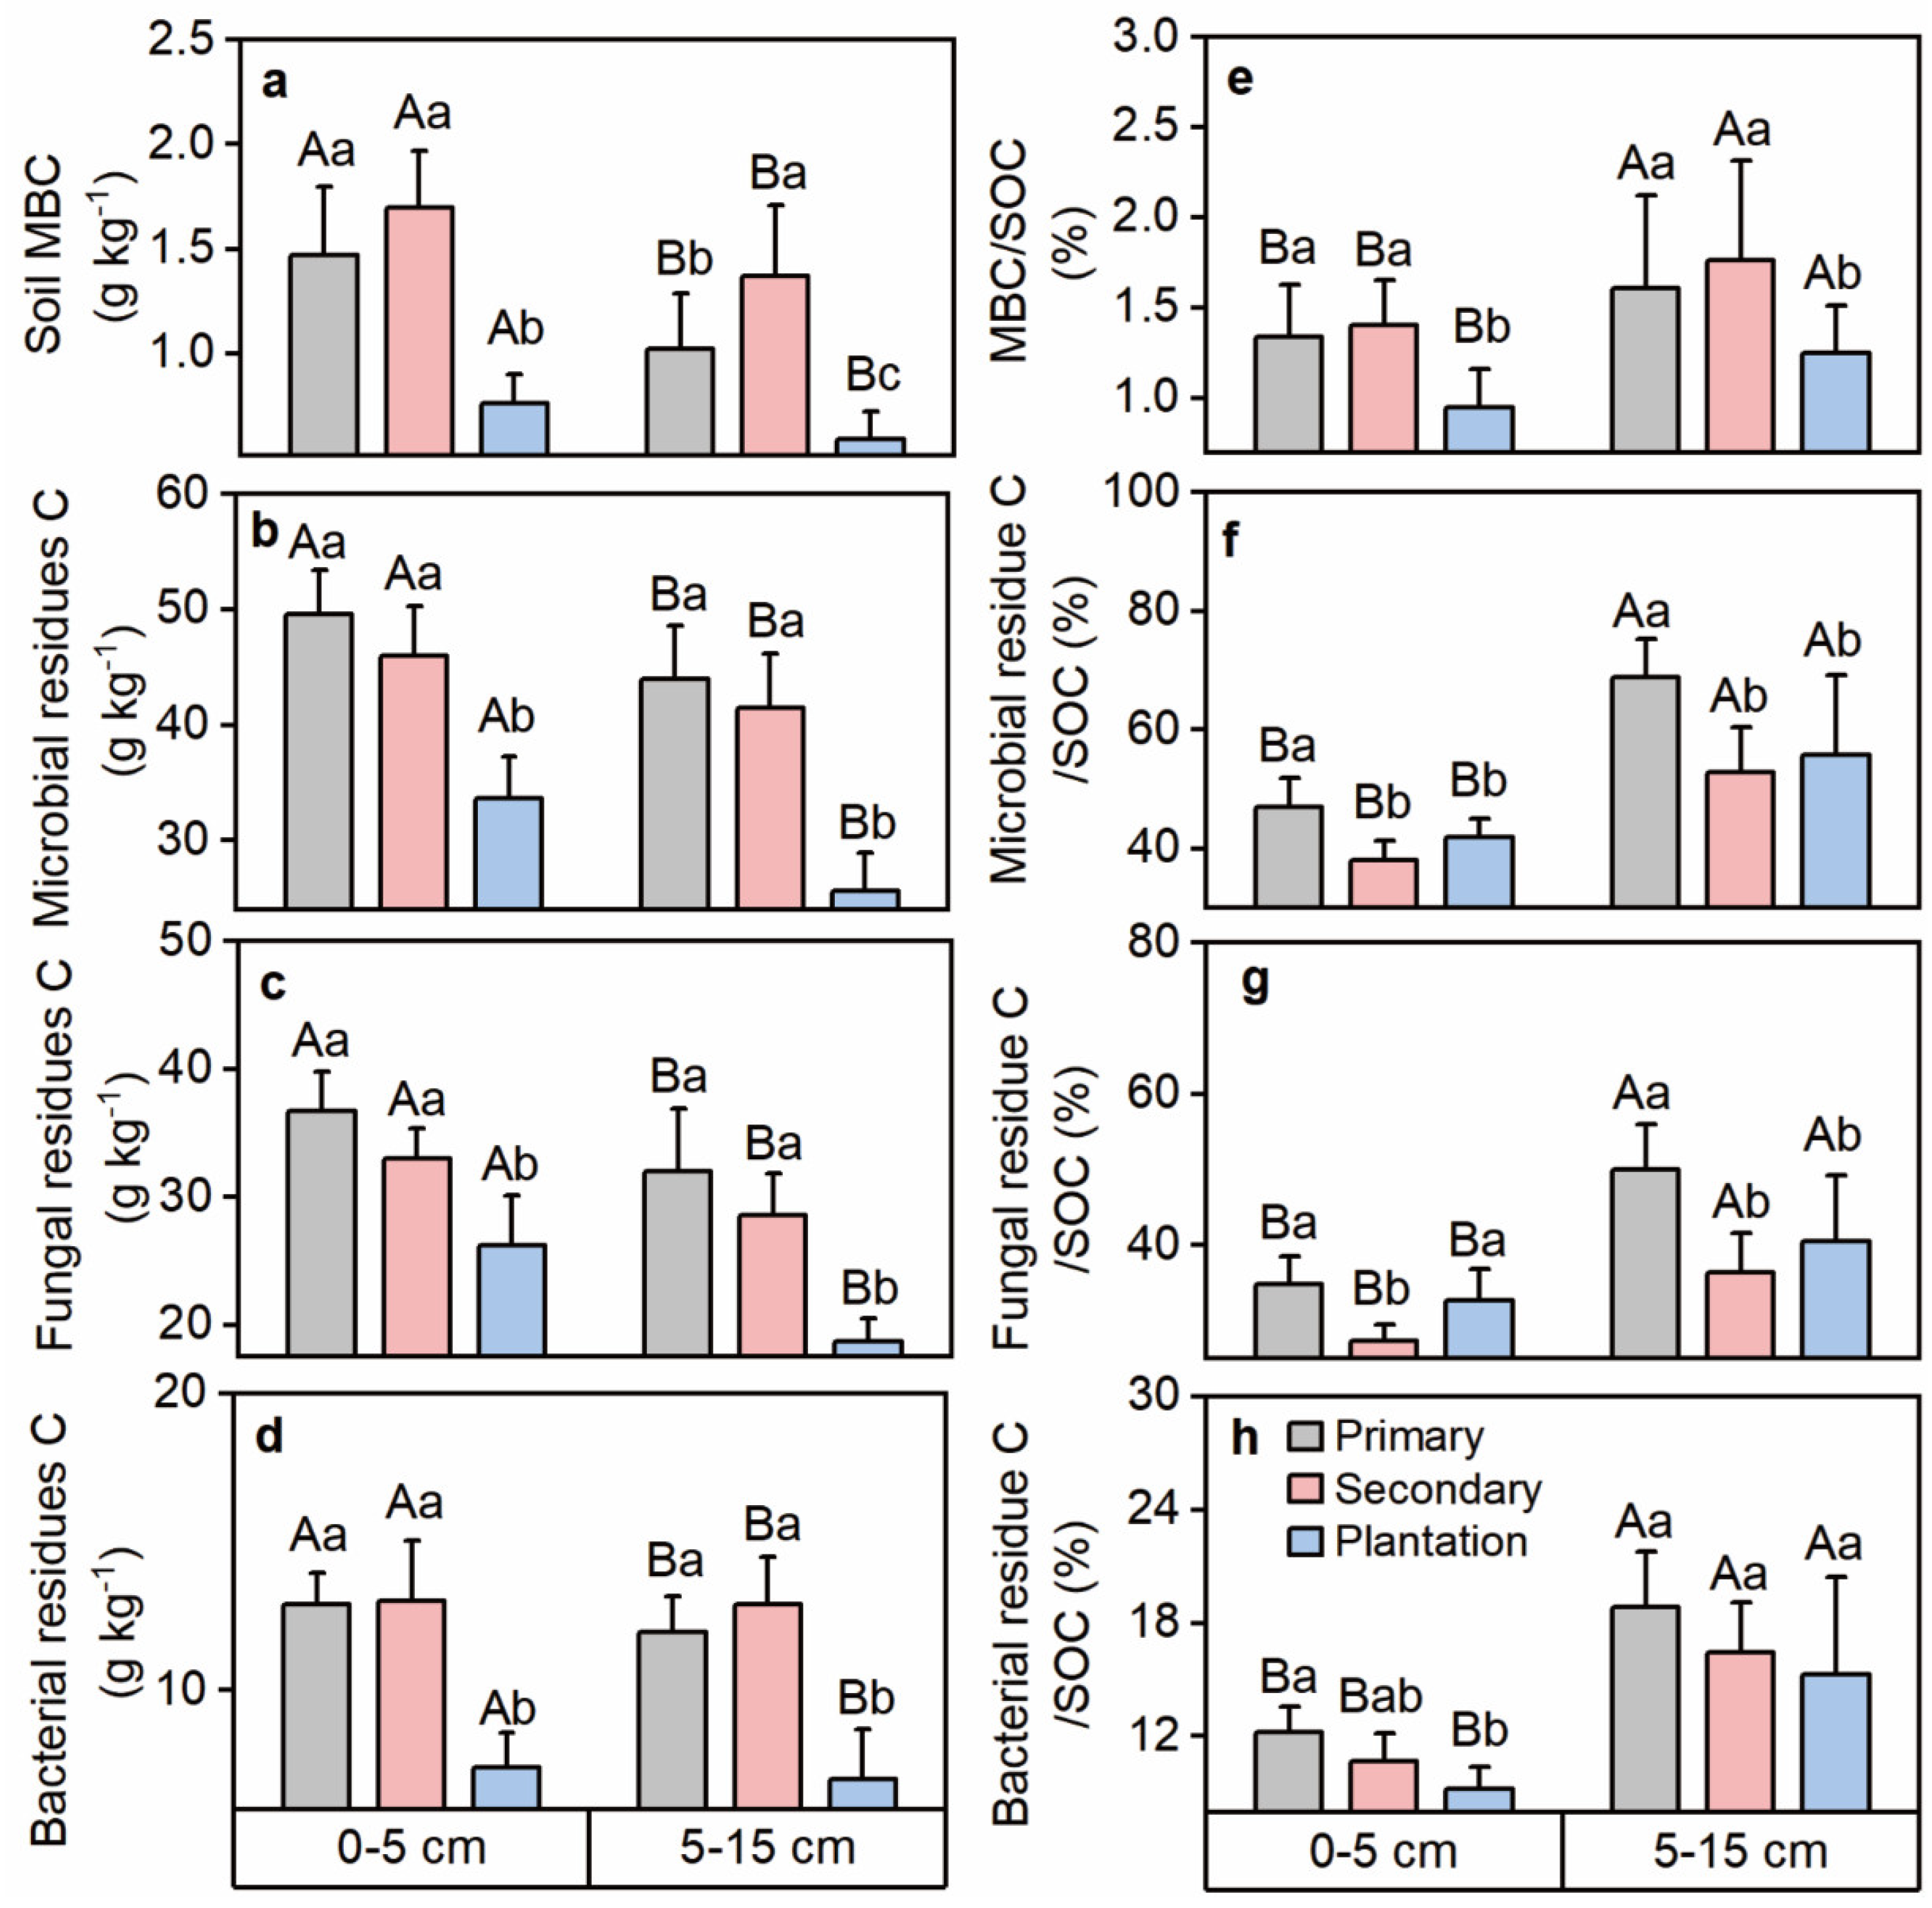
Figure 1. Soil MBC and microbial residue C, including fungal and bacterial residue C (ad), and their contributions to SOC (eh) in the three forest types. Different lowercase letters indicate significance between forest types, and different uppercase letters indicate significance between soil layers at the p < 0.05 level.
Forests 14 01234 g001
Figure 2. Organic C content and proportion to SOC of free POM, aggregate-occluded POM, and MAOM in the 0–5 cm (a,c) and 5–15 cm (b,d) soil layers under the three forest types. Different lowercase letters indicate significance between forest types, and different uppercase letters indicate significance between SOM fractions at the p < 0.05 level.
Forests 14 01234 g002
Figure 3. Evenness of OC chemical components in the 0–5 cm (a) and 5–15 cm (b) soil layers under the three forest types. Different lowercase letters indicate significance between forest types, and different uppercase letters indicate significance between SOM fractions at the p < 0.05 level.
Forests 14 01234 g003
Figure 4. Linear relationships between the OC content of SOM fractions and litter and fine root quantity and quality, soil MBC and microbial residue C, and contributions to SOC (al). Squares indicate primary forests, circles indicate secondary broadleaved forests, and triangles indicate coniferous plantations. The shaded areas represent the 95% confidence intervals for the regression line.
Forests 14 01234 g004
Figure 5. Linear relationships between OC proportion of SOM fractions and litter and fine root quantity and quality, soil MBC and microbial residue C, and contributions to SOC (al). Squares indicate primary forests, circles indicate secondary broadleaved forests, and triangles indicate coniferous plantations. The shaded areas represent the 95% confidence intervals for the regression line.
Forests 14 01234 g005
Figure 6. Direct and indirect associations among litter C/N ratio, fine root biomass and C/N ratio, MBC, microbial residue C, SOC, free POC, aggregate-occluded POC, and MAOC (a). Black arrows indicate significant relationships, and numbers beside arrows are significant standardized path coefficients that are proportional to the arrow width. R2 values associated with response variables indicate the proportion of variation explained by relationships with other variables. The total standardized effects of each factor on free POC, aggregate-occluded POC, and MAOC calculated by SEM are displayed (b).** p < 0.01; *** p < 0.001.
Forests 14 01234 g006
Figure 7. Principal component analysis (PCA) of plant properties, soil microbial properties, and chemical component evenness of SOC fractions in primary mixed forests, secondary broadleaved forests, and coniferous plantations. Numbers in parentheses represent data variations explained by the first two principal components (PCs). LP, litter production; FB, fine root biomass; MR, microbial residue C; FR, fungal residue C; BR, bacterial residue C; fPOC, free POC chemical component evenness; oPOC, aggregate−occluded POC chemical component evenness; MAOC, MAOC chemical component evenness.
Forests 14 01234 g007
Table 1. Stand characteristics and soil properties of the primary mixed broadleaved-Korean pine forest, secondary broadleaved forest, and coniferous plantation.
Forest TypePrimarySecondaryPlantation
Dominant tree species60%–75% Pinus koraiensis, 25%–40% Tilia amurensis, Acer ukurunduense, Abies nephrolepis, and others.60%–65% Betula latyphylla, 35%–40% Betula costata, Populus davidiana, Ulmus laciniata and others.100% Larix gmelinii.
Stand age
(year)
>200~65~65
Density
(Trees ha−1)
1512 ± 537 b2157 ± 586 a1521 ± 102 b
BA
(m2 ha−1)
30.1 ± 3.0 a29.4 ± 2.2 a30.7 ± 1.5 a
Mean DBH
(cm)
16.5 ± 1.5 a15.0 ± 2.1 a15.9 ± 0.8 a
Litter production (Mg ha−1 y−1)4.1 ± 0.1 a3.1 ± 0.1 b2.6 ± 0.07 c
Litter C/N42.9 ± 4.2 b36.4 ± 2.4 c47.2 ± 5.8 a
0–5 cm soil depth
Fine root biomass (Mg ha−1)1.8 ± 0.2 b2.3 ± 0.1 a1.2 ± 0.1 c
Fine root C/N 32.7 ± 6.3 b28.7 ± 8.2 c37.1 ± 7.4 a
Soil pH5.4 ± 0.3 a5.7 ± 0.4 a5.1 ± 0.3 a
Water content (%)78.2 ± 4.3 a75.4 ± 3.9 a72.1 ± 6.1 a
SOC (g kg−1)105.9 ± 4.6 b121.3 ± 8.3 a80.1 ± 7.4 c
TN (g kg−1)8.1 ± 1.1 b10.3 ± 0.3 a5.8 ± 0.5 c
Soil C/N ratio13.1 ± 1.8 a11.8 ± 1.7 b13.8 ± 1.1 a
5–15 cm soil depth
Fine root biomass (Mg ha−1)2.1 ± 0.2 b2.6 ± 0.1 c1.4 ± 0.1 a
Fine root C/N32.6 ± 4.2 b28.6 ± 3.4 c38.1 ± 4.3 a
Soil pH5.5 ± 0.6 a5.8 ± 0.3 a5.4 ± 0.4 a
Water content (%)58.6 ± 9.1 a52.6 ± 4.8 a53.6 ± 5.1 a
SOC (g kg−1)63.9 ± 2.4 b78.9 ± 2.7 a47.1 ± 4.1 c
TN (g kg−1)5.0 ± 0.6 b6.8 ± 0.6 a3.6 ± 0.3 a
Soil C/N ratio12.8 ± 1.9 a11.6 ± 1.1 b13.2 ± 1.7 a
DBH: diameter at breast height (1.3 m). BA: basal area. Mean ± SD (n = 6). Different lowercase letters in a row indicate significance between forest types at the p < 0.05 level.
Table 2. Relative abundance of OC functional groups determined directly from solid-state 13C CPMAS NMR peak areas.
Alkyl CO-Alkyl CAromatic CCarboxyl C
0–5 cmfPOCPrimary17.99 ± 1.50 ab40.07 ± 2.59 b30.44 ± 2.33 b11.49 ± 1.43 a
Secondary16.31 ± 1.30 b46.31 ± 1.18 a26.51 ± 1.28 c10.88 ± 1.59 a
Plantations18.41 ± 1.16 a36.43 ± 1.39 c34.46 ± 1.25 a10.70 ± 2.25 a
oPOCPrimary17.12 ± 0.45 a38.71 ± 1.70 b31.99 ± 1.98 a12.19 ± 2.77 a
Secondary16.11 ± 0.79 a45.69 ± 1.59 a26.19 ± 0.54 b12.01 ± 0.70 a
Plantation17.61 ± 0.86 a34.38 ± 1.93 c34.42 ± 1.73 a13.60 ± 3.23 a
MAOCPrimary24.87 ± 1.57 a36.57 ± 1.57 a22.86 ± 1.16 a15.71 ± 2.56 a
Secondary23.61 ± 1.42 a34.66 ± 1.25 a25.00 ± 1.64 a16.73 ± 2.86 a
Plantation25.49 ± 1.11 a35.22 ± 1.51 a23.91 ± 1.02 a15.39 ± 3.44 a
5–15 cmfPOCPrimary20.41 ± 1.12 ab38.20 ± 1.88 b30.20 ± 1.20 b11.19 ± 2.19 a
Secondary17.60 ± 1.94 b42.20 ± 1.43 a28.30 ± 1.87 c11.90 ± 1.65 a
Plantations21.20 ± 1.96 a32.00 ± 1.22 c34.70 ± 1.80 a12.10 ± 1.99 a
oPOCPrimary18.70 ± 1.74 a36.70 ± 1.49 b32.60 ± 2.43 ab12.00 ± 1.27 a
Secondary16.50 ± 0.50 b41.70 ± 1.37 a30.50 ± 1.45 b11.31 ± 1.59 a
Plantation19.30 ± 0.79 a33.30 ± 2.09 c34.80 ± 1.32 a12.61 ± 2.57 a
MAOCPrimary26.50 ± 1.09 a35.50 ± 1.19 a24.10 ± 1.47 a13.90 ± 1.49 a
Secondary24.78 ± 1.26 a36.10 ± 1.31 a24.60 ± 1.40 a14.52 ± 1.47 a
Plantation25.51 ± 1.31 a36.59 ± 1.11 a25.54 ± 1.84 a12.36 ± 1.02 a
Values = mean ± SD (n = 6); different lowercase letters indicate significant differences between forest types at p < 0.05.
Disclaimer/Publisher’s Note: The statements, opinions and data contained in all publications are solely those of the individual author(s) and contributor(s) and not of MDPI and/or the editor(s). MDPI and/or the editor(s) disclaim responsibility for any injury to people or property resulting from any ideas, methods, instructions or products referred to in the content.