Article

Spatial–Temporal Variations and the Driving Factors of Vegetation Coverage in the Loess Hilly and Gully Region of China

1
School of Water and Environment, Chang’an University, Xi’an 710054, China
2
Key Laboratory of Subsurface Hydrology and Ecological Effects in Arid Region, Ministry of Education, Chang’an University, Xi’an 710054, China
3
College of Water Resources and Architectural Engineering, Northwest A&F University, Xianyang 712100, China
4
Department of Earth and Environmental Sciences, California State University, Fresno, CA 93740, USA
*
Author to whom correspondence should be addressed.
Forests 2023, 14(6), 1238; https://doi.org/10.3390/f14061238
Submission received: 9 April 2023 / Revised: 2 June 2023 / Accepted: 13 June 2023 / Published: 15 June 2023

Abstract

:
To determine the spatial–temporal variations and the factors leading to vegetation recovery in the loess hilly and gully region of China, this study analyzed a two-decade trend in the variation of vegetation cover based on normalized difference vegetation index (NDVI) data from 1998 to 2019 using the Sen + MK test and Hurst index and determined the driving factors using the Geodetector model. The vegetation index in the area was high in the southeast and low in the northwest, with an overall increasing rate of 0.0108/year. The areas with significant improvement in vegetation cover accounted for 95.14%, and the areas with persistent change accounted for 37.36%. Annual precipitation is the most crucial factor driving the NDVI change, and potential evapotranspiration, relative humidity, elevation, land use type, and vegetation type can also explain local variations. The effect of compound factors is significantly greater than that of a single factor. The most effective factors are annual precipitation, potential evapotranspiration, relative humidity and elevation, which varied between 559.4–698.6 mm, 530.6–744.6 mm, 59%–62%, and 2006–2717 m, respectively. The land use, vegetation, and soil types suitable for healthy vegetation growth are forest, coniferous forest, and eluvial soil.

1. Introduction

Vegetation in general is closely linked to soil, air, water, and human activity and is critical to ecological balance [1,2,3]. The NDVI reflects a quantitative relationship between leaf area index and effective photosynthetic energy. Thus, it is regularly used in ecosystem monitoring research in vegetation cover [4,5,6], desertification, and other fields [7,8,9].
For quantitative analyses, the Geodetector model has been used to determine the spatial variability of factors affecting vegetation cover and the interactions among factors to find the driving factors for vegetation change [10]. For example, the driving forces of vegetation change in the Three-River Headwater Region were quantified using Geodetector, which showed that climatic factors had been the foremost drivers, with annual precipitation having the greatest influence [11]. Geodetector was used to analyze the driving mechanisms of vegetation cover changes in the Wumeng mountainous region, showing that temperature and soil texture were the primary drivers due to spatial differentiation [12]. As for the vegetation dynamic and its drivers in the Yellow River Valley, precipitation was more important than temperature [13]. In addition, the responses of NDVI to land use, soil texture, and mean annual precipitation in the Heihe River Basin were shown to be non-linear by applying the Geodetector method [10].
The Loess Plateau of China is surrounded by the Gobi Desert in the north, the Naga Hills in the south, the Plateau of Tibet in the west, and the Taihang Mountains in the east (Figure 1). The Yellow River runs down the Tibet Plateau and meanders across the Loess Plateau, passing through the loess soil for half of its length, and eventually flows back eastward toward the ocean. This region is a natural transitional zone in terms of terrain, climate, vegetation, and agricultural activities. However, the ecology is fragile owing to frequent natural disasters, such as soil erosion and dust storm attacks [14]. Especially in the hilly and gully region on the central east quarter of the Loess Plateau, soil erosion and land degradation restrict local economic development and ecological health [15].
The vegetation cover in most parts of the Loess Plateau is increasing, and the spatial variation in soil moisture is positively correlated with vegetation cover [16]. Vegetation cover has improved significantly in the central, southwestern, and northeastern parts of the Loess Plateau and deteriorated significantly in the southeastern and northern parts, with precipitation, vegetational form, soil texture, temperature, and land use being the main drivers of change [17]. However, most studies have considered the Loess Plateau as a whole, an approach that does not accurately reflect the local variation in such a large area. For example, the conditions in the loess hilly and gully region are very different from the rest of the area in terms of soil erosion potential and vegetation type. In addition, systematic studies on climatic, non-climatic, and anthropogenic factors that affect vegetation cover are lacking.
This study aims to (a) analyze the spatial–temporal variations of the loess hilly and gully region based on NDVI data from 1998 to 2019; (b) study the past and future trends of vegetation cover; and (c) inquire into the driving forces of vegetation change using the Geodetector model.

2. Materials and Methods
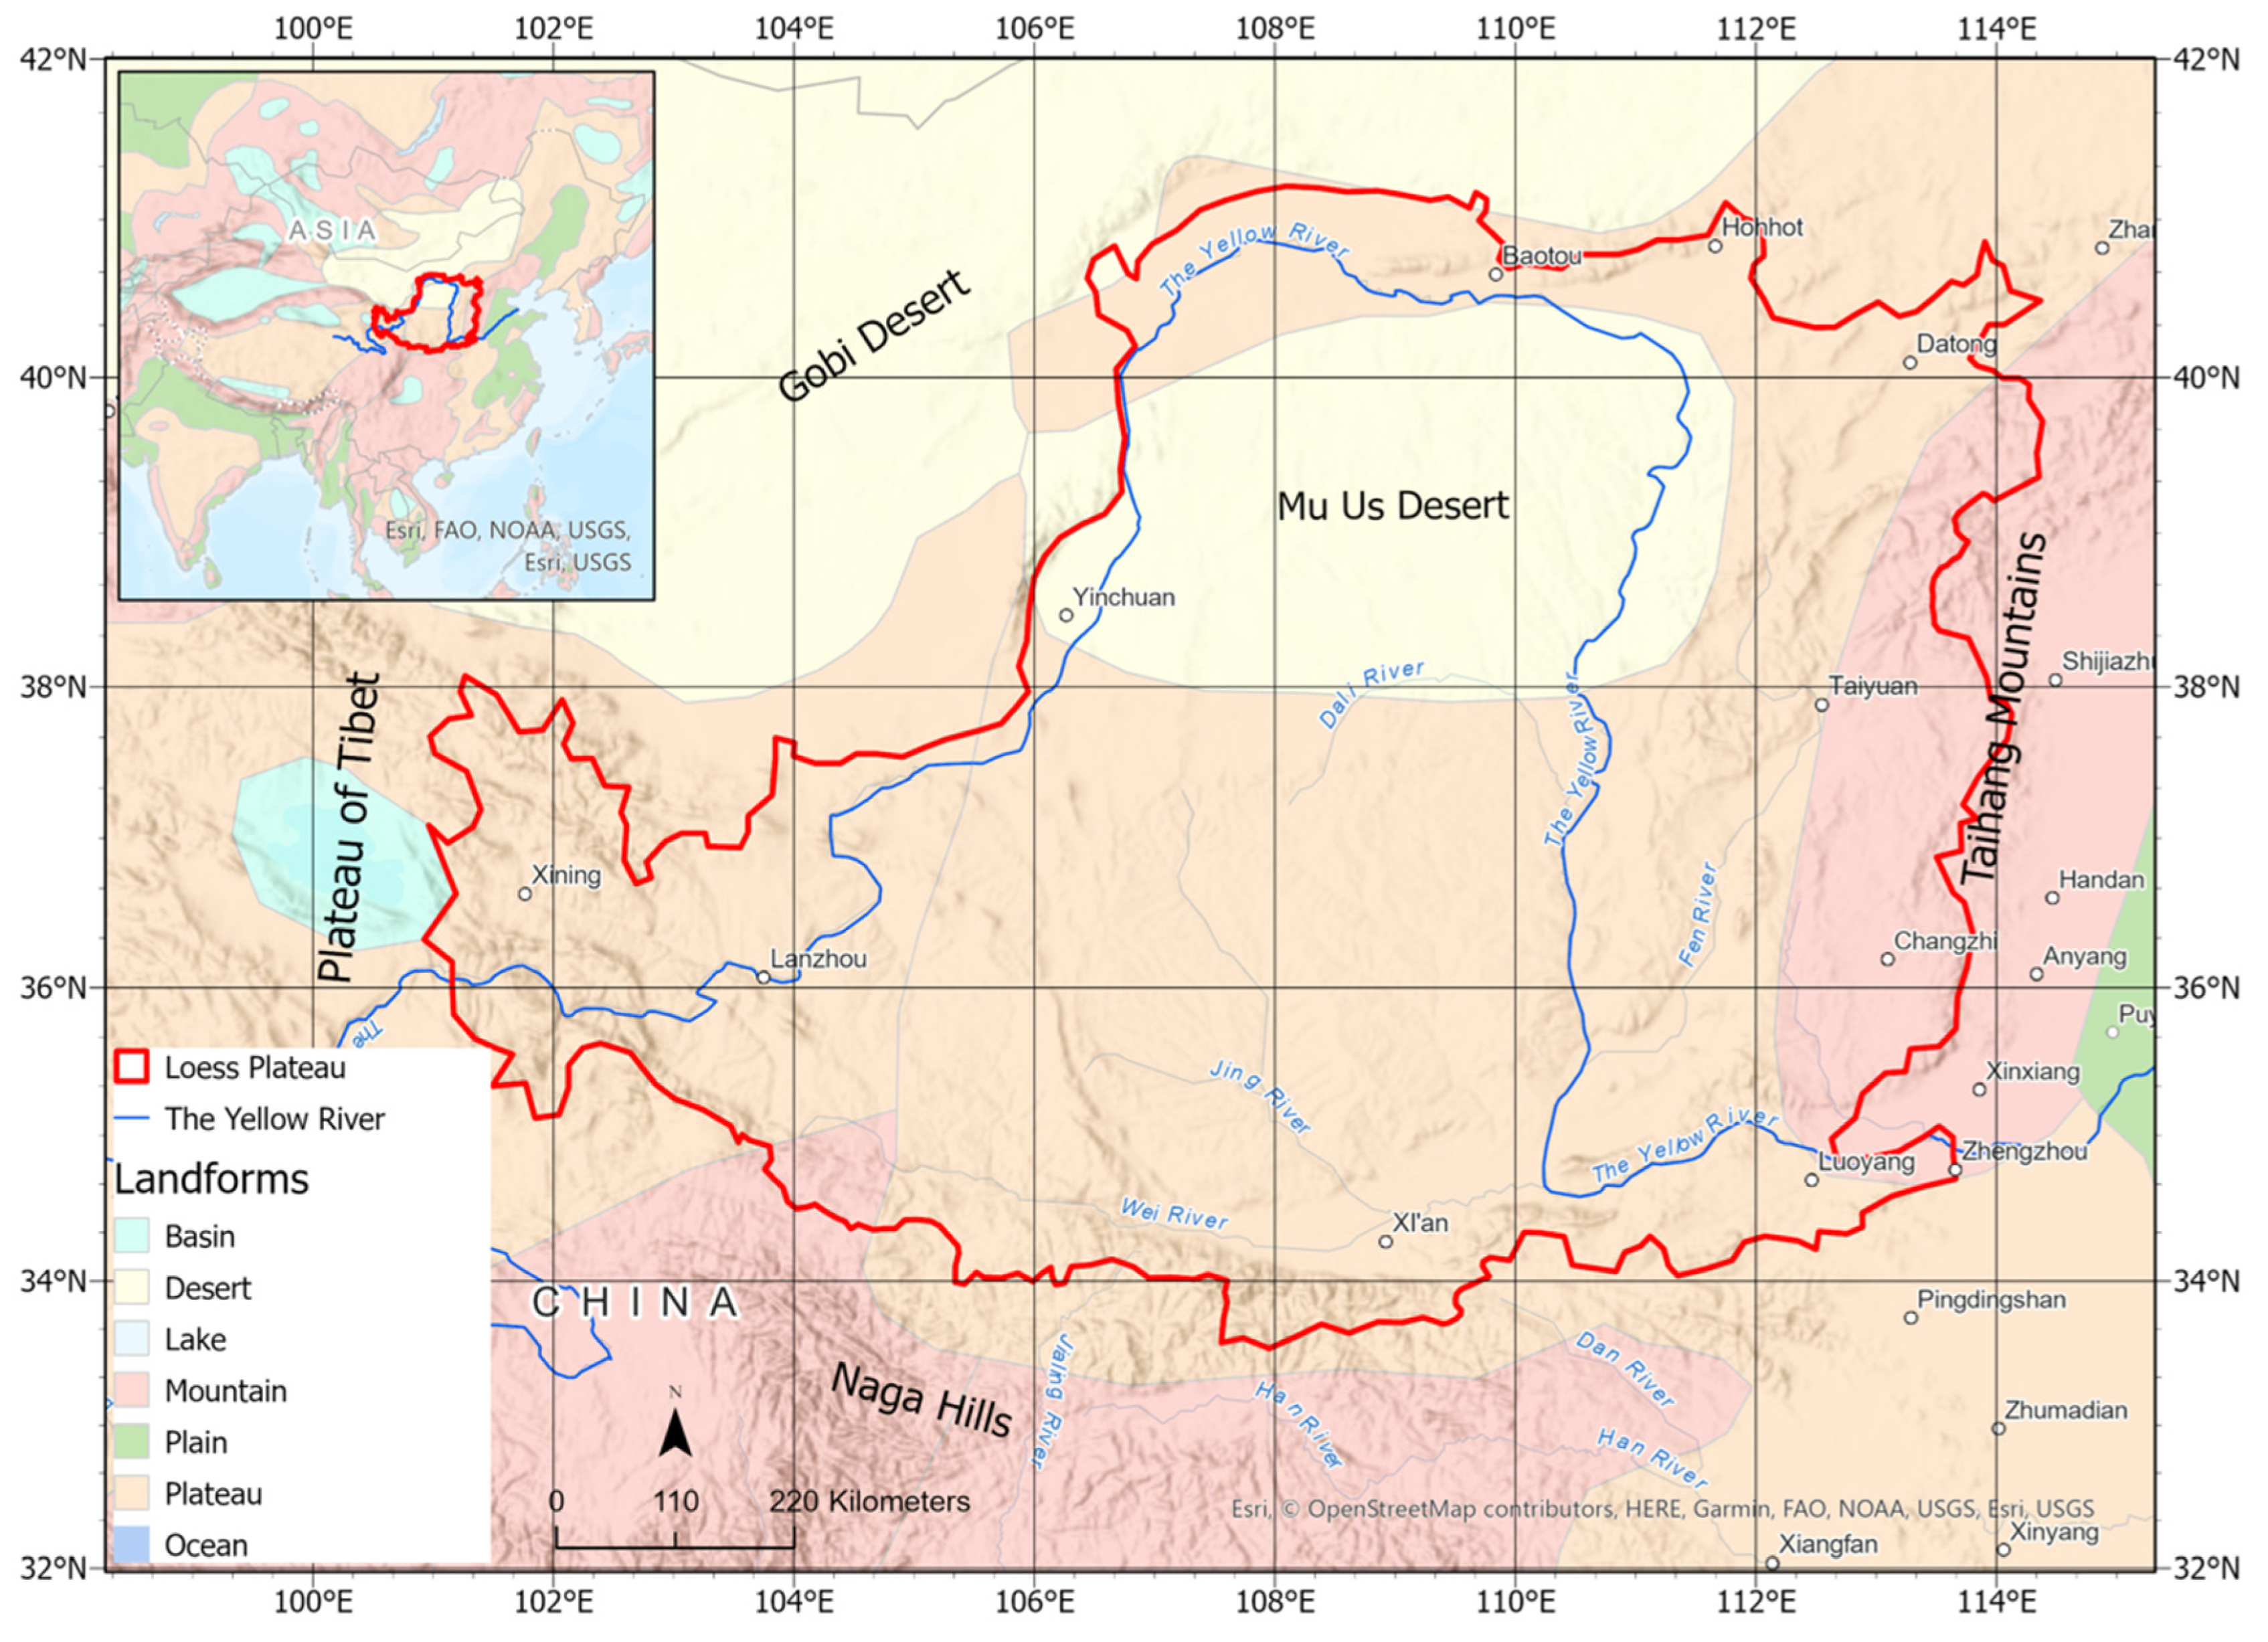
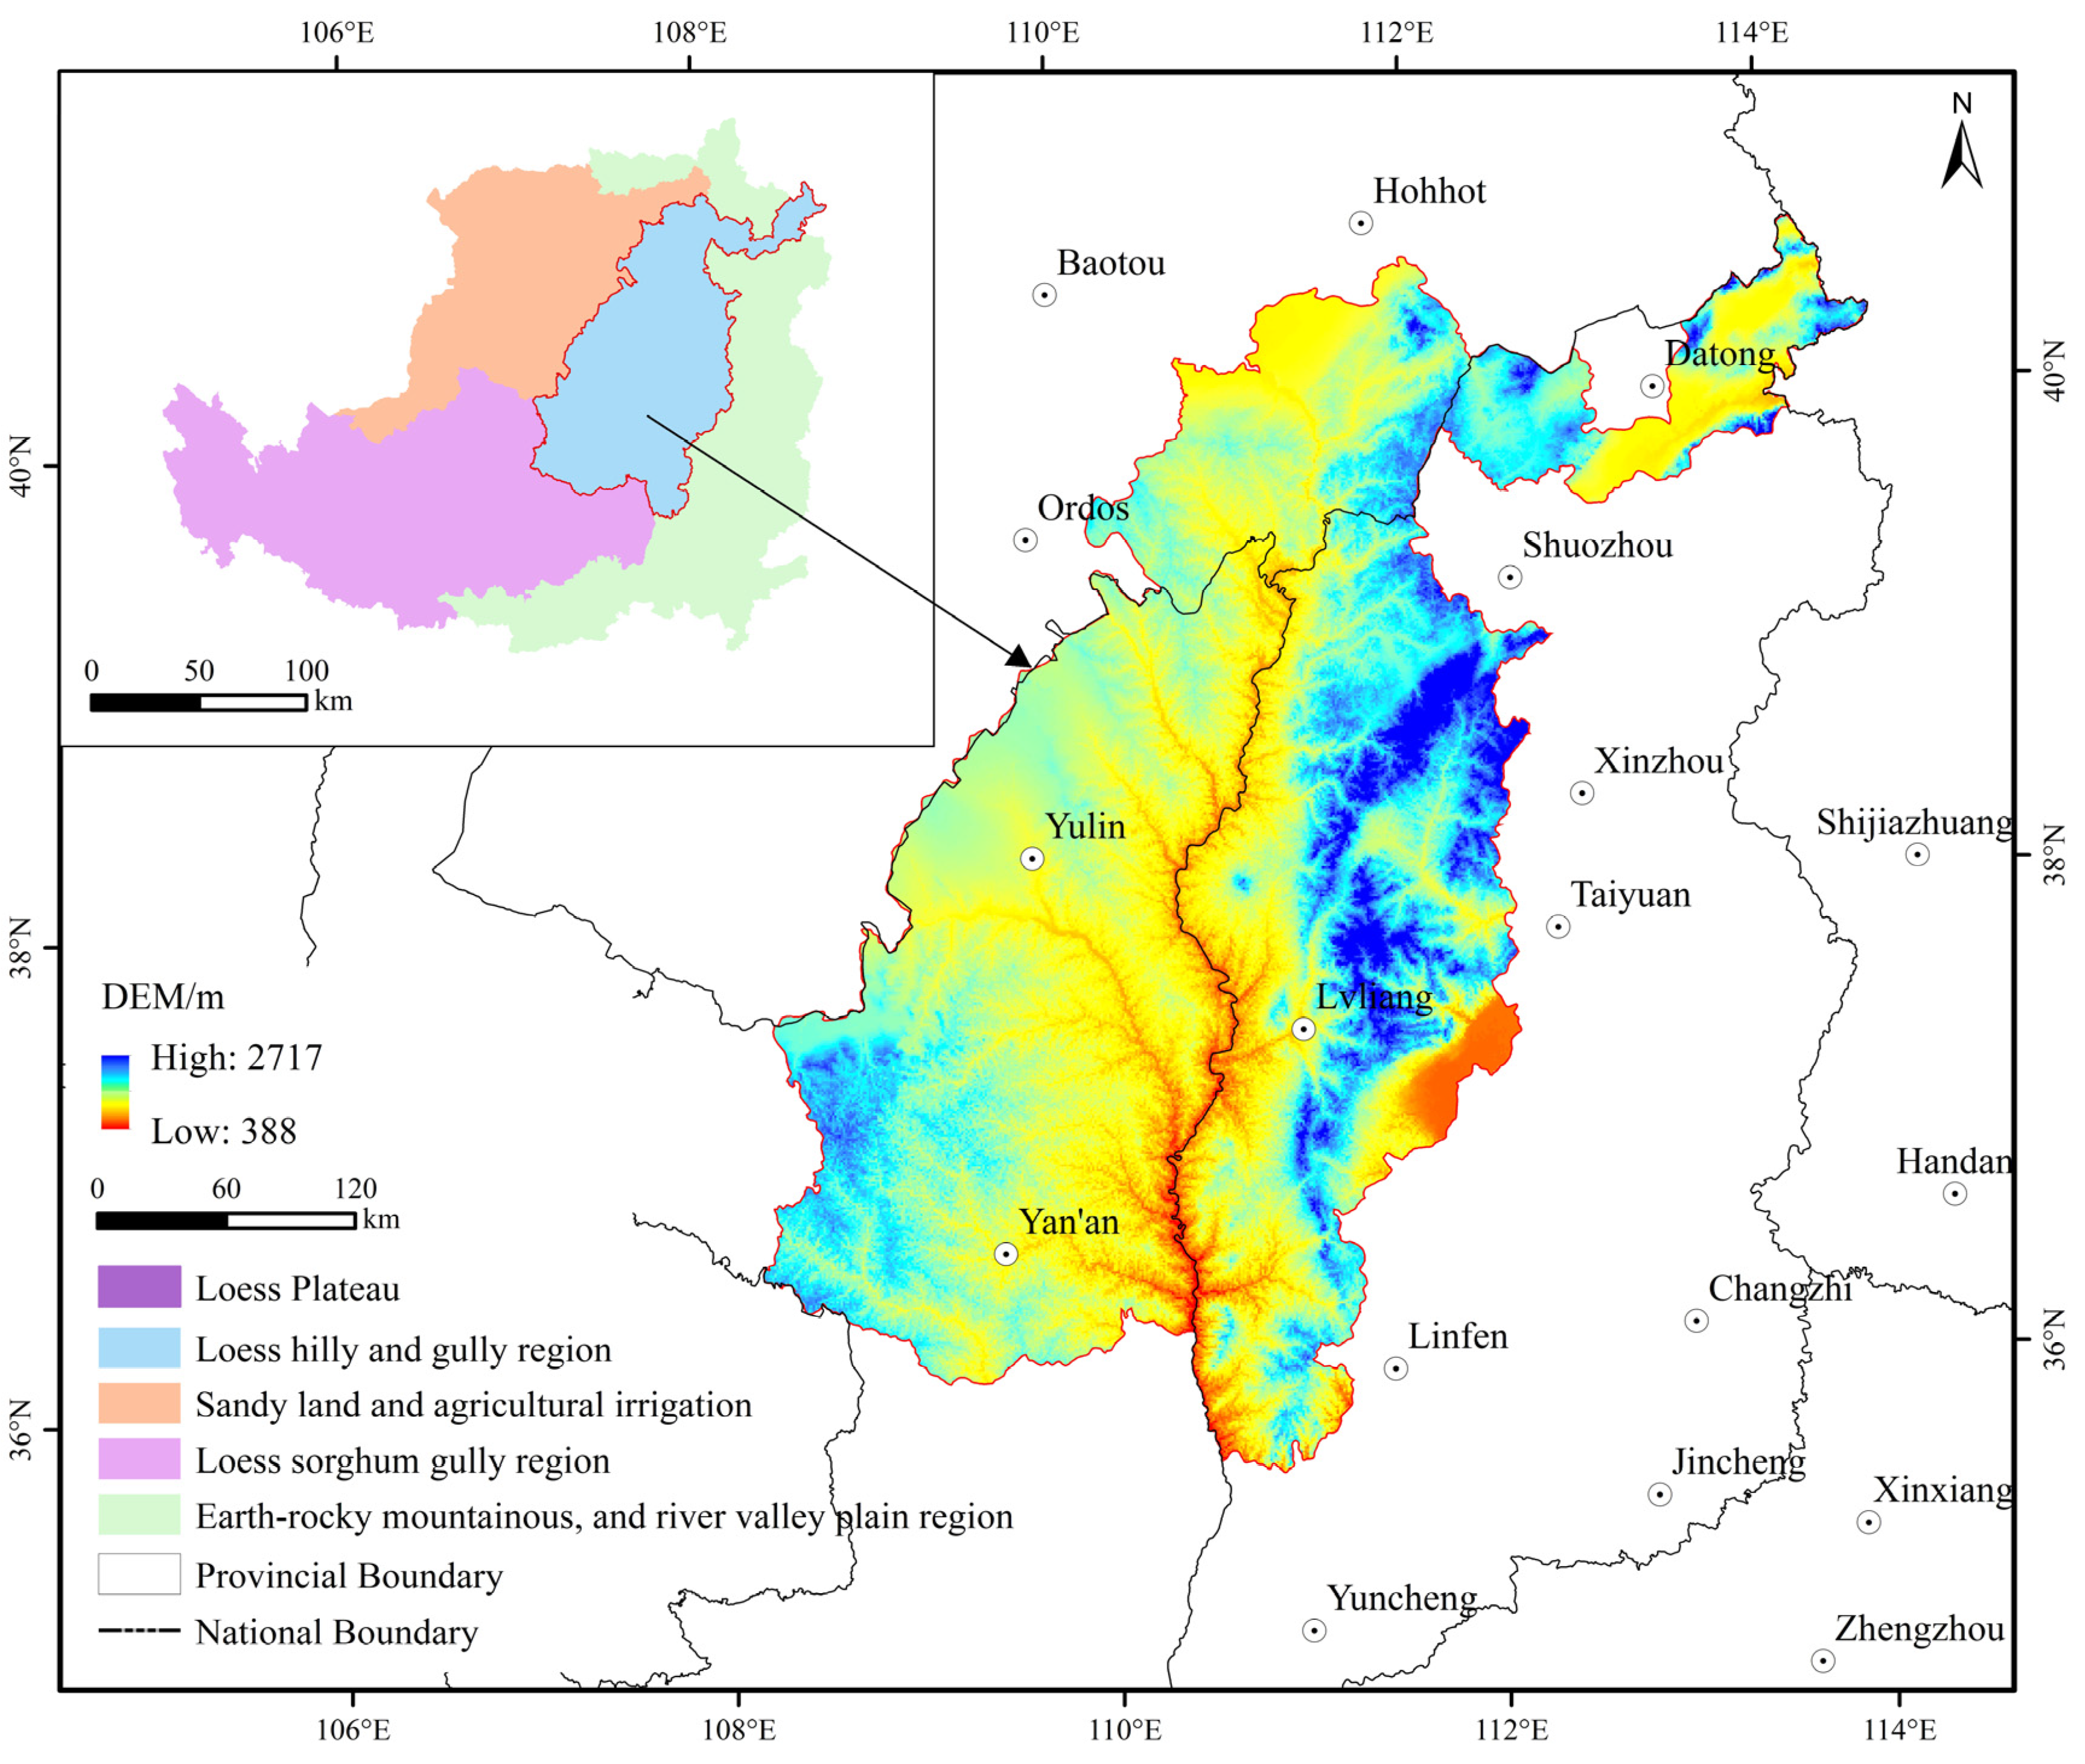
2.1. Study Area

The Loess Plateau, covering an area of 640,000 km2, is within the continental monsoon region. It is divided into four ecological regions [18], and this study focuses on the loess hilly and gully region shown in Figure 2 (107°43′ E–114°50′ E, 35°03′ N–41°09′ N), which has a total area of 129,000 km2. The annual average precipitation (1998–2019) is 455 mm and the annual average temperature is 7.2 °C. The terrain is hilly in the southeast and low-lying in the northwest, with an average elevation of 388–2717 m. The topography is complex, with dominant hills and mountains.

2.2. Data

The NDVI data were derived using the maximum value composite method based on the continuous time series of SPOT VEGETATION NDVI and were obtained from the Resource and Environment Science and Data Center of China (http://www.resdc.cn (accessed on 20 August 2022)). Twelve potential influencing factors (including climatic, topographic, other environmental and human factors, as shown in Table 1) were chosen to determine the factors causing the NDVI change using Geodetector as the measure [19]. Taking the data of 2015 as an example, the spatial variation of each driving factor is shown in Figure 3. Because the independent input variables to Geodetector were discrete, this study reclassified all the factors using ArcGIS and resampled them to the same resolution of 1 × 1 km as used in the NDVI data. In addition, the coordinate system of the input data was uniformly transformed into Clarke_1866_Albers.

2.3. Data Analysis Methods

2.3.1. Sen + MK Test

Sen’s trend analysis [20] was employed to analyze the vegetation trends and the MK test can judge whether the tendency to change is significant and sensitive to outliers [21,22]. Usually, the two are combined to analyze changes in vegetation over a long time series.
The slope β of Sen’s trend analysis can be calculated using:
β = m e d i a n ( N j N i j i ) , 1998 i j 2019
where i and j are the number of time periods, Ni and Nj are the NDVI values of the corresponding time periods, median is the median function; β greater than 0 signifies a rising trend, β less than 0 signifies a decreasing trend, and β equal to 0 signifies no change.
The formulas for calculating the Z value of the MK test were described in detail by Dinpashoh et al. [23]. If |Z| ≥ u (1−α⁄2) at a given significance level α, it indicates that the values vary significantly. In this study, “α = 95%” is used; thus, u is equal to 1.96 (assuming normal distribution). If |Z| ≥ 1.96, the NDVI is significantly changed, otherwise the NDVI change is not significant.

2.3.2. Hurst Index

The Hurst index can describe what happens in the past and whether or not present conditions have an impact on the future [24]. It is relatively reliable to calculate the Hurst index using R/S analysis [25]. The calculated value of H reflects the stochastic and persistent characteristics of the NDVI series [26]. When 0.5 < H < 1, it indicates that the time series is a persistent series, that is, the future trend of NDVI is consistent with the past, and the closer H is to 1, the stronger the persistence is. When H = 0.5, it indicates that the time series is stochastic, that is, future changes in NDVI are uncertain and have no long-term relevance. When 0 < H < 0.5, it indicates that the time series is anti-persistent, that is, the future trend of NDVI is opposite to the past, and the closer H is to 0, the stronger the anti-persistence is. The classification criteria are listed in Table 2.

2.3.3. Geodetector Model

Geodetector reveals the role of the driving factors behind dependent variables through spatial heterogeneity detection [11]. It includes four principal elements: factor, interaction, ecological, and risk detection [27].
Factor detection can detect the explainability of NDVI by the potential influencing factors X. This was measured using the value of q varying between 0 and 1:
q = 1 h = 1 L N h σ h 2 N σ 2 ,
where h is the categorization of NDVI or X; Nh and N are the number of samples in h of a certain driving factor and the entire area, respectively; σ h 2 and σ2 are the variances of NDVI in h and the entire area, respectively. A larger q indicates a better explanation of the spatial heterogeneity of X about NDVI and vice versa [28].
Interaction detection was used to assess interaction between two factors. The q values of individual factors (q(X1) and q(X2)) were first calculated separately, and the value of two-factor interaction (q(X1∩X2)) was calculated. The results are defined by comparing the q value of individual factor and two-factor interaction as shown in Table 3.
Ecological detection can determine whether there are significant differences among factors. Risk detection is used to determine a suitable range or type. That with a larger NDVI value is the most appropriate range or type.
In this study, data from four typical years, 2000, 2005, 2010, and 2015, were used in the Geodetector model.

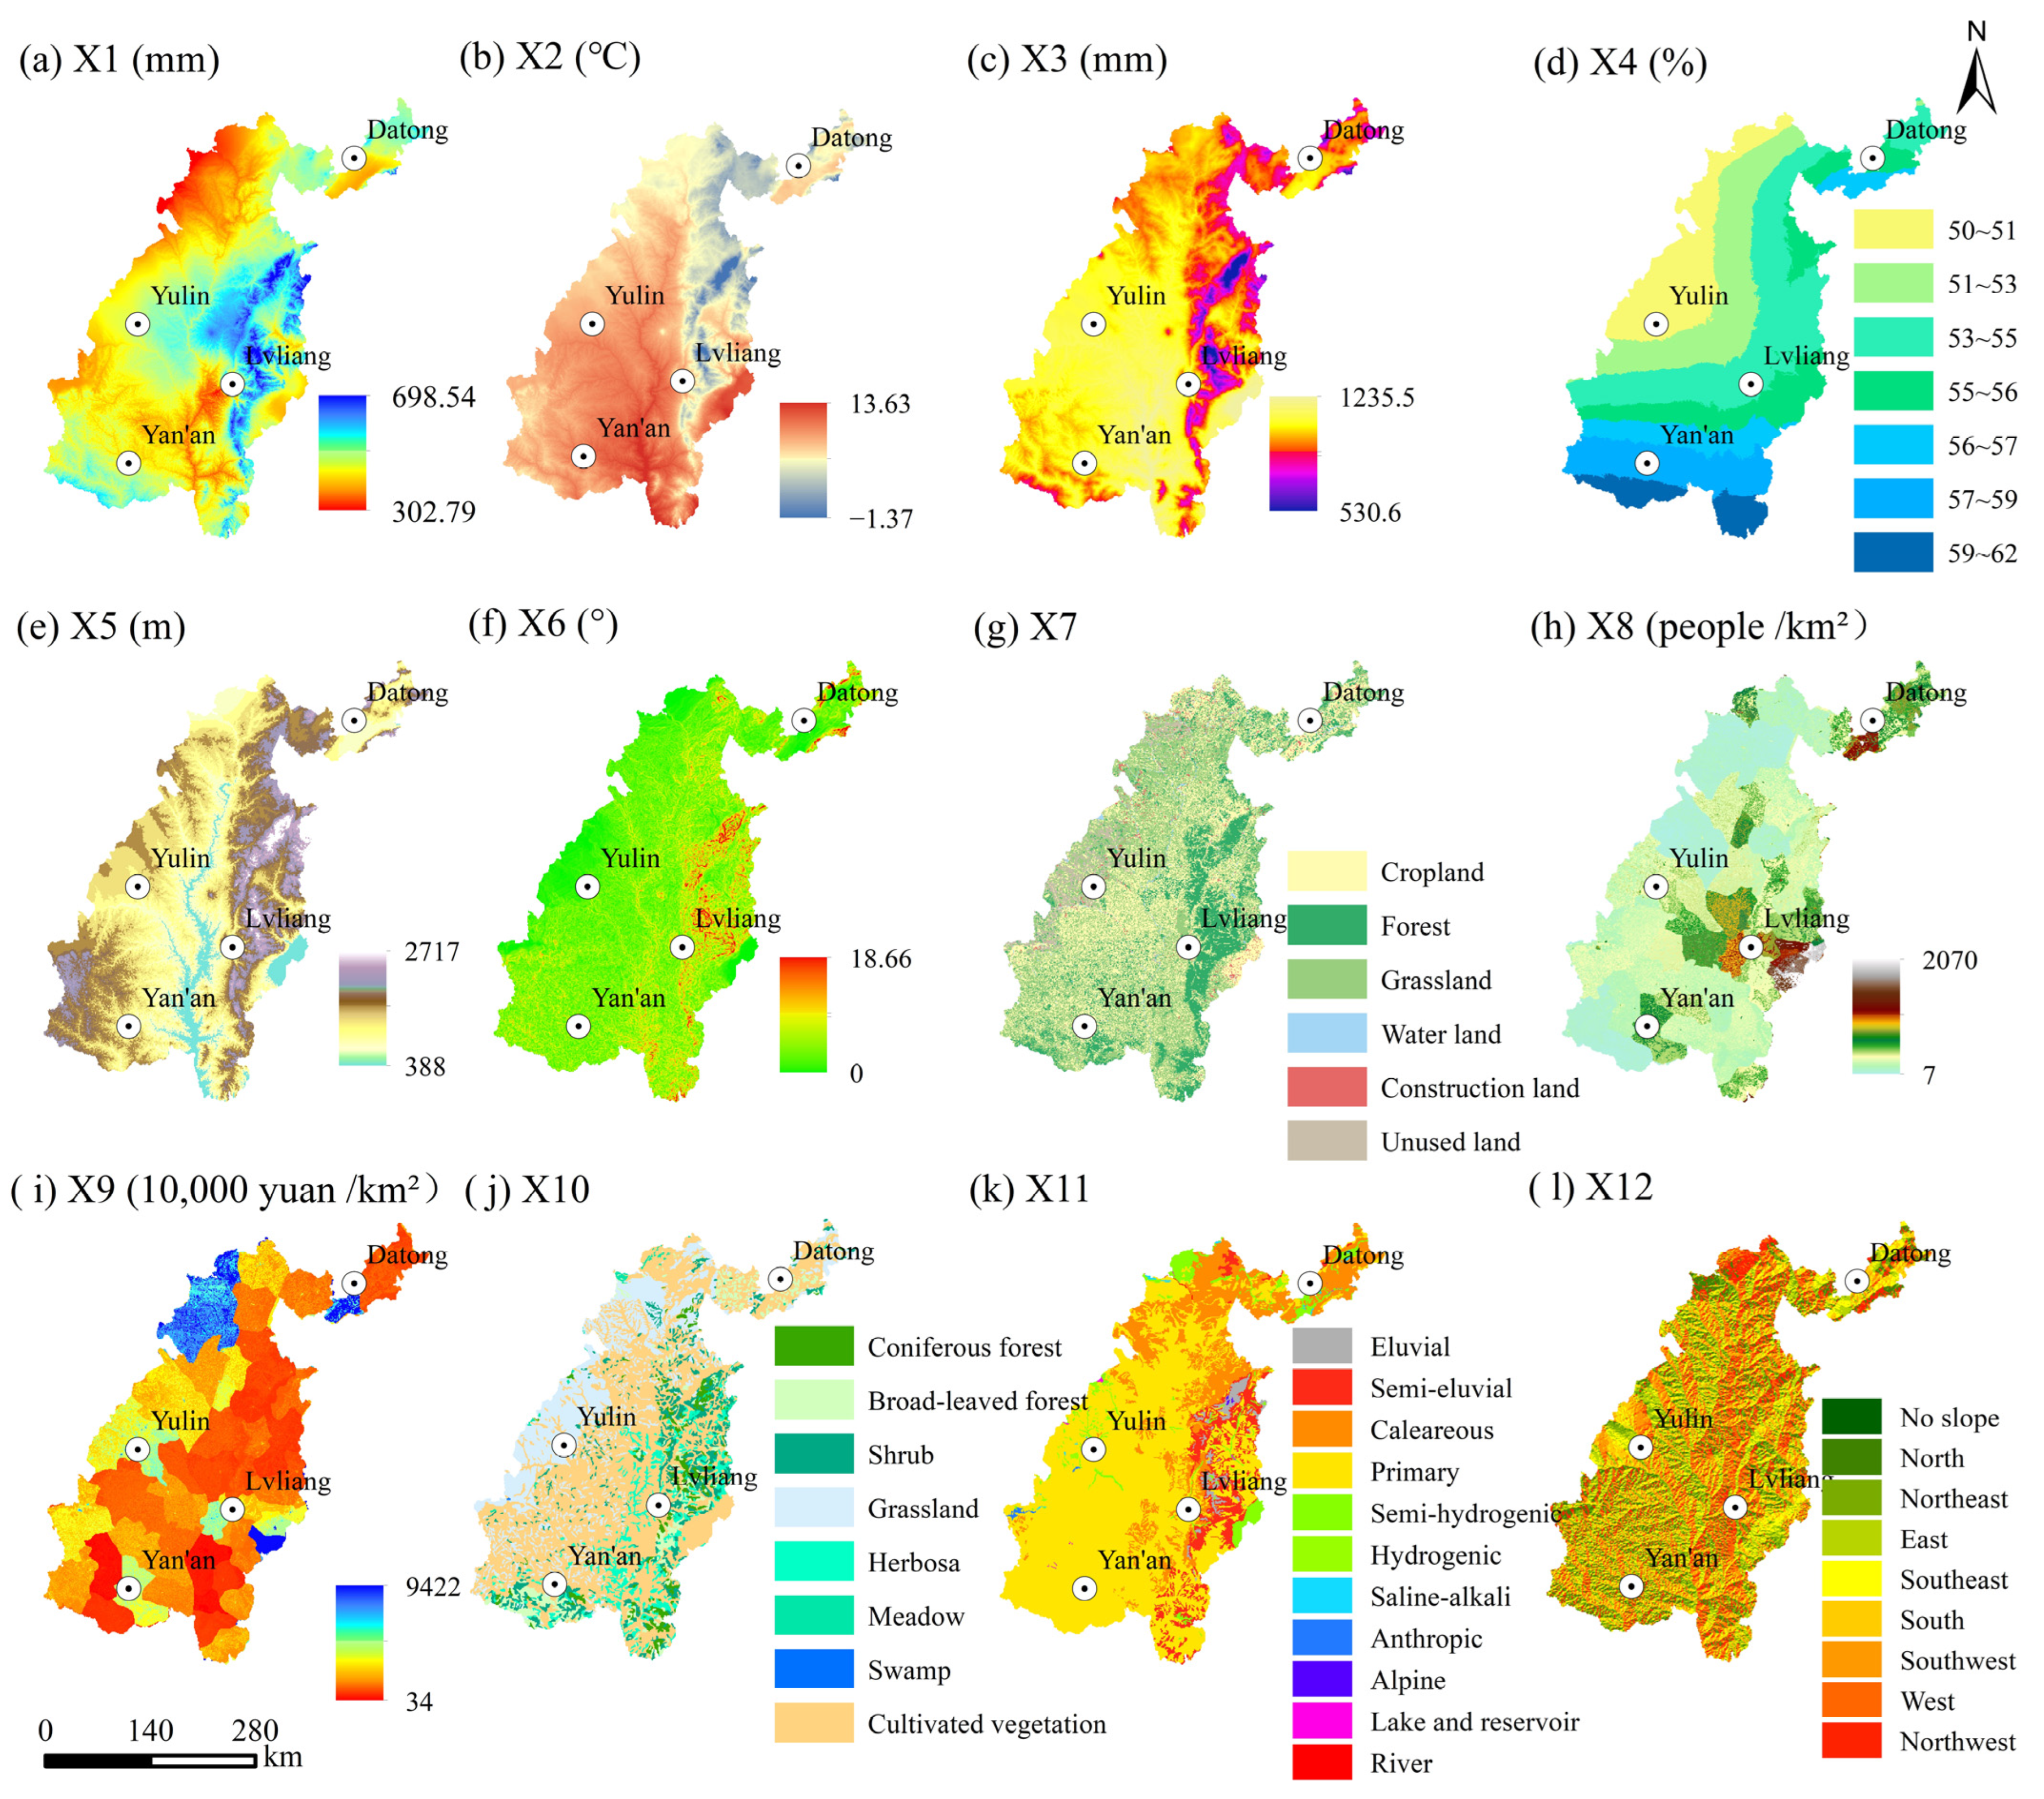
2.3.4. Selection and Pre-Processing of Indicators

Twelve factors were chosen and discretely classified using the natural intermittent point grading method (Table 1). Annual precipitation, potential evapotranspiration, elevation, population density, and GDP were classified into nine categories, and annual mean temperature, relative humidity, and slope were classified into seven categories. Land use, vegetation, and soil types were classified based on the type. Aspect was classified into nine categories. In addition, to reduce the calculation time and improve accuracy, the study area was divided into 3 × 3 km grids, which resulted in a total of 13,949 centroid sampling points. Attribute values of NDVI and the potential influencing factors were extracted from each sampling point. Finally, the attribute values were inserted into the Geodetector to process the data.

3. Results and Analysis

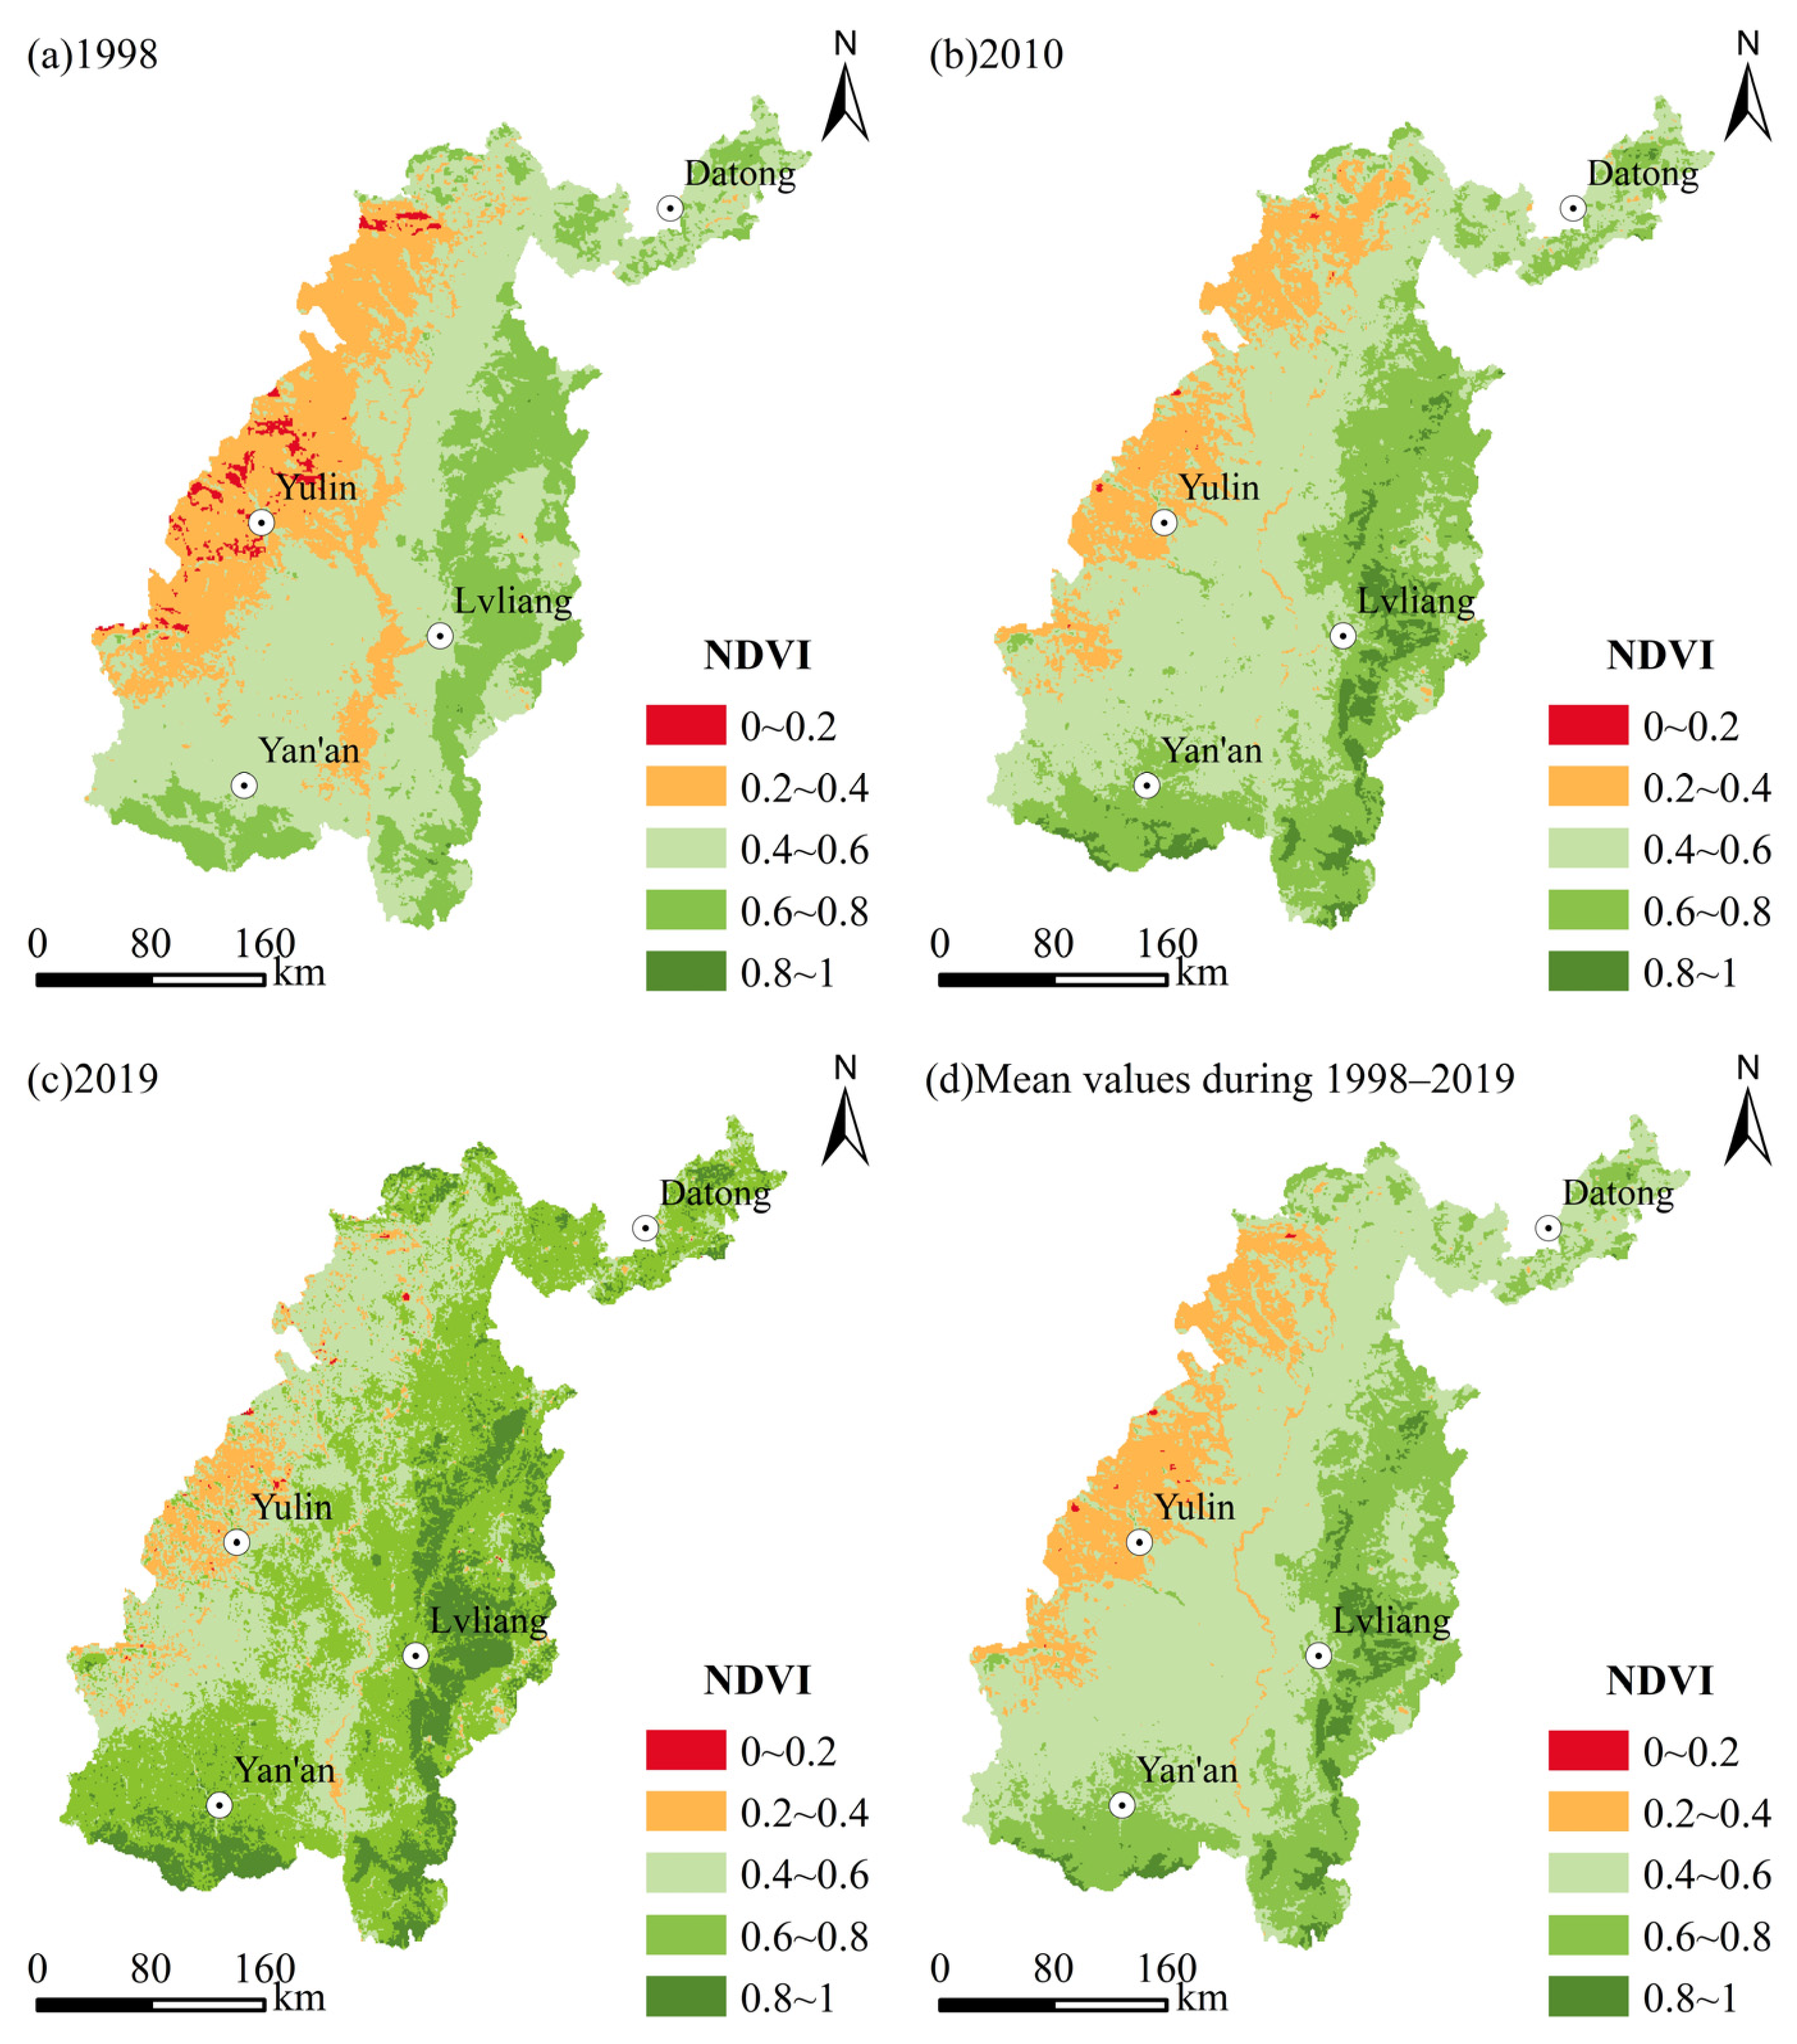
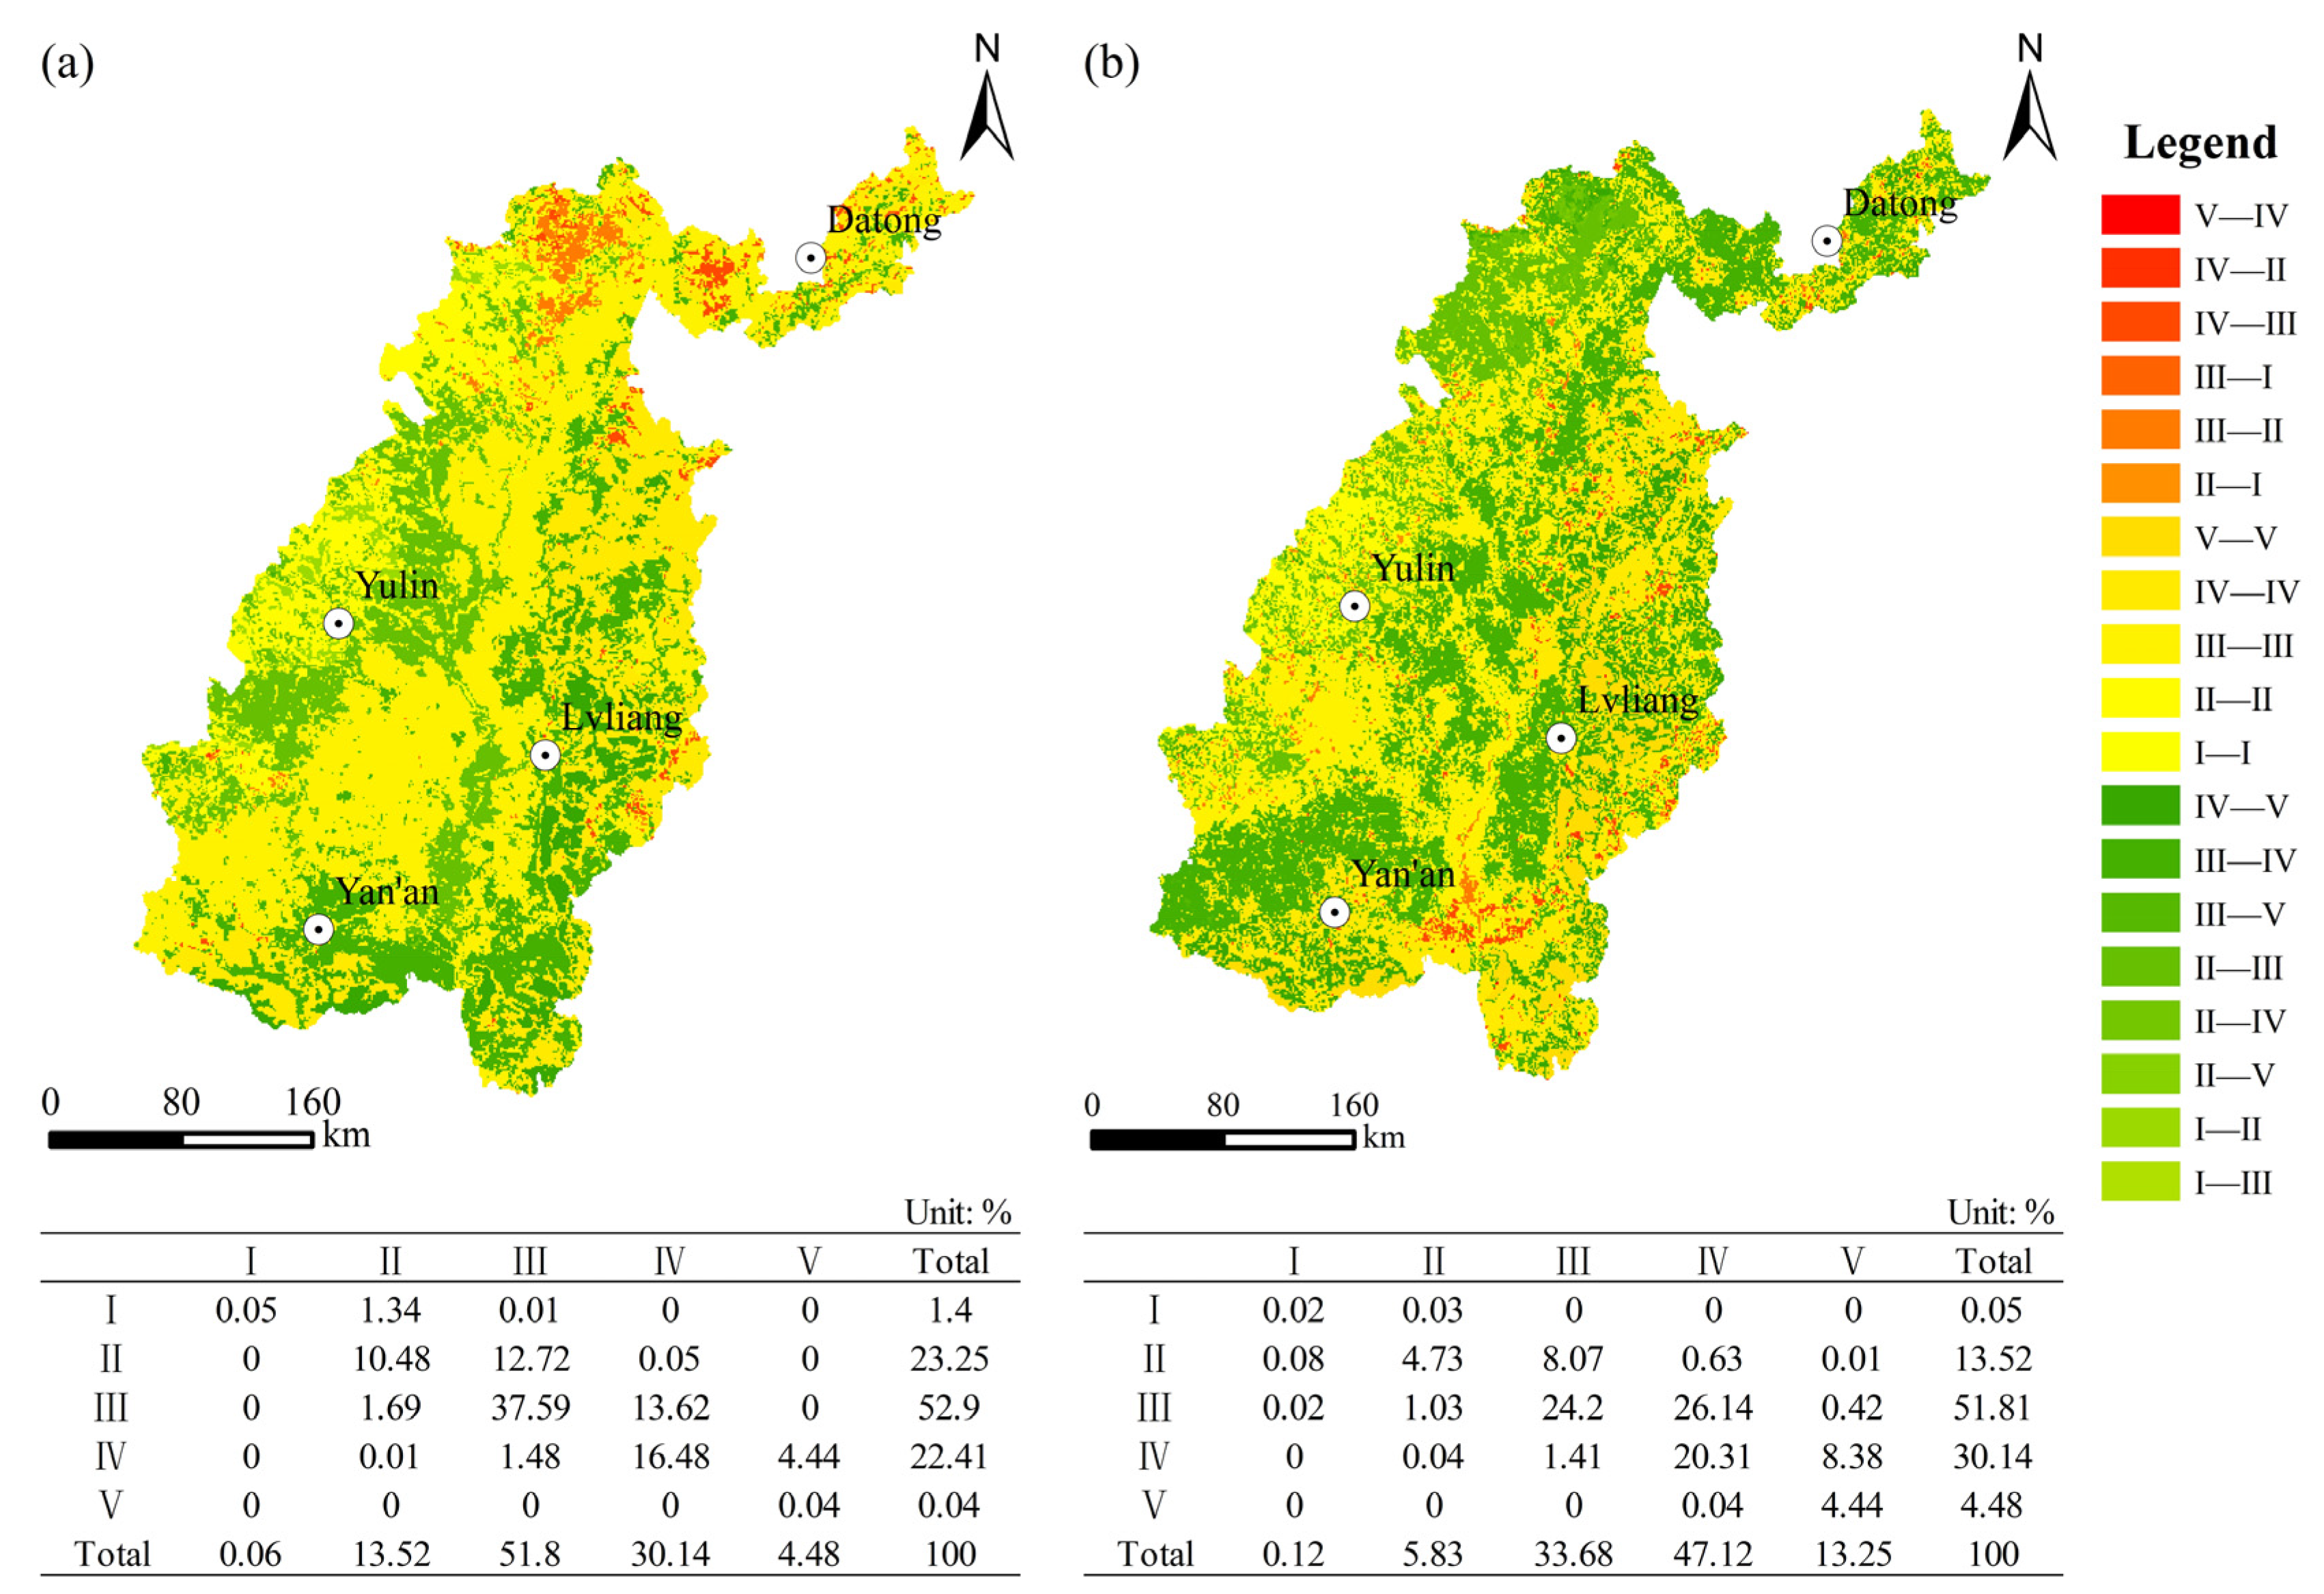
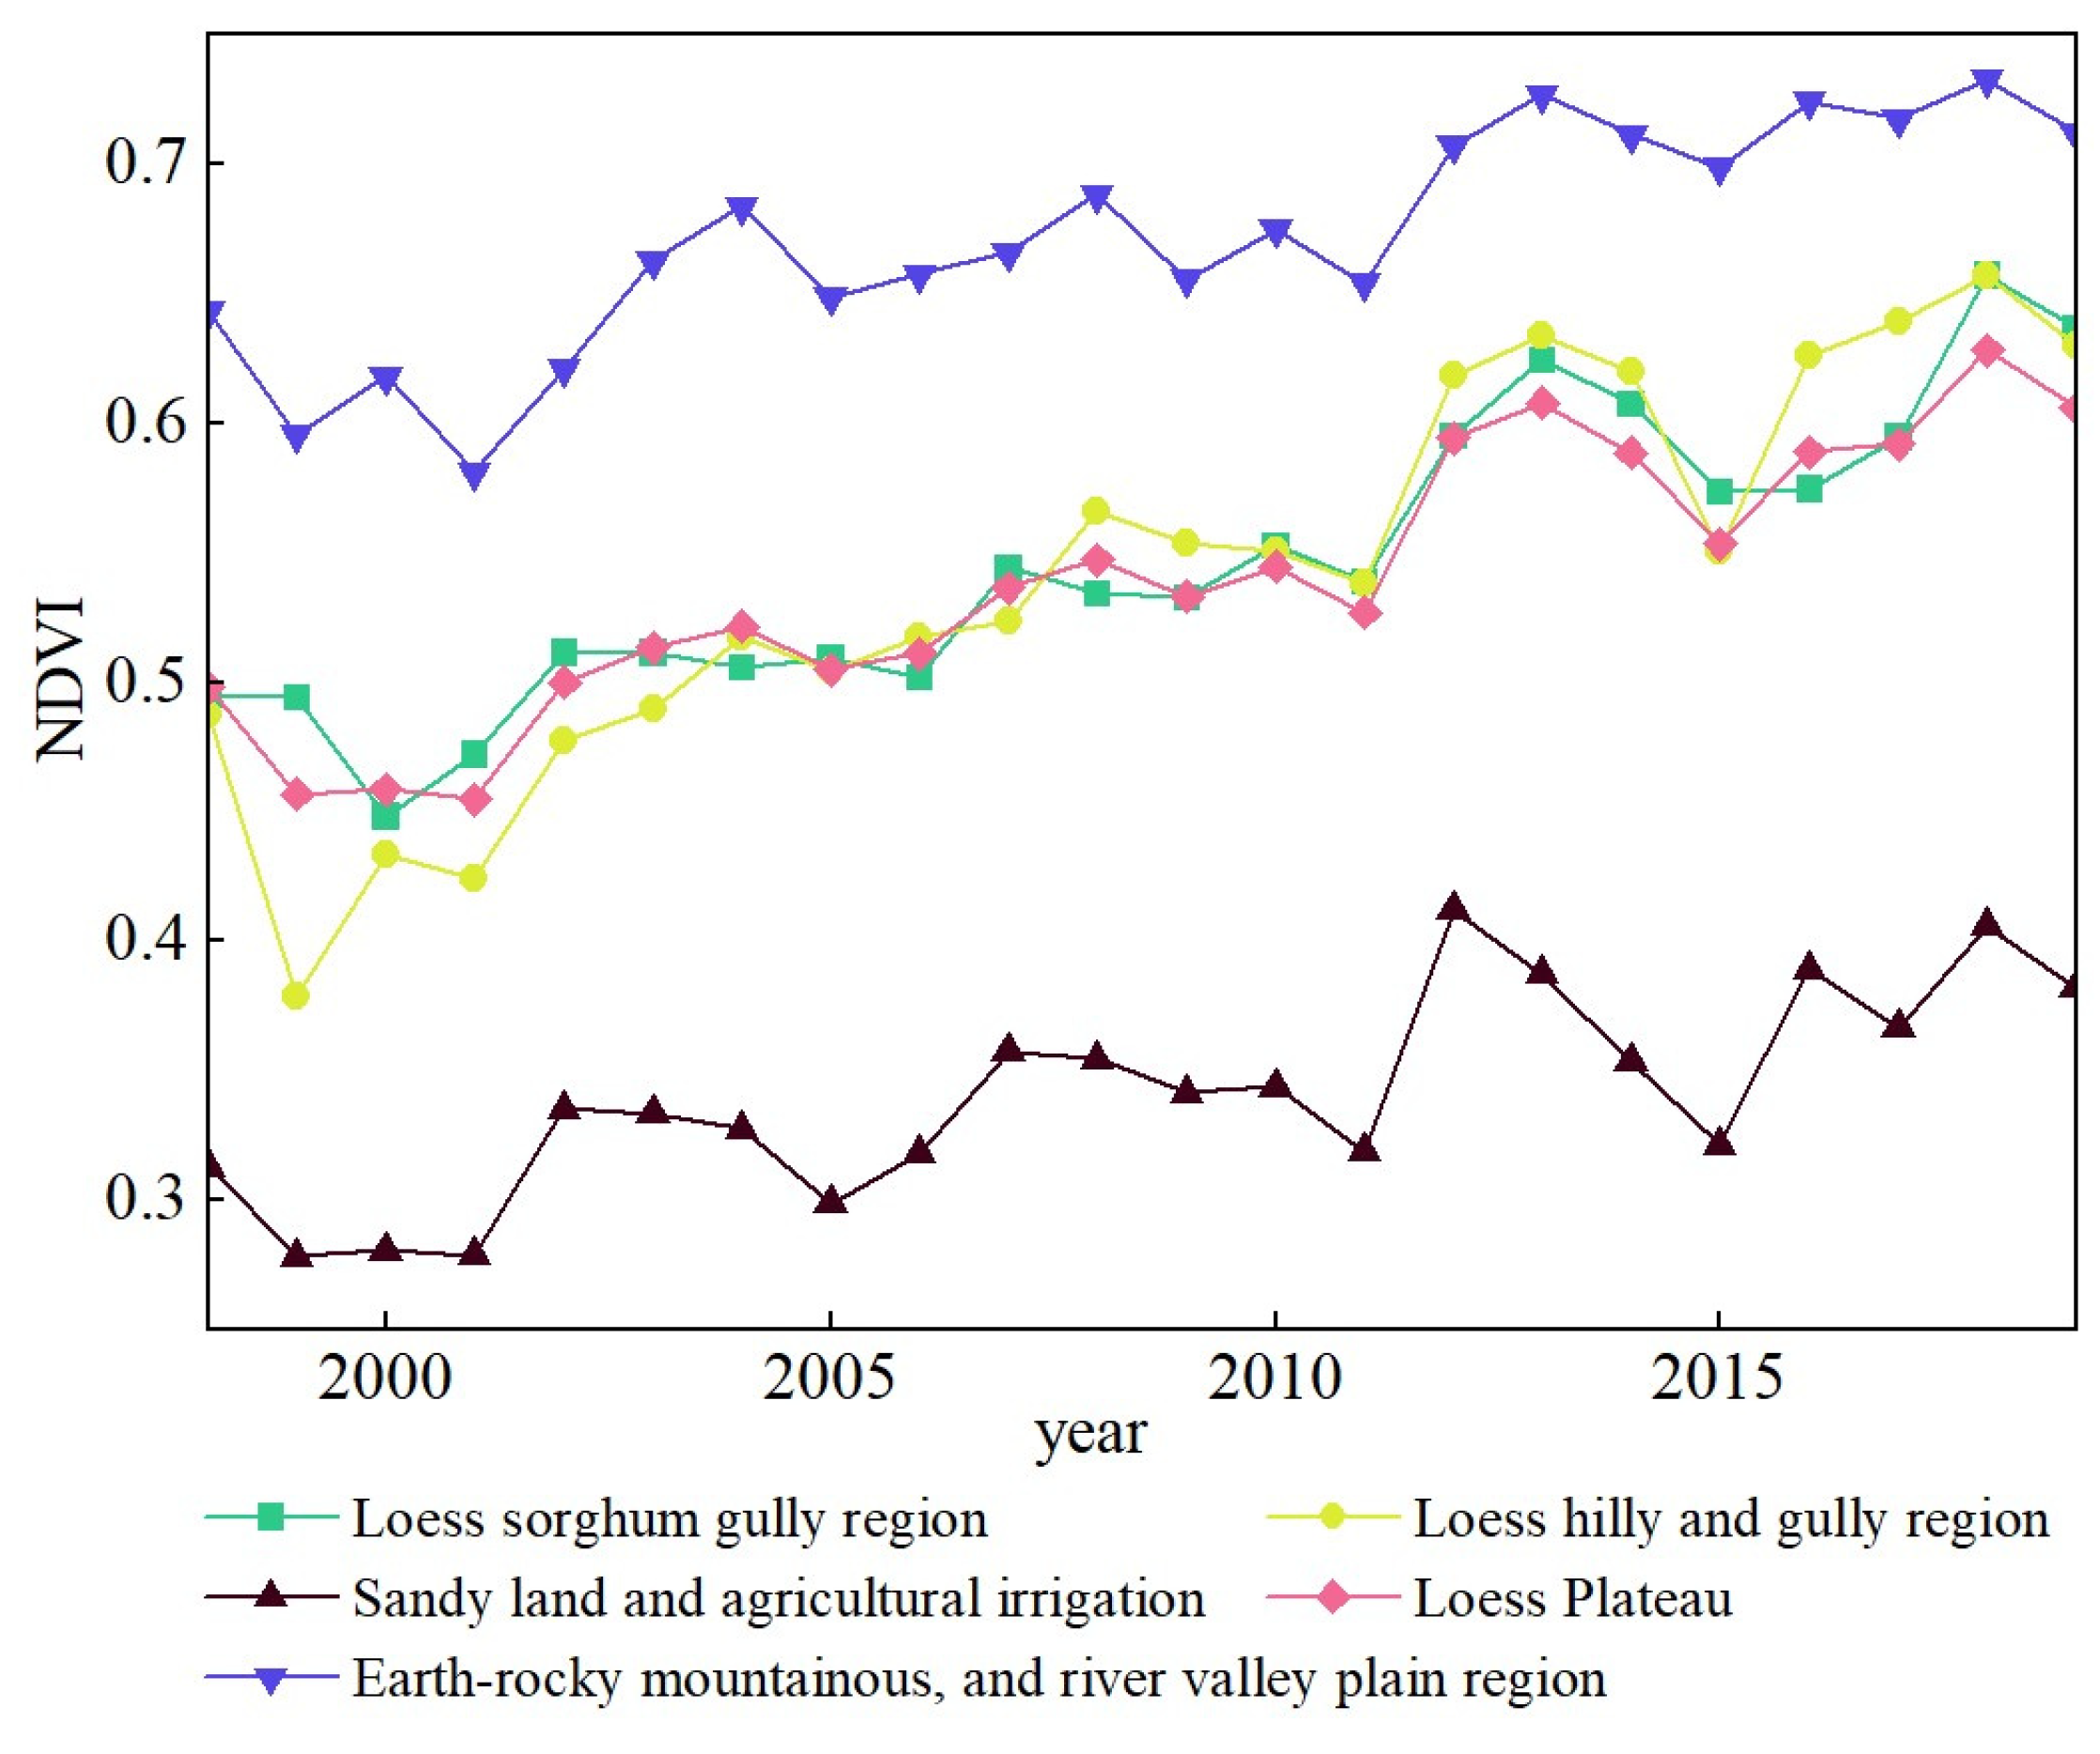
3.1. Spatial–Temporal Variation of NDVI

Based on relevant studies, the NDVI value was divided into classes I to V with the values varying between 0–0.2, 0.2–0.4, 0.4–0.6, 0.6–0.8, and 0.8–1, respectively [29]. The mean NDVI value for class I in the study area (Figure 4a) was 0.172, showing a highly significant (p < 0.01) decreasing trend at a rate of 0.0012/year. The mean NDVI values of class II (Figure 4b) and class IV (Figure 4d) showed a significant (p < 0.05) increasing trend, with the rates of 0.0007/year and 0.0004/year, respectively. In contrast, the mean NDVI values of class III (Figure 4c) and class V (Figure 4e) showed extremely significant (p < 0.01) increasing trends, with the rates of 0.0020/year and 0.0031/year, respectively. Overall, as shown in Figure 4f, the mean NDVI showed a highly significant (p < 0.01) increasing trend with a rate of 0.0108/year, with a minimum of 0.3787 in 1999 and a maximum of 0.6567 in 2018. This indicates that the vegetation of the study area is improving.
The spatial distribution of NDVI in 1998, 2010, and 2019 and the multi-year averages are shown in Figure 5. Generally, the vegetation cover was improved, with the multi-year average dominated by class III, accounting for 56.51%, and the vegetation cover was high in the southeast and low in the northwest. The results showed that vegetation cover classes IV and V were concentrated in the east part of Lvliang and the east and south parts of Yan’an; class III appeared mostly in the west of Lvliang, the north of Yan’an, and the east and south of Yulin; and classes I and II were mostly located in the west and north of Yulin.
The area in classes I and II decreased greatly during 1998–2010 (Figure 6a). All these distributions were transformed to higher classes, with 12.72% transforming from class II to class III. In contrast, the area with classes IV and V increased greatly, mainly from lower classes, with 13.62% transforming from class III to class IV and 4.44% transforming from class IV to class V. During this period, the area where the vegetation cover remained stable accounted for 64.64% and was mainly distributed in the west of Lvliang and the north of Yan’an. The area with improved NDVI accounted for 32.18% and was mostly apparent in the north of Yulin, the east and south of Lvliang and the southeast of Yan’an. In contrast, the vegetation degradation area covers 3.18% and mostly appeared in the west of Datong.
During 2010–2019 (Figure 6b), the area in classes II and III decreased significantly by 7.69% and 18.13%, respectively, mainly transforming to higher vegetation cover classes. The conversion from class III to class IV accounted for a relatively large area (26.14%). Meanwhile, the area in classes IV and V increased significantly. During this period, the vegetation cover remained stable at 53.7%, mainly in the west of Yulin, east and south of Yan’an, and northeast of Lvliang. The improved area occupied 43.68% and was mostly apparent in northwestern Yan’an, eastern Yulin, western and eastern Datong and Lvliang. The degraded area occupied 2.62% and was sporadically present in eastern Yan’an and southeastern Lvliang. Generally, the trend of vegetation cover evolution is positive, which is a trend that may be related to closing the mountains to grazing and returning farmland to forest and grass in the study area of northern Shaanxi since 1999.
From 1998 to 2019, the biggest spatial and temporal variation of NDVI class V, which was mainly distributed in the southeastern part of the study area, was transformed from NDVI class III and class IV.

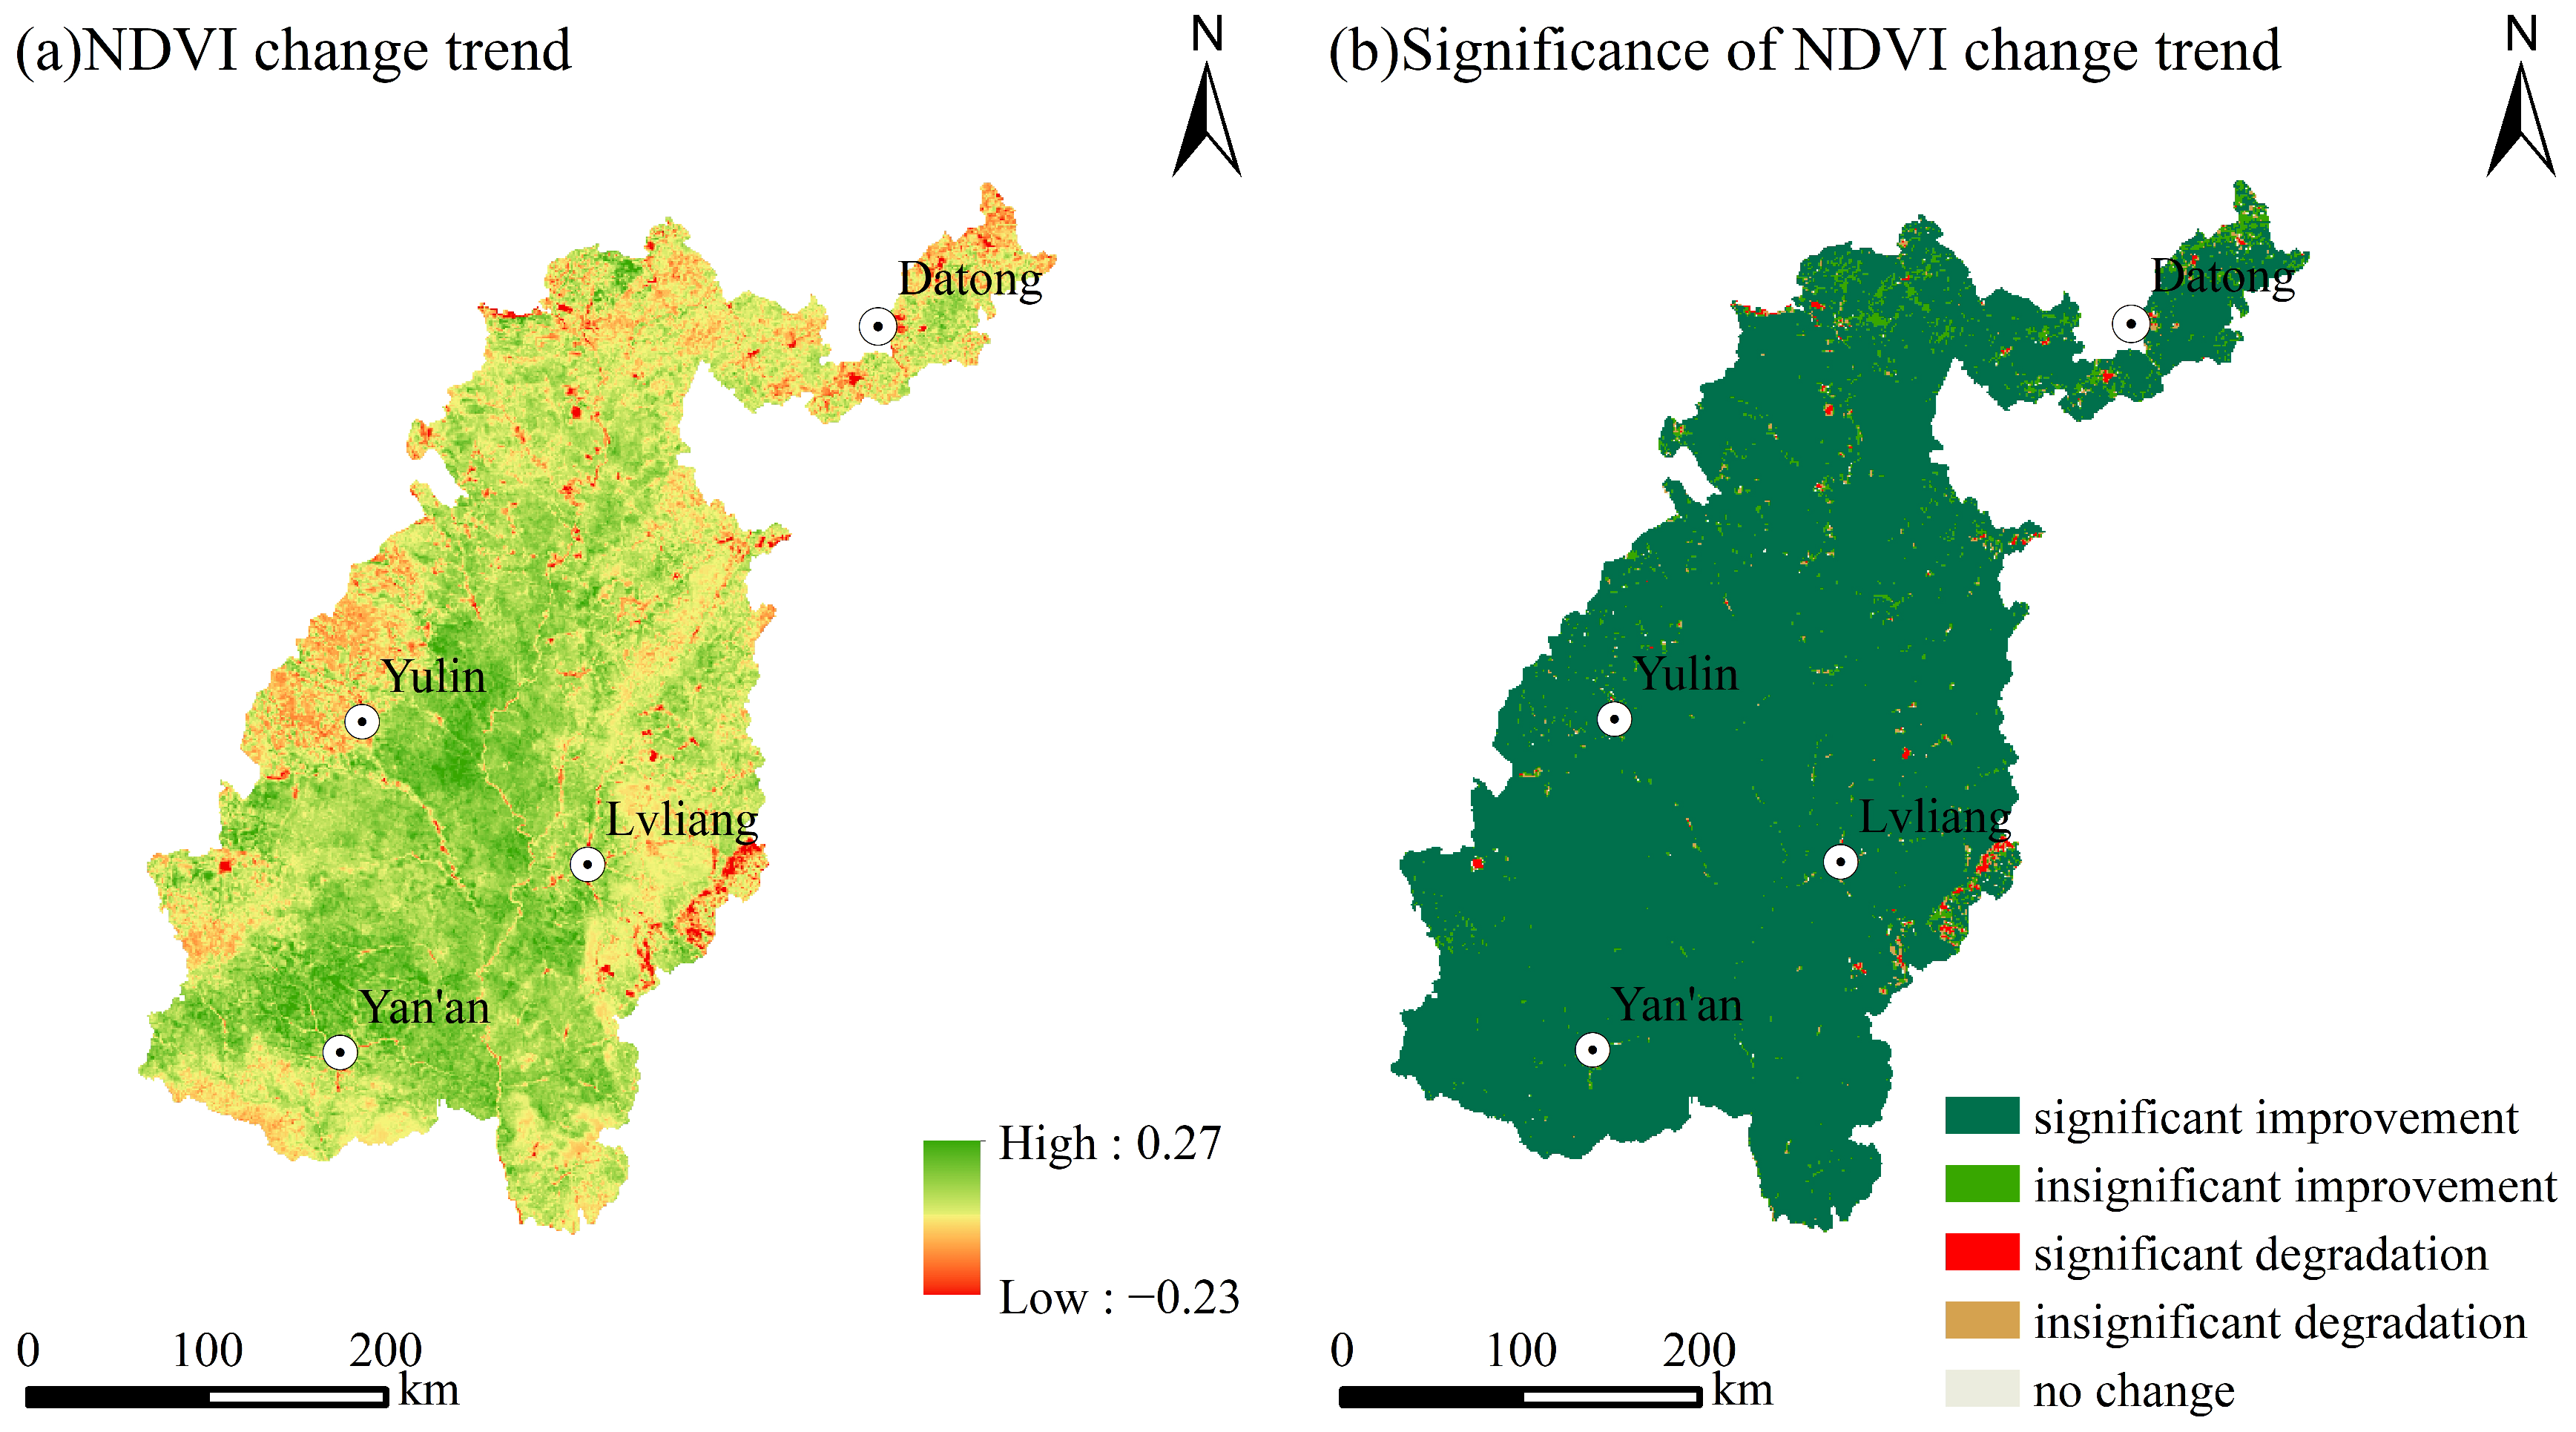
3.2. Past NDVI Trends

From 1998 to 2019, the NDVI trend in the study area ranged from −0.23 to 0.27 (Figure 7a), in which 98.56% showed a rising trend and only 1.44% showed a decreasing trend. The decreasing area was mainly located in areas such as Yulin, Yan’an, and Lvliang, which have seen relatively rapid urban development. According to the significance test (Figure 7b), the NDVI values were improved significantly in 95.14% of the area, and 3.42% were improved insignificantly. The vegetation cover near the major urban sites in the northwest and southeast showed significant or insignificant degradation, accounting for 0.84% and 0.4%, respectively, and the land use here mostly comprised construction sites and unused land. Overall, compared to the degraded area, the improved area was much larger.

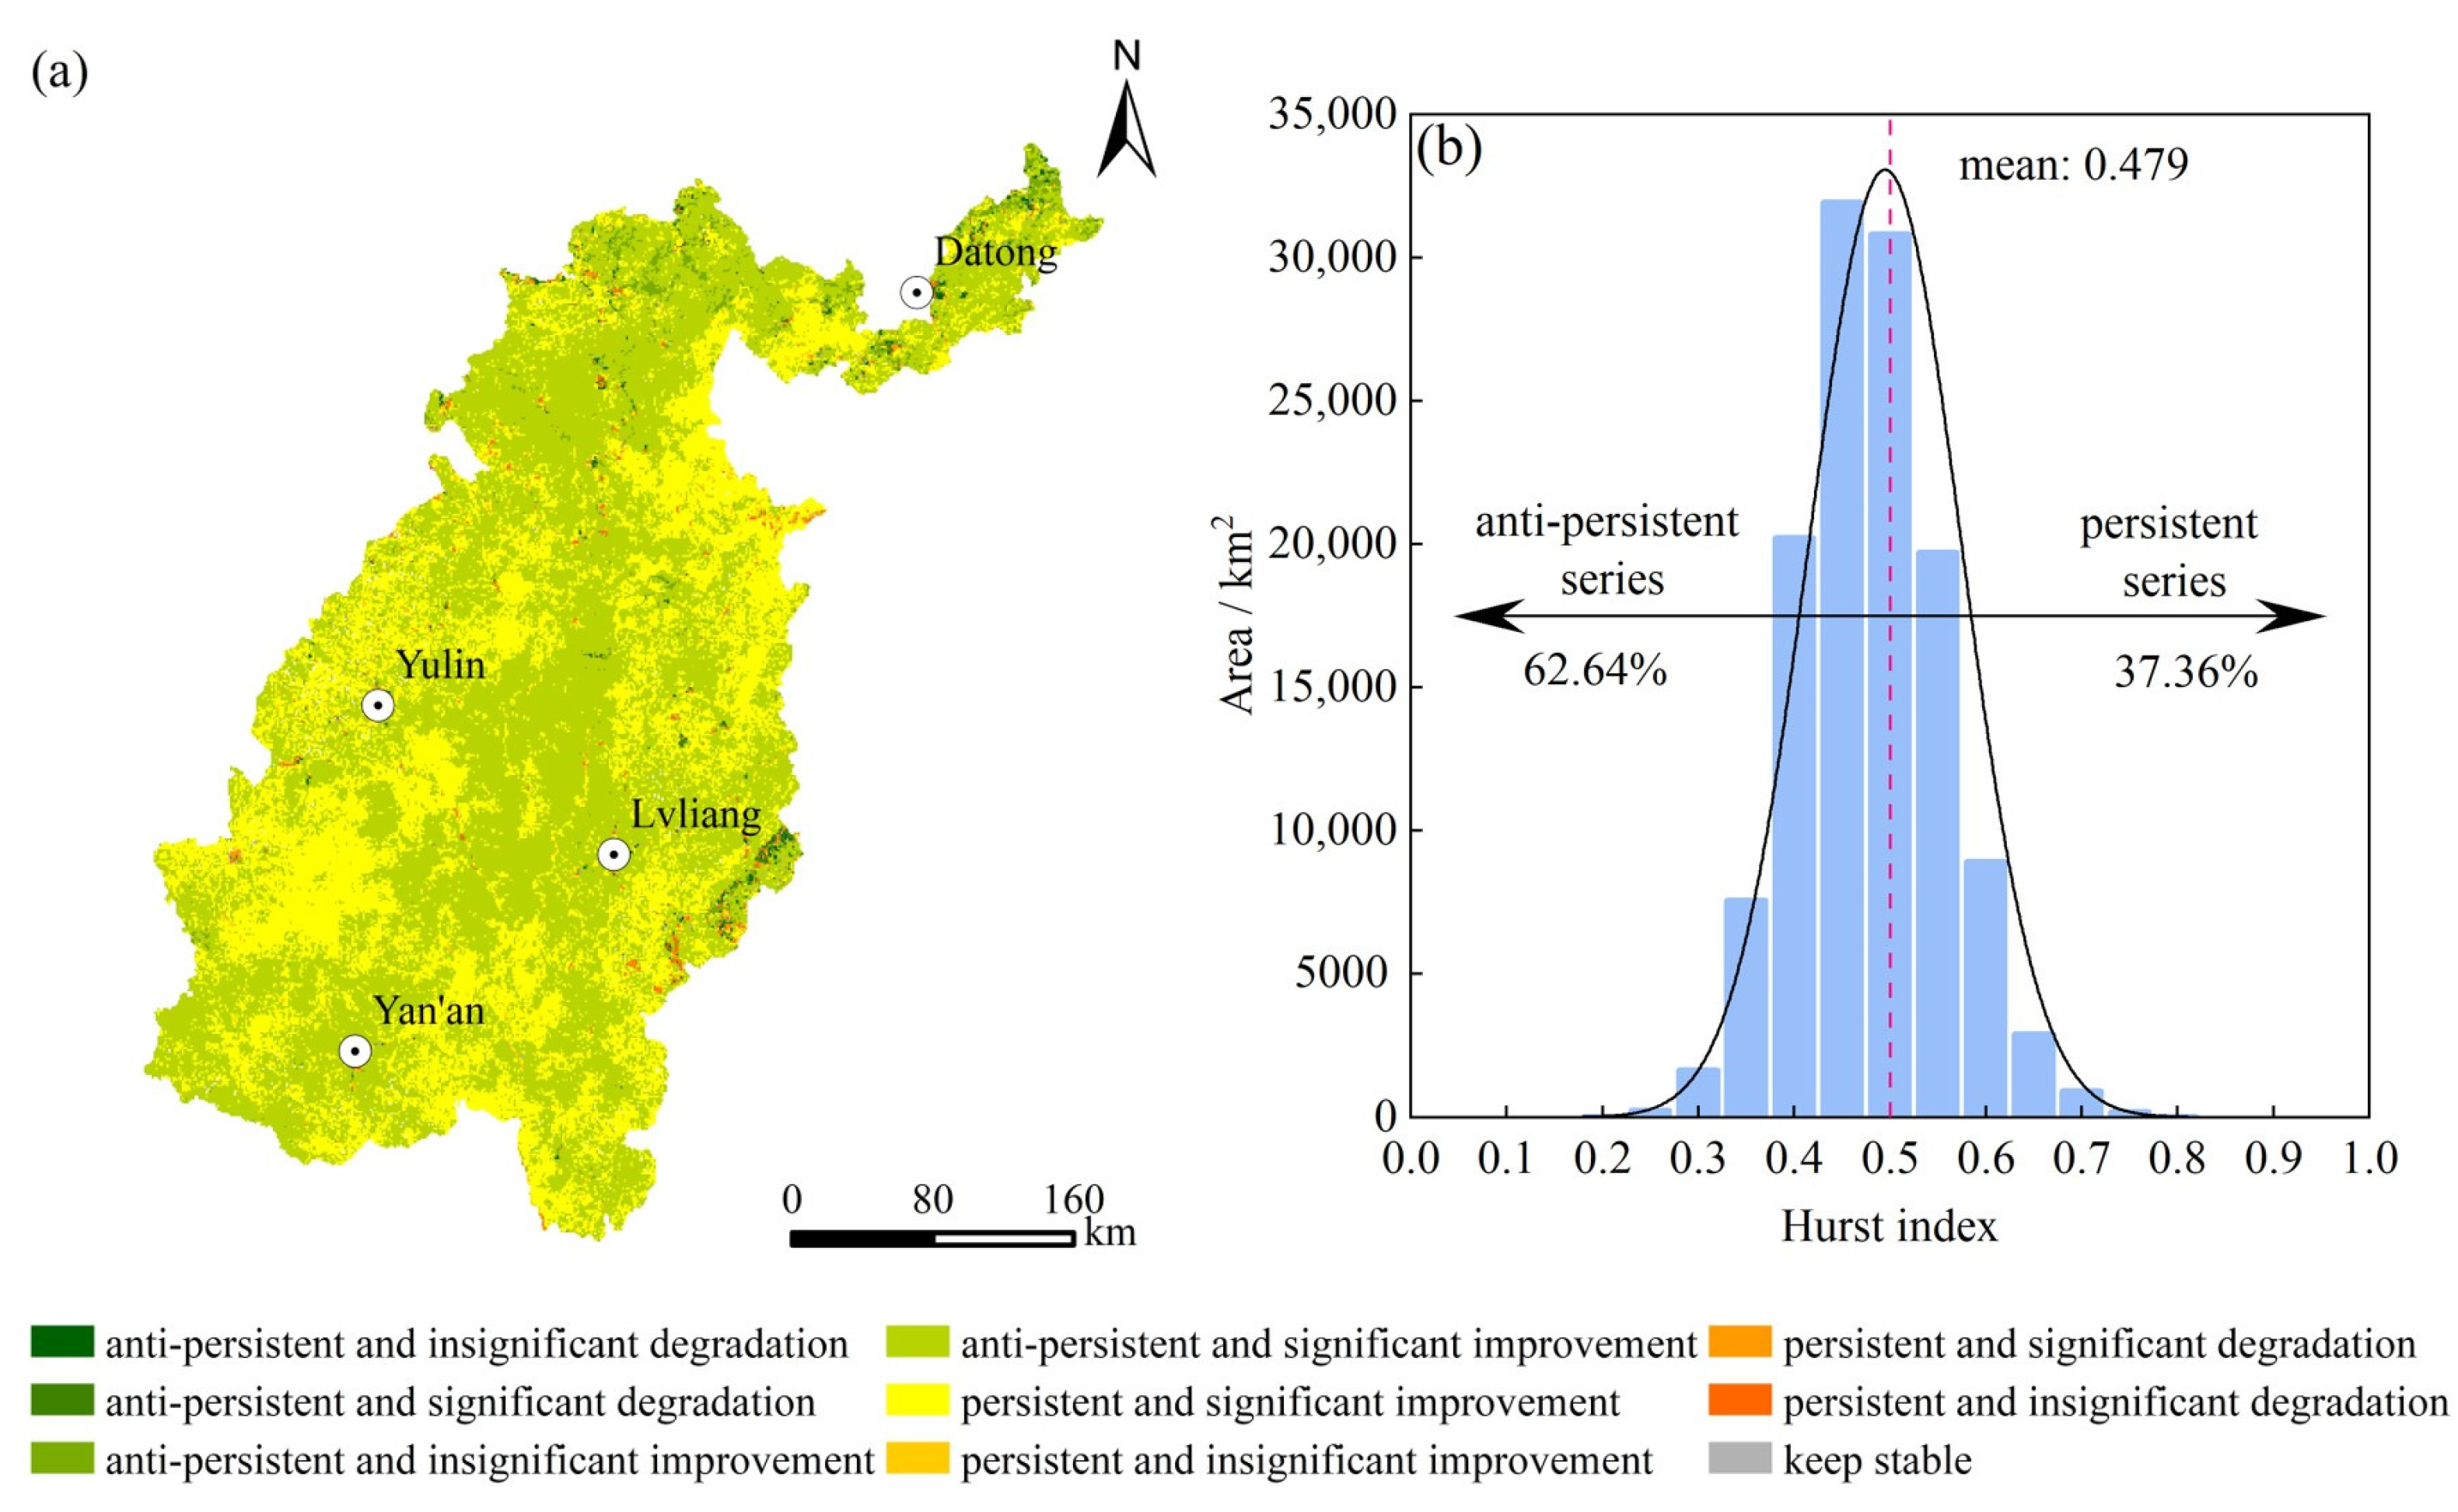
3.3. Future NDVI Trends

As for the persistence of NDVI trends, there were relatively few areas with persistent change, accounting for 37.36% (Figure 8). These areas were mainly concentrated in western Yulin, northeastern Yan’an, and eastern Lvliang, with persistent and significant improvement (35.25%) > persistent and insignificant improvement (1.30%) > persistent and insignificant degradation (0.49%) > persistent and significant degradation (0.22%) > remaining stable (0.10%). The regions with H values lower than 0.5, that is, the anti-persistence change trend, were widely distributed, accounting for 62.64%, mainly in southwestern Yan’an, eastern Yulin, western Lvliang, and Datong. This indicated that NDVI changes in these regions were affected by natural and anthropogenic factors. Thus, vegetation growth is not persistent and requires further strengthening of environmental protection work.

3.4. Temporal Variation of Driving Factors

There was no change in elevation (X5), slope (X6), vegetation type (X10), soil type (X11), or aspect (X12), so precipitation (X1), annual temperature (X2), potential evapotranspiration (X3), relative humidity (X4), land use type (X7), population density (X8) and GDP (X9) are shown in Figure 9.
From 1998 to 2019, annual precipitation (X1) showed a significant increasing trend (p < 0.05) at a rate of 3.508 mm/year and mean annual temperature (X2) showed a non-significant increasing trend (p > 0.05) at a rate of 0.007 °C/year (Figure 9a). Both potential evapotranspiration (X3) and relative humidity (X4) showed a non-significant decreasing trend (p > 0.05) (Figure 9b). From 2000 to 2015, the area of cropland and unused land decreased by 1471 km2 and 168 km2, respectively, the area of forest land and construction land increased by 1083 km2 and 963 km2, respectively, and there were only slight changes in the grassland and water areas (X7, Figure 9c). Population density (X8) and GDP (X9) increased substantially (Figure 9d).

3.5. Effects of Different Factors on the Spatial Variation of NDVI

3.5.1. Factor Detection

The q values obtained by factor detection are shown in Figure 10. All factors significantly affected the NDVI (p < 0.01). The average q values were ranked as follows: annual precipitation (X1) > relative humidity (X4) > vegetation type (X10) > potential evapotranspiration (X3) > land-use type (X7) > elevation (X5) > soil type (X11) > slope (X6) > mean annual temperature (X2) > GDP (X9) > population density (X8) > aspect (X12). The q values of X1, X4, and X10 were all greater than 0.3; thus, X1, X4, and X10 were key impacting factors. The q values of elevation (X5), slope (X6), and aspect (X12) were less fluctuating in typical years, with values ranging from 0.20–0.28, 0.14–0.16, and 0–0.01, respectively, mainly because elevation, slope and aspect did not change much in the period. The q value of land use type among human factors for NDVI was relatively high, ranging from 0.23–0.26. Generally, the annual precipitation (climatic factors), vegetation type (other environmental factors), and land use type (human factors) have a decisive influence on NDVI.

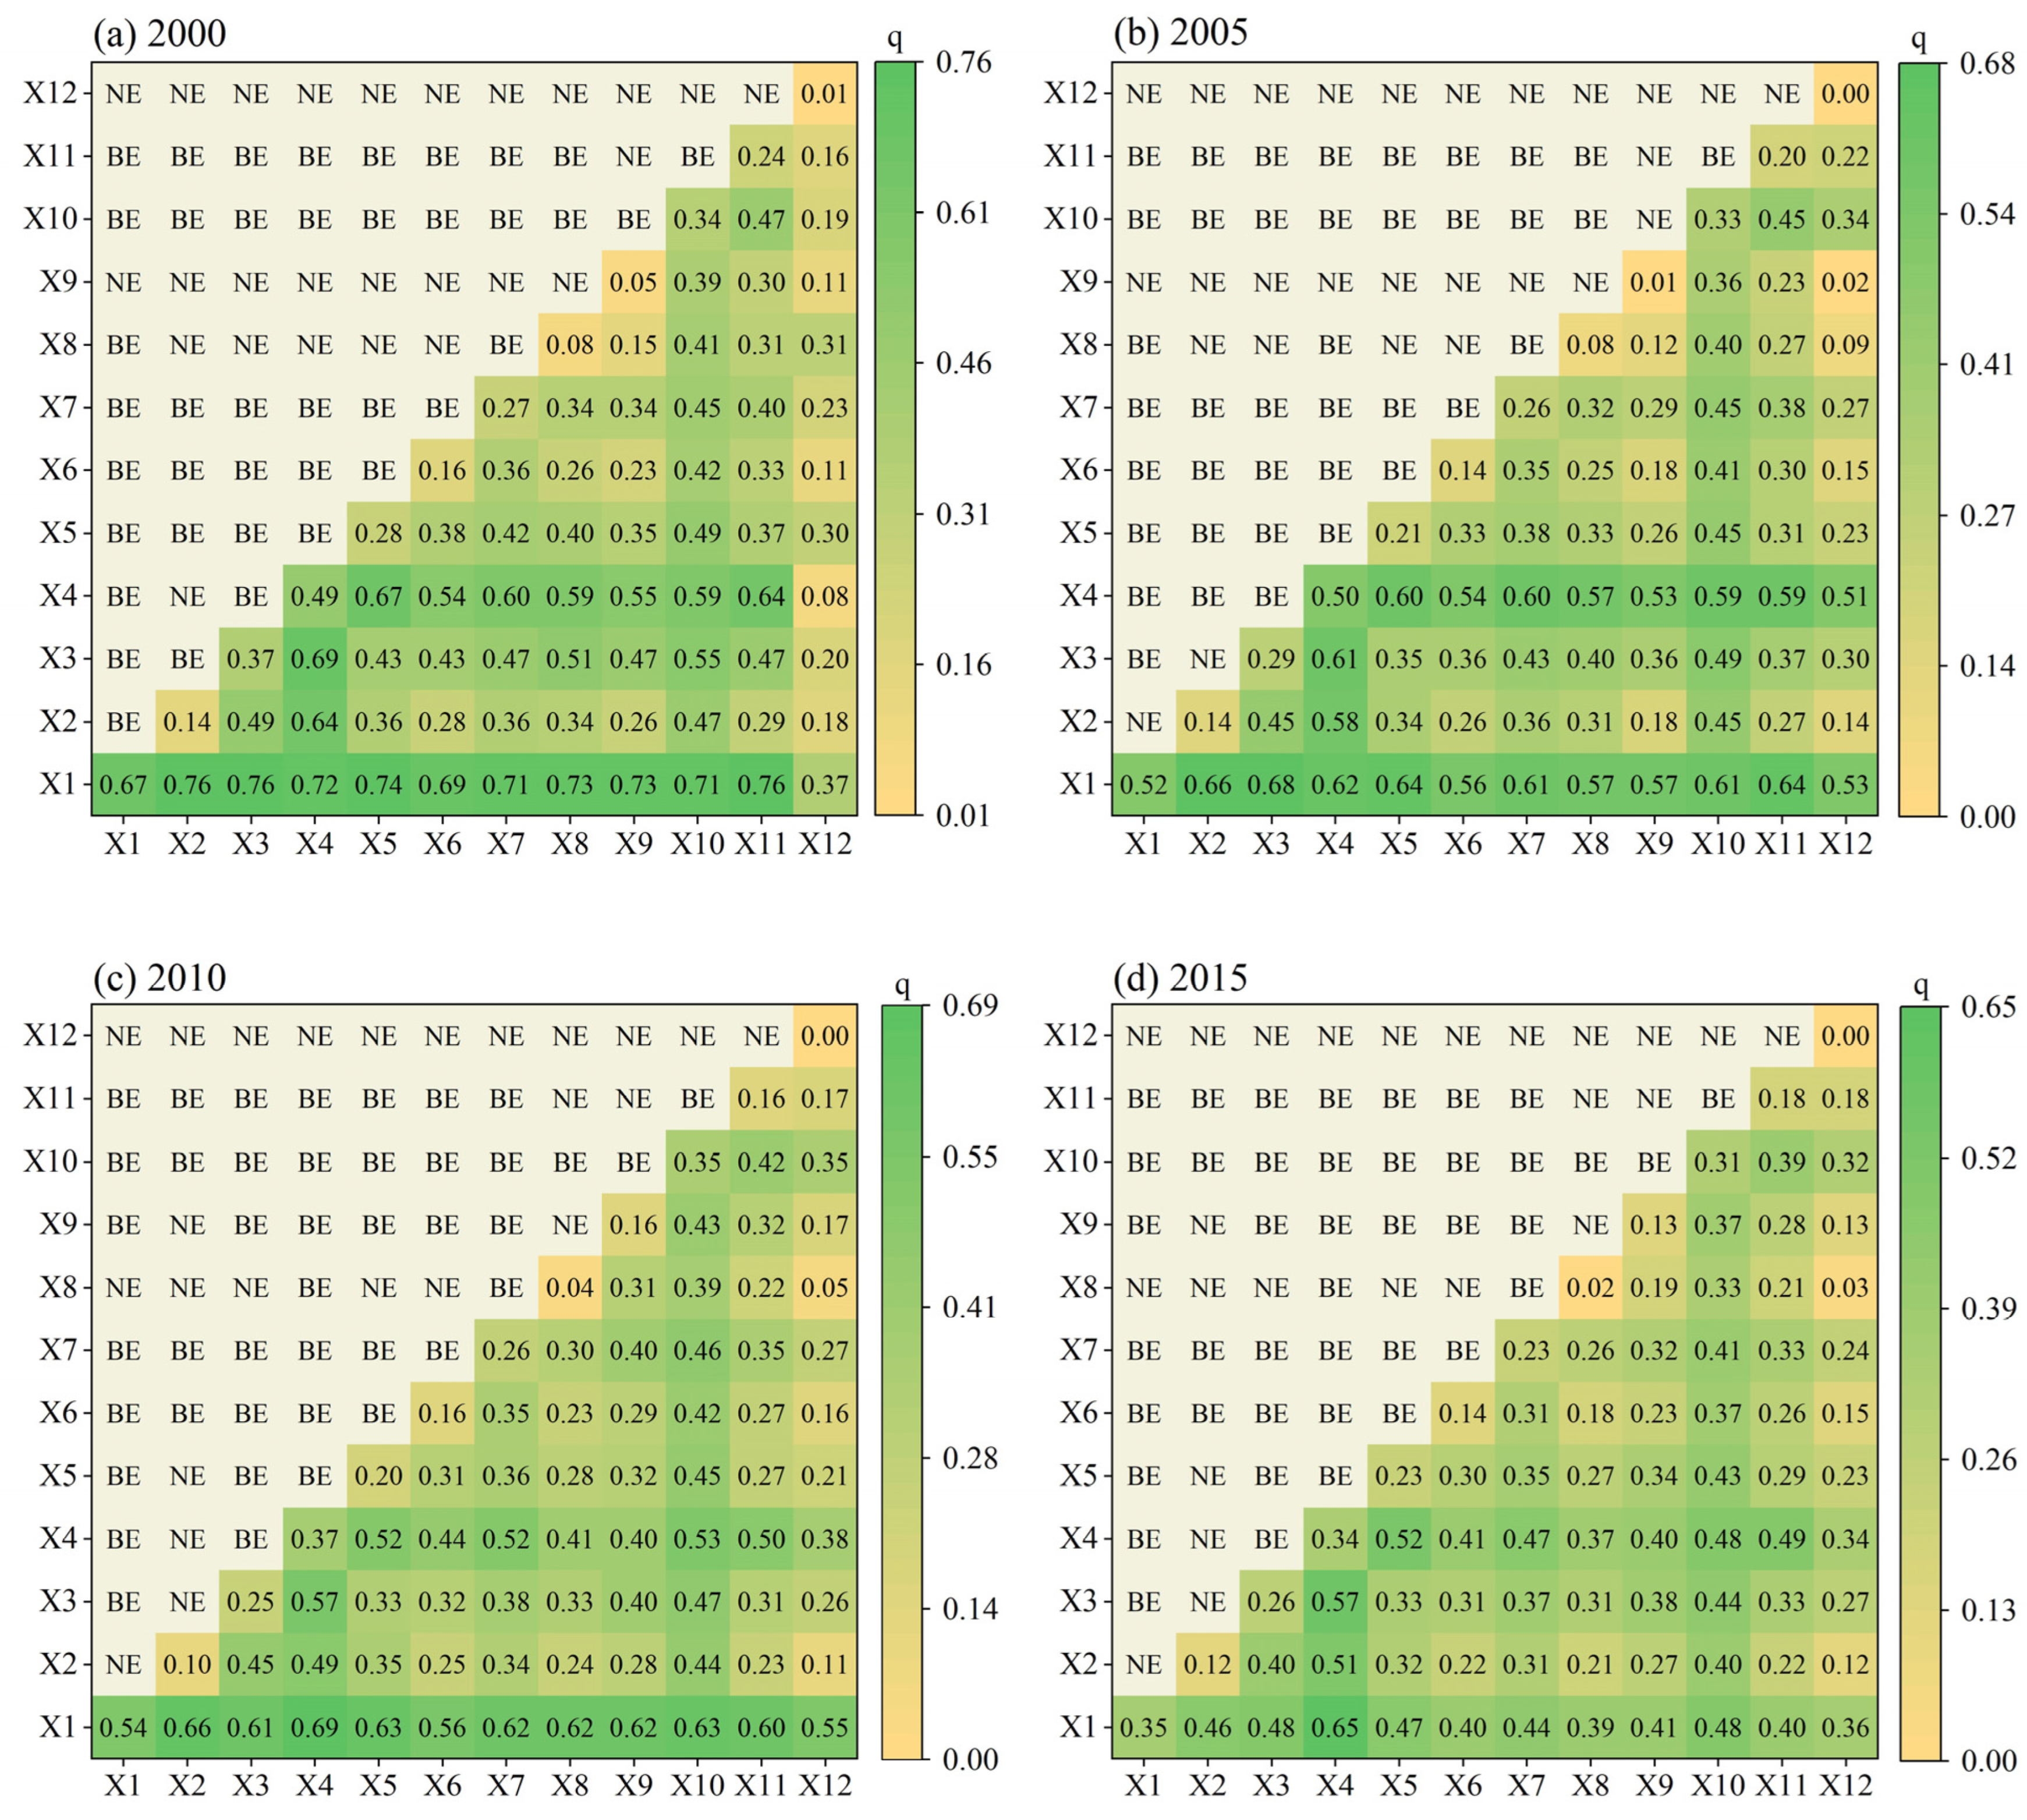
3.5.2. Interaction Detection

Interaction detection shows that the influence of each driver interaction was significantly greater than the independent effect, and its interaction showed dual-factor or non-linear enhancement (Figure 11). Meteorological factors, such as annual precipitation (X1) and relative humidity (X4), significantly influenced the NDVI values. Among the interaction detection results, annual precipitation (X1) had the largest q value for interaction with other factors, and the highest interaction was between relative humidity and annual precipitation, with q reaching 0.62–0.72. Although the q value for the single-factor effect of population density (X8) was only 0.02–0.08, its interaction value increased significantly up to 0.18–0.73 when combined with other factors. The single-factor effect of aspect (X12) has a q value of only 0–0.01, but when combined with annual precipitation (X1), the interaction value can reach 0.36–0.55.

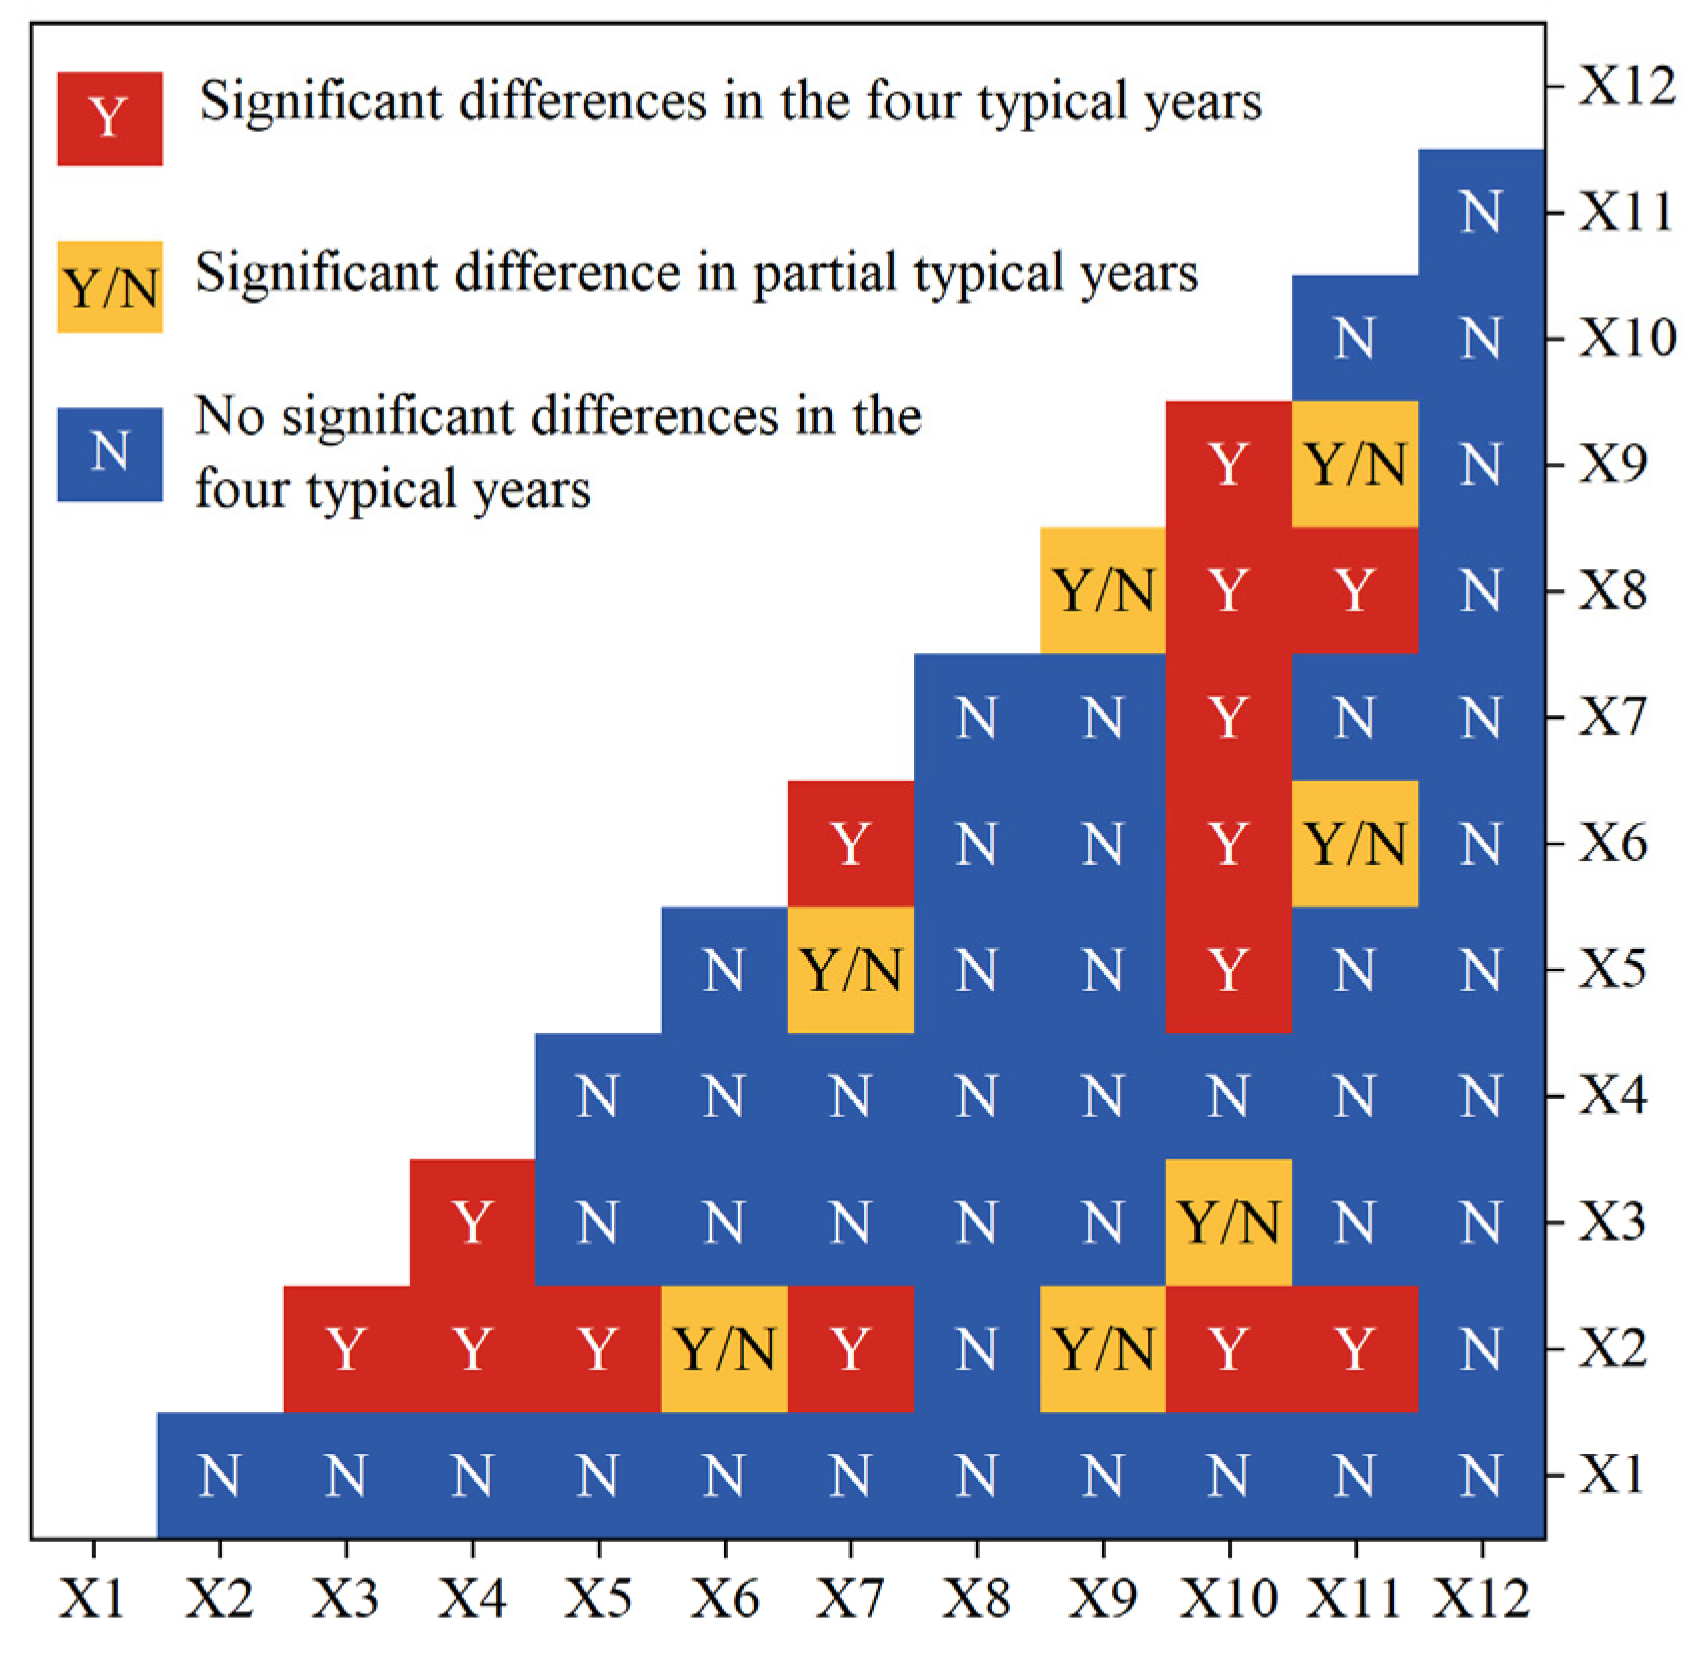
3.5.3. Significant Differences among NDVI Drivers

The ecological detection results for four typical years (p < 0.05), 2000, 2005, 2010, and 2015, were obtained based on the F-test (Figure 12). No significant differences were observed between annual precipitation (X1) or aspect (X12) and other factors, and there were significant differences between relative humidity (X4) and annual mean temperature (X2) or potential evapotranspiration (X3). No significant differences were observed between relative humidity and other factors. The relationships between slope (X6) and mean annual temperature (X2), GDP (X9) and mean annual temperature (X2), vegetation type (X10) and potential evapotranspiration (X3), land use type (X10) and elevation (X5), soil type (X11) and slope (X6), population density (X8) and GDP (X9), and GDP (X9) and soil type (X11) were significantly related only in some years.

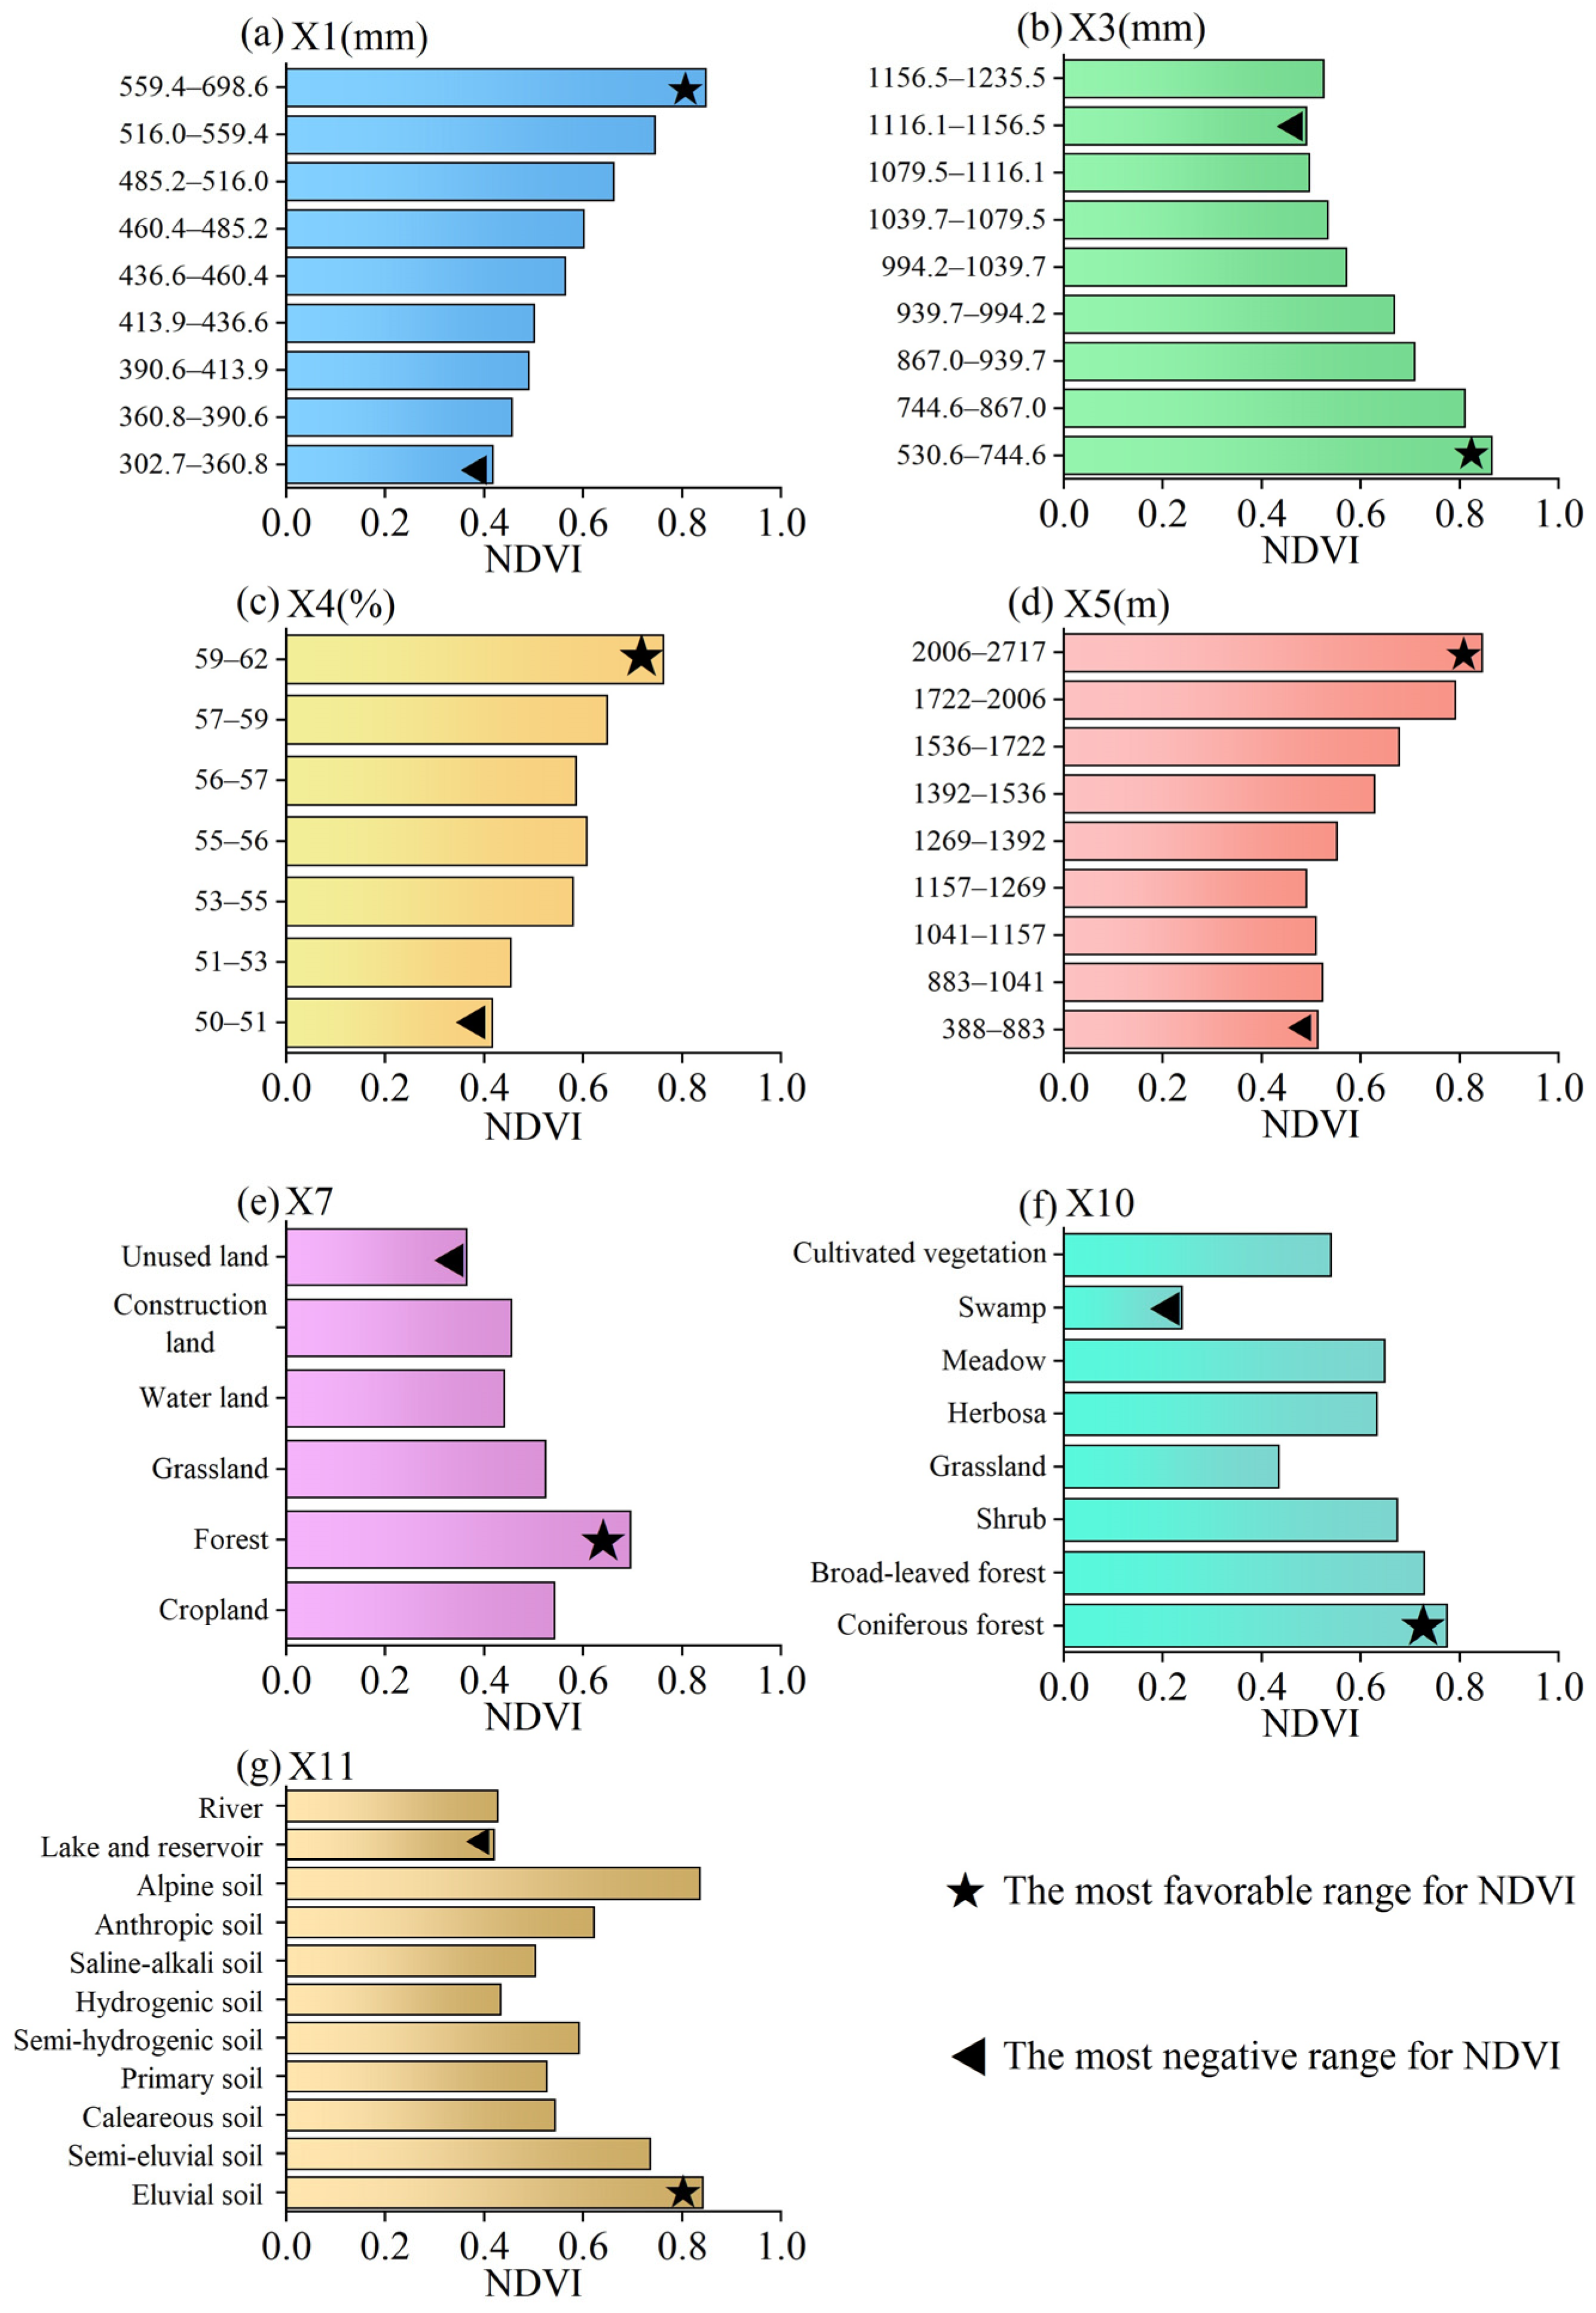
3.5.4. Appropriate Range or Type of Each NDVI Driver

Due to the small q values of mean annual temperature (X2), slope (X6), population density (X8), and GDP (X9) and the uncertainty of the significance of ecological detection, their impacts on NDVI were weak. The appropriate range or type of other indicators were determined by risk detection using the t-test (p < 0.05) and are shown in Table 4 and Figure 11.
Among the climatic factors, the mean NDVI increased with increasing annual precipitation (Figure 13a) and relative humidity (Figure 13c). When the annual precipitation is 559.4–698.6 mm, and the annual relative humidity is 59%–62%, the maximum NDVI reaches 0.848 and 0.762, respectively, indicating that higher precipitation and relative humidity can promote vegetation growth. In contrast, the average NDVI first decreased and then increased rapidly as potential evapotranspiration increased (Figure 13b) and reached a maximum of 0.865 at the potential evapotranspiration of 530.6–744.6 mm.
Among the topographic and other environmental factors, the average NDVI did not change with an elevation of less than 1269 m. However, with an elevation greater than 1269 m, the NDVI tended to be greater with increased elevation (Figure 13d), and the average NDVI reached the maximum (0.845) at an elevation of 2006–2717 m. Thus, a higher elevation is more fit for vegetation growth. The vegetation type (Figure 13f) with the highest NDVI was coniferous forest, and the soil type (Figure 13g) was eluvial soil.
Among the human factors, NDVI reached the maximum (0.696) when the land use type (Figure 13e) was forest land, followed by 0.542 when it was cropland, and the minimum value of 0.364 was reached when the land use type was unused land.

4. Discussion

4.1. Explanation for NDVI Spatial Distribution

The vegetation cover in the study area from 1998 to 2019 was dominated by class III (0.4–0.6), with NDVI decreasing from southeast to northwest. The mean NDVI value of the Loess Plateau from 1998 to 2019 was 0.5393 (Figure 14). The Loess Plateau can be divided into four ecological divisions [18], and analysis of NDVI values for each ecological partition of the Loess Plateau revealed that the NDVI of the earth-rocky mountainous and river valley plain region was the highest, with a multi-year NDVI mean value of 0.6719, followed by the loess sorghum gully region. The NDVI of the study area was lower, with a value of 0.5425. The NDVI values for each ecological partition showed a rising trend, which is consistent with the pattern of the Loess Plateau recorded by Dong et al. [30].
The NDVI value of the study area is high in the southeast and low in the northwest because the climatic and topographic conditions in the southeast are more conducive to vegetation growth. For example, annual precipitation, relative humidity, elevation, and soil type are all in the favorable range or type for vegetation growth. In addition, the land use type in the southeast is mainly forest, which makes the NDVI value in the southeast higher, whereas the northwest is the opposite.
The degraded vegetation cover areas are mainly situated in the city of Yulin, Yan’an, and Lvliang, which have seen relatively rapid urban development. These areas have large population concentrations and large-scale urbanization. The latter is exemplified by the “Bulldoze Mountains to Build New City” project in Yan’an in 2012, which eradicated local vegetation and caused serious ecological and environmental concerns [31]. In addition, vegetation degradation occurred on the northwestern side of Yulin near the sandy land and agricultural irrigation region, which is related to the construction of agricultural water irrigation facilities. This indicates that human activities can positively affect vegetation cover, mainly through ecosystem recovery projects [32]. By contrast, human activities also cause vegetation degeneration due to economic development and urban expansion [33].

4.2. Analysis of NDVI Drivers

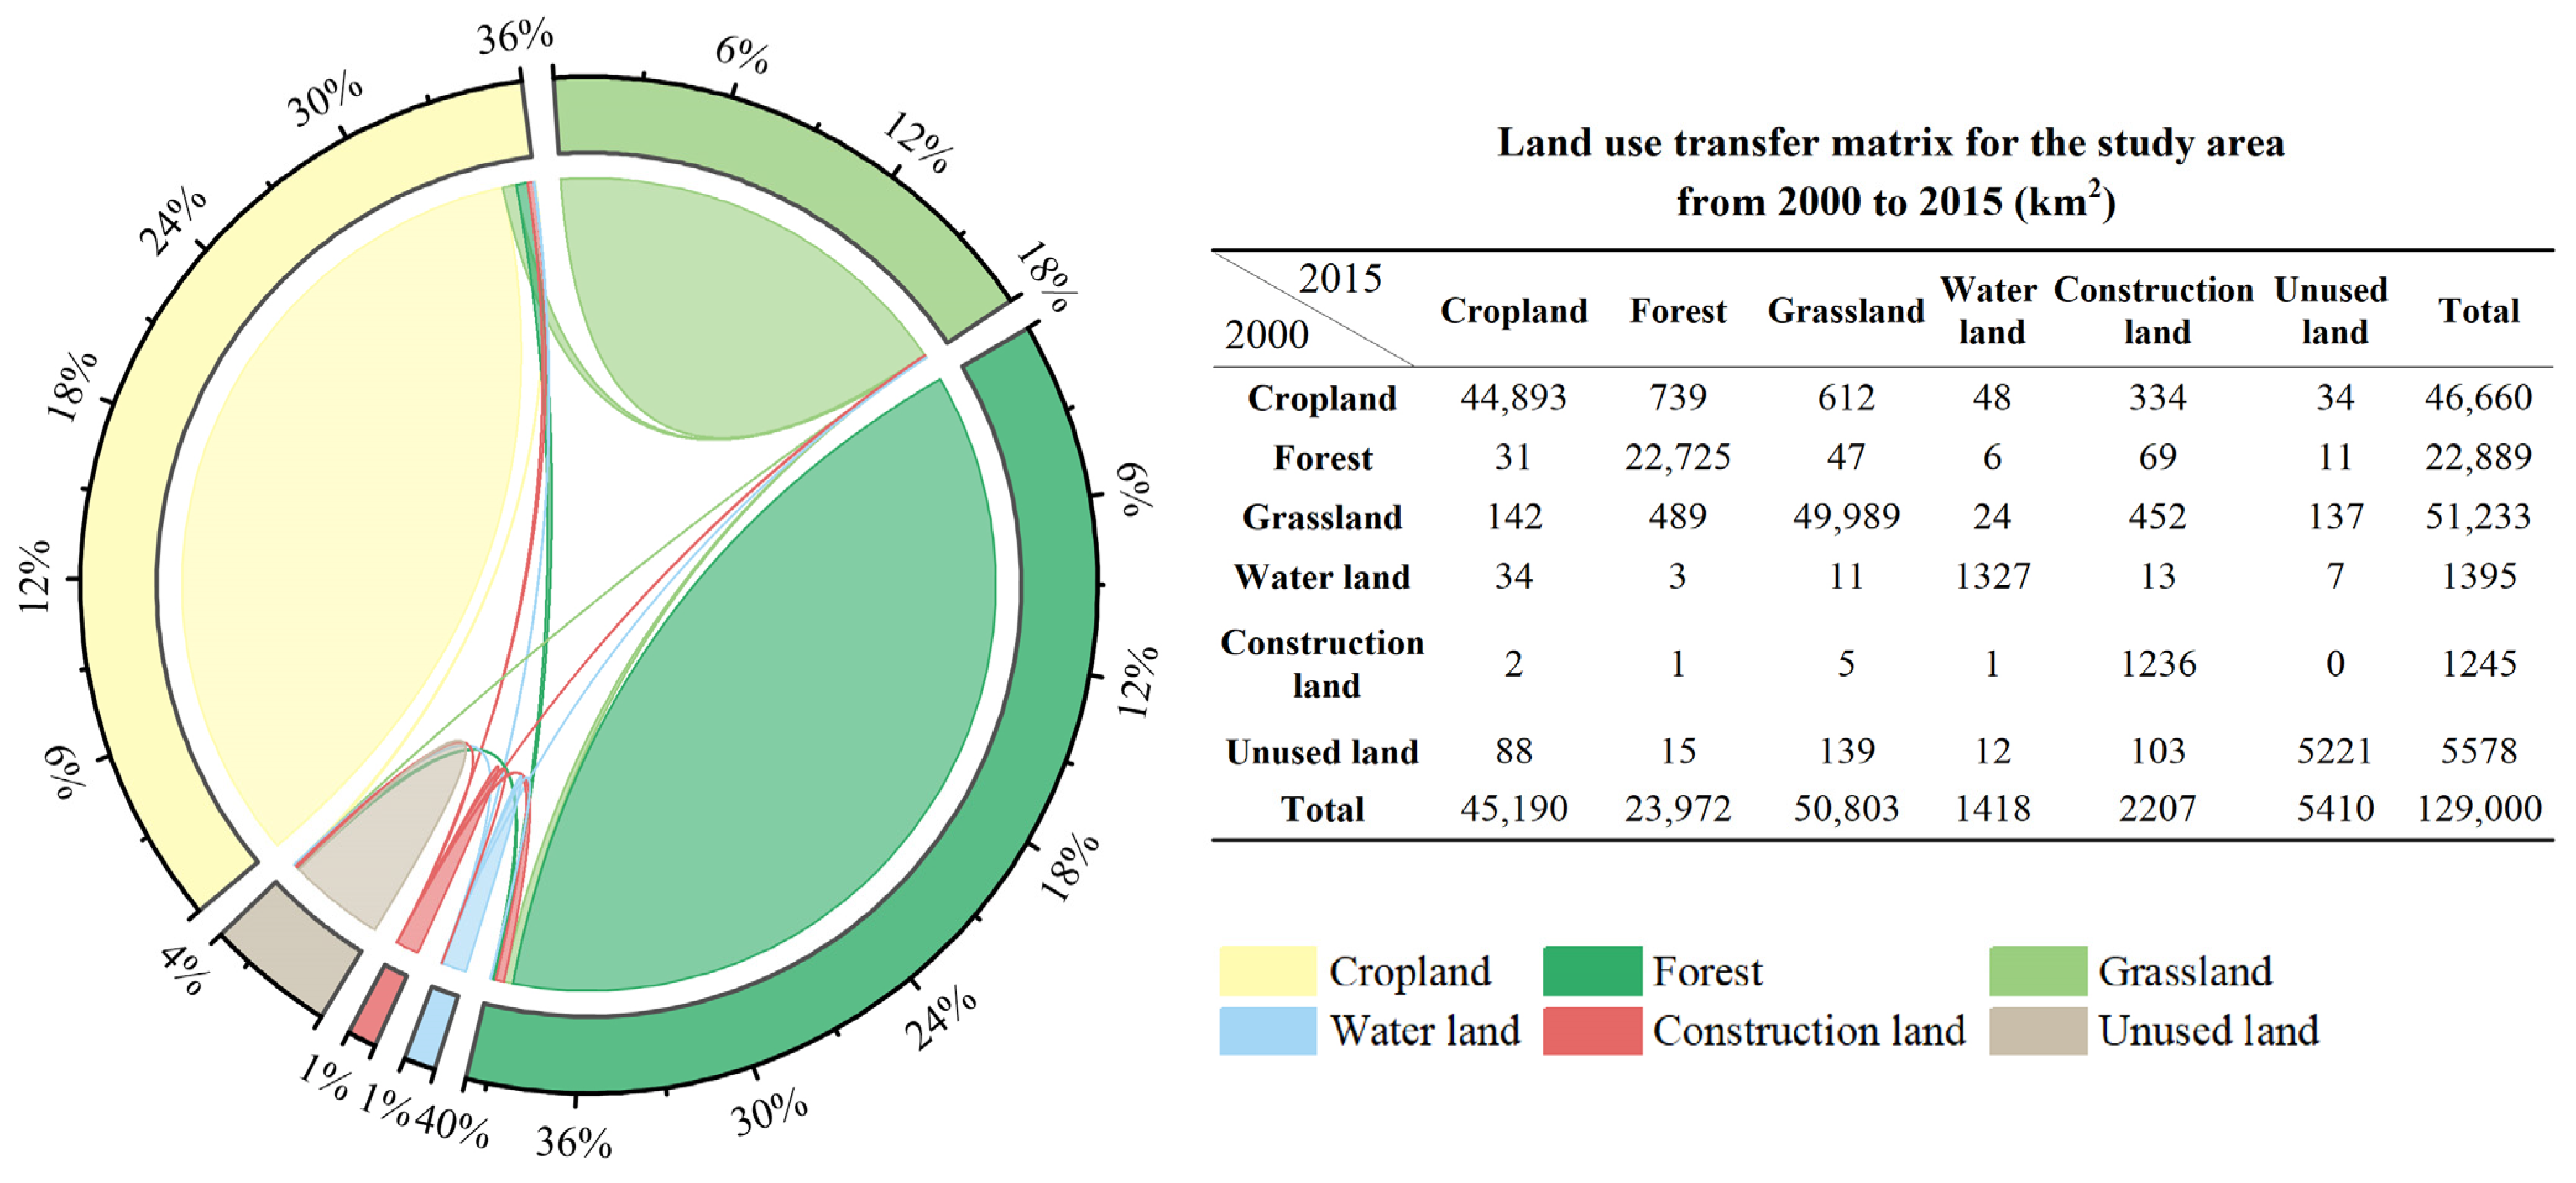
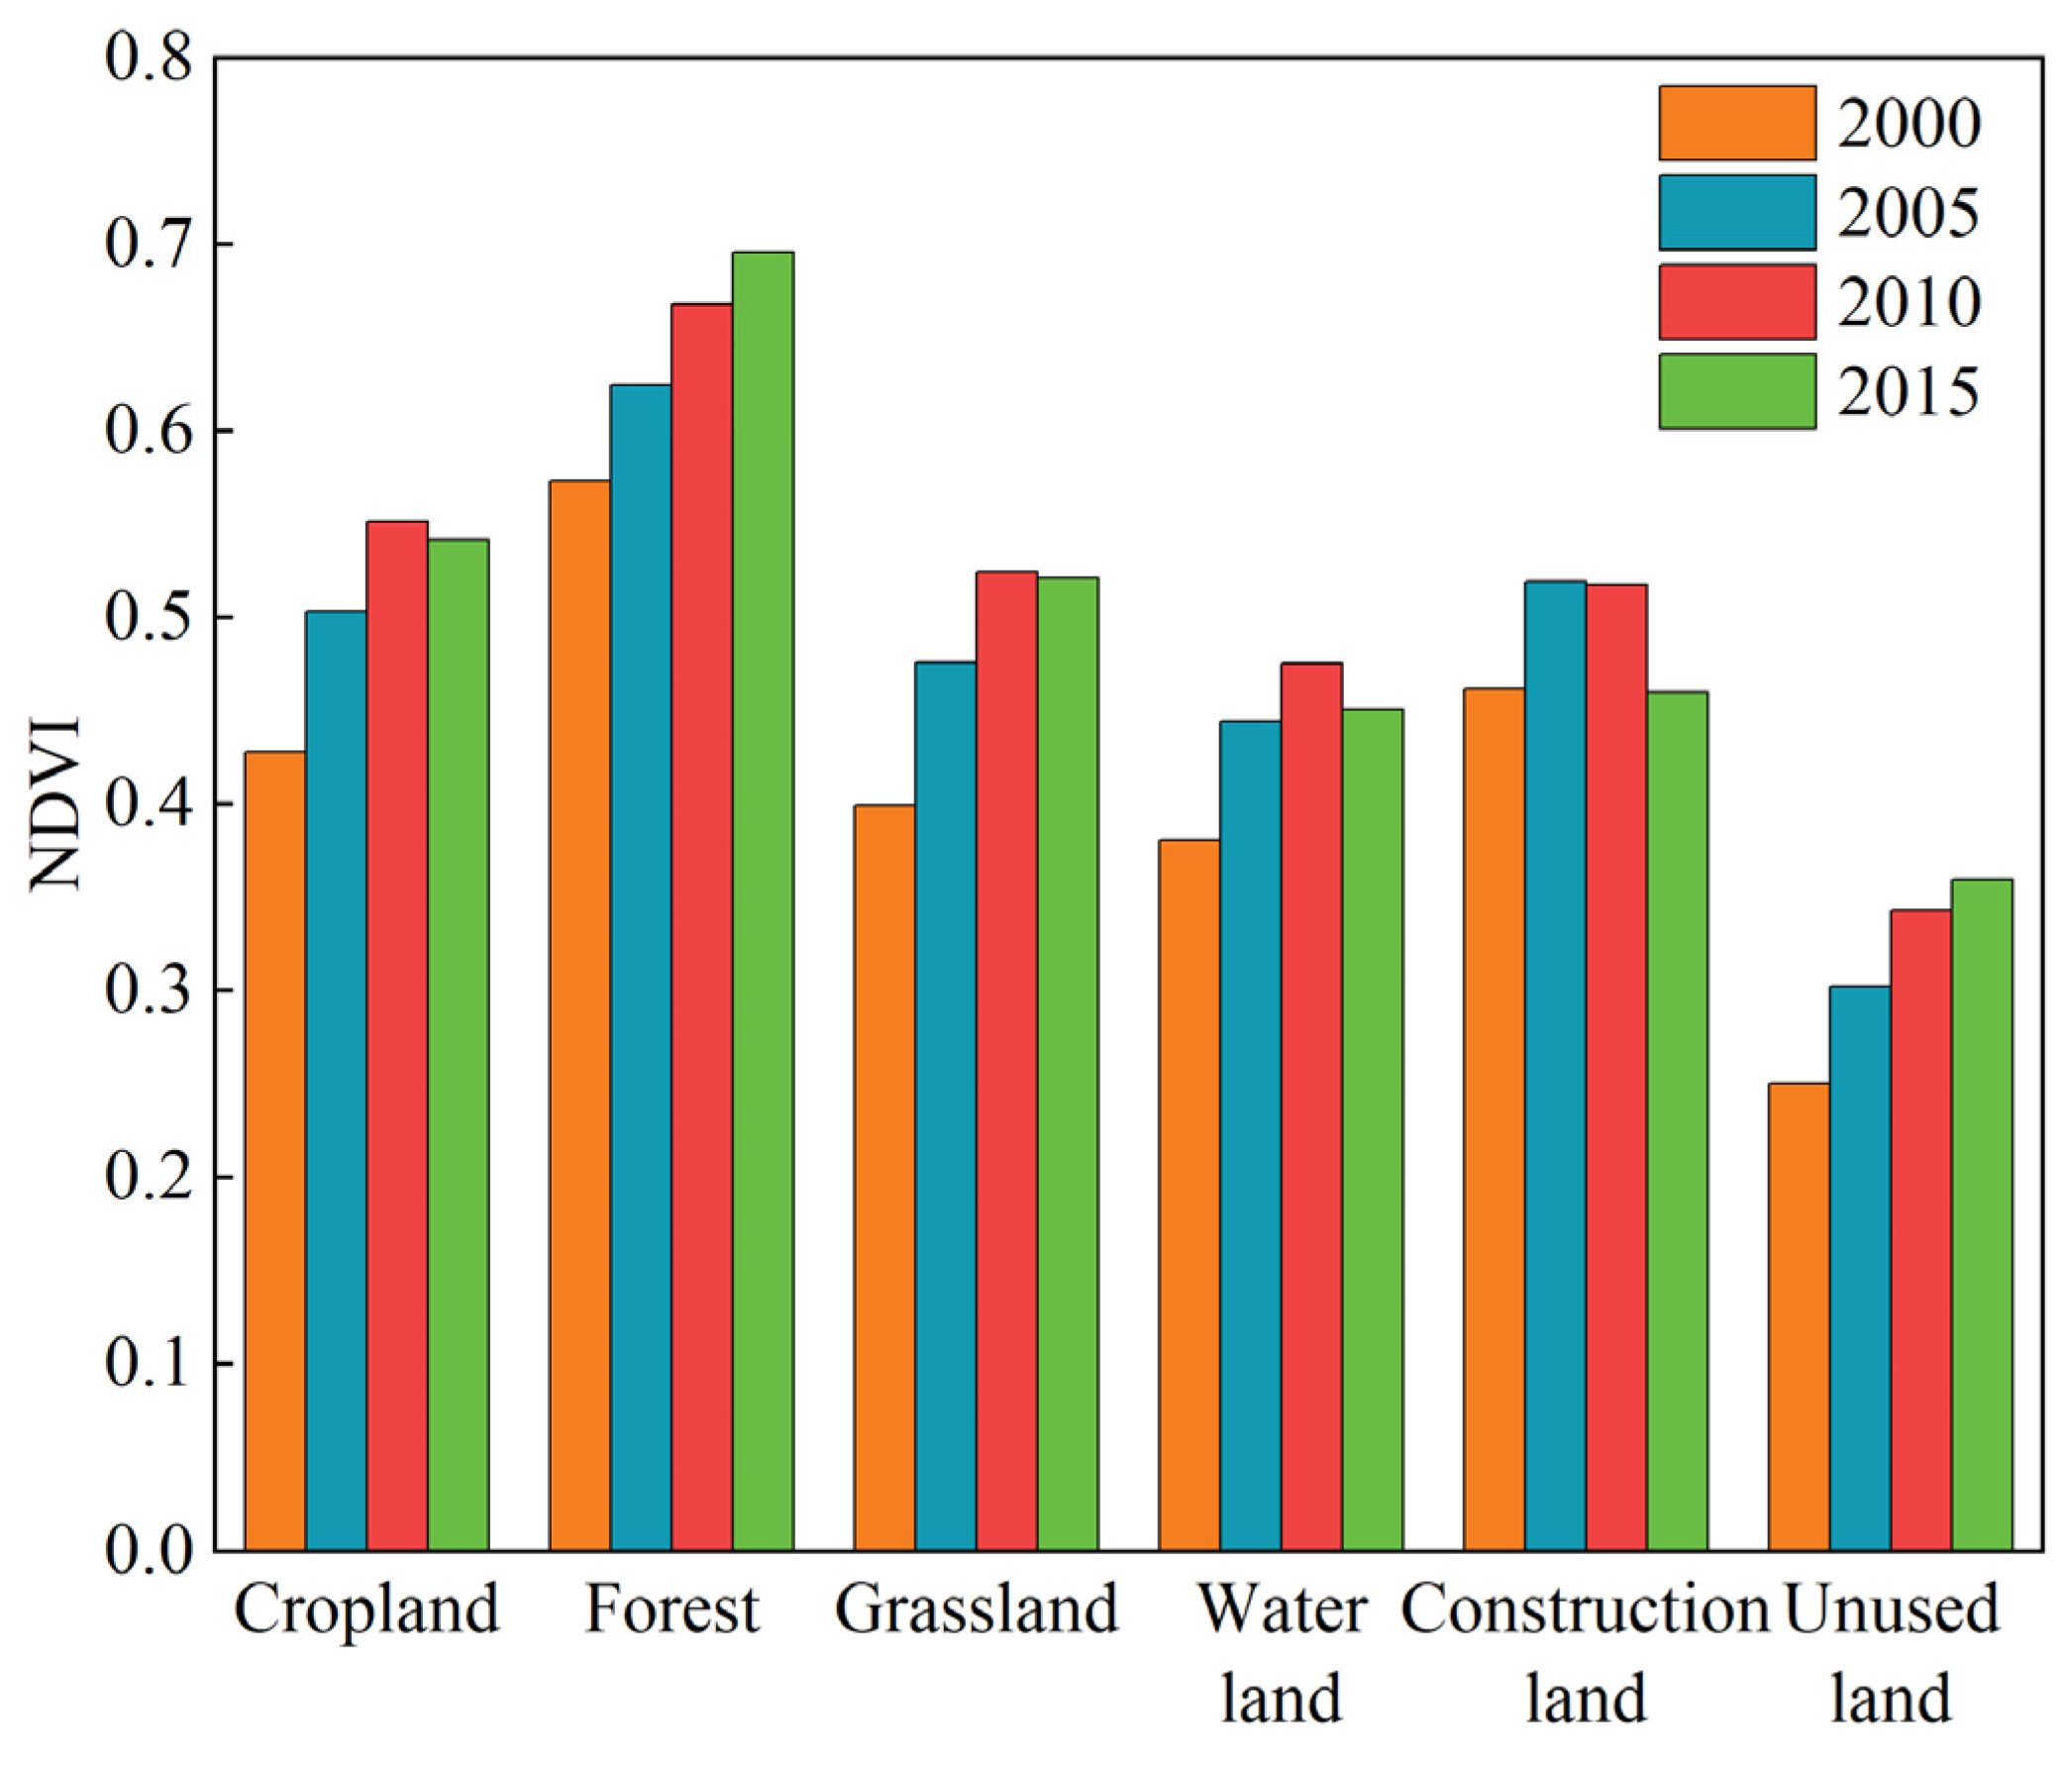
4.2.1. Analysis of Land Use Drivers on NDVI

The study area is mainly occupied by sloping cropland, which is prone to soil erosion [34]. In fact, it is one of the major soil-water-loss areas in China. Since 1999, it has been a targeted area for forest and grassland restoration from cropland to woodland or grassland. From 2000 to 2015, the conversions of land use types in the study area were more frequent (Figure 15). A total of 3609 km2 of land use types were converted, accounting for 2.80% of the total area. The conversion of cropland was the highest among other land use types, with a total of 1767 km2 converted during the 15-year period, accounting for 48.96% of the land use conversion area. The conversion of cropland to forest is the largest, with an area of 739 km2, accounting for 41.82% of the area converted from cropland, followed by the conversion to grassland, with 612 km2, accounting for 34.63% of the area converted from cropland. It indicates that the various ecological restoration projects carried out in the study area have had a significant effect.
The mean NDVI values of different land use types for four typical years, 2000, 2005 2010, and 2015, are shown in Figure 16. Forest had the highest NDVI value with a mean value of 0.64, followed by cropland with a mean value of 0.51, and the smallest NDVI value was unused land with a mean value of 0.31. The NDVI values of cropland, forest, grassland, and unused land all showed an increasing trend from 2000 to 2015.
In general, there are some differences in NDVI values of different land use types, and changes in land use types can affect changes in vegetation cover [35]. For example, deforestation, overgrazing, and urban expansion can lead to a decrease in vegetation cover, whereas rational land use can improve vegetation cover.

4.2.2. Analysis of Topography Drivers on NDVI

NDVI changed slightly in lower elevation areas. As altitude increased, the NDVI showed a rapid increase, with the highest NDVI value at the highest elevation. Elevation affects vegetation cover by changing the hydrothermal conditions [36]. Within a certain altitude range, NDVI increases with an increase in altitude, whereas high elevations with lower temperatures, poor soil quality, and undulating terrain can negatively impact vegetation growth [10,37]. However, the elevation of the study area ranged from 388 m to 2717 m, with a mean value of 1238 m, which is relatively low. Therefore, the risk detection results show that NDVI did not show a downward trend at higher elevations (Figure 13d).
The greater the slope, the easier soil is lost, and the water and nutrients are difficult to maintain, which will lead to a lower vegetation cover. The different slope aspect results in different intensity and duration of light received, the distribution of moisture, the texture, thickness and fertility of the soil, and has a great influence on the growth and distribution of vegetation. However, the q values of both slope and aspect obtained in this study were small, which is similar to the studies of many previous scholars [21,28,30].
In addition to influencing environmental conditions such as meteorology, moisture and soil, topographic factors also determine the extent and intensity of human activities, thus affecting vegetation cover. This further shows that the effects of each factor are not independent, and it is especially important to study the interaction of each factor.

4.2.3. Analysis of Climatic and Other Environmental Drivers on NDVI

Precipitation is the most important factor affecting vegetation cover in the study area. This is consistent with previous studies showing that vegetation NDVI and precipitation are well correlated in the Loess Plateau, with a significant one-month lag correlation between growing season NDVI and precipitation [38]. In addition to precipitation, climatic factors such as temperature and relative humidity also have important effects on vegetation cover. However, the loess hilly and gully region is located in a semi-arid climate zone with low precipitation and high evapotranspiration, resulting in insufficient moisture for vegetation [39], and moisture conditions limit the effects of temperature and relative humidity on vegetation cover.
Different vegetation types have different responses to soil hydrothermal conditions due to differences in physical conditions. Risk detection showed that the highest mean NDVI values were 0.774 and 0.842 for coniferous forest vegetation and eluvial soil types, respectively. Coniferous forest and eluvial soil are concentrated in the southeast of the region. Here, the elevation is higher, 1722–2717 m, the area is less disturbed by humans, and the land use type is prioritized to forest. Unlike many other vegetation types, coniferous forests have needle-shaped leaves, which reduce transpiration and are cold- and drought-tolerant. Eluvial soil has high organic and moisture content, favoring the retention of soil nutrients and vegetation growth. The use of water and heat by vegetation in more arid areas depends largely on soil and vegetation types [40], which further explains the study finding that the interaction of vegetation and soil types had the dominant impact on vegetation.
Vegetation responds variously to changes in external factors under different environmental conditions [41,42]. Specific vegetation reconstruction measures suitable for regional conditions should be proposed for environmental recovery, considering regional vegetation types, soil conditions, and water and heat conditions [43]. This study found that rapid urbanization can cause damage to vegetation in the surrounding area. Therefore, the construction of green infrastructure should be emphasized along with urban construction to alleviate the pressure of urban development on vegetation degradation, ensuring healthy and sustainable regional development.

5. Conclusions

The spatial–temporal variations of NDVI in the loess hilly and gully region of the Loess Plateau were analyzed, and the impacts of different potential factors on NDVI were investigated. It can be concluded that:
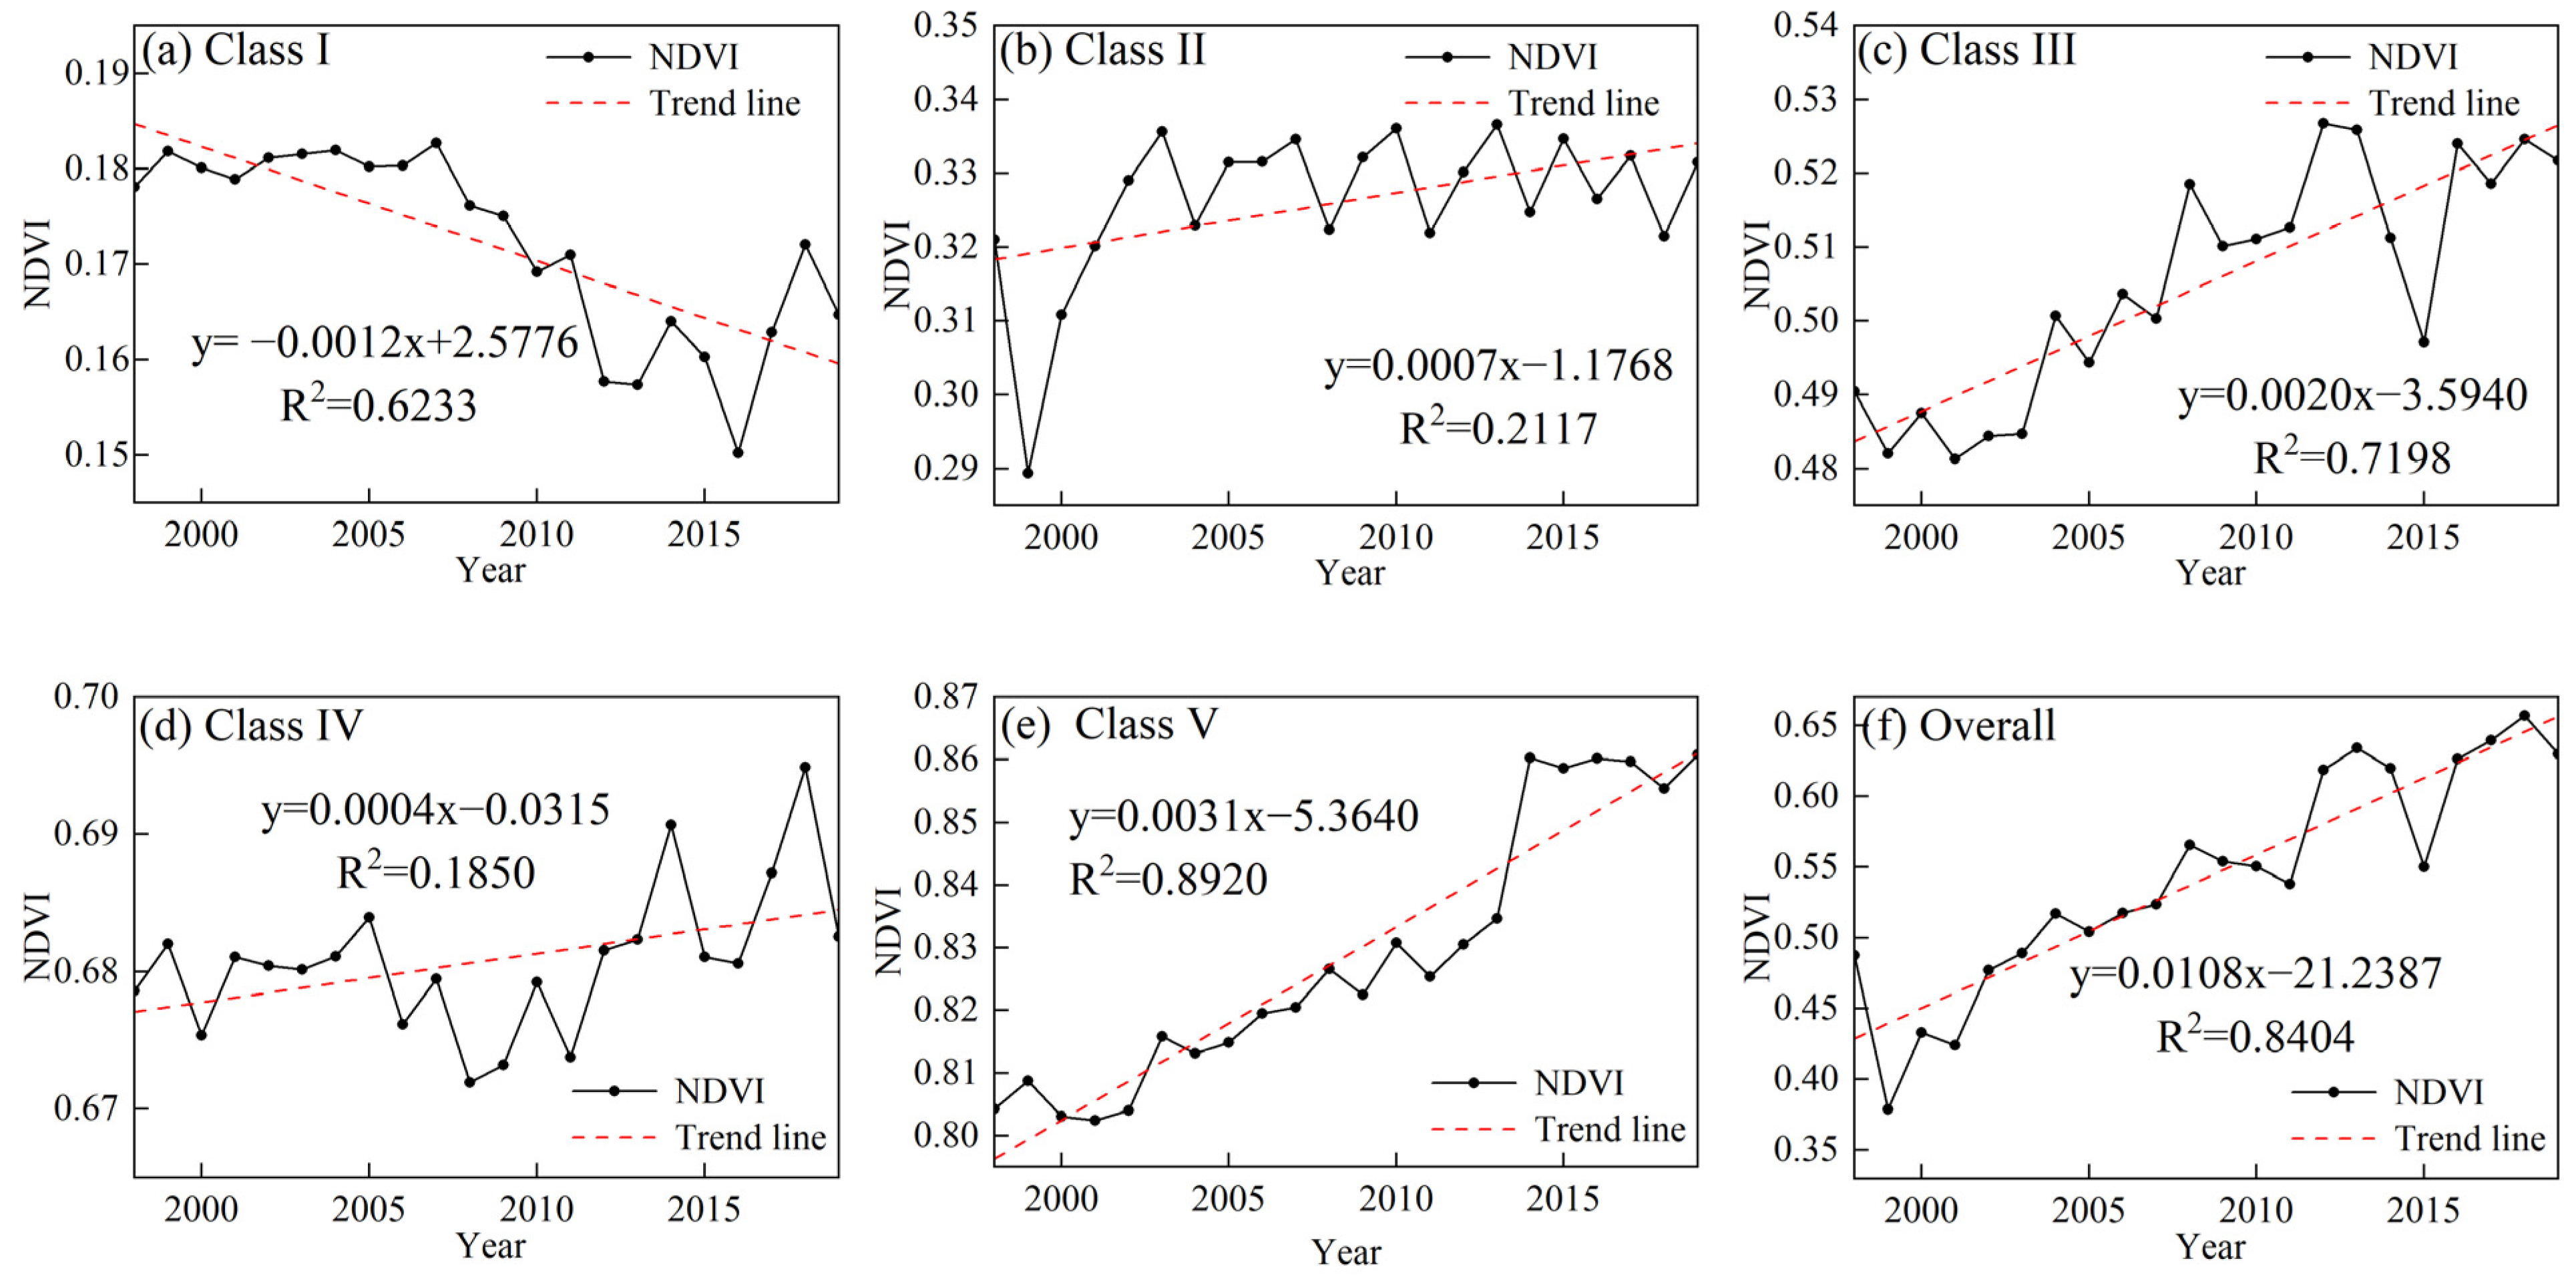
  • The NDVI showed a fluctuating upward trend, with a rate of 0.0108/year and a multi-year average of 0.542. The NDVI values in 98.56% of the study area increased, whereas only 1.44% declined. The declining NDVI areas are mainly concentrated in the cities of Yulin, Yan’an, and Lvliang, where urban development is relatively rapid.
  • The vegetation cover has improved significantly over the last 20 years in 95.14% of the total area, which means that the study area’s ecological reconstruction was effective. However, the percentage of persistent vegetation improvement was relatively low, accounting for 37.36%.
  • The Geodetector model results show that annual precipitation and relative humidity were the primary factors among climatic factors leading to vegetation improvement. The influence of elevation is greater than that of slope and aspect among the topographic factors. Vegetation type had significant effects among other environmental factors. For human factors, land use type was the major driver.
  • There was a dual-factor and non-linear enhancement interaction between the drivers on NDVI, and the influence of the interaction was greater than the independent. The favorable ranges of annual precipitation, potential evapotranspiration, and relative humidity were 559.4–698.6 mm, 530.6–744.6 mm, and 59%–62%, respectively. The suitable elevation range was 2006–2717 m. The suitable land use type was forest land; the vegetation type was coniferous forest; and the soil type was eluvial soil.

Author Contributions

Conceptualization, Z.J., Y.L. and Z.W.; methodology, R.L, Y.L. and Z.J.; software, R.L. and P.L.; validation, P.L. and Z.W.; investigation, P.L., Y.C. and W.W.; writing—original draft preparation, Z.J. and R.L.; writing—review and editing, Z.J., Y.L. and Z.W. All authors have read and agreed to the published version of the manuscript.

Funding

This work was supported by the National Natural Science Foundation of China (42001033, 42272302), the Natural Science Basic Research Plan in the Shaanxi Province of China (2021JQ-237) and the Fundamental Research Funds for the Central Universities, CHD (300102293209).

Data Availability Statement

Not applicable.

Conflicts of Interest

The authors declare no conflict of interest.

References

  1. Afuye, G.A.; Kalumba, A.M.; Busayo, E.T.; Orimoloye, I.R. A bibliometric review of vegetation response to climate change. Environ. Sci. Pollut. Res. 2021, 29, 18578–18590. [Google Scholar] [CrossRef]
  2. Fu, G.; Sun, W.; Li, S.; Zhang, J.; Yu, C.; Shen, Z. Modeling Aboveground Biomass Using MODIS Images and Climatic Data in Grasslands on the Tibetan Plateau. J. Resour. Ecol. 2017, 8, 42–49. [Google Scholar] [CrossRef]
  3. Gong, Z.; Zhao, S.; Gu, J. Correlation analysis between vegetation coverage and climate drought conditions in North China during 2001–2013. J. Geogr. Sci. 2017, 27, 143–160. [Google Scholar] [CrossRef]
  4. Faour, G.; Mhawej, M.; Nasrallah, A. Global trends analysis of the main vegetation types throughout the past four decades. Appl. Geogr. 2018, 97, 184–195. [Google Scholar] [CrossRef]
  5. Mallick, J.; AlMesfer, M.K.; Singh, V.P.; Falqi, I.I.; Singh, C.K.; Alsubih, M.; Kahla, N.B. Evaluating the NDVI–Rainfall Relationship in Bisha Watershed, Saudi Arabia Using Non-Stationary Modeling Technique. Atmosphere 2021, 12, 593. [Google Scholar] [CrossRef]
  6. Yang, L.; Guan, Q.; Lin, J.; Tian, J.; Tan, Z.; Li, H. Evolution of NDVI secular trends and responses to climate change: A perspective from nonlinearity and nonstationarity characteristics. Remote Sens. Environ. 2021, 254, 112247. [Google Scholar] [CrossRef]
  7. Chen, X.; Yang, D.; Chen, J.; Cao, X. An improved automated land cover updating approach by integrating with downscaled NDVI time series data. Remote Sens. Lett. 2015, 6, 29–38. [Google Scholar] [CrossRef]
  8. Peng, W.; Kuang, T.; Tao, S. Quantifying influences of natural factors on vegetation NDVI changes based on geographical detector in Sichuan, western China. J. Clean. Prod. 2019, 233, 353–367. [Google Scholar] [CrossRef]
  9. Vorovencii, I. Applying the change vector analysis technique to assess the desertification risk in the south-west of Romania in the period 1984–2011. Environ. Monit. Assess. 2017, 189, 524. [Google Scholar] [CrossRef] [PubMed]
  10. Zhu, L.; Meng, J.; Zhu, L. Applying Geodetector to disentangle the contributions of natural and anthropogenic factors to NDVI variations in the middle reaches of the Heihe River Basin. Ecol. Indic. 2020, 117, 106545. [Google Scholar] [CrossRef]
  11. Gao, S.; Dong, G.; Jiang, X.; Nie, T.; Yin, H.; Guo, X. Quantification of Natural and Anthropogenic Driving Forces of Vegetation Changes in the Three-River Headwater Region during 1982–2015 Based on Geographical Detector Model. Remote Sens. 2021, 13, 4175. [Google Scholar] [CrossRef]
  12. Tao, S.; Peng, W.; Xiang, J. Spatiotemporal variations and driving mechanisms of vegetation coverage in the Wumeng Mountainous Area, China. Ecol. Inform. 2022, 70, 101737. [Google Scholar] [CrossRef]
  13. Ren, Z.; Tian, Z.; Wei, H.; Liu, Y.; Yu, Y. Spatiotemporal evolution and driving mechanisms of vegetation in the Yellow River Basin, China during 2000–2020. Ecol. Indic. 2022, 138, 108832. [Google Scholar] [CrossRef]
  14. Fu, B.; Wang, S.; Liu, Y.; Liu, J.; Liang, W.; Miao, C. Hydrogeomorphic Ecosystem Responses to Natural and Anthropogenic Changes in the Loess Plateau of China. Annu. Rev. Earth Planet. Sci. 2017, 45, 223–243. [Google Scholar] [CrossRef]
  15. Fu, B.; Chen, L.; Ma, K.; Zhou, H.; Wang, J. The relationships between land use and soil conditions in the hilly area of the loess plateau in northern Shaanxi, China. Catena 2000, 39, 69–78. [Google Scholar] [CrossRef]
  16. Wang, X.; Wang, B.; Xu, X.; Liu, T.; Duan, Y.; Zhao, Y. Spatial and temporal variations in surface soil moisture and vegetation cover in the Loess Plateau from 2000 to 2015. Ecol. Indic. 2018, 95, 320–330. [Google Scholar] [CrossRef]
  17. Zhang, Y.; Jiang, X.; Lei, Y.; Gao, S. The contributions of natural and anthropogenic factors to NDVI variations on the Loess Plateau in China during 2000–2020. Ecol. Indic. 2022, 143, 109342. [Google Scholar] [CrossRef]
  18. Yang, Y.; Wang, B.; Wang, G.; Li, Z. Ecological regionalization and overview of the Loess Plateau. Acta Ecol. Sin. 2019, 39, 7389–7397. (In Chinese) [Google Scholar] [CrossRef]
  19. Zuo, Y.; Li, Y.; He, K.; Wen, Y. Temporal and spatial variation characteristics of vegetation coverage and quantitative analysis of its potential driving forces in the Qilian Mountains, China, 2000–2020. Ecol. Indic. 2022, 143, 109429. [Google Scholar] [CrossRef]
  20. Joshi, N.; Gupta, D.; Suryavanshi, S.; Adamowski, J.; Madramootoo, C.A. Analysis of trends and dominant periodicities in drought variables in India: A wavelet transform based approach. Atmos. Res. 2016, 182, 200–220. [Google Scholar] [CrossRef]
  21. Chen, J.; Xu, C.; Lin, S.; Wu, Z.; Qiu, R.; Hu, X. Is There Spatial Dependence or Spatial Heterogeneity in the Distribution of Vegetation Greening and Browning in Southeastern China? Forests 2022, 13, 840. [Google Scholar] [CrossRef]
  22. Zuo, D.; Han, Y.; Xu, Z.; Li, P.; Ban, C. Time-lag effects of climatic change and drought on vegetation dynamics in an alpine river basin of the Tibet Plateau, China. J. Hydrol. 2021, 600, 126532. [Google Scholar] [CrossRef]
  23. Dinpashoh, Y.; Jhajharia, D.; Fakheri-Fard, A.; Singh, V.P.; Kahya, E. Trends in reference crop evapotranspiration over Iran. J. Hydrol. 2011, 399, 422–433. [Google Scholar] [CrossRef]
  24. Hou, X.; Wu, T.; Yu, L.; Qian, S. Characteristics of multi-temporal scale variation of vegetation coverage in the Circum Bohai Bay Region, 1999–2009. Acta Ecol. Sin. 2012, 32, 297–304. [Google Scholar] [CrossRef]
  25. Tong, S.; Lai, Q.; Zhang, J.; Bao, Y.; Lusi, A.; Ma, Q.; Li, X.; Zhang, F. Spatiotemporal drought variability on the Mongolian Plateau from 1980-2014 based on the SPEI-PM, intensity analysis and Hurst exponent. Sci. Total Environ. 2018, 615, 1557–1565. [Google Scholar] [CrossRef] [PubMed]
  26. Jiang, L.; Guli·Jiapaer; Bao, A.; Guo, H.; Ndayisaba, F. Vegetation dynamics and responses to climate change and human activities in Central Asia. Sci. Total Environ. 2017, 599–600, 967–980. [Google Scholar] [CrossRef] [PubMed]
  27. Wang, J.; Xu, C. Geodetector: Principle and prospective. Acta Geogr. Sin. 2017, 72, 116–134. (In Chinese) [Google Scholar] [CrossRef]
  28. Chen, T.; Xia, J.; Zou, L.; Hong, S. Quantifying the Influences of Natural Factors and Human Activities on NDVI Changes in the Hanjiang River Basin, China. Remote Sens. 2020, 12, 3780. [Google Scholar] [CrossRef]
  29. Wang, G.; Peng, W. Quantifying spatiotemporal dynamics of vegetation and its differentiation mechanism based on geographical detector. Environ. Sci. Pollut. Res. Int. 2022, 29, 32016–32031. [Google Scholar] [CrossRef] [PubMed]
  30. Dong, Y.; Yin, D.; Li, X.; Huang, J.; Su, W.; Li, X.; Wang, H. Spatial–Temporal Evolution of Vegetation NDVI in Association with Climatic, Environmental and Anthropogenic Factors in the Loess Plateau, China during 2000–2015: Quantitative Analysis Based on Geographical Detector Model. Remote Sens. 2021, 13, 4380. [Google Scholar] [CrossRef]
  31. Li, P.; Qian, H.; Wu, J. Environment: Accelerate research on land creation. Nature 2014, 510, 29–31. [Google Scholar] [CrossRef] [Green Version]
  32. Wang, J.; Wang, K.; Zhang, M.; Zhang, C. Impacts of climate change and human activities on vegetation cover in hilly southern China. Ecol. Eng. 2015, 81, 451–461. [Google Scholar] [CrossRef]
  33. Fu, W.; Lü, Y.; Harris, P.; Comber, A.; Wu, L. Peri-urbanization may vary with vegetation restoration: A large scale regional analysis. Urban For. Urban Green. 2018, 29, 77–87. [Google Scholar] [CrossRef] [Green Version]
  34. Huang, Z.L.; Chen, L.D.; Fu, B.J.; Lu, Y.H.; Huang, Y.L.; Gong, J. The relative efficiency of four representative cropland conversions in reducing water erosion: Evidence from long-term plots in the Loess hilly area, China. Land Degrad. Dev. 2006, 17, 615–627. [Google Scholar] [CrossRef]
  35. Yuan, J.; Xu, Y.; Xiang, J.; Wu, L.; Wang, D. Spatiotemporal variation of vegetation coverage and its associated influence factor analysis in the Yangtze River Delta, eastern China. Environ. Sci. Pollut. Res. Int. 2019, 26, 32866–32879. [Google Scholar] [CrossRef] [PubMed]
  36. Feng, J.; Dong, B.; Qin, T.; Liu, S.; Zhang, J.; Gong, X. Temporal and Spatial Variation Characteristics of NDVI and Its Relationship with Environmental Factors in Huangshui River Basin from 2000 to 2018. Pol. J. Environ. Stud. 2021, 30, 3043–3063. [Google Scholar] [CrossRef]
  37. Zhao, T.; Bai, H.; Deng, C.; Meng, Q.; Guo, S.; Qi, G. Topographic differentiation effect on vegetation cover in the Qinling Mountainsfrom 2000 to 2016. Acta Ecol. Sin. 2019, 39, 4499–4509. (In Chinese) [Google Scholar] [CrossRef]
  38. Xin, Z.; Xu, J.; Zheng, W. Spatiotemporal variations of vegetation cover on the Chinese Loess Plateau (1981–2006): Impacts of climate changes and human activities. Sci. China Ser. D Earth Sci. 2008, 51, 67–78. [Google Scholar] [CrossRef]
  39. Zhao, X.; Tan, K.; Zhao, S.; Fang, J. Changing climate affects vegetation growth in the arid region of the northwestern China. J. Arid Environ. 2011, 75, 946–952. [Google Scholar] [CrossRef]
  40. Xie, B.; Jia, X.; Qin, Z.; Shen, J.; Chang, Q. Vegetation dynamics and climate change on the Loess Plateau, China: 1982–2011. Region. Environ. Chang. 2015, 16, 1583–1594. [Google Scholar] [CrossRef]
  41. Gao, X.; Li, H.; Zhao, X.; Ma, W.; Wu, P. Identifying a suitable revegetation technique for soil restoration on water-limited and degraded land: Considering both deep soil moisture deficit and soil organic carbon sequestration. Geoderma 2018, 319, 61–69. [Google Scholar] [CrossRef]
  42. Wu, X.B.; Archer, S.R. Scale-Dependent Influence of Topography-Based Hydrologic Features on Patterns of Woody Plant Encroachment in Savanna Landscapes. Landscape Ecol. 2005, 20, 733–742. [Google Scholar] [CrossRef]
  43. Chen, H.; Shao, M.; Li, Y. Soil desiccation in the Loess Plateau of China. Geoderma 2008, 143, 91–100. [Google Scholar] [CrossRef]
Figure 1. Location of the Loess Plateau.
Forests 14 01238 g001
Figure 2. Location of the study area.
Forests 14 01238 g002
Figure 3. Spatial distribution of each driving factor in 2015.
Forests 14 01238 g003
Figure 4. Trend of NDVI mean values by class.
Forests 14 01238 g004
Figure 5. Spatial distribution of NDVI classes.
Forests 14 01238 g005
Figure 6. Distribution of the spatial transfer area of NDVI (a) from 1998 to 2010; (b) from 2010 to 2019.
Forests 14 01238 g006
Figure 7. Spatial distribution of NDVI trend and significance.
Forests 14 01238 g007
Figure 8. Spatial distribution of Hurst index (a) and its normal distribution (b).
Forests 14 01238 g008
Figure 9. Changes in driving factors from 1998 to 2019: (a) annual precipitation and mean annual temperature; (b) potential evapotranspiration and relative humidity; (c) land use type; (d) population density and GDP.
Forests 14 01238 g009
Figure 10. Factor detection results for 2000, 2005, 2010, and 2015.
Forests 14 01238 g010
Figure 11. Interaction detection results of vegetation cover drivers in 2000, 2005, 2010 and 2015 (NE signifies non-linear enhancement; BE signifies dual-factor enhancement).
Forests 14 01238 g011
Figure 12. Significance statistics of the differences in the effects of each driver.
Forests 14 01238 g012
Figure 13. Statistical results of different ranges or types of NDVI for each factor.
Forests 14 01238 g013
Figure 14. NDVI values of each ecological partition of the Loess Plateau from 1998 to 2019.
Forests 14 01238 g014
Figure 15. Land use transfer chord diagram for the study area from 2000 to 2015.
Forests 14 01238 g015
Figure 16. The mean NDVI values of different land use types.
Forests 14 01238 g016
Table 1. Selected potential influencing factors.
CodeDetection FactorsUnitSource
X1Annual precipitationmmhttp://data.tpdc.ac.cn (accessed on 20 August 2022)
X2Mean annual temperature°C
X3Potential evapotranspirationmm
X4Relative humidity%http://www.geodata.cn (accessed on 20 August 2022)
X5Elevationmhttp://www.resdc.cn (accessed on 20 August 2022)
X6Slope°Extraction from digital elevation model (DEM)
X7Land use type/http://www.resdc.cn (accessed on 20 August 2022)
X8Population densitypeople/km2
X9GDP10,000 yuan/km2
X10Vegetation type/
X11Soil type/
X12Aspect/Extraction from digital elevation model (DEM)
Table 2. Classification criteria for the future evolution of NDVI trend.
βZHThe Description of NDVI Trend
>0[1.96, ∞)(0, 0.5)Anti-persistent and significant improvement
[0, 1.96)(0, 0.5)Anti-persistent and insignificant improvement
<0[1.96, ∞)(0, 0.5)Anti-persistent and significant degradation
[0, 1.96)(0, 0.5)Anti-persistent and insignificant degradation
>0[1.96, ∞)(0.5, 1)Persistent and significant improvement
[0, 1.96)(0.5, 1)Persistent and insignificant improvement
<0[1.96, ∞)(0.5, 1)Persistent and significant degradation
[0, 1.96)(0.5, 1)Persistent and insignificant degradation
=0Remaining stable
0.5Uncertainty of change
Table 3. Categories of factor interactions.
FoundationInteraction
C = A + BIndependent
C > A + BNon-linear enhancement
C < DNon-linear weakening
D < C < ESingle-factor non-linear weakening
C > EDual-factor enhancement
Note: A = q(X1), B = q(X2), C = q(X1∩X2), D = Min(q(X1), q(X2)), E = Max(q(X1), q(X2)).
Table 4. Appropriate range or type of each indicator.
FactorsAppropriate Range or TypeMean NDVI
annual precipitation (X1)559.4–698.60.848
potential evapotranspiration (X3)530.6–744.60.865
relative humidity (X4)59–620.762
elevation (X5)2006–27170.845
land use type (X7)forest0.696
vegetation type (X10)coniferous forest0.774
soil type (X11)eluvial soil0.842
Disclaimer/Publisher’s Note: The statements, opinions and data contained in all publications are solely those of the individual author(s) and contributor(s) and not of MDPI and/or the editor(s). MDPI and/or the editor(s) disclaim responsibility for any injury to people or property resulting from any ideas, methods, instructions or products referred to in the content.

