Article

Studying the Genetic and the Epigenetic Diversity of the Endangered Species Juniperus drupacea Labill. towards Safeguarding Its Conservation in Greece

by
Evangelia V. Avramidou
1,*,
Evangelia Korakaki
2,
Ermioni Malliarou
3 and
Stefanos Boutsios
1
1
Laboratory of Forest Genetics and Biotechnology, Institute of Mediterranean Forest Ecosystems, ELGO-DIMITRA, Terma Alkmanos, Ilisia, 11528 Athens, Greece
2
Laboratory of Tree Physiology, Institute of Mediterranean Forest Ecosystems, ELGO-DIMITRA, Terma Alkmanos, Ilisia, 11528 Athens, Greece
3
Institute of Plant Breeding and Genetic Resources, ELGO-DIMITRA, Thermi, 60458 Thessaloniki, Greece
*
Author to whom correspondence should be addressed.
Forests 2023, 14(6), 1271; https://doi.org/10.3390/f14061271
Submission received: 23 April 2023 / Revised: 13 June 2023 / Accepted: 14 June 2023 / Published: 20 June 2023
(This article belongs to the Special Issue Genetic Variation and Phenotypic Plasticity in Trees)

Abstract

:
Juniperus drupacea Labill is a unique representative tree which, nowadays, has limited geographical range. In Greece, it exists only in the southeastern part of the Peloponnese, and it is labeled as endangered according to the IUCN in Europe. In the light of climatic changes, a conservation plan which will secure its adaptation and resilience is important. Knowledge of the genetic and the epigenetic diversity of J. drupacea in Greece can establish a pledge for sustainability. In this study, genetic diversity with amplified fragment length polymorphism (AFLP) markers and epigenetic diversity assessed with methylation-sensitive amplification polymorphism (MSAP) were used for eleven subpopulations of the species. Simultaneously, first assessment between midday water potential (Ψmd) and epigenetic diversity was calculated in order to determine drought response of the species. Results showed that genetic diversity was higher than epigenetic diversity and no subpopulation differentiation was observed. No significant correlations were found between geographic, epigenetic, and genetic diversity, indicating that the genetic diversity is uncoupled from epigenetic diversity. A significant negative correlation between epigenetic Shannon index and Ψmd was found. The holistic research of genetic and epigenetic diversity paves the way for an effective conservation plan for the species.

1. Introduction

The Syrian Juniper (Juniperus drupacea Labill) is the only representative tree of the section Caryocedrus Endl. of the genus Juniperus L. [1]. Nowadays its expansion is restricted, and in Greece exists only in one area in the southeastern part of the Peloponnese peninsula; it is labelled as endangered according to IUCN in Europe. According to NATURA 2000 sites in 1992, it was included in Annex I of Directive 92/43/EEC as a priority habitat type and at the Mt Parnon summit and Malevi Monastery as Special Protected Areas (code: GR 2520006).
J. drupacea is a special plant taxa as it is one of the few woody species that occurs in Europe and Asia, as Sobierajska, et al. [2] pointed out. According to the same authors, they studied the effect of the Aegean sea as a barrier between populations from Europe and Asia. Sobierajska, et al. [2] found six genetically and geographically diverse groups of populations, which probably reflects long-lasting genetic isolation during the Pleistocene. In addition, the location of the evolution and the divergence of the species remains unknown because fossil data is difficult to discover. Towards this direction and in order to investigate its evolution, extinction, and distribution, Boratyński et al. [3] studied genetic differentiation between 41 populations of Juniperus oxycedrus spp. oxycedrus, deltoides, macrocarpa, etc., from the eastern and western Mediterranean habitats of the species. They found a significant increase in diversity from east to west in the Mediterranean Basin and a lack of significant differentiation between European and African populations by using three simple sequence repeat markers discovered from [4]. Furthermore, a significant study about past, present, and future geographic range of the species was implemented by [5] and pinpointed the fact that the species could become endangered in the future, and that conservation strategies should be adopted to allow for preservation of its genetic and morphological diversity.
In the face of the ongoing climatic changes and, due to the fact that forest trees are long-lived organisms with complex life cycles that lack mobility, adaptation is a crucial issue in terms of the sustainability and resilience of forest ecosystems. Forest managers and ecologists face a real challenge nowadays towards predicting the best situation which will favor migration or adaptation for tree species. Forest management and conservation relies on the relationships between genetic material and environmental changes [6]. Apart from the genetic diversity, which is the primary force of evolution, epigenetic forces are proved to significantly affect adaptability, phenotypic variation, expression of genes, drought resistance, etc., in various wood tree studies [7,8,9]. Epigenetics are defined as the changes that occur and are not obvious in the DNA sequence. DNA methylation is the most studied mechanism because it occurs in all living organisms [7,8]. Furthermore, DNA methylation is the most well studied epigenetic mechanism in forest trees in order to study heritability [10], drought resistance [11], climatic adaptation, which is affected by temperature [12], morphological differentiation [13] anthocyanin biosynthesis [14], floral development [15], and the relation between genetic and epigenetic variation [10,16].
In addition, plant water potential is used to assess plant water status [17]. Leaf water potential becomes more negative whenever the soil becomes drier or more water has to be transported though a plant’s conduits to maintain transpiration. Thus, if the water potential in leaves of a similar age exposed to identical microclimatic conditions is compared, it can be used as a water stress indicator [18].
Understanding the connection between epigenetic and genetic diversity is a critical factor in determining the future resilience and survival of populations [17]. As noted by Richards [18], this link determines the extent to which phenotypic variation can be attributed solely to epigenetic effects. To gain insight into the complete adaptation profile and develop conservation and protection strategies, it is essential to examine both genetic and epigenetic profiles of plant populations.
Towards this goal, the primary study’s objective is the estimation of genetic and epigenetic diversity for the threatened species of Juniperus drupacea in Greece in order to propose management actions for conservation of the species. Furthermore, a research question was also to figure out if this whole distribution of J. drupacea is one population subdivided by subpopulations and originated from one genetic pool. Lastly, the first results for water potential and relation to epigenetic and climatic profile will be presented and will be combined with the conservation and management plan in order to highlight potential adaptations of the population towards climatic changes.

2. Materials and Methods

Eleven natural subpopulations were sampled in order to cover all distribution of J. drupacea on the Parnonas mountain (Table 1, Figure 1). The study was focused on an area of 740 ha that has been declared as a “Monument of Nature to be preserved” according to the F.E.K. 121D/1980 national law. A total of 105 different trees were sampled, with 5 to 10 trees per subpopulation. We collected needles from trees spaced at least 50 m apart. We covered the whole distribution of the species in the protected area (Figure 1). Total genomic DNA was isolated using the extraction plant kit (Macherey Nagel, Duren, Germany). The DNA was quantified by a UV spectrophotometer (Eppendorf Biophotometer, Hamburg, Germany). After collection, during the same developmental stage and from the same crown aspect, samples were diluted to a working concentration of 10 ng/μL. To prevent any possible alteration in DNA methylation status, the sampled leaves were promptly frozen, and all samples were subjected to identical treatment for DNA extraction, following the same protocol used for AFLP/MSAP markers. In the current study, we will refer to the sampled populations as subpopulations due to our hypothesis that they derive from a single population.
According to the data of the locally installed meteorological station, annual precipitation for the year 2022 was 774.4 mm, and mean, min, and max temperatures were 13.2 °C, 5.6 °C and 27.5 °C, respectively (Korakaki personal communication).

2.1. AFLP Procedure

Total genomic DNA (200 ng) was digested with 4 U of EcoRI and MseI for 3 h at 37 °C. Digested DNA fragments and EcoRI and MseI adapters were ligated with T4 DNA ligase (New England Biolabs, Ipswich, MA, USA) for 3 h at 26 °C. The resulting DNA was used as primary template DNA in the AFLP analysis. A primer pair based on the sequences of the EcoRI and MseI adapters with one additional selective nucleotide at the 3′ end (EcoRI+A and MseI+C) was used for the first PCR step (pre-amplification, Table 2).
Pre-amplification PCR was performed in a total volume of 20 μL containing 1X Kapa Taq Buffer, 0.2 mM of each dNTP, 2.5 mM MgCl2, 30 ng of each primer EcoRI+A, MseI+C, 1U Taq DNA polymerase (Kapa Biosystems; Wilmington, MA, USA), and 5 μL of diluted fragments (from the digestion and ligation reaction). Cycling was carried out in a BioRad (Hercules, CA, USA) thermocycler with a 95 °C hold for 30 s followed by 32 cycles of 95 °C for 30 s, 56 °C for 30 s and 72 °C for 1 min, followed by a final hold at 72 °C for 10 min. A 5 μL aliquot of the reaction was electrophoresed on agarose to verify amplification; the remaining 15 μL was diluted 5-fold with TE.
Selective amplifications were carried out in 10 μL total volumes consisting of 3 μL of diluted pre-selective template and using the same reaction conditions as for pre-selective amplification but using 30 ng of a MseI primer and 5 ng of an EcoRI primer per reaction. Selective amplification cycling was performed in a BioRad (Hercules, CA, USA) thermocycler with the following program: an initial cycle of 95 °C for 30 s, 65 °C for 30 s, 72 °C for 1 min; then 12 cycles of 95 °C for 30 s with an annealing temp starting at 65 °C for 30 s but decreasing by 0.75 °C each cycle, 72 °C for 1 min; finally, 23 cycles of 95 °C for 30 s, 56 °C for 30 s, 72 °C for 1 min, with a final hold at 72 °C for 30 min.
The f-AFLP product mixtures were denatured in formamide at 94 °C for 2 min and then subjected to electrophoretic separation using an ABI Prism 3730xl Genetic Analyzer (Applied Biosystems, Woburn, MA, USA). A total of ten selective primer combinations (Table 2) were used to screen for AFLP, with individual hybrids being assessed for the presence or absence of specific fragments. The size of the fragments detected was determined using the Genemapper v4.0 program and an internal standard (GS 500 LIZ, Applied Biosystems, Woburn, MA, USA). Only fragments with a size range of 150 to 500 bases were counted and analyzed further, in order to minimize the impact of potential size homoplasy [19].

2.2. MSAP Procedure

To perform the MSAP assay, double digests were carried out using either EcoRI/HpaII or EcoRI/MspI restriction enzymes (Table 2). Genomic DNA aliquots (200 ng) were digested in a 20 μL reaction volume containing 1X “One-for-All” buffer, 4 U EcoRI (New England, Biolabs, Ipswich, MA, USA), and 4 U of either HpaII or MspI enzyme (New England, Biolabs, Ipswich, MA, USA) at 37 °C for 3 h. Following digestion, two different adaptors, one for EcoRI sticky ends and one for HpaII/MspI sticky ends, were ligated to the DNA by adding a mix containing 5 pmol of EcoRI adapter, 50 pmol of HpaII/MspI adapter, 1 mM ATP, 1X “One-for-All” buffer, and 1 U of T4 DNA ligase (Invitrogen) to each final digestion, and then the solution was incubated at 25 °C for 3 h. The resulting digested and ligated DNA fragments were diluted 5-fold and used as templates for the pre-selective amplification reaction. Pre-amplification reactions were performed using MspI/HpaII-primers in a total volume of 20 μL containing 1X Kapa Taq Buffer, 0.2 mM of each dNTP, 2.5 mM MgCl2, 30 ng of each primer EcoRI+A, MspI/HpaII+A, 1U Taq DNA polymerase (Kapa Biosystems, Wilmington, MA, USA), and 5 μL of the diluted fragments. PCR pre-amplifications were carried out using two different sets of primers. The pre-amplified fragments were then diluted 10-fold and used as templates for the selective amplifications. Only the EcoRI primers were labeled for selective amplification, using the primer combinations shown in Table 2. Selective PCR was performed in a 10 μL reaction volume containing 1X Kapa Taq Buffer, 2.5 mM MgCl2, 0.08 mM of each dNTP, 5 ng of labeled EcoRI primer, 30 ng of HpaII/MspI primer, 1 U of Taq DNA polymerase (Kapa Biosystems, Wilmington, MA, USA), and 3 μL of diluted pre-amplified DNA. Four primer combinations were used during the selective amplification stage. The entire experiment was repeated twice to ensure fully reproducible MSAP bands for further processing.

2.3. Needle Water Potential

Midday water potentials (Ψmd, water potential under maximum daily water demand) were measured concurrently at six out of the eleven natural subpopulations on plants grown under field conditions. Plants were the same as those used for the collection of samples for genetic and epigenetic analyses. Two samples (twigs with needles) were obtained from five J. drupacea individuals per natural population, totaling sixty samples. WPmd measurements were conducted between 12:00 to 14:00 using a portable pressure chamber (model PMS 1003, PMS Instruments, Corvallis, OR, USA) [20].

2.4. Data Collection and Statistical Analysis

To convert allele size data from GeneMapper4.0 (Applied Biosystems, USA) into binary form, an AFLP Excel Macro was utilized, which indicated the presence of fragments as “1” and their absence as “0”. In order to decrease the effect of potential size homoplasy, only reproducible fragments within the range of 150 to 500 bases were counted and further analyzed [19]. In addition, GenAlex v6.0 [21] was used in order to calculate parameters, such as the percentage of polymorphic bands (P), Shannon’s information index (I), and genetic diversity (He). GenAlex v6.0 was also used to conduct an analysis of molecular variance (AMOVA) and to calculate genetic distances and principal coordinate analysis (PCoA). To further evaluate the population’s differentiation, the software AFLP-Surv 1.0 [19] was used to calculate the Fst. The omputation was made after 10,000 permutations and 1000 bootstraps. Moreover, Nei’s genetic distance was also calculated with the same program.
For MSAP analyses, comparison of the banding patterns of EcoRI/HpaII and EcoRI/MspI reactions results in four conditions of a particular fragment, as follows: I—fragments present in both profiles (1/1), indicating an unmethylated state (u alleles); II—fragments present only in EcoRI/MspI profiles (0/1), indicating hemi- or fully methylated CG sites (m alleles); III—fragments present only in EcoRI/HpaII profiles (1/0), indicating hemimethylated CHG sites (h alleles); IV—absence of fragments in both profiles (0/0), representing an uninformative state caused either by different types of methylation, or due to restriction site polymorphism [22]. To separate unmethylated and methylated fragments and to test for the particular impact of the methylated conditions II and III, we used the “Mixed-Scoring 2” approach [22].
Epigenetic diversity within subpopulations was quantified using the R script MSAP_calc.r [22] as follows: (i) number of total and private bands (polymorphic subepiloci), (ii) percentage of polymorphic subepiloci (Pepi), and (iii) mean Shannon’s information index (Iepi). GenAlEx 6 [21] was employed to compute haploid gene diversity (h) within subpopulations. GenAlEx was also used to conduct an analysis of molecular variance (AMOVA)—separately for each subepilocus class—in order to study the variation of CCGG methylation states (epiloci) among the eleven subpopulations. Separate principal coordinate analyses (PCoAs) were employed to determine the correlation between matrices derived from different marker systems, namely MSAP and AFLP, and the standardized Mantel coefficient [23] was employed. This test was also utilized to assess the similarity between geographic and genetic distances, as well as between geographic and epigenetic distances [23].
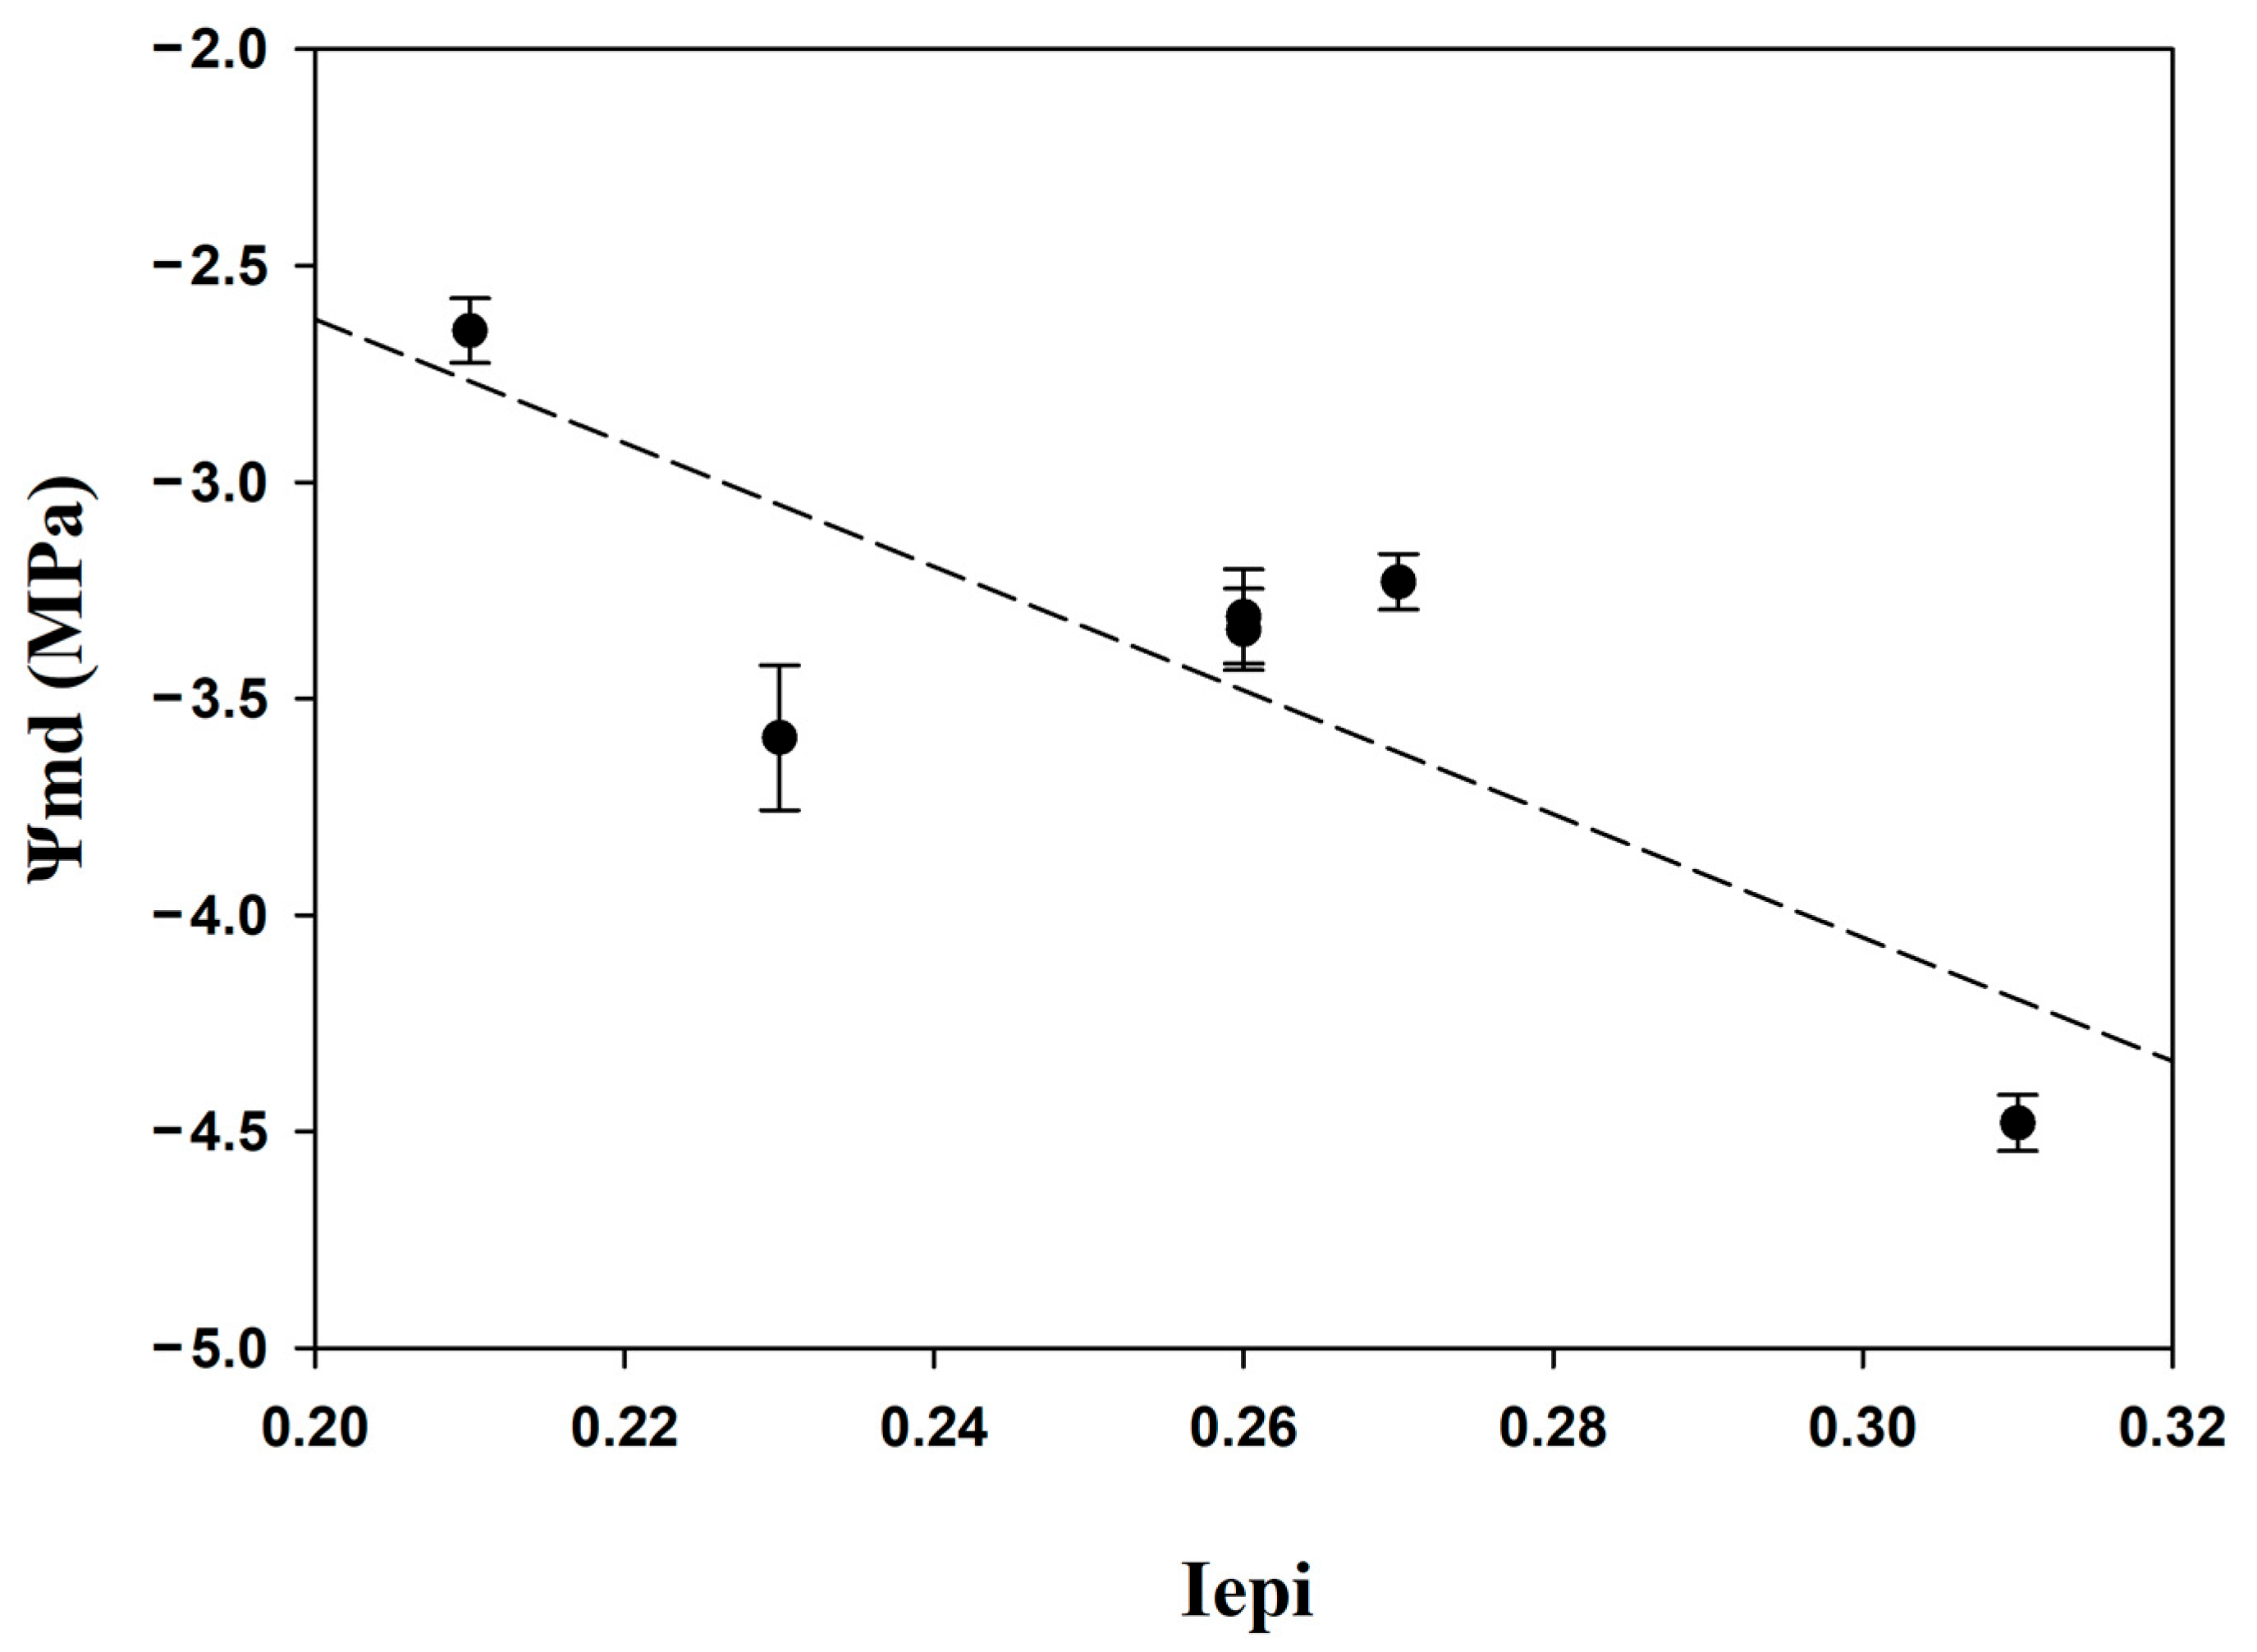
For needle water potential, regression analysis was used to compare mean values of Iepi and Ψmd of all six natural subpopulations, using Sigmaplot (v.14.0, Systat Software Inc., San Jose, CA, USA).

3. Results

3.1. Genetic Diversity

A total of 10 AFLP selective primer combinations were used and produced 1883 fragments for the 11 subpopulations studied. Mean percentage of polymorphism was 50.11% and ranged from 40.15% for the A10 to 60.28% for the A5 subpopulation, respectively (Table 3). The mean expected heterozygosity (He) ranged from 0.076 to 0.125, with a mean 0.104. The Shannon diversity index (I) offers an alternative method of quantifying biological diversity across multiple scales (genes to landscapes, GenAlex 6.5b) and ranged from 0.127 (A4 population) to 0.202 (A9 population). The number of effective alleles ranged from 0.810 (A10 population) to 1.082 (A8 population) presented a mean of 1.138. The mean expected heterozygosity for genetic diversity was 0.104 and ranged from 0.072 to 0.118.
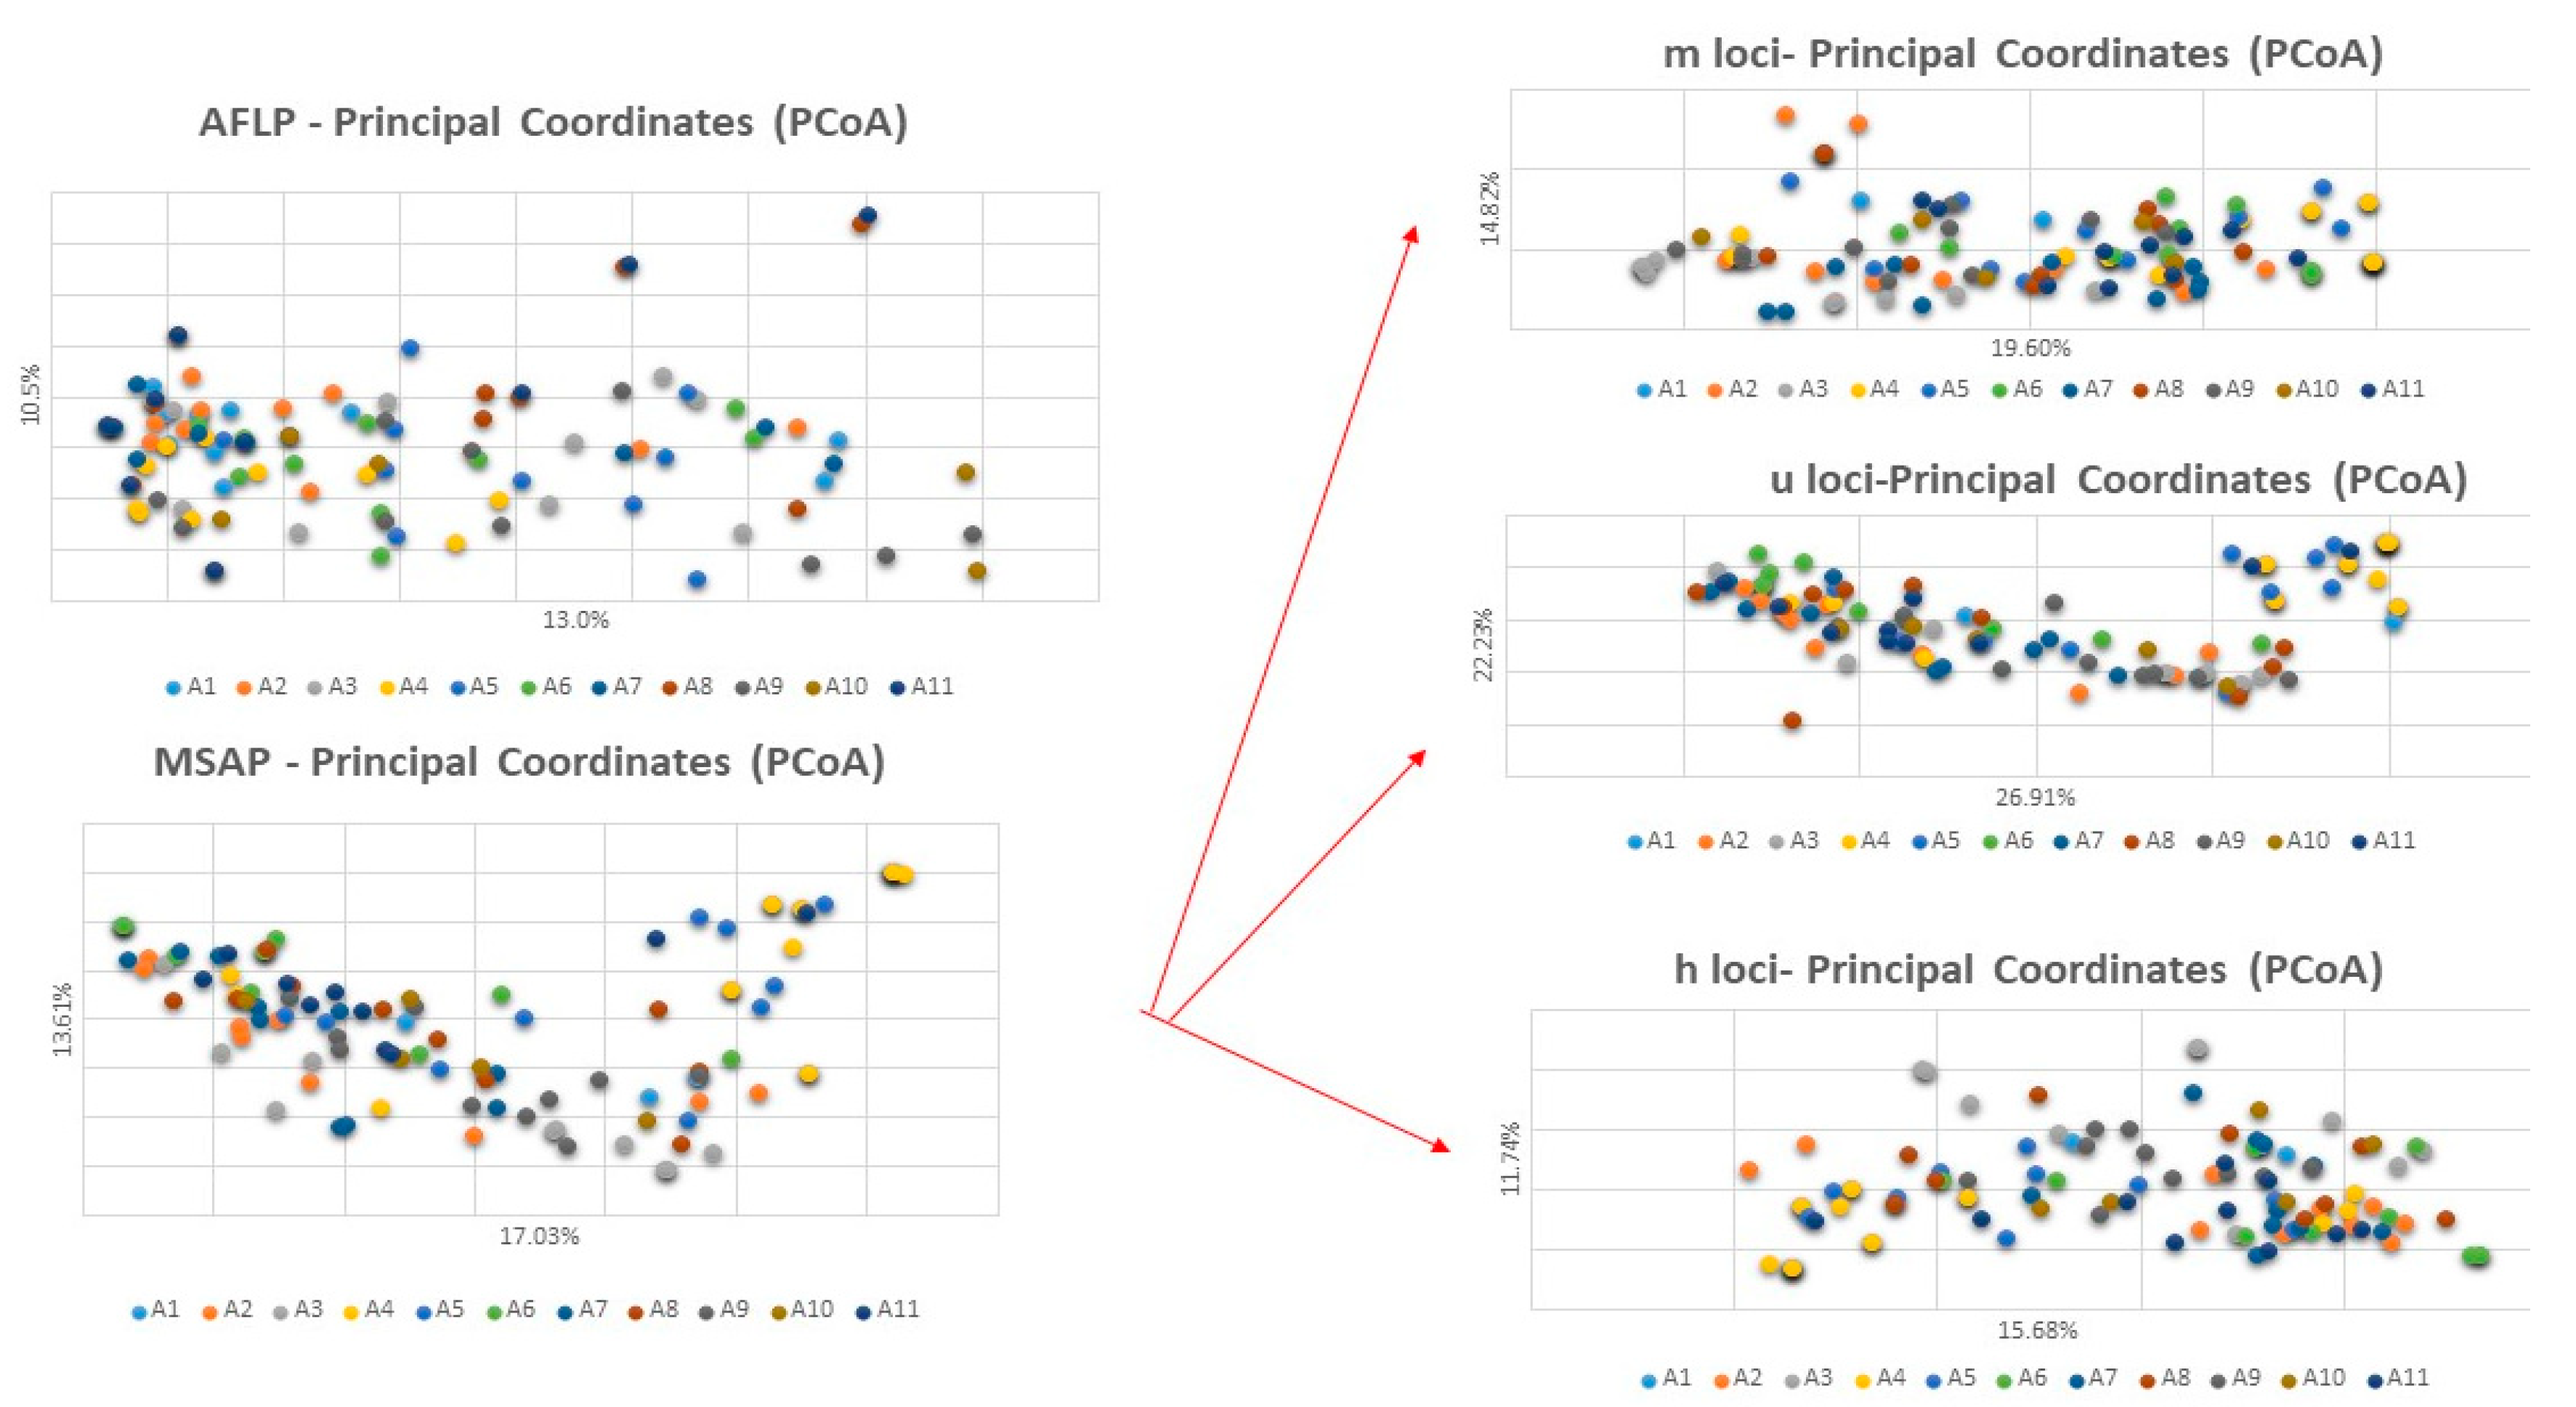
Analysis of molecular variance portioned 99% of the genetic variation within subpopulations and 1% only among subpopulations (Table 4), whereas principal coordinate analysis explained only 13% of the variance. Parameters for genetic diversity are presented in Table 3 along with the epigenetic results.
Furthermore, Wright’s fixation index (Fst) among subpopulations was −0.0037, with low 0.9868 and high 0.0133 p values, respectively, indicating no significant genetic differentiation among subpopulations. Nei’s genetic distance also showed the small differentiation between subpopulations and is presented in Table 5.

3.2. Epigenetic Diversity

A total of 8 MSAP selective primer combinations were used and produced 1603 fragments for the 11 subpopulations studied herein. The number of markers per population ranged from 480 (A10 subpopulation) to 794 (A2 subpopulation). The mean percentage of polymorphism was 36.75% and ranged from 32% for A6 to 48.91% for the A2 population, respectively. The mean epigenetic expected heterozygosity Hepi ranged from 0.068 to 0.098 for A1 and A2, respectively. The epigenetic Shannon diversity index Iepi had a mean of 0.25 and ranged from 0.20 to 0.31 for the A2 and A1 subpopulations, respectively.
Analysis of molecular variance portioned 94% of the genetic variation within subpopulations and 6% only among subpopulations (Table 4), whereas principal coordinate analysis explained only 17.03% of the variance (Figure 2). Parameters for genetic diversity are presented in Table 2 along with the epigenetic results.
According to the “Mixed-Scoring 2” approach [22] different parameters for each of the methylation profile was calculated for u, m, and h alleles. Each different approach is presented in Table 6.
Separate principal coordinate analysis was performed for AFLP, MSAP, and different types of loci, and the m, u, and h loci and presented in Figure 2. For the genetic analysis (AFLP data), the first two axes explained 13.0% of the total variation and absence of population differentiation. For epigenetic analysis, the first two axes explained 17.0% of the total variation, and, furthermore, 19.6%, 26.91%, and 15.68% for m, u, and h loci, respectively.

3.3. Comparison of Genetic and Epigenetic Indexes

The mean epigenetic diversity (H = 0.083), based on MSAP markers, was slightly lower than the genetic diversity (He = 0.104), but the difference was not significant (t = 4.203, p = 0.054, as shown in Table 2). The percentage of polymorphic loci in the epigenetic AFLP structure (36.75%) was slightly lower than in the genetic AFLP structure (50.11%) of the same individuals (Table 2), but the difference was not statistically significant (t = −4.99, p = 0.518). Furthermore, the Shannon genetic index (I) did not differ significantly from the Shannon epigenetic index (Iepi, t = 6.840, p = 0.39).

3.4. Correlation between Geographic, Genetic, and Epigenetic Variability

Correlation between the genetic and epigenetic variability was explored using a Mantel test. There was a non-significant positive correlation (R = 0.072, p = 0.087) between the pairwise genetic (AFLP) and geographic distances. Similarly, there was a non-significant positive correlation (R = 0.076, p = 0.057) between epigenetic (MSAP) and geographic distances (Figure 3). Lastly, we also detected a negative non-significant correlation between both genetic distance matrices assessed from the AFLPs and MSAP (R = −0.050, p = 0.257).

3.5. Correlation between Epigenetic Variability and Tree Water Status

The correlation between Iepi and Ψmd was tested using regression analysis to compare mean values of all six natural populations. A significant negative correlation was identified (Figure 4, R2 = 0.673, p < 0.05).
When Ψmd was plotted against genetic diversity indexes, non-significant relations were identified, indicating that species genetic diversity was not affected by variations in tree water status.

4. Discussion

Genetic diversity has been traditionally considered as the primary source for biodiversity, evolution, and adaptive capacity. However, in recent years, numerous studies have shown the significant role that epigenetic plays in adaptation ([7,13,24,25,26,27,28] and in phenotypic plasticity [7,29]. Variation in DNA methylation may or may not depend on underlying genetic variation in DNA sequences, which further complicates efforts to resolve the role of DNA methylation [9]. According to Richards [25], there are two main extreme relations between genetic and epigenetic variation that have a profound effect on adaptation. In the light of climatic changes, the in-depth analysis of genetic and epigenetic diversity and their relation is considered crucial for the resilience and adaptation of forest ecosystems [7,28,30].
In this study, we studied genetic and epigenetic diversity of the endangered Syrian juniper (J. drupacea) and we attempted to present a first insight towards needle water potential and epigenetic correlation. We found that epigenetic diversity was lower than genetic diversity in both parameters of h and I but not statistically different. The same results were obtained from other studies [13,31] when they compared Shannon’s index diversity. In detail, Rico et al. (2014) analyzed natural Querqus ilex populations in relation to the genetic and epigenetic structure. They also found higher genetic than epigenetic diversity (but not statistically significant) and higher percentage of genetic polymorphic loci than from the epigenetic loci, in agreement with our results. Furthermore, in a previous study for natural populations of Prunus avium L. we have also found higher genetic than epigenetic diversity [10].
Concerning the correlations between genetic and epigenetic distances, we found a non-significant negative correlation, contrary to [28], where Fagus sylvatica populations were studied, and to [32], who studied Viola elatior natural populations, as both found significant positive correlations. Furthermore, mean percentage of polymorphic genetic and epigenetic variation was found to be 50.11% and 36.75%, respectively, indicating comparable lower results with previous studies for Prunus avium [10], Pinus nigra [16], Fagus sylvatica [28], and Quercus ilex [31]. AMOVA results partitioned 94% and 99% of epigenetic and epigenetic variation, respectively, within subpopulations, and results were in agreement with previous published studies for F. sylvatica [28], P. avium [10], P. nigra [30], etc.
Furthermore, in relation to the principal coordinate analysis (PcoA) performed for genetic and epigenetic diversity, no significant group was formulated, indicating no population differentiation. This is also an indication that the whole area comes from a single pool and that the 11 subpopulations studied are, in fact, subpopulations. Moreover, epigenetic analysis explained a higher percentage of variation (17%) in relation to genetic variation (13%). Furthermore, analysis of PcoA for the separate different methylated loci (m, u, and h loci) indicated that the higher percentage was formulated for the u loci that contained both unmethylated loci and methylated loci in external and internal cytosine. We have to highlight in this part that the study should also be enriched by employing codominant markers, which can help us estimate in-depth more genetic parameters, such as gene flow, number of private alleles, genetic structure, inbreeding coefficient, etc.
Water potential is the driving force for the movement of liquid water through the plant [33]. It is, therefore, a measure of the tree’s energy water status. Negative values represent the negative pressure water needs to move downwards from the leaf to the petiole. The more negative the water potential, the more water-stressed the plant is. Furthermore, stomatal activity has been shown to be highly correlated with Ψmd [34]. Our findings are in agreement with the outcomes of the analysis of [35] in 49 studies, who found frequent variations in plant methylation patterns exposed to different environmental stress conditions. In addition, [36] found that natural intraspecific variation in several leaf traits of Helleborus foetidus individuals, such as stomatal size and density, which are key factors in water economy, is more frequently related to epigenetic than to genetic markers. On the contrary, in Quercus ilex, [31] found that after a natural population in Spain was exposed to a 12-year water stress, the percentage of the hypermethylated loci increased, whereas of the fully methylated loci decreased. However, they found epigenetic but no genetic differentiation. We present this important finding here as an indication for future resilience of the plant, as it is also correlated with epigenetic indexes, which are the immediate response of the plant to biotic and abiotic pressures and can serve as a reference point for management plans.
In-depth analysis of Juniperus drupacea subpopulations according to our results showed that whereas mean genetic was higher than epigenetic diversity, the relation between subpopulation’s indexes of diversity was not in agreement. For example, the A5 subpopulation ‘s genetic diversity was 0.124, whereas the epigenetic diversity was 0.080. All results showed that genetic variation for J. drupacea was uncoupled from epigenetic diversity, possibly highlighting the long-term existence of the species in the area and the isolation by distance of the subpopulations. A similar result of the unique genetic pool was also found in the study from [2], where the Peloponnese population was separated from the others. Moreover, a recent study pointed out that the Syrian juniper has proven to be really difficult for in vitro culture according to [37]. Due to the abovementioned reasons, and according to Walas et al. [5], the importance of in situ and ex situ protection of the species is highlighted for ensuring future survival adaptation and resilience in the face of ongoing climatic changes. Therefore, our proposal is to firstly conserve the species in situ and to prioritize the protection of the A9, A5, and A10 subpopulations for the genetic diversity and, afterwards, to conserve the A2, A8, and A3 subpopulations, which show higher epigenetic diversity indexes, indicating higher capability for adaptation. For ex situ protection, cones of the species must be preserved in the national gene bank of Greece in order to maintain the unique genetic pool of the species. Lastly, experiments about drought tolerance in relation to genetic and epigenetic diversity should be further implemented in order to qualify the adaptation ability of J. drupacea.

5. Conclusions

Juniperus drupacea is a valuable species, which, nowadays, has restricted geographical range. To enable its sustainability, conservation measures should be taken in the light of climatic changes [5]. In this study, an evaluation of its unique genetic and epigenetic diversity was assessed covering the species range in the area of the Peloponnese. Future research should also incorporate codominant markers in order to further access the genetic parameters of this important population of J. drupacea. Furthermore, we correlated water potential with epigenetic and genetic diversity indexes, and we discovered that epigenetic diversity plays a significant role in the ability of the tree to cope with future drought periods. The study proposes first planning conservation actions, both in situ and ex situ, in order to pave the way for the sustainability of the species in relation to the epigenetic and genetic pool of the subpopulations. Beyond this study, we should also focus on understanding the water stress and epigenetic correlation in order to assess the capability of the species to retain and pass the epigenetic marks through generations.

Author Contributions

Conceptualization, E.V.A. and E.K.; methodology, E.V.A. and E.K.; software, E.V.A., E.K., EM. and S.B.; validation, E.V.A. and E.M.; investigation, E.V.A. and S.B.; resources, E.V.A., E.K. and E.M.; data curation, E.V.A., E.K. and E.M.; writing—original draft preparation, E.V.A., E.K. and E.M.; writing—review and editing, all authors; supervision, E.V.A. All authors have read and agreed to the published version of the manuscript.

Funding

This research was co-financed by the European Regional Development Fund of the European Union and Greek National Funds (2020–2023) through the Operational Program Competitiveness, Entrepreneurship, and Innovation, under the call RESEARCH–CREATE–INNOVATE (project code: T2EDK-03378).

Data Availability Statement

Not applicable.

Acknowledgments

Acknowledgements should be given to Chrysa-Ioanna Charitatou Typaldou, Christina Nomikou, and Foteini Zacharopoulou for assistance in DNA extraction and laboratory work.

Conflicts of Interest

The authors declare no conflict of interest.

References

  1. Adams, R.P. Junipers of the World: The Genus Juniperus; Trafford Publishing: Bloomington, IN, USA, 2014. [Google Scholar]
  2. Sobierajska, K.; Boratyńska, K.; Jasińska, A.; Dering, M.; Ok, T.; Douaihy, B.; Bou Dagher-Kharrat, M.; Romo, Á.; Boratyński, A. Effect of the Aegean Sea barrier between Europe and Asia on differentiation in Juniperus drupacea (Cupressaceae). Bot. J. Linn. Soc. 2016, 180, 365–385. [Google Scholar] [CrossRef] [Green Version]
  3. Boratyński, A.; Wachowiak, W.; Dering, M.; Krystyna, B.; Katarzyna, S.; Sobierajska, K.; Jasińska, A.K.; Klimko, M.; Montserrat, J.M.; Romo, A. The biogeography and genetic relationships of Juniperus oxycedrus and related taxa from the Mediterranean and Macaronesian regions. Bot. J. Linn. Soc. 2014, 174, 637–653. [Google Scholar] [CrossRef] [Green Version]
  4. Michalczyk, I.; Sebastiani, F.; Buonamici, A.; Cremer, E.; Mengel, C.; Ziegenhagen, B.; Vendramin, G. Characterization of highly polymorphic nuclear microsatellite loci in Juniperus communis L. Mol. Ecol. Notes 2006, 6, 346–348. [Google Scholar] [CrossRef]
  5. Walas, Ł.; Sobierajska, K.; Ok, T.; Dönmez, A.A.; Kanoğlu, S.S.; Dagher-Kharrat, M.B.; Douaihy, B.; Romo, A.; Stephan, J.; Jasińska, A.K. Past, present, and future geographic range of an oro-Mediterranean Tertiary relict: The Juniperus drupacea case study. Reg. Environ. Chang. 2019, 19, 1507–1520. [Google Scholar] [CrossRef] [Green Version]
  6. Alfaro, R.I.; Fady, B.; Vendramin, G.G.; Dawson, I.K.; Fleming, R.A.; Sáenz-Romero, C.; Lindig-Cisneros, R.A.; Murdock, T.; Vinceti, B.; Navarro, C.M. The role of forest genetic resources in responding to biotic and abiotic factors in the context of anthropogenic climate change. For. Ecol. Manag. 2014, 333, 76–87. [Google Scholar] [CrossRef]
  7. Amaral, J.; Ribeyre, Z.; Vigneaud, J.; Sow, M.D.; Fichot, R.; Messier, C.; Pinto, G.; Nolet, P.; Maury, S. Advances and promises of epigenetics for forest trees. Forests 2020, 11, 976. [Google Scholar] [CrossRef]
  8. García-García, I.; Méndez-Cea, B.; Martín-Gálvez, D.; Seco, J.I.; Gallego, F.J.; Linares, J.C. Challenges and perspectives in the epigenetics of climate change-induced forests decline. Front. Plant Sci. 2022, 12, 3207. [Google Scholar] [CrossRef]
  9. Browne, L.; MacDonald, B.; Fitz-Gibbon, S.; Wright, J.W.; Sork, V.L. Genome-wide variation in DNA methylation predicts variation in leaf traits in an ecosystem-foundational oak species. Forests 2021, 12, 569. [Google Scholar] [CrossRef]
  10. Avramidou, E.V.; Doulis, A.G.; Aravanopoulos, F.A. Determination of epigenetic inheritance, genetic inheritance, and estimation of genome DNA methylation in a full-sib family of Cupressus sempervirens L. Gene 2015, 562, 180–187. [Google Scholar] [CrossRef]
  11. Raj, S.; Bräutigam, K.; Hamanishi, E.T.; Wilkins, O.; Thomas, B.R.; Schroeder, W.; Mansfield, S.D.; Plant, A.L.; Campbell, M.M. Clone history shapes Populus drought responses. Proc. Natl. Acad. Sci. USA 2011, 108, 12521–12526. [Google Scholar] [CrossRef] [Green Version]
  12. Johnsen, Ø.; Fossdal, C.G.; Nagy, N.; MØLMANN, J.; Dæhlen, O.G.; Skrøppa, T. Climatic adaptation in Picea abies progenies is affected by the temperature during zygotic embryogenesis and seed maturation. Plant Cell Environ. 2005, 28, 1090–1102. [Google Scholar] [CrossRef]
  13. Lira-Medeiros, C.F.; Parisod, C.; Fernandes, R.A.; Mata, C.S.; Cardoso, M.A.; Ferreira, P.C.G. Epigenetic variation in mangrove plants occurring in contrasting natural environment. PLoS ONE 2010, 5, e10326. [Google Scholar] [CrossRef]
  14. Jiang, L.; Zhang, M.; Ma, K. Whole-genome DNA methylation associated with differentially expressed genes regulated anthocyanin biosynthesis within flower color chimera of ornamental tree Prunus mume. Forests 2020, 11, 90. [Google Scholar] [CrossRef] [Green Version]
  15. Cheng, Y.-H.; Peng, X.-Y.; Yu, Y.-C.; Sun, Z.-Y.; Han, L. The effects of DNA methylation inhibition on flower development in the dioecious plant Salix viminalis. Forests 2019, 10, 173. [Google Scholar] [CrossRef] [Green Version]
  16. Saez-Laguna, E.; Guevara, M.-A.; Diaz, L.-M.; Sanchez-Gomez, D.; Collada, C.; Aranda, I.; Cervera, M.-T. Epigenetic variability in the genetically uniform forest tree species Pinus pinea L. PLoS ONE 2014, 9, e103145. [Google Scholar] [CrossRef] [Green Version]
  17. Kramer, P.J. Problems in Water Relations of Plants and Cells. In International Review Of Cytology; Elsevier: Amsterdam, The Netherlands, 1983; Volume 85, pp. 253–286. [Google Scholar]
  18. Richter, H.; Kikuta, S. Ecophysiology of Long-Distance Water Transport in Trees. In Trees in a Changing Environment: Ecophysiology, Adaptation, and Future Survival; Springer: Berlin/Heidelberg, Germany, 2014; pp. 99–115. [Google Scholar]
  19. Vekemans, X.; Beauwens, T.; Lemaire, M.; Roldán-Ruiz, I. Data from amplified fragment length polymorphism (AFLP) markers show indication of size homoplasy and of a relationship between degree of homoplasy and fragment size. Mol. Ecol. 2002, 11, 139–151. [Google Scholar] [CrossRef]
  20. Scholander, P.F.; Bradstreet, E.D.; Hemmingsen, E.; Hammel, H. Sap Pressure in Vascular Plants: Negative hydrostatic pressure can be measured in plants. Science 1965, 148, 339–346. [Google Scholar] [CrossRef]
  21. Peakall, R.; Smouse, P.E. GENALEX 6: Genetic analysis in Excel. Population genetic software for teaching and research. Mol. Ecol. Notes 2006, 6, 288–295. [Google Scholar] [CrossRef]
  22. Schulz, B.; Eckstein, R.L.; Durka, W. Scoring and analysis of methylation-sensitive amplification polymorphisms for epigenetic population studies. Mol. Ecol. Resour. 2013, 13, 642–653. [Google Scholar] [CrossRef] [Green Version]
  23. Mantel, N. The detection of disease clustering and a generalized regression approach. Cancer Res. 1967, 27, 209–220. [Google Scholar]
  24. Bräutigam, K.; Vining, K.J.; Lafon-Placette, C.; Fossdal, C.G.; Mirouze, M.; Marcos, J.G.; Fluch, S.; Fraga, M.F.; Guevara, M.Á.; Abarca, D. Epigenetic regulation of adaptive responses of forest tree species to the environment. Ecol. Evol. 2013, 3, 399–415. [Google Scholar] [CrossRef] [PubMed]
  25. Richards, E.J. Inherited epigenetic variation—Revisiting soft inheritance. Nat. Rev. Genet. 2006, 7, 395–401. [Google Scholar] [CrossRef] [PubMed]
  26. Bossdorf, O.; Richards, C.L.; Pigliucci, M. Epigenetics for ecologists. Ecol. Lett. 2008, 11, 106–115. [Google Scholar] [CrossRef] [PubMed]
  27. Herrera, C.M.; Bazaga, P. Untangling individual variation in natural populations: Ecological, genetic and epigenetic correlates of long-term inequality in herbivory. Mol. Ecol. 2011, 20, 1675–1688. [Google Scholar] [CrossRef] [PubMed]
  28. Guevara, M.Á.; Sánchez-Gómez, D.; Vélez, M.D.; de María, N.; Díaz, L.M.; Ramírez-Valiente, J.A.; Mancha, J.A.; Aranda, I.; Cervera, M.T. Epigenetic and Genetic Variability in Contrasting Latitudinal Fagus sylvatica L. Provenances. Forests 2022, 13, 1971. [Google Scholar] [CrossRef]
  29. Nicotra, A.B.; Atkin, O.K.; Bonser, S.P.; Davidson, A.M.; Finnegan, E.J.; Mathesius, U.; Poot, P.; Purugganan, M.D.; Richards, C.L.; Valladares, F. Plant phenotypic plasticity in a changing climate. Trends Plant Sci. 2010, 15, 684–692. [Google Scholar] [CrossRef]
  30. Katsidi, E.C.; Avramidou, E.V.; Ganopoulos, I.; Barbas, E.; Doulis, A.G.; Triantafyllou, A.; Aravanopoulos, F.A. Genetics and epigenetics of Pinus nigra populations with differential exposure to environmental pollution. Front. Plant Sci. 2023, 14, 1178. [Google Scholar] [CrossRef]
  31. Rico, L.; Ogaya, R.; Barbeta, A.; Penuelas, J. Changes in DNA methylation fingerprint of Quercus ilex trees in response to experimental field drought simulating projected climate change. Plant Biol. 2014, 16, 419–427. [Google Scholar] [CrossRef]
  32. Schulz, B.; Eckstein, R.L.; Durka, W. Epigenetic variation reflects dynamic habitat conditions in a rare floodplain herb. Mol. Ecol. 2014, 23, 3523–3537. [Google Scholar] [CrossRef]
  33. Jarvis, P. The interpretation of the variations in leaf water potential and stomatal conductance found in canopies in the field. Philos. Trans. R. Soc. Lond. B Biol. Sci. 1976, 273, 593–610. [Google Scholar]
  34. Williams, L.E. Leaf water potentials of sunlit and/or shaded grapevine leaves are sensitive alternatives to stem water potential. J. Int. Sci. Vigne Vin 2012, 46, 207–219. [Google Scholar] [CrossRef]
  35. Alonso, C.; Pérez, R.; Bazaga, P.; Medrano, M.; Herrera, C.M. MSAP markers and global cytosine methylation in plants: A literature survey and comparative analysis for a wild-growing species. Mol. Ecol. Resour. 2016, 16, 80–90. [Google Scholar] [CrossRef] [Green Version]
  36. Medrano, M.; Herrera, C.M.; Bazaga, P. Epigenetic variation predicts regional and local intraspecific functional diversity in a perennial herb. Mol. Ecol. 2014, 23, 4926–4938. [Google Scholar] [CrossRef]
  37. Ioannidis, K.; Tomprou, I.; Panayiotopoulou, D.; Boutsios, S.; Daskalakou, E.N. Potential and Constraints on In Vitro Micropropagation of Juniperus drupacea Labill. Forests 2023, 14, 142. [Google Scholar] [CrossRef]
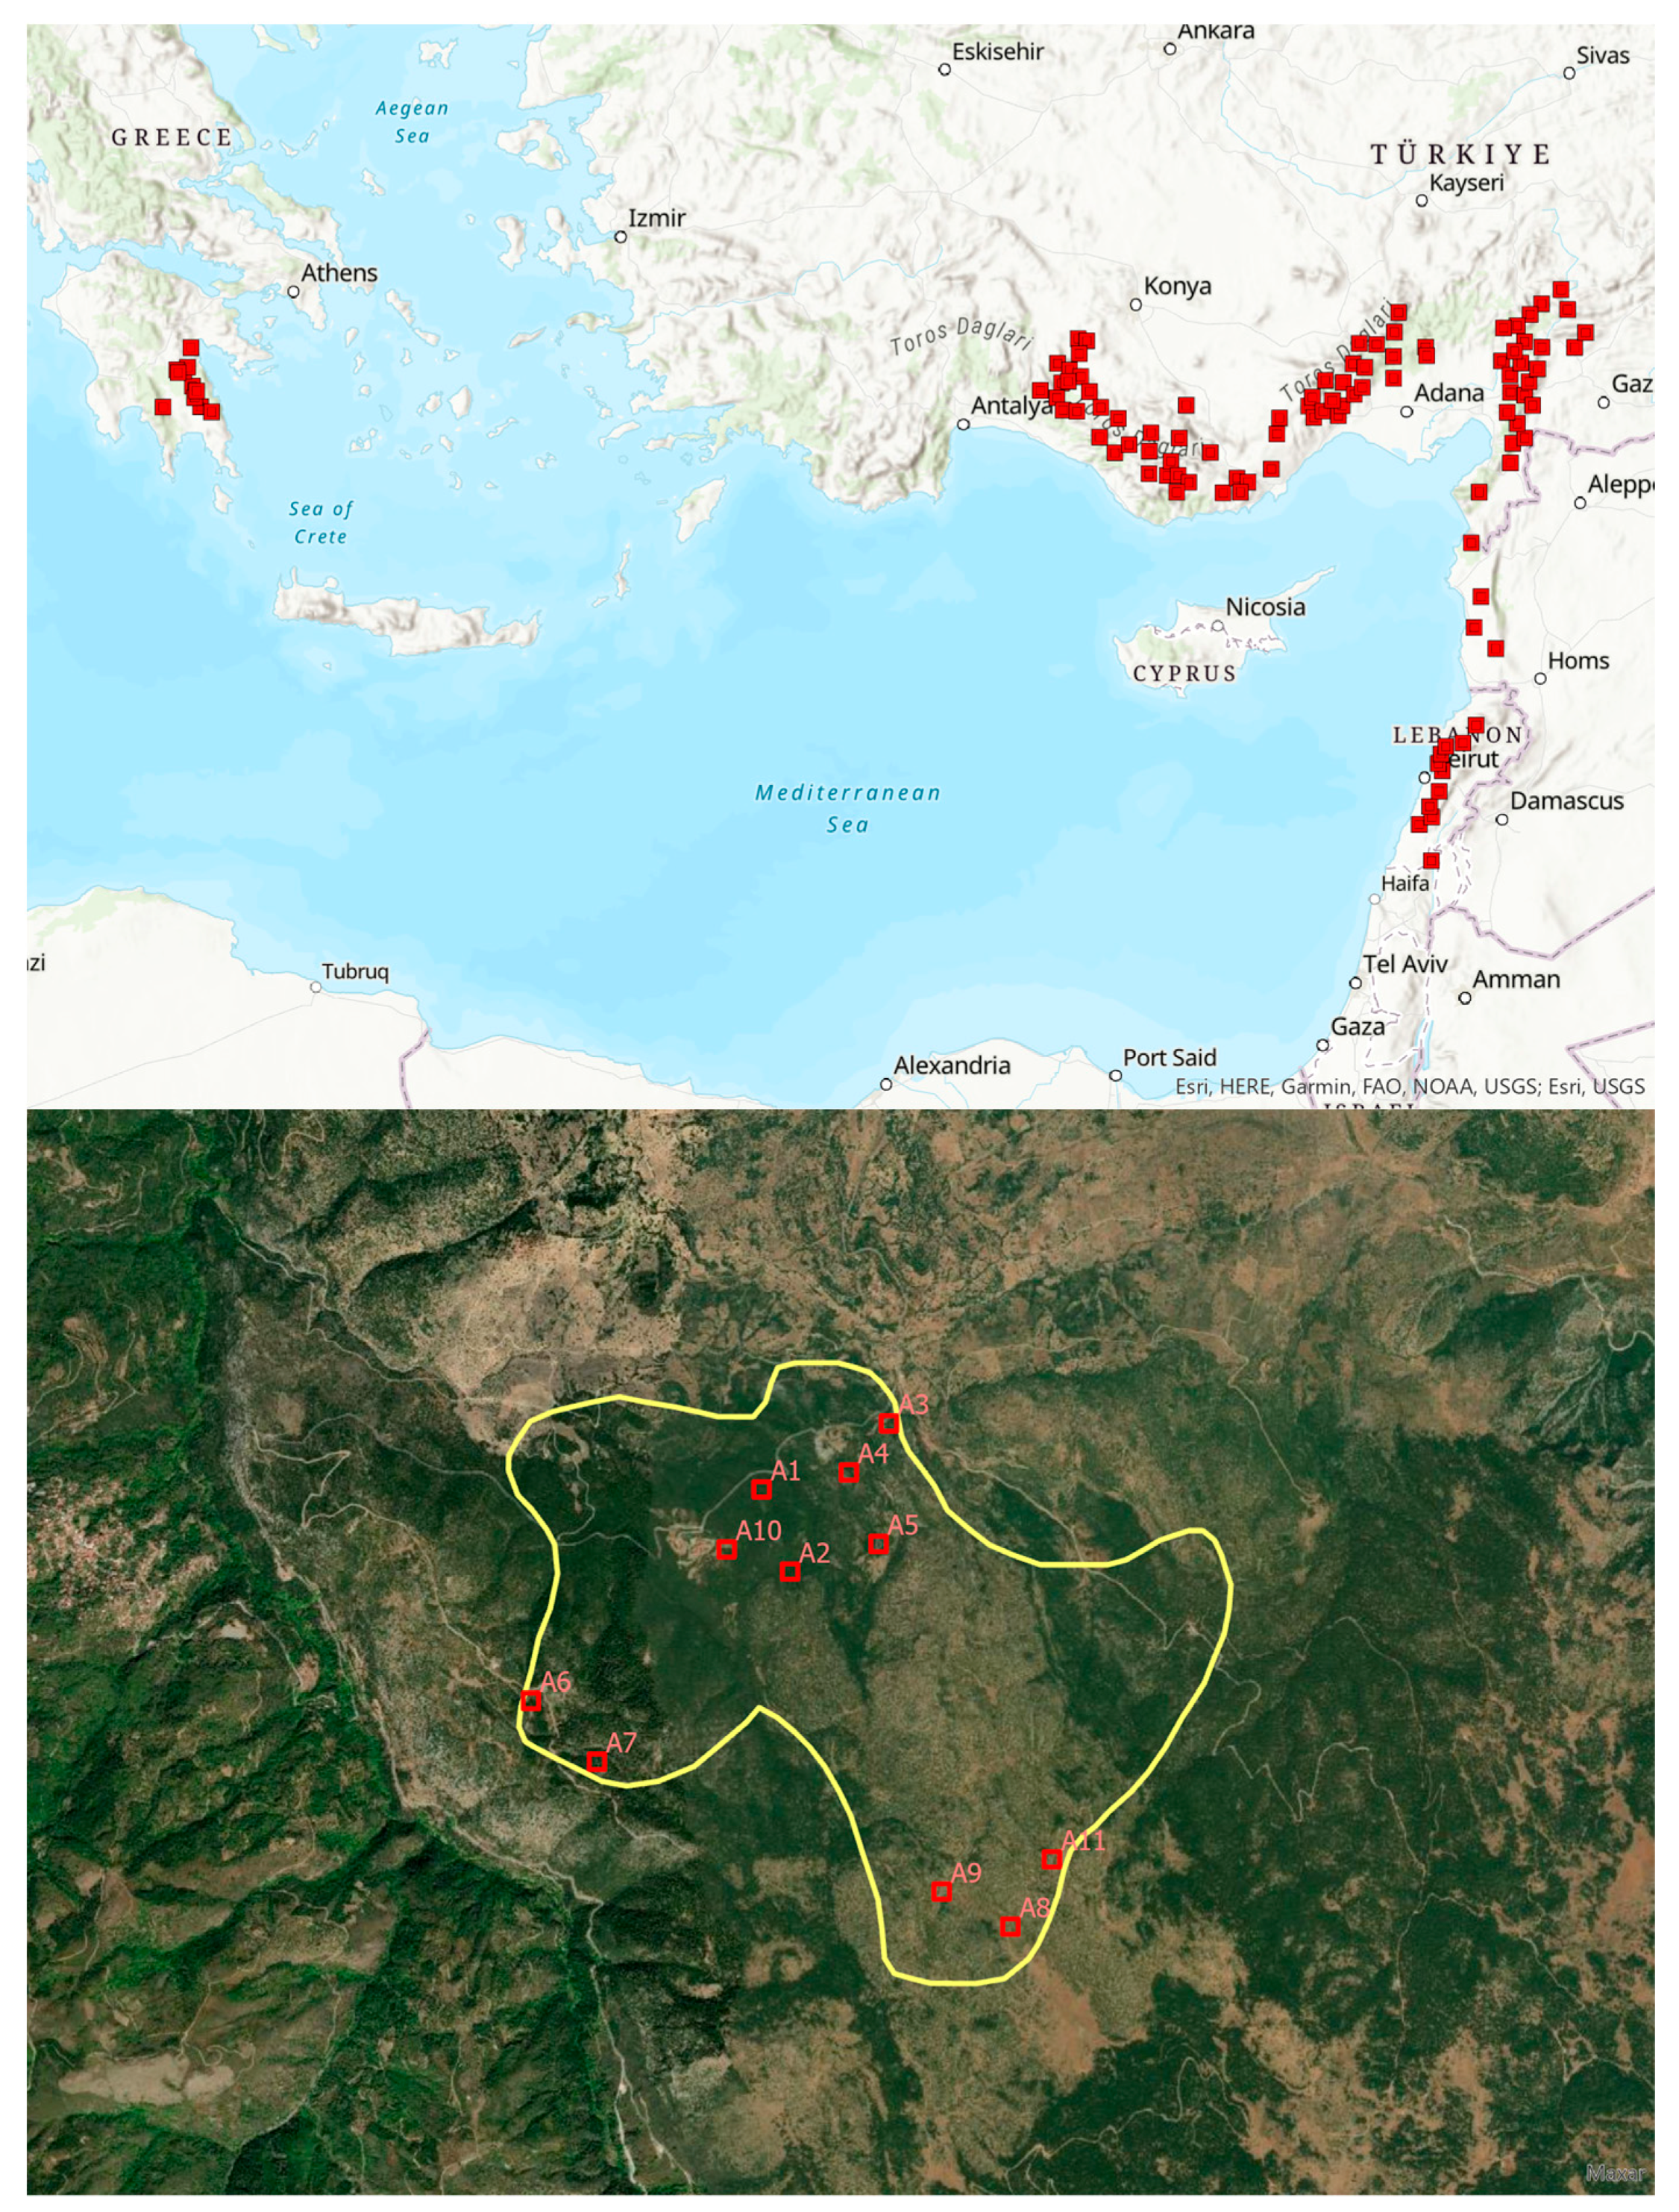
Figure 1. Geographical distribution of J. drupacea (up) and absolute protection zone of J. drupacea, with positions of the 11 subpopulations sampled (down).
Forests 14 01271 g001
Figure 2. Principal coordinate analysis (PCoA) of genetics (AFLP), epigenetics (MSAP), and partition into three distinct methylation types, namely m-loci, u-loci, and h-loci.
Forests 14 01271 g002
Figure 3. Separate Mantel tests for genetic and geographic, geographic and epigenetic, and epigenetic and genetic distances (from left to right).
Forests 14 01271 g003
Figure 4. Correlation between Iepi and Ψmd.
Forests 14 01271 g004
Table 1. Site code nomination of subpopulations, latitude, longitude, mean altitude, and number of trees studied.
Site CodeLatitudeLongitudeAltitude (m a.s.l.)Number of Trees
A137.3290422.5845794010
A237.3267922.58515104610
A337.3329822.5928494910
A437.3318222.5919596410
A537.3282922.59287104810
A637.3210622.57229106210
A737.3194622.57489109310
A837.3106522.60086127010
A937.3117722.59781127310
A1037.3279322.584059505
A1137.3138022.6032298510
Table 2. EcoRI/MseI and HpaII/MspI adapters, and pre-selective and selective primers used for the AFLP and MSAP analysis.
Primer Name5′ to 3′ Sequence
EcoRI adapterCTCGTAGACTGCGTACC
AATTGGTACGCAGTC
MseI adapterGACGATGAGTCCTGAG
TACTCAGGACTCAT
HpaII/MspI adapterGACGATGAGTCTCGAT
CGATCGAGACTCAT
Pre-selective EcoRI primerGACTGCGTACCAATTC-A
Pre-selective MseI primerGATGAGTCCTGAGTAA-C
Pre-selective HpaII/MspI primerATGAGTCTCGATCGG-A
Selective EcoRI primersGACTGCGTACCAATTC+ATG (FAM)
GACTGCGTACCAATTC+ACT (HEX)
GACTGCGTACCAATTC+AAC (ROX)
GACTGCGTACCAATTC+AAG (TAMRA)
Selective MseI primerGATGAGTCCTGAGTAA-CAA
GATGAGTCCTGAGTAA-CAC
GATGAGTCCTGAGTAA-CGT
GATGAGTCCTGAGTAA-CTC
Selective HpaII/MspI primerATGAGTCTCGATCGGATC
ATGAGTCTCGATCGGACT
ATGAGTCTCGATCGGAAT
EcoRI adapterCTCGTAGACTGCGTACC
AATTGGTACGCAGTC
Table 3. Collection sites of J. drupacea subpopulations, total epigenetic diversity, and comparison with genetic diversity indexes at the same individual plants (Pepi: percentage of polymorphic subepiloci, Iepi: Shannon’s information index based on epiloci, He and Hepi: haploid genetic and epigenetic diversity, P: percentage of polymorphic bands, I: Shannon’s information index based on genetic loci, N.B.: number of bands, N.P.B.: number of private bands.
AFLPMSAP
PopulationPIHePepiIepiHepiN.B.N.P.B.
A147.160.150.09330.260.200.0684869
A244.770.140.08848.910.310.098794125
A353.000.170.10937.430.260.08862159
A441.530.120.07632.380.210.0715338
A560.280.200.12437.370.240.08060648
A653.000.170.106320.210.07853332
A748.430.150.09537.370.260.08862533
A853.900.170.10742.360.270.08968374
A959.850.200.12540.170.260.08665848
A1040.150.170.12328.510.230.07748022
A1149.120.150.09637.550.250.08462040
Mean50.110.160.10436.750.250.083603.54.40
Table 4. Hierarchical AMOVA for AFLP and MSAP data (all subepiloci, as well as different subepiloci classes separately) performed by grouping subpopulations according to regions of origin.
Loci/GroupsSource of Variationd.f.Variance ComponentTotal Variance (%)Φ-Statistics (ΦST)p Value
AFLP lociAmong populations101.881
Within populations94152.88990.012<0.001
Total104154.77100
MSAP all subepilociAmong populations106.806
Within populations9497.28940.061>0.001
Total104104.09100
MSAP m-subepilociAmong populations102.5276
Within populations9438.673940.038>0.001
Total10441.200100
MSAP h-subepilociAmong populations101.9685
Within populations9434.796950.054>0.001
Total10436.764100
MSAP n-subepilociAmong populations102.3119
Within populations9423.819910.088>0.001
Total10426.130100
Table 5. Nei’s genetic distance between populations.
PopulationA1A2A3A4A5A6A7A8A9A10A11
A10.0000.0000.0000.00050.00010.0000.0000.0000.00080.0000.000
A20.0000.0000.0000.0000.00050.0000.0000.0000.0000.00070.000
A30.0000.0000.0000.00020.0000.0000.0000.0000.0000.0000.000
A40.00050.00050.00020.0000.00070.00060.0000.00090.00060.00020.0003
A50.00010.0000.0000.00070.0000.0000.0000.0000.0000.0000.000
A60.0000.00010.0000.00060.0000.0000.0000.0000.0000.0000.002
A70.0000.0000.0000.0000.0000.0000.0000.0000.00020.0000.000
A80.0000.0000.0000.00090.0000.0000.0000.0000.0000.0000.000
A90.00080.00070.0000.00060.0000.0000.00020.0000.0000.0000.0007
A100.0000.0000.0000.00020.0000.0000.0000.0000.0000.0000.000
A110.0000.0000.0000.00030.0000.00020.0000.0000.00070.0000.000
Table 6. Different methylation profiles for u, m, and h alleles; Ne: number of effective epigenetic alleles; Iepi: Shannon’s information index based on epiloci, Hepi: haploid epigenetic diversity.
u Allelesm Allelesh Alleles
SubpopulationNeIHeNeIHeNeIHe
A11.0810.0930.0551.1280.1220.0781.0810.1020.058
A21.1360.1370.0861.1580.1850.1081.1140.1480.084
A31.1220.1340.0811.1260.1380.0841.1240.1410.085
A41.1000.1130.0681.1260.1300.0811.0750.0950.054
A51.1320.1450.0881.1410.1550.0941.0720.0930.053
A61.1330.1260.0801.1260.1330.0821.0940.1040.063
A71.1430.1410.0891.1450.1580.0961.0980.1170.068
A81.1960.2140.1291.1300.1440.0861.0780.1000.057
A91.1400.1510.0921.1270.1470.0871.1010.1210.070
A101.1340.1360.0861.1260.1320.0831.1000.1100.068
A111.1620.1620.1011.1300.1440.0871.0830.1030.059
Mean1.1340.1410.0871.1330.1450.0881.0930.1120.065
Disclaimer/Publisher’s Note: The statements, opinions and data contained in all publications are solely those of the individual author(s) and contributor(s) and not of MDPI and/or the editor(s). MDPI and/or the editor(s) disclaim responsibility for any injury to people or property resulting from any ideas, methods, instructions or products referred to in the content.