Abstract
Ungulate impacts on forest understory alter tree species composition, with cascading effects on forest functions and resilience against future climate conditions. Indeed, the ungulate browsing pressure on tree seedlings is species-specific and causes contrasted growth reductions that alter tree recruitment rates. Untangling the effects of browsing from the effects of the other factors driving regeneration success is required to guide the forest and ungulate management. In particular, Fagus sylvatica L. strongly dominates temperate Quercus-Fagus forests close to their climax, and it remains unclear if controlling ungulate populations can maintain tree species diversity in naturally regenerated forests. We addressed this question by monitoring 734 pairs of fenced and unfenced 6-m2 plots across a broad gradient of Cervus elaphus L. abundance in Belgian Quercus-Fagus forests managed by continuous cover forestry. Seedling height, density, and vegetation cover were monitored from 2016 to 2021. Species diversity and ecological affinity for light, temperature, and atmospheric humidity conditions were computed from these measures. With ungulates, the mean growth of Betula pendula Roth. and Sorbus aucuparia L. was negligible, whereas, without ungulates, their growth was higher than the growth of other species. With ungulates, the growth of Fagus sylvatica L. and Picea abies (L.) H. Karst was higher than other species. Quercus (Quercus petreae (Matt.) Liebl and Quercus robur L.) growth was the lowest in all conditions. Finally, Carpinus betulus L. was heavily browsed but still grew higher than its competitors with ungulates. Ungulate browsing can then severely affect seedling growth and likely reduce the diversity of future recruited trees. In the study area, browsing unfavored the regeneration of the species that are less shade tolerant, more-drought tolerant, and more-heat tolerant. It thus accelerates the natural succession and reduces forest resilience to heat and drought events. Such an observation was found valid over a wide study area encompassing contrasting levels of Cervus elaphus L. abundance. Combining further reductions of ungulate populations with foodscape improvement is likely required to maintain species diversity in these forests.
1. Introduction
Wild ungulates alter forest understory, including tree regeneration, causing direct and cascading effects on numerous biological groups and forest functions [1,2]. As ungulates consume herbaceous vegetation, they affect seedling establishment, density, and growth. Recruitment bottlenecks can occur for the most palatable and the least resistant species, causing shifts in the long-term forest structure and composition [3,4,5,6,7].
A recent literature review documented that the majority of studies addressing ungulate impacts on forest climate adaptation strategies considered ungulates as a threat [8]. Ungulates indeed most strongly alter the regeneration of those species with the best potential for adaptation to future climate in several contexts [9,10]. The altered succession may also lead to a less diversified tree composition. However, interspecific interactions increase the resilience and resistance of trees to disturbances, especially extreme heat and drought events [11,12,13,14,15,16,17,18].
Maintaining admixed tree species in the widespread European Quercus-Fagus forests is essential to foster their resilience and resistance to climate change [19], especially since Fagus sylvatica L. vitality losses have been reported throughout Europe [20]. However, Fagus sylvatica L. has a strong competitive advantage over most early succession species both in the canopy and the understory [21,22,23]. The share of early succession species, which regeneration has been lacking these last decades (Figure S7), may thus shrink further as forests may get closer to their climax, largely dominated by Fagus sylvatica L. [24].
Forest managers need methods to quantify ungulate impacts on regeneration, as it could be one of the most determinant drivers of the undergoing succession process [24,25]. These impacts are density-dependent [26], and both the environmental and the socioeconomic contexts have favored a steady increase of the ungulate abundances in numerous regions of Europe and northern America in the late 20th and early 21st centuries [27,28,29,30,31]. Recreational hunting is the main factor limiting ungulate populations [28,32,33,34], but hunting pressure is unlikely to meet societal and sylvicultural optimums without science-based quantification of ungulate impacts [35]. To date, largescale scientific monitoring of vegetation remains limited [36]. Ungulate impacts have rarely been conducted or else have yielded only limited direct information on the true impact of ungulate populations on regeneration success at a large scale.
Bio-indicators have been used to detect the variations of ungulate impact on forest regeneration. Monitoring bio-indicators at a large scale has been considered a cost-effective solution [37] to follow changes in ungulate impacts on forest ecosystems. Such indicators can serve to set annual ungulate culling targets and adapt them to the observed changes. Nevertheless, the suggested bio-indicators (e.g., browsing rates, [38]) do not per se give indications for achieving regeneration goals [39] because their relation to regeneration success remains unknown or limited to a few tree species and forest contexts [40]. Seedling growth rates vary with browsing intensity and may be positively affected by moderate browsing [41].
Enclosure–exclosure experiments, based on the comparison of vegetation protected from ungulates with a reference situation, have provided information about achievable regeneration goals and how ungulates prevent them from being reached locally. Unfortunately, reported experiments are based on small numbers of sampling plots (usually fewer than 30, [2]) that are often of large size (up to 20 ha). Considering the high heterogeneity of regeneration and ungulate pressure in space and time and the number of influencing variables, their outcomes are thus hardly generalizable to a whole region or management district [42,43,44].
To gain a better understanding of ungulate impacts on forest regeneration at a large scale, we monitored a large set of fenced and unfenced small plots (n = 734, area = 6 m2) installed in secondary Quercus-Fagus forests managed by continuous cover forestry [45,46]. Seedling height and density were monitored for 5 years. The results were used to infer how ungulates might affect future forest composition and adaptation to climate conditions across a wide range of ungulate abundance.
We hypothesized (i) that ungulates would reduce herbaceous and seedling height, cover, and density with possible positive effects on the seedling growth; (ii) that the seedling growth reductions would be species-specific; and (iii) that it would (a) promote the regeneration of Fagus sylvatica L. and Picea abies over the other admixed species by altering the mean growth ranks of the seedling species (b) erode species diversity, (c) and alter the ecological aptitudes of seedling communities.
2. Materials and Methods
2.1. Study Area
The study area encompassed 3085 km2 of forest in Wallonia (Figure 1). The climate is warm and temperate without a dry season and with a mild summer (Cfb in the Köppen-Geiger classification system or continental in the Metzger climate classification of Europe [47]).
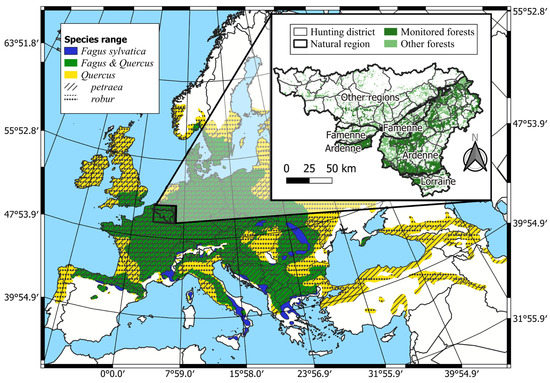
Figure 1.
Study area within the distribution range of Fagus sylvatica and Quercus petraea & robur in Europe (adapted from [48]). Inset map: forest areas are displayed with the regional forest mask of Wallonia [49]. Monitored forests are the forest areas in the hunting districts where enclosure–exclosure network was installed.
Fagus sylvatica L. is the main climax species in most of the area, but alternative climax vegetation occurs depending on particular climatic and soil constraints, which differ between the three main natural regions, Ardenne, Famenne, and Lorraine (Figure 1). In particular, Sphagnum-rich Betula pubescens wood and Western Hercynian woodrush-hawksbeard Quercus forests are the climax vegetation in the highest parts of Ardenne, where the mean temperature is lower and precipitations more abundant. The Famenian Quercus-Carpinus betulus forests are the climax vegetation in Famenne, where soils are clayey (Table A1).
Forests are managed in our study area and can be qualified as secondary forests. Tree composition often differs from those of the climax vegetation. Coniferous and broadleaved forests cover respectively 55% and 45% of the forest area; 76% of the coniferous area is dominated by Picea abies. These stands are mainly even-aged plantations. Quercus and Fagus sylvatica L. are the main deciduous species. Altogether, they cover 32% of the forest area. Of the broadleaved forests, 85% have been naturally regenerated, 52% are uneven-aged, and 40% are coppice-with-standards. The stands are generally harvested every 12 years with selective felling. Fagus sylvatica L. regeneration is abundant, whereas Quercus regeneration has been lacking for several decades [50]; (Figure S7).
The Cervus elaphus, the Capreolus capreolus L. and the Sus scrofa are the three native ungulate species living in the study area. Their abundance has risen sharply since 1980 [27]. Ungulate population management is coordinated at the level of hunting districts. These districts cover forest areas ranging between 18.1 km2 and 258.5 km2. At the district level, the Cervus elaphus populations ranged between 0 and 16.5 animals per km² in 2017. No accurate estimations of Capreolus capreolus or Sus scrofa densities are available. The mean number of culled animals per km2 of forest ranged between 0 and 6.7 Cervus elaphus, between 0.8 and 6.3 Capreolus capreolus, and between 1.4 and 21.6 Sus scrofa. Ovis gmelini and Dama dama are also present sporadically in the study area.
2.2. Data Collection
Systematic sampling of the forest regeneration was conducted. In all, 930 pairs of plots were set up across the study area in 2016, 734 of which were measured until 2021. Their location was randomly selected among the intersections of a 400 × 400 m grid. The field operators selected the closest location to the grid intersection where regeneration was expected to thrive. The plots were installed only where light availability was judged sufficient, where the competing herbaceous vegetation (e.g., Rubus fructicosus L. or ferns) was not abundant, and where seed trees were present nearby. Areas with advanced regeneration (seedlings taller than 50 cm) were avoided.
The selected sampling points measured until 2021 were mainly located in broadleaved stands (n = 539 pairs of plots) of Quercus and Fagus sylvatica L. and less frequently in coniferous or mixed stands (n = 192) of Picea abies and Pseudotsuga menziesii (Mirb.) Franco. The type of the stand was not registered for the three plots. Most of the sampling points (n = 690) were in forests managed by continuous cover forestry [45] and where selective felling had been carried out in the two previous years. A total of 30 plots were set up in forest clear-cuts, and the regeneration method was not registered for 14 plots.
The plot pairs were composed of two 6 m2 circular plots set 4 m apart from center to center. One plot was fenced with a 1.6 m high wooden lattice (Figure A1). The second plot remained unfenced and accessible to ungulates. The operators endeavored to set up the two plots in closely similar environmental conditions.
Vegetation and regeneration development were assessed in 2016, 2017, 2018, 2020, and 2021. Data were collected during the vegetation season, mostly in July and August. Species identity and height of the five tallest seedlings (dominant seedlings) were collected. In addition, the number of seedlings per species was monitored using classes (0, 1–2, 3–6, 7–9, 10–20, 21–50, >50 seedlings). The total cover (%) of all the understory woody species (seedlings of tree species including admixed species such as Sambucus sp. Cytisus scoparius and Rubus fructicosus L. L., Rubus idaeus, Calluna vulgaris), the total cover of all non-woody species except Pteridium aquilinum (e.g., Deschampsia sp., Luzulla sp., etc.), and the total cover of all bryophyte species were estimated visually on the Braun-Blanquet scale. Additionally, the cover of five understory species (Rubus fructicosus, Rubus idaeus, Calluna vulgaris, Pteridium aquilinum, and Cytisus scoparius) was estimated separately. These five species are known to frequently affect regeneration development and/or are important food items for ungulates [51,52].
2.3. Data Analysis
We compared the temporal dynamics of understory growth and composition in the fenced and unfenced plots. The plot-level observations were the height of the tallest seedling of each species, the mid-class value of seedling density, and the mid-class value of cover. These values were averaged by treatment and by species. Analyses were performed using R Statistical Software (v4.1.2; R Core Team 2021).
Max-t tests were used to compare the species means across years successively in the fenced and in the unfenced plots. This test is robust for unbalanced and heteroscedastic datasets [53]. Max-t tests were performed with the R package multcomp 1.4–17 [54] and sandwich 3.0–1 [55,56].
The effect of the treatment (fencing) on the response variables was tested yearly and by species with paired Student t-tests when the differences were normally distributed or with the Wilcoxon rank sum test otherwise [57]. Mixed linear models were adjusted to estimate the effect of ungulate abundance and species-specific growth reductions. However, all available ungulate abundance variables had a negligible contribution, both when predicting the differences between fenced and unfenced plots and when predicting the growth in unfenced plots using fenced plots growth among predictive variables (Figures S8–S11).
Zero counts had to be allowed for the tests, as not every studied species was observed in all plots. For a given species, only the plots where that species was present were taken when computing a specific average of seedling height, density, and cover for the entire study area. However, to assess the treatment effect with the paired t-test (or its non-parametric substitute), a zero value was assigned to the plots with a zero count when the species was recorded in the other paired plot.
We went on to investigate how ungulates affected regeneration diversity and the tolerance of successful seedlings to future climate conditions. We computed the species richness of the dominant seedlings (S) and ecological affinity indices (EAIS). The species richness of the dominant seedlings was defined as the number of species present in each plot. EAI were estimated for temperature (EAIT), atmospheric humidity (EAIH), and light EAIL following a methodology adapted from [58]. The (EAIS) were computed as the mean species aptitude score (SAS) for temperature, humidity, and light weighted by the seedling height (Equation (1)). The species aptitude scores were extracted from the baseflor database [59]. The species aptitude scores are bounded between 0 and 9, with maximum value corresponding to the most thermophilous, hygrophilous, and light-demanding species.
where is the ecological affinity index of the variable (temperature, atmospheric humidity, or light), and and are respectively the species aptitude score and the height of seedling , one of the five tallest seedlings in the plot. The seedlings smaller than 50 cm were discarded to compute and since small seedlings have lower survival probability and are less influenced by ungulates than taller seedlings [2]. The plots without observed seedlings counted for zero in the computation of and were discarded to compute . Similarly to the other variables, the indexes were computed per plot and treatment. The differences were tested with Student t-test or Wilcoxon rank sum test.
3. Results
3.1. Species Frequency
The six most frequently occurring species were Fagus sylvatica L., Quercus, and Picea abies (observed in >300 plots) and, to a lesser extent, Carpinus betulus L., Betula pendula Roth., and Sorbus aucuparia L. (observed in 100–150 plots) (Figure 2). When present in a plot, these species generally had at least one dominant seedling among the five dominant seedlings. The only exception was Quercus, for which dominant seedlings were found in only 60% of the plots with Quercus seedlings (Figure 2). Other species were all present in less than 100 plots (Figure S1).
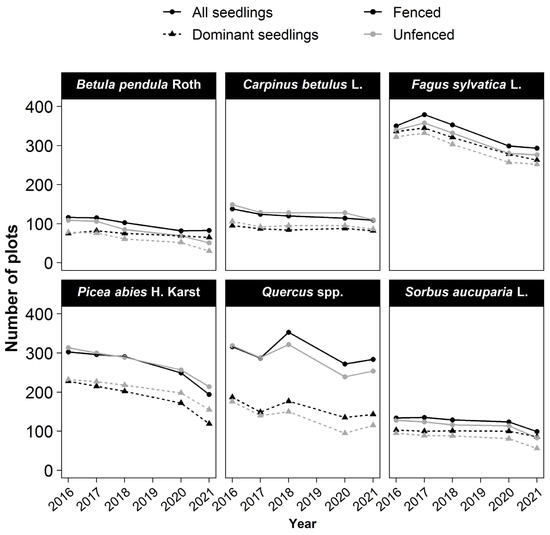
Figure 2.
Changes of species occurrence over time. The number of occurrences for a species is the number of plots where a seedling of the species was present among all seedlings or only among the five tallest in the plot (dominant seedlings) of 734 plots.Symbol (dot or triangle) are used to represent the seedlings. (Dot for all seedligns, Triangle for dominant seedlings.) Colors for the treatment (dark: fenced–grey: unfenced).
The occurrence of every species declined with time in both fenced and unfenced plots (Figure 2 and Figure S2). In the fenced plots, the decline in the number of plots where the species was present was moderate for most species (dominant: 10%–21%; all seedlings: 10%–30%) but substantial for Picea abies (dominant: −48%; all seedlings: −36%). In the unfenced plots, the decline in plot number was moderate only for Fagus sylvatica L. and Carpinus betulus L. (~−20%), whereas it was greater for Picea abies (−33%), Quercus (−35%), Sorbus aucuparia L. (−41%), and especially, birch (−62%). The differences between treatments in the proportion of plots with the occurrence of a species were the highest for Sorbus aucuparia L. (fenced: −17%; unfenced: −41%) and birch (fenced: −13%; unfenced: −62%). Picea abies was the only species for which the plot number decreased more in the fenced than in the unfenced plots.
3.2. Vegetation Cover
In 2016, woody and nonwoody cover and seedlings’ heights were low (cover < 16.72% and height < 32 cm). No significant treatment differences of woody cover were observed in 2016, except for higher bryophytes cover in fenced plots and Calluna vulgaris L. (Figure 3). Woody cover (Figure 3) increased significantly over time. This increase was stronger in the fenced plots (Figure 3). In 2021, it reached 19.21 % (±2.03) in the fenced plots against only 13.62 (±1.69) in the unfenced plots. In contrast, the total cover of non-woody species was slightly lower in 2021 than in 2016 and did not differ between treatments (Figure 3).
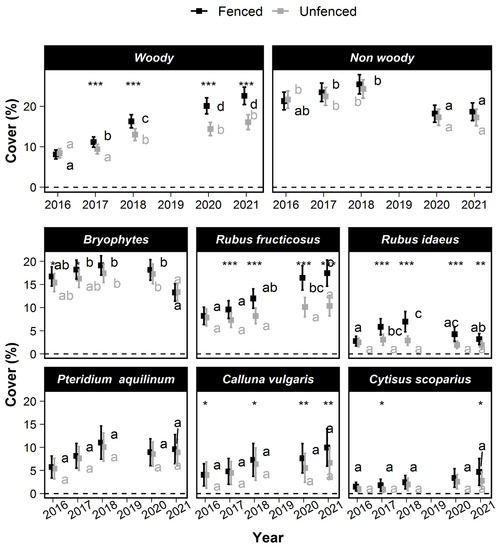
Figure 3.
Changes over time of the mean cover of various taxa in the understory vegetation. The squares show the mean cover values, and the error bars show the 95% confidence intervals. Within a treatment, means that are not significantly different are labeled with a common letter according to the max-t test. Significant treatment effects are symbolized with stars depending on the degree of significance (*: 0.01 < p ≤ 0.05; **: 0.001 < p ≤ 0.01; ***: p < 0.0001).
Taking species individually, the cover of Rubus fructicosus L. increased significantly between 2016 and 2021. The Rubus fructicosus L. cover was 8.22% (±1.87) in 2016 and reached only 10.36% (±2.15%) in unfenced plots versus 17.46% (±2.83%) in the fenced plots. Rubus idaeus L. cover did not increase between 2016 (2.76% ± 1.04%) and 2021 (3.2% ± 1.2%). However, the Rubus idaeus L. cover temporarily reached a higher value in the fenced plots only (6.98% ± 2.2% in 2018). The cover of Calluna vulgaris L., Cytisus scoparius (L.) Link and Rubus idaeus L. remained approximately constant, but their mean cover became significantly higher in the fenced than in the unfenced plots in 2021.
3.3. Seedling Height
In 2016, the Quercus seedlings were significantly shorter than the other species (14 cm ± 2 cm in fenced plots), and Fagus sylvatica L. was significantly taller than the other species (32 cm ± 3 cm) (Figure 4). No significant differences were observed between treatments, except for Carpinus betulus L., which was significantly higher in the unfenced plots (p = 2.6 × 10⁻⁴). In 2021, seedlings of all species except Picea abies were significantly taller in the fenced than in the unfenced plots. The fenced-unfenced difference in the mean height ranged from more than 59 cm for birch and Sorbus aucuparia L. (corresponding to 54% of the mean height in fenced plots) and only −3 cm for Picea abies.
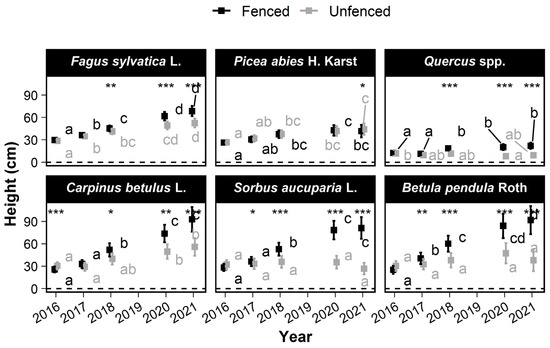
Figure 4.
Changes over time in the mean height of the six most frequently occurring tree species. The squares show the mean height. Error bars show the 95% confidence intervals. Within a treatment, the means without a common letter are significantly different according to the max-t test. Significant treatment effects have stars depending on the level of significance (*: 0.01 < p ≤ 0.05; **: 0.001 < p ≤ 0.01; ***: p < 0.0001).
Compared with the fenced plots, height was reduced for all species, and the rank of species height growth was altered in the unfenced plots (Figure S4). In fenced plots, Carpinus betulus L., Sorbus aucuparia L., and birch grew fastest (>11 cm·year−1), while Quercus and Picea abies grew slowest (<1.4 cm·year−1). Fagus sylvatica L. growth was intermediate (8 cm·year−1 ± 1.1 cm). In the unfenced plots, Fagus sylvatica L. grew fastest (5 cm·year−1 ± 1 cm·year−1), followed by Carpinus betulus L. and Picea abies (>2.3 cm·year−1), and Sorbus aucuparia L. and Quercus grew most slowly (<0.6 cm·year−1). The growth rate of birch was 2 cm·year−1 (±2.8), which was intermediate (but with no significant difference) between those of Sorbus aucuparia L. and Picea abies.
3.4. Seedling Density
No significant differences were observed between treatments in 2016 (Figure 4). Between 2016 and 2021, seedling density varied little except for some species and treatments. Seedling density significantly increased only for Quercus in the fenced plots (1.4 ± 0.2 seedlings m−2 in 2016 vs. 2.1 ± 0.3 seedlings m−2 in 2021). Seedling density decreased for Picea abies (2.2 ± 0.3 seedlings m−2 in 2016 vs. 1 ± 0.2 seedlings m−2 in 2021) and for Fagus sylvatica L. only in the unfenced plots (1.9 ± 0.2 seedlings m−2 in 2016 vs. 1.2 ± 0.2 seedlings m−2 in 2021). No other significant changes occurred between 2016 and 2021.
The treatment effect on seedling density was significant mostly for Fagus sylvatica L. and after masts (Quercus in 2018: 2.6 ± 0.3 seedlings m−2 in fenced vs. 2.1 ± 0.3 seedlings m−2 in unfenced plots; Fagus sylvatica L. in 2017: 2.9 ± 0.3 seedlings m−2 in fenced vs. 2.2 ± 0.2 seedlings m−2 in unfenced plots). The density increases were mitigated, and the drops were accentuated in unfenced plots in comparison with that in fenced plots (Figure 5). The treatment effect on seedling densities was tiny or insignificant for all other species (less than 0.2 seedling·m−2). Nevertheless, this decrease was marked relative to the low densities of Sorbus aucuparia L. and birch seedlings: in the fenced plots, their density was twice that observed in the unfenced plots. The treatment effect was insignificant for Picea abies. Carpinus betulus L. was the only species with more seedlings in the unfenced plots in 2021.
Figure 5.
Changes over time in the mean seedling density of the six most frequently occurring tree species. The squares show the mean height. Error bars show the 95% confidence intervals. Within a treatment, the means without a common letter are significantly different according to the max-t test. Significant treatment effects have stars depending on the level of significance (*: 0.01 < p ≤ 0.05; **: 0.001 < p ≤ 0.01; ***: p < 0.0001).
3.5. Species Richness and Ecological Aptitudes
The treatment modified the composition of the species richness (S) and ecological aptitude indexes (EAI) of the seedlings higher than 50 cm. At the end of the study period, more species were present in the fenced plots than in the unfenced plots. Fenced plot communities were also less shade tolerant, more drought, and more heat tolerant in the fenced plots than in the unfenced plots (Figure 6).
Figure 6.
Change over time of species richness (A) and height-weighted ecological aptitudes indexes of the five tallest seedlings for temperature (B), atmospheric humidity (C), and light (D). High EAI values are obtained for species whose ecological niche is characterized by an elevated temperature, humidity, and light. The squares show the mean value. Error bars show the 95% confidence intervals. Significant treatment effects have stars depending on the level of significance (ns: p > 0.05; *: 0.01 < p ≤ 0.05; **: 0.001 < p ≤ 0.01; ***: p < 0.0001).
No significant differences were observed between treatments in 2016 for any . The species richness of the seedlings (height > 50 cm) increased with time. This rising trend was more pronounced in the fenced than in the unfenced plots, resulting in a large difference between the two treatments in 2021, 1.27 ± 0.09 species.m−2 in the fenced plots, versus only 0.88 ± 0.08 species.m−2 in the unfenced plots in 2021 (significant difference, p = 37.60 × 10⁻¹⁵).
In 2021, the mean EAIT was higher in the fenced plots (5.061 ± 0.029) than in the unfenced plots (5.006 ± 0.007), and the mean EAIL was higher in the fenced plots (7.157 ± 0.044) than in the unfenced plots (7.046 ± 0.033). The mean EAIH was lower in the fenced plots (6.256 ± 0.135) than in the unfenced plots (6.631 ± 0.139) (p < 0.05).
Observations differed, however, across the three natural regions. The differences between fenced and unfenced plots showed the same patterns and significance for coniferous and broadleaves in Ardenne but were smaller and non-significant in Famenne, where the number of plots was also smaller (Figures S5 and S6).
4. Discussion
4.1. Study Scope and Limitations
Although our observations were limited to the first stage of natural regeneration development (Figure S3), we could confidently identify future tree recruitment bottlenecks. We measured mostly small seedlings that had not yet escaped ungulate browsing [24,42,60,61], but over the study period, we observed significant species-specific changes in seedling growth and, consequently, in the ranking of species in terms of height growth or competitiveness. As the tallest seedlings have the highest survival probability [23] and as species growth ranking generally remains stable [62], we can assume that the future species composition of tree recruitment can be deduced from seedling growth ranks. In particular, species with negligible growth can fail to recruit, which is well in line with the regeneration failures observed in the study area [50,63] (Figure S7).
Furthermore, our observations of ungulate impact on seedling growth are valid on a wide range of Cervus elaphus abundance and, unfortunately, an unknown abundance of Capreolus capreolus. Abundance indicators available are reliable for Cervus elaphus [43], contrarily to Capreolus capreolus, which can also have a severe impact on regeneration [64]. Indeed, Capreolus capreolus is a browser and income-breeder species whose population growth rate is sensitive to hunting pressure for lower browsing pressure levels [37,65,66] and is negatively affected by Cervus elaphus abundance since their diet partially overlaps. The diet of Capreolus capreolus is more restrictive than the diet of the Cervus elaphus [51,52,67,68,69]. Harvest statistics are thus susceptible to poorly representing the standing population of Capreolus capreolus because of the higher density dependence of population growth rate than red deer in the conditions of the study.
4.2. Interaction between Seedlings, Herbaceous Vegetation, and Browsing
Understory vegetation may substantially shape recruitment niches for tree seedlings, with both positive and negative effects on recruitment probability. A large cover of competitive understory vegetation may increase seedling mortality but also divert browsing from less palatable tree seedlings [61,70]. In parallel, browsing may facilitate seedling growth by preferentially consuming competitive species (e.g., Rubus fructicosus L.) or facilitate herbaceous species by preferentially consuming tree seedlings [70,71,72]. The results of this study show that ungulates reduced woody cover but did not affect non-woody cover (Figure 1 and Figure 3). This is consistent with a recent meta-analysis [2]. This finding was nevertheless obtained for initial conditions with low cover of understory competing vegetation. Different results could have been expected if the initial conditions had been different [72], and particularly if the cover of competitive species such as Rubus fructicosus L. had been higher, as often occurs when canopy cover is lower.
4.3. How Browsing Alters Seedling Competition and Likely Recruitment
4.3.1. Seedling Height
Growth observations give information on the species’ regeneration niches (the sets of conditions in which species naturally thrive). Walters (2020) [61] identified three distinct species groups (broad, high-light, and nowhere) according to their regeneration niches shaped by light, browsing pressure, and understory vegetation competition. Walters’s study was carried out in eastern North America, but the species niches and their respective species groups are also relevant to our study.
The broad species are more shade-tolerant and less affected by browsing. Their juvenile growth in high-light conditions is lower than that of high-light species, but their seedlings can survive at lower light levels than the other groups. Their sit-and-wait strategy allows the establishment and maintenance of seedling populations (i.e., advance regeneration) that can then rapidly develop when the conditions become more favorable and thus dominate regeneration over wide ranges of stand density and ungulate pressure [62,72]. The highlight species are shade- and browsing-sensitive, but their growth is faster than other species under low canopy cover. In such conditions, they escape vegetation competition and ungulate pressure. The nowhere species are browsing-sensitive and shade-intolerant. They are outcompeted by the other species, faster growing over the full range of light availability. As a consequence, they have no regeneration niche in forests.
Our results indicate that Sorbus aucuparia L. and Betula pendula Roth are high-light species, Fagus sylvatica L. and Picea abies broad species, and Quercus a nowhere species. The ranking of the species is consistent with the group definitions for browsing sensitivity [6,10,25,35,42,73,74,75], shade tolerance [23,76], and how their growth is affected by light conditions (Figure S8). When canopy cover is low, birch and Sorbus aucuparia L. grow faster than other species, and ungulate pressure reduction can strongly increase their recruitment, in contrast to Quercus, which grows slowly and whose development is strongly affected by other competing species.
Unlike the other species, Carpinus betulus L. can be classified into two regeneration groups as it combines both the competitive advantages of high-light and broad species and dominates these two regeneration niches. Like high-light species, Carpinus betulus L. has fast growth potential (Figure 3) and is highly palatable (e.g., [42]). However, because of its architectural traits and its high seedling density (Figure 4), Carpinus betulus L. is also highly browsing-resistant [77,78], and its growth remained sustained (Figure 3). We note that Carpinus betulus L. was not evenly distributed over the study area and was found mainly in the Famenne region.
4.3.2. Seedling Density and Species Occurrence
Our results suggest that ungulate impact on seedling presence and density is limited to particular species (Figure 1 and Figure 4). After masts, the seedling density of Quercus and Fagus sylvatica L. significantly increased in the fenced but not in the unfenced plots (Figure 4). This is probably because acorns and beechnuts, contrary to the seeds or fruits of the other species, compose the greater part of the ungulate diet in autumn and winter [28,78,79]. Variation of seedling density is assumed, however, to have little effect on the growth and survival of already established seedlings and to barely affect the future diversity of tree recruitment.
Browsing did reduce the seedling occurrence of some species, but this reduction was observed only after approximately 4 years (Figure 2). Because of browsing, some species grow sparingly in height, become dominated by less browsing-sensitive species, and gradually disappear. This was observed for highlight species in our study (Figure 2) and supported our assumption that the browsing effect on seedling growth is a good indicator of future tree recruitment, according to [80].
4.4. Ungulate Impact on Forest Diversity, Resilience, and Succession
A recent literature review [8] gathers evidence that ungulates often counteract strategies to increase forest resilience against global changes in temperate and boreal forests. Such strategies are generally based on maintaining or increasing forest tree diversity [81], promoting the species best adapted to the expected future conditions [82]. In naturally regenerated forests, regeneration is a key component of this adaptation because the regenerated species may determine forest composition for decades. Forest disturbances, including anthropic disturbances, foster the development of heat-tolerant species and thus reduces the climate debt of understory plant communities [58,83].
Our results corroborate the trend highlighted by [8] in the Quercus-Fagus forest managed by continuous cover forestry (Figure 6B,C). Ungulates favored Fagus sylvatica L., and Picea abies over the less frequent and more heat- and drought-adapted species. Fagus sylvatica L. has been negatively affected by heat and drought extremes since the 1980s [84,85], and large diebacks may occur in large portions of the current species distribution range [20]. Similarly, Picea abies has suffered increasingly from bark beetle outbreaks, and its distribution is expected to shrink appreciably [86,87,88]. As several species are more heat- and drought-tolerant than Fagus sylvatica L. and Picea abies, increasing their share in the forest species composition would reduce climate risks [89,90,91,92,93,94,95]. Moreover, shade-intolerant species in a mixture with Fagus sylvatica L. have been shown to reduce Fagus sylvatica L.’s sensitivity to extremes of drought [17,18,95,96,97].
Both our results and the literature show frequent directional effects of ungulates on the succession dynamics but with a direction varying with the relative browsing sensitivity of the early and late succession species. Ungulates accelerate succession dynamics in Fagus sylvatica L.-dominated forests [19,24,97] and Picea abies-dominated forests [98,99], where the late succession species are least palatable for browsing. In contrast, ungulates slowed the succession dynamics in mixed Picea abies-Abies alba forests [100] and in boreal forests of balsam fir [99], where late succession species are highly palatable.
Our results showed that both ungulate impacts on species richness and forest adaptation to future climate and on succession dynamics depend on the species assemblage, explained by the site conditions. We found that these impacts were significant in the Quercus-Fagus forests of the Ardenne region but not in the Quercus-Carpinus forests of Famenne. In Ardenne, ungulates reversed the dominance of the minority high-light species, whereas, in Famenne, Carpinus betulus L. dominated with and without ungulate exclusion. No significant differences in EAI and species richness were therefore found between treatments in Famenne, unlike Ardenne (Figures S5 and S6).
4.5. Management Perspectives: The Need to Consider Forest Succession
Our results evidenced that ungulate exclusion creates conditions compatible with high-light species regeneration in the sylvicultural context of our study. Contrarily, ungulate exclusion seems not enough to guarantee Quercus establishment without additional appropriate interventions to limit competition with other seedlings and shrub species [21,101,102,103,104,105,106]. The Quercus regeneration niche corresponds mostly to transitional grassland-forest interfaces and a few specific forest sites where competition with other tree species is limited [107,108,109]. Nevertheless, excessive ungulate pressure potentially thwarts the installations of these two species groups and must be modulated adequately.
Population control is one of the most effective measures to mitigate the ungulate impact on forest regeneration [110]. However, as high-light species growth remained negligible, including in the parts of our study area without the presence of Cervus elaphus (Figures S9–S11), no credible abundance thresholds could be identified. Higher Capreolus capreolus and Sus scrofa populations could have compensated for the lower Cervus elaphus pressures in these areas [67]. Important Sus scrofa populations growth rates and increase of Capreolus capreolus populations growth rate below carrying capacity may raise feasibility and ethical issues to strategies only based on ungulate population control only [28,111]. Indeed hobby hunters are responsible for the majority of ungulates mortality, and their efficiency may be limited by their lack of motivation [112], falling number [31], and societal opposition [31,112,113,114], particularly without clear scientifically identified targets [31,35,113,114].
Cutting regimes could be instrumental in modulating ungulate pressure and recruitment of the most impacted species. Current cutting regimes, based on tree-level selective felling, create small resource hotspots for regeneration that are also resource hotspots for ungulates where their pressure on tree regeneration dramatically increases [42,60,70,115]. Such a foodscape is a typical ‘herbivore pit’ for the most preferred species [116]. This fine-level spatial behavior might explain why ungulate density estimated at a large scale often poorly accounts for local regeneration successes [24,70,117]. Moreover, these succession dynamics present positive feedback as tree species loss is exacerbated by high Fagus sylvatica L. proportion [24].
Reducing canopy cover in large areas is a promising way to counteract the species erosion caused by the natural succession process. Sharp increases in the preferred feeding resource abundance dilute ungulate impact [117] and create timely windows of opportunity for the regeneration of the most sensitive species. The benefits of such conditions as the establishment of early successional species may be decades long-lasting [118] and sustain underrepresented early successional dwelling species [119,120]. Higher stand- and landscape-level diversity and higher ecosystem complexity could result from such a system than landscape-level homogeneous conditions not favorable to early succession installation [121,122,123]. Such strategies, combined with ungulate population control, have been identified as a key measure of Quercus regeneration success in North America [46]. Subordinating ungulate management to regeneration success and applying additional strategies such as alteration of ungulate frequentation from key regeneration areas [124] would potentially be more feasible and acceptable on such limited proportions of forest areas than long-lasting high regulation pressure generalized to the whole forest area.
5. Conclusions
Our study demonstrates the determinant impact of ungulates on the regeneration of Quercus-Fagus forests managed by continuous cover forestry. The analysis of 734 pairs of 6 m2 fenced and unfenced plots pairs evidenced that ungulates strongly reduced the growth of the dominant seedlings, the seedling density, and the cover of herbaceous species, but no clear positive impact on seedling growth could be evidenced (i). Seedling growth reductions were species-specific (ii) and altered the ranks of the species’ mean height growth in favor of Fagus sylvatica L. and Picea abies Karts ((iii) (a)). Ungulates reduced the species richness and favored a species composition less adapted to drought and heat conditions ((iii) (b–c)). Maintaining such conditions could increase risks of tree dieback if tipping points are reached for the species the less adapted to heat and drought extremes. Management strategies should be identified to increase the number of seedling species with significant height growth. Ungulate population reduction below the values sampled in this study could foster the regeneration success of Betula pendula Roth. and Sorbus aucuparia L., but is unlikely to significantly increase Quercus regeneration success if competition with other tree species is not controlled. Future studies should explore the benefit of a cutting regime aiming to produce a timely high abundance of palatable vegetation in the European Quercus-Fagus forests context. Such a management strategy could be more efficient than solely focusing on population control under the current cutting regime, as the local increase of resource utilization by ungulates thwarts the benefits of a local improvement of the growth conditions for shade-intolerant species seedlings.
Supplementary Materials
The following supporting information can be downloaded at: https://www.mdpi.com/article/10.3390/f14071330/s1, Figure S1: Number of occurrences of studied tree species and of less abundant species; Figure S2: Drop of species occurrences; Figure S3: Distribution of the height of the highest seedling by plot regardless of the species and its evolution over time; Figure S4: Mean growth of the highest seedling by plot; Figure S5: Evolution over time of species richness (S) and height-weighted ecological aptitudes in Ardenne; Figure S6: Evolution over time of species richness (S) and height-weighted ecological aptitudes in Famenne; Figure S7: Mean of the basal area spread by tree girth classes. Data were provided by Regional Forest Inventory of Wallonia (SPW-ARNE). Only the plots that fitted the forest types of the article were included. The forest types included were the Oak, Oak-beech, and Beech (Alderweireld et al. (2015)) [50]. Quercus robur and petraea and Fagus sylvatica contribute at least to two thirds of the basal area in these plots (single or together). Inside these plots, the 6 species presented were those observed in the highest number of plots in the fenced-unfenced network. The plots selected for this figure had a basal area equal to, or greater than 10 m²/ha during the two inventory cycles as most the plots in the fenced-unfenced network. This figure shows that the tree species diversity is very weak in the oak-beech forests of Wallonia. Moreover, the frequency distribution of basal areas of the 2 most frequent species highlight an ongoing succession process. Beech is the only pervasive species whose tree recruitment sustain stable demographic structure. In contrary, oak abundance will strongly decline if its low recruitment rate is maintained in the long term. Other species are marginal for individuals with girth higher than 20 cm; Figure S8: Distribution of growth of the 6 studied tree species vs. basal area; Figure S9: Height growth frequency distribution vs. red deer shots at forest district level; Figure S10: Height growth frequency distribution vs. spatially smoothed red deer harvests; Figure S11: Height growth frequency distribution vs. red deer abundance estimates.
Author Contributions
Conceptualization: P.L., A.L., V.F. and J.L.; methodology: R.C., A.L., V.F. and J.L.; formal analysis: R.C.; investigation: R.C.; resources, A.L.; data curation, A.L., V.F. and J.L.; writing—original draft preparation, R.C.; writing—review and editing: G.L., M.J. and F.A.; supervision: A.L. and P.L.; project administration, A.L. and P.L.; funding acquisition, P.L., A.L., M.J. and G.L. All authors have read and agreed to the published version of the manuscript.
Funding
This research was funded by the SPW, ACRVF 2014–2019, and by the belspo, BRAIN-BE 2.0 program for the analysis finalization and redaction.
Data Availability Statement
Script used for data analysis, database, and supporting information will be provided upon reasonable request.
Acknowledgments
We are grateful to all the persons that contributed to the experimentation. Some of the most determinant contributions are listed, but many more were not mentionned. Mikhaïl Pitchugin1 and Samuel Quevauvillers1 designed and maintained the database and data registration interface, Benoit Mackels1, Coralie Mengal1 and François Lehaire1 brought determinant contribution to the experimental setup. André Thibault2, Jérôme Perrin1&2 and Justin Holvoet1&2 provided data and support to describe forest structure. Numerous DNF3 operators measured and maintained the experimental setup. SRFB4 operators, Isaline de Wilde, and and their volunteers rigorously collected data and maintained the experimental setup. Students also contributed to data curation and collection: Alice Martin, Malaurie Puyal and Adrien Lajarigue. 1. Gembloux Agro-Bio Tech (ULiège); 2. Regional Forest Inventory–Public Service of Wallonia–Agriculture, Natural Resources and the Environment; 3. Nature and Forests Department; 4. Royal Forestry Society of Belgium.
Conflicts of Interest
The authors declare no conflict of interest. The funders had no role in the design of the study; in the collection, analyses, or interpretation of data; in the writing of the manuscript; or in the decision to publish the results.
Appendix A

Table A1.
Main climatic, soil, and vegetation conditions in the three main natural regions of the study area. Climate data are from Van der Perre et al. 2015. Climax vegetation was evaluated by Hendrickx and Van der Kaa, 2015 and is described following the 2020 EUNIS habitat classification [125].
Table A1.
Main climatic, soil, and vegetation conditions in the three main natural regions of the study area. Climate data are from Van der Perre et al. 2015. Climax vegetation was evaluated by Hendrickx and Van der Kaa, 2015 and is described following the 2020 EUNIS habitat classification [125].
| Ardenne | Famenne | Lorraine | |
|---|---|---|---|
| Sampled area (km2) | 2271 | 320 | 239 |
| Mean altitude (m a.s.l.) | 425 | 227 | 322 |
| Soil | silty | silty | sandy |
| Gravel fraction | sandstone/shist | shale/chalk | |
| Climax vegetation | Western Hercynian collinar woodrush Fagus forests (T1-8111), Western Hercynian woodrush-hawksbeard Quercus forests (T1B711), and Sphagnum-rich Betula pubescens wood (T1-612) | Famenian Quercus-Carpinus betulus forests (T1-E15) | Medio-European wood barley Fagus sylvatica forests (T1-7111) and Sub-Atlantic sessile Quercus forests (T1-B21) |
| Mean temperature (°C) | 7.7 to 8.7 | 9.5 | 8.9 to 9.3 |
| Mean annual precipitations (mm) | 1170 to 1219 | 976 | 1170 to 1179 |
| Duration of vegetation period (days) | 151 to 163 | 174 | 163 to 168 |
Appendix B

Figure A1.
Fenced plot (backward in wooden lattice) and unfenced plot (forward, center at wooden pole).
Figure A1.
Fenced plot (backward in wooden lattice) and unfenced plot (forward, center at wooden pole).

References
- Baltzinger, M.; Mårell, A.; Archaux, F.; Pérot, T.; Leterme, F.; Deconchat, M. Overabundant ungulates in French Sologne? Increasing red deer and wild boar pressure may not threaten woodland birds in mature forest stands. Basic Appl. Ecol. 2016, 17, 552–563. [Google Scholar] [CrossRef]
- Bernes, C.; Macura, B.; Jonsson, B.G.; Junninen, K.; Müller, J.; Sandström, J.; Lõhmus, A.; Macdonald, E. Manipulating ungulate herbivory in temperate and boreal forests: Effects on vegetation and invertebrates. A systematic review. Environ. Evid. 2018, 7, 23–32. [Google Scholar] [CrossRef]
- Churski, M.; Bubnicki, J.W.; Jędrzejewska, B.; Kuijper, D.P.J.; Cromsigt, J.P.G.M. Brown world forests: Increased ungulate browsing keeps temperate trees in recruitment bottlenecks in resource hotspots. New Phytol. 2017, 214, 158–168. [Google Scholar] [CrossRef]
- Boulanger, V.; Baltzinger, C.; Saïd, S.; Ballon, P.; Picard, J.-F.; Dupouey, J.-L. Decreasing deer browsing pressure influenced understory vegetation dynamics over 30 years. Ann. For. Sci. 2015, 72, 367–378. [Google Scholar] [CrossRef]
- Nuttle, T.; Ristau, T.E.; Royo, A.A. Long-term biological legacies of herbivore density in a landscape-scale experiment: Forest understoreys reflect past deer density treatments for at least 20 years. J. Ecol. 2014, 102, 221–228. [Google Scholar] [CrossRef]
- Ramirez, J.I.; Jansen, P.A.; den Ouden, J.; Goudzwaard, L.; Poorter, L. Long-term effects of wild ungulates on the structure, composition and succession of temperate forests. For. Ecol. Manag. 2019, 432, 478–488. [Google Scholar] [CrossRef]
- Klopcic, M.; Jerina, K.; Boncina, A. Long-term changes of structure and tree species composition in Dinaric uneven-aged forests: Are red deer an important factor? Eur. J. Forest Res. 2010, 129, 277–288. [Google Scholar] [CrossRef]
- Champagne, E.; Raymond, P.; Royo, A.A.; Speed, J.D.M.; Tremblay, J.-P.; Côté, S.D. A Review of Ungulate Impacts on the Success of Climate-Adapted Forest Management Strategies. Curr. For. Rep. 2021, 7, 305–320. [Google Scholar] [CrossRef]
- Fisichelli, N.; Frelich, L.E.; Reich, P.B. Sapling growth responses to warmer temperatures ‘cooled’ by browse pressure. Glob. Chang. Biol. 2012, 18, 3455–3463. [Google Scholar] [CrossRef]
- Katona, K.; Kiss, M.; Bleier, N.; Székely, J.; Nyeste, M.; Kovács, V.; Terhes, A.; Fodor, Á.; Olajos, T.; Rasztovits, E.; et al. Ungulate browsing shapes climate change impacts on forest biodiversity in Hungary. Biodivers. Conserv. 2013, 22, 1167–1180. [Google Scholar] [CrossRef]
- Jactel, H.; Bauhus, J.; Boberg, J.; Bonal, D.; Castagneyrol, B.; Gardiner, B.; Gonzalez-Olabarria, J.R.; Koricheva, J.; Meurisse, N.; Brockerhoff, E.G. Tree Diversity Drives Forest Stand Resistance to Natural Disturbances. Curr. For. Rep. 2017, 3, 223–243. [Google Scholar] [CrossRef]
- Klenk, N.; Adams, B.; Bull, G.; Innes, J.; Cohen, S.; Larson, B. Climate change adaptation and sustainable forest management: A proposed reflexive research agenda. For. Chron. 2011, 87, 351–357. [Google Scholar] [CrossRef]
- Lebourgeois, F.; Gomez, N.; Pinto, P.; Mérian, P. Mixed stands reduce Abies alba tree-ring sensitivity to summer drought in the Vosges mountains, western Europe. For. Ecol. Manag. 2013, 303, 61–71. [Google Scholar] [CrossRef]
- Neuner, S.; Albrecht, A.; Cullmann, D.; Engels, F.; Griess, V.C.; Hahn, W.A.; Hanewinkel, M.; Härtl, F.; Kölling, C.; Staupendahl, K.; et al. Survival of Norway spruce remains higher in mixed stands under a dryer and warmer climate. Glob. Chang. Biol. 2015, 21, 935–946. [Google Scholar] [CrossRef] [PubMed]
- Pretzsch, H.; Schütze, G.; Uhl, E. Resistance of European tree species to drought stress in mixed versus pure forests: Evidence of stress release by inter-specific facilitation: Drought stress release by inter-specific facilitation. Plant Biol. 2013, 15, 483–495. [Google Scholar] [CrossRef]
- Vacek, Z.; Prokůpková, A.; Vacek, S.; Bulušek, D.; Šimůnek, V.; Hájek, V.; Králíček, I. Mixed vs. monospecific mountain forests in response to climate change: Structural and growth perspectives of Norway spruce and European beech. For. Ecol. Manag. 2021, 488, 119019. [Google Scholar] [CrossRef]
- Vallet, P.; Pérot, T. Silver fir stand productivity is enhanced when mixed with Norway spruce: Evidence based on large-scale inventory data and a generic modelling approach: Silver fir stand productivity is enhanced when mixed with Norway spruce. J. Veg. Sci. 2011, 22, 932–942. [Google Scholar] [CrossRef]
- Vannoppen, A.; Kint, V.; Ponette, Q.; Verheyen, K.; Muys, B. Tree species diversity impacts average radial growth of beech and oak trees in Belgium, not their long-term growth trend. For. Ecosyst. 2019, 6, 10. [Google Scholar] [CrossRef]
- Antonucci, S.; Santopuoli, G.; Marchetti, M.; Tognetti, R.; Chiavetta, U.; Garfì, V. What Is Known About the Management of European Beech Forests Facing Climate Change? A Review. Curr. For. Rep. 2021, 7, 321–333. [Google Scholar] [CrossRef]
- Martinez del Castillo, E.; Zang, C.S.; Buras, A.; Hacket-Pain, A.; Esper, J.; Serrano-Notivoli, R.; Hartl, C.; Weigel, R.; Klesse, S.; Resco de Dios, V.; et al. Climate-change-driven growth decline of European beech forests. Commun. Biol. 2022, 5, 163. [Google Scholar] [CrossRef]
- Annighöfer, P.; Beckschäfer, P.; Vor, T.; Ammer, C. Regeneration Patterns of European Oak Species (Quercus petraea (Matt.) Liebl., Quercus robur L.) in Dependence of Environment and Neighborhood. PLoS ONE 2015, 10, e0134935. [Google Scholar] [CrossRef]
- Rohner, B.; Bigler, C.; Wunder, J.; Brang, P.; Bugmann, H. Fifty years of natural succession in Swiss forest reserves: Changes in stand structure and mortality rates of oak and beech. J. Veg. Sci. 2012, 23, 892–905. [Google Scholar] [CrossRef]
- Ligot, G.; Balandier, P.; Fayolle, A.; Lejeune, P.; Claessens, H. Height competition between Quercus petraea and Fagus sylvatica natural regeneration in mixed and uneven-aged stands. For. Ecol. Manag. 2013, 304, 391–398. [Google Scholar] [CrossRef]
- Schulze, E.D.; Bouriaud, O.B.; Wäldchen, J.; Eisenhauer, N.; Walentowski, H.; Seele, C.; Heinze, E.; Pruschitzki, U.P.; Dănilă, G.; Marin, G.; et al. Ungulate browsing causes species loss in deciduous forests independent of community dynamics and silvicultural management in Central and Southeastern Europe. Ann. For. Res. 2014, 57, 1. [Google Scholar] [CrossRef]
- Didion, M.; Kupferschmid, A.D.; Wolf, A.; Bugmann, H. Ungulate herbivory modifies the effects of climate change on mountain forests. Clim. Chang. 2011, 109, 647–669. [Google Scholar] [CrossRef]
- Ramirez, J.I.; Jansen, P.A.; Poorter, L. Effects of wild ungulates on the regeneration, structure and functioning of temperate forests: A semi-quantitative review. For. Ecol. Manag. 2018, 424, 406–419. [Google Scholar] [CrossRef]
- Apollonio, M.; Andersen, R.; Rory, P. European Ungulates and Their Management in the 21st Century; Cambridge University Press: Cambridge, UK, 2010. [Google Scholar]
- Bieber, C.; Ruf, T. Population dynamics in wild boar Sus scrofa: Ecology, elasticity of growth rate and implications for the management of pulsed resource consumers. J. Appl. Ecol. 2005, 42, 1203–1213. [Google Scholar] [CrossRef]
- Essen, E.; Tickle, L. Leisure or Labour: An Identity Crisis for Modern Hunting? Sociol. Ruralis. 2020, 60, 174–197. [Google Scholar] [CrossRef]
- Keuling, O.; Strauß, E.; Siebert, U. Regulating wild boar populations is “somebody else’s problem”!–Human dimension in wild boar management. Sci. Total Environ. 2016, 554–555, 311–319. [Google Scholar] [CrossRef]
- Riley, S.J.; Decker, D.J.; Enck, J.W.; Curtis, P.D.; Lauber, T.B.; Brown, T.L. Deer populations up, hunter populations down: Implications of interdependence of deer and hunter population dynamics on management. Écoscience 2003, 10, 455–461. [Google Scholar] [CrossRef]
- Bertouille, S.B.; de Crombrugghe, S.A. Fertiliy of red deer in relation to area, age, body mass, and mandible length. Z. Für Jagdwiss. 2002, 48, 87–98. [Google Scholar]
- Coulson, T.; Guinness, F.; Pemberton, J.; Clutton-Brock, T. The demographic consequences of releasing a population of red deer from culling. Ecology 2004, 85, 411–422. [Google Scholar] [CrossRef]
- Quirós-Fernández, F.; Marcos, J.; Acevedo, P.; Gortázar, C. Hunters serving the ecosystem: The contribution of recreational hunting to wild boar population control. Eur. J. Wildl. Res. 2017, 63, 57. [Google Scholar] [CrossRef]
- Hothorn, T.; Müller, J. Large-scale reduction of ungulate browsing by managed sport hunting. For. Ecol. Manag. 2010, 260, 1416–1423. [Google Scholar] [CrossRef]
- Leclère, L.; Lejeune, P.; Bolyn, C.; Latte, N. Estimating Species-Specific Stem Size Distributions of Uneven-Aged Mixed Deciduous Forests Using ALS Data and Neural Networks. Remote Sens. 2022, 14, 1362. [Google Scholar] [CrossRef]
- Morellet, N.; Gaillard, J.-M.; Hewison, A.J.M.; Ballon, P.; Boscardin, Y.; Duncan, P.F.; Maillard, D. Indicators of ecological change: New tools for managing populations of large herbivores: Ecological indicators for large herbivore management. J. Appl. Ecol. 2007, 44, 634–643. [Google Scholar] [CrossRef]
- Chevrier, T.; Saïd, S.; Widmer, O.; Hamard, J.-P.; Saint-Andrieux, C.; Gaillard, J.-M. The oak browsing index correlates linearly with roe deer density: A new indicator for deer management? Eur. J. Wildl. Res. 2012, 58, 17–22. [Google Scholar] [CrossRef]
- Hagen, R.; Kühl, N.; Hanewinkel, M.; Suchant, R. Number and height of unbrowsed saplings are more appropriate than the proportion of browsed saplings for predicting silvicultural regeneration success. Ann. For. Sci. 2021, 78, 21. [Google Scholar] [CrossRef]
- Berwert-Lopes, R. Assessment of tolerable browsing by Eiberle’s method: Limitations and future prospects. For. Ecol. Manag. 1996, 88, 87–91. [Google Scholar] [CrossRef]
- Angst, J.K.; Kupferschmid, A.D. Assessing Browsing Impact in Beech Forests: The Importance of Tree Responses after Browsing. Diversity 2023, 15, 262. [Google Scholar] [CrossRef]
- Borowski, Z.; Gil, W.; Bartoń, K.; Zajączkowski, G.; Łukaszewicz, J.; Tittenbrun, A.; Radliński, B. Density-related effect of red deer browsing on palatable and unpalatable tree species and forest regeneration dynamics. For. Ecol. Manag. 2021, 496, 119442. [Google Scholar] [CrossRef]
- Candaele, R.; Lejeune, P.; Licoppe, A.; Malengreaux, C.; Brostaux, Y.; Morelle, K.; Latte, N. Mitigation of bark stripping on spruce: The need for red deer population control. Eur. J. For. Res. 2021, 140, 227–240. [Google Scholar] [CrossRef]
- Suzuki, K.; Watanabe, Y.T.; Kuwano, Y.; Kawauchi, Y.H.; Yasuda, M.; Kondoh, H.; Nomiya, H.; Oka, T. Large-scale spatial distribution of deer browsing damage to young tree plantations. iForest 2021, 14, 34–40. [Google Scholar] [CrossRef]
- Pommerening, A. A review of the history, definitions and methods of continuous cover forestry with special attention to afforestation and restocking. Forestry 2004, 77, 27–44. [Google Scholar] [CrossRef]
- Chokkalingam, U. Secondary forest: A working definition and typology. Int. For. Rev. 2001, 3, 19–26. [Google Scholar]
- Metzger, M.J.; Bunce, R.G.H.; Jongman, R.H.G.; Mücher, C.A.; Watkins, J.W. A climatic stratification of the environment of Europe: A climatic stratification of the European environment. Glob. Ecol. Biogeogr. 2005, 14, 549–563. [Google Scholar] [CrossRef]
- Caudullo, G.; Welk, E.; San-Miguel-Ayanz, J. Chorological maps for the main European woody species. Data Brief 2017, 12, 662–666. [Google Scholar] [CrossRef]
- Latte, N. Forest Mask of Wallonia 2018. Géoportail de la Wallonie. 2020. Available online: https://geoportail.wallonie.be/catalogue/2a5ef10f-36f8-4bb0-9188-781ac089b7ce.html (accessed on 20 February 2020).
- Alderweireld, M.; Burnay, F.; Pitchugin, M.; Lecomte, H. Inventaire Forestier Wallon: Résultats 1994–2012. SPW–DGO3; SPW éditions: Namur, Belgium, 2015. [Google Scholar]
- Storms, D.; Aubry, P.; Hamann, J.-L.; Saïd, S.; Fritz, H.; Saint-Andrieux, C.; Klein, F. Seasonal variation in diet composition and similarity of sympatric red deer Cervus elaphus and roe deer Capreolus capreolus. Wildl. Biol. 2008, 14, 237–250. [Google Scholar] [CrossRef]
- Latham, J.; Staines, B.W.; Gorman, M.L. Comparative feeding ecology of red (Cervus elaphus) and roe deer (Capreolus capreolus) in Scottish plantation forests. J. Zool. 1999, 247, 409–418. [Google Scholar] [CrossRef]
- Herberich, E.; Sikorski, J.; Hothorn, T. A Robust Procedure for Comparing Multiple Means under Heteroscedasticity in Unbalanced Designs. PLoS ONE 2010, 5, 346–363. [Google Scholar] [CrossRef]
- Torsten Hothorn; Frank Bretz; Peter Westfall Simultaneous Inference in General Parametric Models. Biom. J. 2008, 50, 346–363. [CrossRef] [PubMed]
- Zeileis A Object-Oriented Computation of Sandwich Estimators. J. Stat. Softw. 2006, 16, 1–16. [CrossRef]
- Zeileis, A.; Köll, S.; Graham, N. Various Versatile Variances: An Object-Oriented Implementation of Clustered Covariances in R. J. Stat. Softw. 2020, 95, 1–36. [Google Scholar] [CrossRef]
- R Core Team. R: A Language and Environment for Statistical Computing; R Foundation for Statistical Computing: Vienna, Austria, 2021. [Google Scholar]
- Richard, B.; Dupouey, J.; Corcket, E.; Alard, D.; Archaux, F.; Aubert, M.; Boulanger, V.; Gillet, F.; Langlois, E.; Macé, S.; et al. The climatic debt is growing in the understorey of temperate forests: Stand characteristics matter. Glob. Ecol. Biogeogr. 2021, 30, 1474–1487. [Google Scholar] [CrossRef]
- Julve, P. Baseflor. Index Botanique, Écologique et Chorologique de la Flore de France. Version 29/01/2019. 1998. Available online: https://philippe.julve.pagesperso-orange.fr/catminat.htm (accessed on 22 March 2023).
- Kupferschmid, A.D.; Bütikofer, L.; Hothorn, T.; Schwyzer, A.; Brang, P. Ungulate Species and Abundance as well as Environmental Factors Determine the Probability of Terminal Shoot Browsing on Temperate Forest Trees. Forests 2020, 11, 764. [Google Scholar] [CrossRef]
- Walters, M.B.; Farinosi, E.J.; Willis, J.L. Deer browsing and shrub competition set sapling recruitment height and interact with light to shape recruitment niches for temperate forest tree species. For. Ecol. Manag. 2020, 467, 118134. [Google Scholar] [CrossRef]
- Szwagrzyk, J.; Maciejewski, Z.; Maciejewska, E.; Tomski, A.; Gazda, A. Forest recovery in set-aside windthrow is facilitated by fast growth of advance regeneration. Ann. For. Sci. 2018, 75, 80. [Google Scholar] [CrossRef]
- Manso, R.; Ligot, G.; Fortin, M. A recruitment model for beech–oak pure and mixed stands in Belgium. For. Int. J. For. Res. 2020, 93, 124–132. [Google Scholar] [CrossRef]
- Pettorelli, N.; Gaillard, J.-M.; Duncan, P.; Ouellet, J.-P.; Van Laere, G. Population density and small-scale variation in habitat quality affect phenotypic quality in roe deer. Oecologia 2001, 128, 400–405. [Google Scholar] [CrossRef]
- Andersen, R.; Gaillard, J.-M.; Linnell, J.D.C.; Duncan, P. Factors affecting maternal care in an income breeder, the European roe deer. J. Anim. Ecol. 2000, 69, 672–682. [Google Scholar] [CrossRef]
- Nilsen, E.B.; Linnell, J.D.C.; Andersen, R. Individual access to preferred habitat affects fitness components in female roe deer Capreolus capreolus. J. Anim. Ecol. 2004, 73, 44–50. [Google Scholar] [CrossRef]
- Richard, E.; Gaillard, J.-M.; Saïd, S.; Hamann, J.-L.; Klein, F. High red deer density depresses body mass of roe deer fawns. Oecologia 2010, 163, 91–97. [Google Scholar] [CrossRef]
- Borkowski, J.; Banul, R.; Jurkiewicz-Azab, J.; Hołdyński, C.; Święczkowska, J.; Nasiadko, M.; Załuski, D. There is only one winner: The negative impact of red deer density on roe deer numbers and distribution in the Słowiński National Park and its vicinity. Ecol. Evol. 2021, 11, 6889–6899. [Google Scholar] [CrossRef] [PubMed]
- Latham, J. Interspecific interactions of ungulates in European forests: An overview. For. Ecol. Manag. 1999, 120, 13–21. [Google Scholar] [CrossRef]
- Barrere, J.; Petersson, L.K.; Boulanger, V.; Collet, C.; Felton, A.M.; Löf, M.; Saïd, S. Canopy openness and exclusion of wild ungulates act synergistically to improve oak natural regeneration. For. Ecol. Manag. 2021, 487, 118976. [Google Scholar] [CrossRef]
- Jensen, A.M.; Götmark, F.; Löf, M. Shrubs protect oak seedlings against ungulate browsing in temperate broadleaved forests of conservation interest: A field experiment. For. Ecol. Manag. 2012, 266, 187–193. [Google Scholar] [CrossRef]
- Laurent, L.; Mårell, A.; Balandier, P.; Holveck, H.; Saïd, S. Understory vegetation dynamics and tree regeneration as affected by deer herbivory in temperate hardwood forests. Iforest–Biogeosciences For. 2017, 10, 837–844. [Google Scholar] [CrossRef]
- Bobrowski, M.; Gillich, B.; Stolter, C. Modelling browsing of deer on beech and birch in northern Germany. For. Ecol. Manag. 2015, 358, 212–221. [Google Scholar] [CrossRef]
- Fuchs, Z.; Vacek, Z.; Vacek, S.; Gallo, J. Effect of game browsing on natural regeneration of European beech (Fagus sylvatica L.) forests in the Krušné hory Mts. (Czech Republic and Germany). Cent. Eur. For. J. 2021, 67, 166–180. [Google Scholar] [CrossRef]
- Mihók, B.; Gálhidy, L.; Kenderes, K.; Standovár, T. Gap Regeneration Patterns in a Semi-natural Beech Forest Stand in Hungary. Acta Silv. Lign. Hung. 2007, 3, 31–45. [Google Scholar]
- Ligot, G.; Balandier, P.; Schmitz, S.; Claessens, H. Transforming even-aged coniferous stands to multi-aged stands: An opportunity to increase tree species diversity? For. Int. J. For. Res. 2020, 93, 616–629. [Google Scholar] [CrossRef]
- Kuijper, D.P.J. Lack of natural control mechanisms increases wildlife–Forestry conflict in managed temperate European forest systems. Eur. J. For. Res. 2011, 130, 895–909. [Google Scholar] [CrossRef]
- Picard, J.; Oleffe, P.; Boisaubert, B. Inlfuence of oak mast on feeding behaviour of red deer (Cervus elaphus L). Ann. For. Sci. 1991, 48, 547–559. [Google Scholar] [CrossRef]
- Tixier, H.; Duncan, P. Are european roe deer browsers? A review of variations in the composition of their diets. Rev. Ecol. (Terre Vie) 1996, 51, 3–17. [Google Scholar] [CrossRef]
- Nopp-Mayr, U.; Reimoser, S.; Reimoser, F.; Sachser, F.; Obermair, L.; Gratzer, G. Analyzing long-term impacts of ungulate herbivory. Sci. Rep. 2020. [CrossRef]
- Jandl, R.; Spathelf, P.; Bolte, A.; Prescott, C.E. Forest adaptation to climate change—Is non-management an option? Ann. For. Sci. 2019, 76, 48. [Google Scholar] [CrossRef]
- Bertrand, R.; Lenoir, J.; Piedallu, C.; Riofrío-Dillon, G.; de Ruffray, P.; Vidal, C.; Pierrat, J.-C.; Gégout, J.-C. Changes in plant community composition lag behind climate warming in lowland forests. Nature 2011, 479, 517–520. [Google Scholar] [CrossRef]
- Latte, N.; Lebourgeois, F.; Claessens, H. Increased tree-growth synchronization of beech (Fagus sylvatica L.) in response to climate change in northwestern Europe. Dendrochronologia 2015, 33, 69–77. [Google Scholar] [CrossRef]
- Latte, N.; Perin, J.; Kint, V.; Lebourgeois, F.; Claessens, H. Major Changes in Growth Rate and Growth Variability of Beech (Fagus sylvatica L.) Related to Soil Alteration and Climate Change in Belgium. Forests 2016, 7, 174. [Google Scholar] [CrossRef]
- Campioli, M.; Vincke, C.; Jonard, M.; Kint, V.; Demarée, G.; Ponette, Q. Current status and predicted impact of climate change on forest production and biogeochemistry in the temperate oceanic European zone: Review and prospects for Belgium as a case study. J. For. Res. 2012, 17, 1–18. [Google Scholar] [CrossRef]
- Hlásny, T.; Zimová, S.; Bentz, B. Scientific response to intensifying bark beetle outbreaks in Europe and North America. For. Ecol. Manag. 2021, 499, 119599. [Google Scholar] [CrossRef]
- Liepe, K.J.; van der Maaten, E.; van der Maaten-Theunissen, M.; Liesebach, M. High Phenotypic Plasticity, but Low Signals of Local Adaptation to Climate in a Large-Scale Transplant Experiment of Picea abies (L.) Karst. in Europe. Front. For. Glob. Chang. 2022, 5, 804857. [Google Scholar] [CrossRef]
- Erkki, A. Influence of temperature upon the development and voltinism of Ips typographus L. (Coleoptera, Scolytidae). Ann. Zool. Fenn. 1969, 6, 161–208. Available online: https://www.jstor.org/stable/23731366 (accessed on 9 March 2022).
- Latte, N.; Taverniers, P.; de Jaegere, T.; Claessens, H. Dendroecological assessment of climate resilience of the rare and scattered forest tree species Tilia cordata Mill. in northwestern Europe. For. Int. J. For. Res. 2020, 93, 675–684. [Google Scholar] [CrossRef]
- Scharnweber, T.; Manthey, M.; Criegee, C.; Bauwe, A.; Schröder, C.; Wilmking, M. Drought matters–Declining precipitation influences growth of Fagus sylvatica L. and Quercus robur L. in north-eastern Germany. For. Ecol. Manag. 2011, 262, 947–961. [Google Scholar] [CrossRef]
- Schroeder, H.; Nosenko, T.; Ghirardo, A.; Fladung, M.; Schnitzler, J.-P.; Kersten, B. Oaks as Beacons of Hope for Threatened Mixed Forests in Central Europe. Front. For. Glob. Chang. 2021, 4, 670797. [Google Scholar] [CrossRef]
- Vitasse, Y.; Bottero, A.; Cailleret, M.; Bigler, C.; Fonti, P.; Gessler, A.; Lévesque, M.; Rohner, B.; Weber, P.; Rigling, A.; et al. Contrasting resistance and resilience to extreme drought and late spring frost in five major European tree species. Glob. Chang. Biol. 2019, 25, 3781–3792. [Google Scholar] [CrossRef]
- Walentowski, H.; Falk, W.; Mette, T.; Kunz, J.; Bräuning, A.; Meinardus, C.; Zang, C.; Sutcliffe, L.M.E.; Leuschner, C. Assessing future suitability of tree species under climate change by multiple methods: A case study in southern Germany. Ann. For. Res. 2017, 60. [Google Scholar] [CrossRef]
- Zimmermann, J.; Hauck, M.; Dulamsuren, C.; Leuschner, C. Climate Warming-Related Growth Decline Affects Fagus sylvatica, But Not Other Broad-Leaved Tree Species in Central European Mixed Forests. Ecosystems 2015, 18, 560–572. [Google Scholar] [CrossRef]
- Dubois, H.; Verkasalo, E.; Claessens, H. Potential of Birch (Betula pendula Roth and B. pubescens Ehrh.) for Forestry and Forest-Based Industry Sector within the Changing Climatic and Socio-Economic Context of Western Europe. Forests 2020, 11, 336. [Google Scholar] [CrossRef]
- Metz, J.; Annighöfer, P.; Schall, P.; Zimmermann, J.; Kahl, T.; Schulze, E.-D.; Ammer, C. Site-adapted admixed tree species reduce drought susceptibility of mature European beech. Glob. Chang. Biol. 2016, 22, 903–920. [Google Scholar] [CrossRef] [PubMed]
- Petritan, I.C.; Marzano, R.; Petritan, A.M.; Lingua, E. Overstory succession in a mixed Quercus petraea–Fagus sylvatica old growth forest revealed through the spatial pattern of competition and mortality. For. Ecol. Manag. 2014, 326, 9–17. [Google Scholar] [CrossRef]
- Lorentzen Kolstad, A.; Austrheim, G.; Solberg, E.J.; De Vriendt, L.; Speed, J.D.M. Pervasive moose browsing in boreal forests alters successional trajectories by severely suppressing keystone species. Ecosphere 2018, 9, e02458. [Google Scholar] [CrossRef]
- De Vriendt, L.; Lavoie, S.; Barrette, M.; Tremblay, J. From delayed succession to alternative successional trajectory: How different moose browsing pressures contribute to forest dynamics following clear-cutting. J. Veg. Sci. 2021, 32, e12945. [Google Scholar] [CrossRef]
- Bernard, M.; Boulanger, V.; Dupouey, J.-L.; Laurent, L.; Montpied, P.; Morin, X.; Picard, J.-F.; Saïd, S. Deer browsing promotes Norway spruce at the expense of silver fir in the forest regeneration phase. For. Ecol. Manag. 2017, 400, 269–277. [Google Scholar] [CrossRef]
- Götmark, F.; Schott, K.M.; Jensen, A.M. Factors influencing presence–absence of oak (Quercus spp.) seedlings after conservation-oriented partial cutting of high forests in Sweden. Scand. J. For. Res. 2011, 26, 136–145. [Google Scholar] [CrossRef]
- Ligot, G. Managing Understory Light to Maintain the Coexistence of Forest Tree Species with Different Shade Tolerances. Ph.D. Thesis, Gembloux Agro-Bio Tech, Gembloux, Belgium, 2014. Available online: https://hdl.handle.net/2268/172321 (accessed on 8 June 2020).
- Petersson, L.K.; Dey, D.C.; Felton, A.M.; Gardiner, E.S.; Löf, M. Influence of canopy openness, ungulate exclosure, and low-intensity fire for improved oak regeneration in temperate Europe. Ecol. Evol. 2020, 10, 2626–2637. [Google Scholar] [CrossRef]
- Povak, N.A.; Lorimer, C.G.; Guries, R.P. Altering successional trends in oak forests: 19 year experimental results of low- and moderate-intensity silvicultural treatments. Can. J. For. Res. 2008, 38, 2880–2895. [Google Scholar] [CrossRef]
- Tinya, F.; Kovács, B.; Aszalós, R.; Tóth, B.; Csépányi, P.; Németh, C.; Ódor, P. Initial regeneration success of tree species after different forestry treatments in a sessile oak-hornbeam forest. For. Ecol. Manag. 2020, 459, 117810. [Google Scholar] [CrossRef]
- Bobiec, A.; Kuijper, D.P.J.; Niklasson, M.; Romankiewicz, A.; Solecka, K. Oak (Quercus robur L.) regeneration in early successional woodlands grazed by wild ungulates in the absence of livestock. For. Ecol. Manag. 2011, 262, 780–790. [Google Scholar] [CrossRef]
- Bobiec, A.; Reif, A.; Öllerer, K. Seeing the oakscape beyond the forest: A landscape approach to the oak regeneration in Europe. Landsc. Ecol. 2018, 33, 513–528. [Google Scholar] [CrossRef]
- Petersson, L.K.; Milberg, P.; Bergstedt, J.; Dahlgren, J.; Felton, A.M.; Götmark, F.; Salk, C.; Löf, M. Changing land use and increasing abundance of deer cause natural regeneration failure of oaks: Six decades of landscape-scale evidence. For. Ecol. Manag. 2019, 444, 299–307. [Google Scholar] [CrossRef]
- Dey, D.C. Sustaining Oak Forests in Eastern North America: Regeneration and Recruitment, the Pillars of Sustainability. For. Sci. 2014, 60, 926–942. [Google Scholar] [CrossRef]
- Ligot, G.; Balandier, P.; Courbaud, B.; Jonard, M.; Kneeshaw, D.; Claessens, H. Managing understory light to maintain a mixture of species with different shade tolerance. For. Ecol. Manag. 2014, 327, 189–200. [Google Scholar] [CrossRef]
- Gamelon, M.; Douhard, M.; Baubet, E.; Gimenez, O.; Brandt, S.; Gaillard, J.-M. Fluctuating food resources influence developmental plasticity in wild boar. Biol. Lett. 2013, 9, 20130419. [Google Scholar] [CrossRef]
- Hubert, A. «Forcés à tuer»: Les chasseurs ardennais face au plan de tir cervidés. Rev. For. Fr. 2019, 71, 381–392. [Google Scholar] [CrossRef]
- Fischer, A.; Kereži, V.; Arroyo, B.; Mateos-Delibes, M.; Tadie, D.; Lowassa, A.; Krange, O.; Skogen, K. (De)legitimising hunting–Discourses over the morality of hunting in Europe and eastern Africa. Land Use Policy 2013, 32, 261–270. [Google Scholar] [CrossRef]
- Vajas, P.; Calenge, C.; Richard, E.; Fattebert, J.; Rousset, C.; Saïd, S.; Baubet, E. Many, large and early: Hunting pressure on wild boar relates to simple metrics of hunting effort. Sci. Total Environ. 2020, 698, 134251. [Google Scholar] [CrossRef]
- Kuijper, D.P.J.; Cromsigt, J.P.G.M.; Jędrzejewska, B.; Miścicki, S.; Churski, M.; Jędrzejewski, W.; Kweczlich, I. Bottom-up versus top-down control of tree regeneration in the Białowieża Primeval Forest, Poland: Abiotic and biotic control of tree regeneration. J. Ecol. 2010, 98, 888–899. [Google Scholar] [CrossRef]
- Kuijper, D.P.J.; Cromsigt, J.P.G.M.; Churski, M.; Adam, B.; Jędrzejewska, B.; Jędrzejewski, W. Do ungulates preferentially feed in forest gaps in European temperate forest? For. Ecol. Manag. 2009, 258, 1528–1535. [Google Scholar] [CrossRef]
- Royo, A.A.; Kramer, D.W.; Miller, K.V.; Nibbelink, N.P.; Stout, S.L. Spatio-temporal variation in foodscapes modifies deer browsing impact on vegetation. Landsc. Ecol. 2017, 32, 2281–2295. [Google Scholar] [CrossRef]
- Heinrichs, S.; Ammer, C.; Mund, M.; Steffen, B.; Budde, S.; Fischer, M.; Müller, J.; Schöning, I.; Schulze, E.-D.; Schmidt, W.; et al. Landscape-Scale Mixtures of Tree Species are More Effective than Stand-Scale Mixtures for Biodiversity of Vascular Plants, Bryophytes and Lichens. Forests 2019, 10, 73. [Google Scholar] [CrossRef]
- Hilmers, T.; Friess, N.; Bässler, C.; Heurich, M.; Brandl, R.; Pretzsch, H.; Seidl, R.; Müller, J. Biodiversity along temperate forest succession. J. Appl. Ecol. 2018, 55, 2756–2766. [Google Scholar] [CrossRef]
- Barna, M.; Bosela, M. Tree species diversity change in natural regeneration of a beech forest under different management. For. Ecol. Manag. 2015, 342, 93–102. [Google Scholar] [CrossRef]
- Kern, C.C.; Burton, J.I.; Raymond, P.; D’Amato, A.W.; Keeton, W.S.; Royo, A.A.; Walters, M.B.; Webster, C.R.; Willis, J.L. Challenges facing gap-based silviculture and possible solutions for mesic northern forests in North America. Forestry 2017, 90, 4–17. [Google Scholar] [CrossRef]
- Nagel, T.A.; Svoboda, M.; Diaci, J. Regeneration patterns after intermediate wind disturbance in an old-growth Fagus–Abies forest in southeastern Slovenia. For. Ecol. Manag. 2006, 226, 268–278. [Google Scholar] [CrossRef]
- Decocq, G.; Aubert, M.; Dupont, F.; Alard, D.; Saguez, R.; Wattez-Franger, A.; Foucault, B.D.; Delelis-Dusollier, A.; Bardat, J. Plant diversity in a managed temperate deciduous forest: Understorey response to two silvicultural systems. J. Appl. Ecol. 2004, 41, 1065–1079. [Google Scholar] [CrossRef]
- Cromsigt, J.P.G.M.; Kuijper, D.P.J.; Adam, M.; Beschta, R.L.; Churski, M.; Eycott, A.; Kerley, G.I.H.; Mysterud, A.; Schmidt, K.; West, K. Hunting for fear: Innovating management of human-wildlife conflicts. J. Appl. Ecol. 2013, 50, 544–549. [Google Scholar] [CrossRef]
- Chytrý, M.; Tichý, L.; Hennekens, S.M.; Knollová, I.; Janssen, J.A.M.; Rodwell, J.S.; Peterka, T.; Marcenò, C.; Landucci, F.; Danihelka, J.; et al. EUNIS Habitat Classification: Expert system, characteristic species combinations and distribution maps of European habitats. Appl. Veg. Sci. 2020, 23, 648–675. [Google Scholar] [CrossRef]


Disclaimer/Publisher’s Note: The statements, opinions and data contained in all publications are solely those of the individual author(s) and contributor(s) and not of MDPI and/or the editor(s). MDPI and/or the editor(s) disclaim responsibility for any injury to people or property resulting from any ideas, methods, instructions or products referred to in the content. |
© 2023 by the authors. Licensee MDPI, Basel, Switzerland. This article is an open access article distributed under the terms and conditions of the Creative Commons Attribution (CC BY) license (https://creativecommons.org/licenses/by/4.0/).