Article

Spatial–Temporal Changes and Prediction of Carbon Storage in the Tibetan Plateau Based on PLUS-InVEST Model

1
Research Institute of Aerospace Information, Chinese Academy of Sciences, Beijing 100101, China
2
School of Civil Engineering and Geomatics, Shandong University of Technology, Zibo 255000, China
*
Authors to whom correspondence should be addressed.
Forests 2023, 14(7), 1352; https://doi.org/10.3390/f14071352
Submission received: 16 May 2023 / Revised: 27 June 2023 / Accepted: 28 June 2023 / Published: 30 June 2023
(This article belongs to the Special Issue Advances in Monitoring and Assessment of Forest Carbon Storage)

Abstract

:
The changes in the recent and future spatial–temporal patterns of carbon storage of the Tibetan Plateau and its dominant factors in different periods were unclear, and were conducive to optimizing the spatial layout of land. Exploring the spatial and temporal changes in terrestrial ecosystem carbon storage and their influencing factors during a long study period had important theoretical and practical significance for achieving the goal of carbon neutrality. In this study, the Integrated Valuation of Ecosystem Services and Trade-offs model (InVEST) was used to analyze the changes in carbon storage based on vegetation-type data during 2000–2020. The Path-generating Land-Use Simulation model (PLUS) was then used to predict the spatial distribution of carbon storage in the Tibetan Plateau in 2030 and 2060 under inertial development, farmland protection and ecology priority scenarios. The results showed that: (1) The degradation of vegetation types reduced the carbon storage during the study period. During 2000–2020, the desert shrub and non-vegetation area expanded by 63.21% and 13.35%, respectively, while the deciduous scrub, mixed forest and low coverage grassland decreased accordingly. The carbon storage of the Tibetan Plateau showed a decreasing trend by 0.37 × 10⁶ t. (2) The spatial distribution patterns of carbon storage were consistent with that of the vegetation types. (3) In 2030 and 2060, under the constraint of the ecological priority development, the reduction in carbon storage was the smallest, at 0.01 × 10⁶ t and 0.16 × 10⁶ t, respectively. Under the constraint of the inertial development, carbon storage had the largest reduction, at 0.12 × 10⁶ t and 0.43 × 10⁶ t, respectively. (4) During 2000–2020, the dominant single factor that had the greatest impacts on the changes in carbon storage was FVC (vegetation coverage), with q values of 0.616, 0.619 and 0.567, respectively. The interactive dominant effects were mainly nonlinear enhancement and double-factor enhancement. The interactive dominant factors that had the greatest impact were FVC and the DEM (Digital Elevation Model), with q values of 0.94, 0.92 and 0.90, respectively. Therefore, ecological land with a high FVC should be protected and the expansion of non-vegetation areas should be restricted in future planning to improve the carbon storage level of the Tibetan Plateau and achieve the goal of carbon neutrality.

1. Introduction

China proposed the goal of “double carbon”, striving to achieve “carbon peak” by 2030 and “carbon neutrality” by 2060 [1]. Domestic and foreign scholars generally believe that carbon storage is an important indicator when evaluating the value of ecosystem services [2]. In addition, the carbon stored in terrestrial ecosystems plays an important role in regulating the global carbon cycle, reducing carbon dioxide (CO2) concentration in the atmosphere and mitigating global climate changes [3]. Carbon in terrestrial ecosystems is an important part of global carbon storage and plays a vital role in maintaining the global carbon cycle and mitigating climate warming [4]. The proposal of the “dual carbon target” has made how to reduce carbon emissions and increase carbon sequestration gradually become a research hotspot and difficulty [5]. As an important factor affecting the carbon cycle of terrestrial ecosystems, land-use changes affect the carbon cycle of ecosystems by changing the structure and function of terrestrial ecosystems [6]. Therefore, based on the changes in land use, the spatial and temporal changes in carbon storage in regional terrestrial ecosystems were scientifically explored. [7].
At present, the assessment of terrestrial ecosystem carbon storage is mostly obtained by sampling or vegetation and soil inventory data calculation [8]. The specific methods are mainly sample inventory, remote sensing estimation and model simulation [9]. Compared with other methods, the model simulation method has less data, accurate evaluation results and could be applied to the study of regional carbon storage changes at different research scales, so it is widely used [10]. In recent years, many scholars at home and abroad have applied the Integrated Valuation of Ecosystem Services and Trade-offs model (In-VEST) model to study the temporal and spatial changes in terrestrial ecosystem carbon storage and its influencing factors from the perspective of historical and future land use [11]. Based on the historical land-use change, Liao et al. [12], Zhao et al. [13] and Tao et al. [14] used the InVEST model to explore the change trend of current historical carbon storage from different angles and analyze the reasons for the change. Zhang et al. [15], Liang et al. [16], Wang et al. [17] and Hou et al. [18] coupled the InVEST model with the land-use simulation models to explore the temporal and spatial variation in carbon storage in future multi-scenario dynamic simulations and to reveal the impact of land-use change on carbon storage. The above research showed that the research on carbon storage based on the perspective of land-use change gradually tended to carry out multi-scenario dynamic simulation of future carbon storage and clarified its influencing factors from the research on carbon storage response of land-use change in the current time series [19]. However, the analysis and prediction of terrestrial ecosystem carbon storage based on land-use-type changes had a large-scale and poor effect, and it was difficult to highlight the impacts of different vegetation coverage changes on carbon storage changes in the same land-use-type area [20,21]. Furthermore, the revelation of the influence mechanism of carbon storage was often from the perspective of land-use change in order to analyze its influencing factors, lacking the detection of natural and socio-economic factors for carbon storage changes, so as to quantitatively analyze the influencing factors of spatial and temporal changes of carbon storage over a long period of time and from a multi-dimensional perspective [22].
Many scholars estimated the carbon storage of land-use, soil and vegetation types in the Tibetan Plateau through field sampling surveys, remote sensing data inversion and model simulation calculations. The field sampling survey method was limited by many factors, such as workload, sampling time, climate and environment. It was only suitable for small-scale carbon storage estimations and difficult to carry out at a large scale. However, this method could provide data support and verification for the other two methods. Based on the second national soil survey dataset, Tian et al. [23] measured and estimated the soil organic carbon density and organic carbon storage in the Tibetan Plateau. Based on the method of the biomass conversion factor, Li et al. [24] estimated the carbon storage of vegetation types in the Tibetan Plateau based on the InVEST model and then analyzed its driving factors. Wang et al. [25] proposed a new method to estimate the aboveground forest carbon storage in the Tibetan Plateau based on GIS data and measured data, and conducted experiments in the Tibet Autonomous Region, Yunnan Province and Sichuan Province. In the context of global changes, the contribution rates of human activities and climate change in the process of carbon storage in the Tibetan Plateau varies widely. However, few studies were investigated to explore the differences between dominant factors in different periods. In addition, the future prediction of carbon storage in the Tibetan Plateau could be applied in achieving regional dual-carbon goals.
The Tibetan Plateau had rich vegetation types and was considered to be an indicator of global climate change [26]. The vegetation types of the Tibetan Plateau were composed of forest, shrub grassland, alpine meadow, alpine grassland and alpine desert from southeast to northwest. The permafrost in the study area was widely distributed, most of which was covered by natural grassland. The grassland ecosystem was the most important ecosystem in the Tibetan Plateau. In recent years, due to the combined actions of human activities and climate change, the ecological environment of the Tibetan Plateau has undergone tremendous changes, especially in relation to the original carbon cycle and carbon balance of the alpine grassland ecosystem [27]. Therefore, under the dual influences of climate change and human activities, it was of great significance to correctly evaluate the carbon storage and its change mechanism on the Tibetan Plateau [28].
In this study, the InVEST model was used to explore the changes in different vegetation types and carbon storage in the Tibetan Plateau during 2000–2020. The PLUS model was then used to predict the carbon storage of the Tibetan Plateau in 2030 and 2060 under different scenarios. The dominant driving factors of carbon storage changes were determined using Geodetector. Based on the above investigations, we aimed to provide some scientific data and references for the preparation of territorial spatial planning, regional ecological environment protection and ecosystem carbon storage research in the Tibetan Plateau.

2. Materials and Methods

2.1. Study Area

The Tibetan Plateau is located in the southwest of China (26°00′ N~39°50′ N, 73°20′~104°50′, Figure 1), with a total area of 2.50 × 10⁶ km2. The terrain of the Tibetan Plateau is low in the east and high in the west, with an average altitude of more than 4000 m. The climate is dry and windy in winter and cool and rainy in summer, with strong solar radiation. There are five rivers and four lakes, including the Yangtze River, the Yellow River, the Lancang River, the Yarlung Zangbo River, the Nujiang River, the Qinghai Lake, the Selin Lake, the Nam Co and the Bangong Lake. The land-use structure is extremely uneven. The area percentage of unsuitable land for cultivation is 34.5%, while that of suitable land for cultivation (such as agricultural crops, cash crops, etc.) is only 0.9% [27]. Due to the combined effects of climate types and topographic features, the vegetation types of the Tibetan Plateau are diverse. The main types are alpine shrubs, alpine meadows, alpine grasslands and alpine grasslands.

2.2. Data Source and Preprocessing

The vegetation type data were derived from the MODIS land cover type product MCD12Q1 with a spatial resolution of 500 m in 2000, 2010 and 2020 (Table 1). The main vegetation types were composed of coniferous forest, hard-leaf shrub, deciduous shrub, mixed forest, closed shrub, desert shrub, tufted dwarf grass, steppe, low coverage grassland and non-vegetation area.
There were 16 driving factors for vegetation type changes and carbon storage changes, including topographic factors, climatic factors, other natural factors and socio-economic factors (Table 1). The DEM data were derived from the Geospatial Data Cloud (https://www.gscloud.cn/ (accessed on 2 January 2023)) with a spatial resolution of 90 m. The slope and aspect were extracted from the DEM data using ArcGIS 10.7. Among the climatic factors, temperature, precipitation and hours of sunshine were obtained via the Kriging interpolation method of ArcGIS 10.7 based on the meteorological station data of the China Meteorological Data Sharing Network. FVC data were derived from Landsat remote sensing images based on ENVI 5.3. The distance to woodland, distance to river, distance to lake, distance to grassland, distance to farmland, distance to town and distance to road were calculated using the ArcGIS 10.7 Euclidean distance analysis tool [28,29,30].

2.3. Methods

2.3.1. InVEST Model

In this study, the Carbon Storage and Sequestration module of the InVEST 3.12.1 model was used to estimate the carbon storage of vegetation types. For this model, the carbon storage was composed of four parts (Table 2), including aboveground biomass carbon storage ( C a b o v e ), underground biomass carbon storage ( C b e l o w ), soil biomass carbon storage ( C s o i l ) and dead organic matter carbon storage ( C d e a d ) [31]. According to the spatial distribution pattern of each vegetation type and its corresponding carbon density, the ecosystem carbon storage was estimated, and the spatial distribution map of carbon storage was automatically generated with ArcGIS 10.7. The aboveground biomass carbon storage mainly included the carbon storage in all surviving vegetation (bark, trunk, branches and leaves, etc.) above the surface. The underground biomass carbon storage referred to the carbon storage existing in the living roots of plants. The soil biomass carbon storage generally referred to the organic carbon storage in mineral soil and organic soil. The dead organic matter carbon storage represented the carbon storage in litter, dead standing trees or dead fallen trees [32]. Because the dead organic carbon storage in the study area was relatively small and difficult to estimate, this study was not considered. The calculation equation of carbon storage was as follows:
C i = C i , a b o v e + C i , b e l o w + C i , s o i l + C i , d e a d
C t o t a l = i = 1 n C i × S i
where  C i  was the total carbon density (g/m2) of vegetation type  i C i , a b o v e  was the aboveground biomass carbon density (g/m2) of vegetation type  i C i , b e l o w  was the underground biomass carbon density (g/m2) of vegetation type  i C i , s o i l  was the soil biomass carbon density (g/m2) of vegetation type  i C i , d e a d  was the dead organic matter carbon density (g/m2) of vegetation type  i ( C i , d e a d  = 0),  C t o t a l  was the total carbon storage (g) of the study area,  S i  was the total area of vegetation type (m2) and  n  was the number of vegetation types with a value of 10.

2.3.2. Dynamic Degree and Transfer Matrix

(1) The dynamic degree of a single vegetation type referred to the change rate of a certain vegetation type during the study period, which had a positive effect on predicting the change trend of vegetation type in the future [33]. The equation was as follows:
K i = S a S b S b × 1 T × 100 %
where  K i  was the dynamic degree of vegetation type  i  during the study period,  S a  was the area of vegetation type  i  in the initial year,  S b  was the area of vegetation type  i  in the termination year and  T  was the study duration.
(2) The transfer matrix of vegetation type was a two-dimensional matrix obtained according to the change relationship of vegetation coverage in different phases of the unified study area. Through the analysis of the matrix, the area changes and spatial distribution of different vegetation types in two time phases could be obtained [34]. The equation was as follows:
S = S 11 S 12 S 1 n S 21 S 22 S 2 n S n 1 S n 2 S n n
where  S  was the area of landscape and  n  represented the number of transferred landscape types.

2.3.3. Patch-Generating Land Use Simulation (PLUS) Model

The PLUS model was essentially an improved cellular automata model. Based on this model, this study predicted the evolution of vegetation types on the Tibetan Plateau under multi-scenario constraints [35]. In this study, the vegetation type data of the Tibetan Plateau in 2000 and 2020 were used as the simulation base data, and the expansion part of various vegetation types were extracted. Secondly, according to the actual situation of the Tibetan Plateau and the availability of data, from the four aspects of topographic factors, climatic factors, other natural factors and socio-economic factors, the slope, DEM, aspect, temperature, hours of sunshine, precipitation, FVC, distance to woodland, distance to river, distance to lake, distance to grassland, distance to town, distance to road, gross domestic product (GDP) and population (POP) variables were selected. In the land expansion analysis strategy (LEAS), the random forest algorithm was used to obtain the development probability of various vegetation types in the study area. On this basis, taking the vegetation type data of the study area in 2000 as the base period data, based on the multiple random seeds model (CARS), combined with the relevant parameters such as the development probability, demand (Table A1), transfer cost matrix (Table A2) and neighborhood weight assignments (Table A3) of each vegetation type, the spatial distribution of vegetation type in the Tibetan Plateau in 2020 was simulated and obtained. Finally, the Kappa coefficient and the overall accuracy were used to test the accuracy of the model simulation results. The Kappa coefficient was 0.79, and the overall accuracy was 82.44%. The results showed that the simulation accuracy was high, and the PLUS model could accurately reflect the changes in vegetation types in the Tibetan Plateau [36]. Therefore, this study applied the PLUS model to simulate the spatial distribution of vegetation types in three scenarios of inertia development, farmland protection and ecological priority development in 2030 and 2060 in the Tibetan Plateau.
The inertial development scenario was a continuation of the historical vegetation type change trend during 2000–2020. When simulating the spatial distribution of vegetation types in the inertial development scenarios of 2030 and 2060, the model parameters such as development probability, transfer matrix and neighborhood weight assignments were consistent with the simulation during 2000–2020. The farmland protection scenario referred to the fact that the permanent basic farmland was only engaged in farming and agricultural production and was not used for construction or other non-agricultural matters. The ecological priority development scenario referred to strengthening the ecological protection concept of the Tibetan Plateau, which was mainly to strictly protect the ecological land in the form of forest, steppe and shrub land. The spatial distribution of vegetation types in the simulated study area under the scenarios of farmland protection and ecological priority development in 2030 and 2060 were mainly achieved through spatial constraints and restricted area conversion.

2.3.4. Geodetector

The Geodetector (http://www.geodetector.cn/ (accessed on 5 January 2023 )) was utilized to analyze and reveal the driving mechanism of carbon storage changes in the Tibetan Plateau, which was a new statistical method to detect the spatial distribution pattern consistency of dependent variables and independent variables based on the theory of geographical spatial differentiation [37]. The dependent variable Y value represented the value attribute of carbon storage in each spatial grid. The independent variable X included 16 factors such as DEM, FVC, precipitation and hours of sunshine. In this study, fully considering the geographical and eco-environmental characteristics in the Tibetan Plateau, the relevant factors, such as topographic factors, climatic factors, other natural factors and socio-economic factors (Table 1) were comprehensively selected, and then the explanatory powers of single and interactive factors of carbon storage changes were determined using a factor detector and interaction detector.
The factor detector could detect the spatial variability of carbon storage changes Y and the explanatory power of independent variable X to carbon storage change attribute Y, measured by q value, and the equations were as follows:
S S W = h = 1 L N h σ h 2
S S T = N σ 2
q = 1 S S W S S T
where  L  was the stratification of variable Y or variable X;  N h  and  N  were the number of units in the  h  layer and the whole area, respectively;  σ h 2  and  σ 2  were the variance of Y values in the layer  h  and the whole area, respectively; SSW was the intra-layer variance and SST was the total variance in the whole area. The larger the q value ( q 0 , 1 ), the more significant the spatial variability of wetland change. If the stratification was generated by the independent variable X, the larger the q value, the stronger the explanatory power of this factor on wetland change attribute Y.
The interaction detector could quantitatively determine the interactions between the two driving factors on the wetland distribution pattern, mainly including five types of nonlinear weakening and single-factor nonlinear weakening (Table 3).

3. Results

3.1. Analysis of Vegetation Type Changes in the Tibetan Plateau during 2000–2020

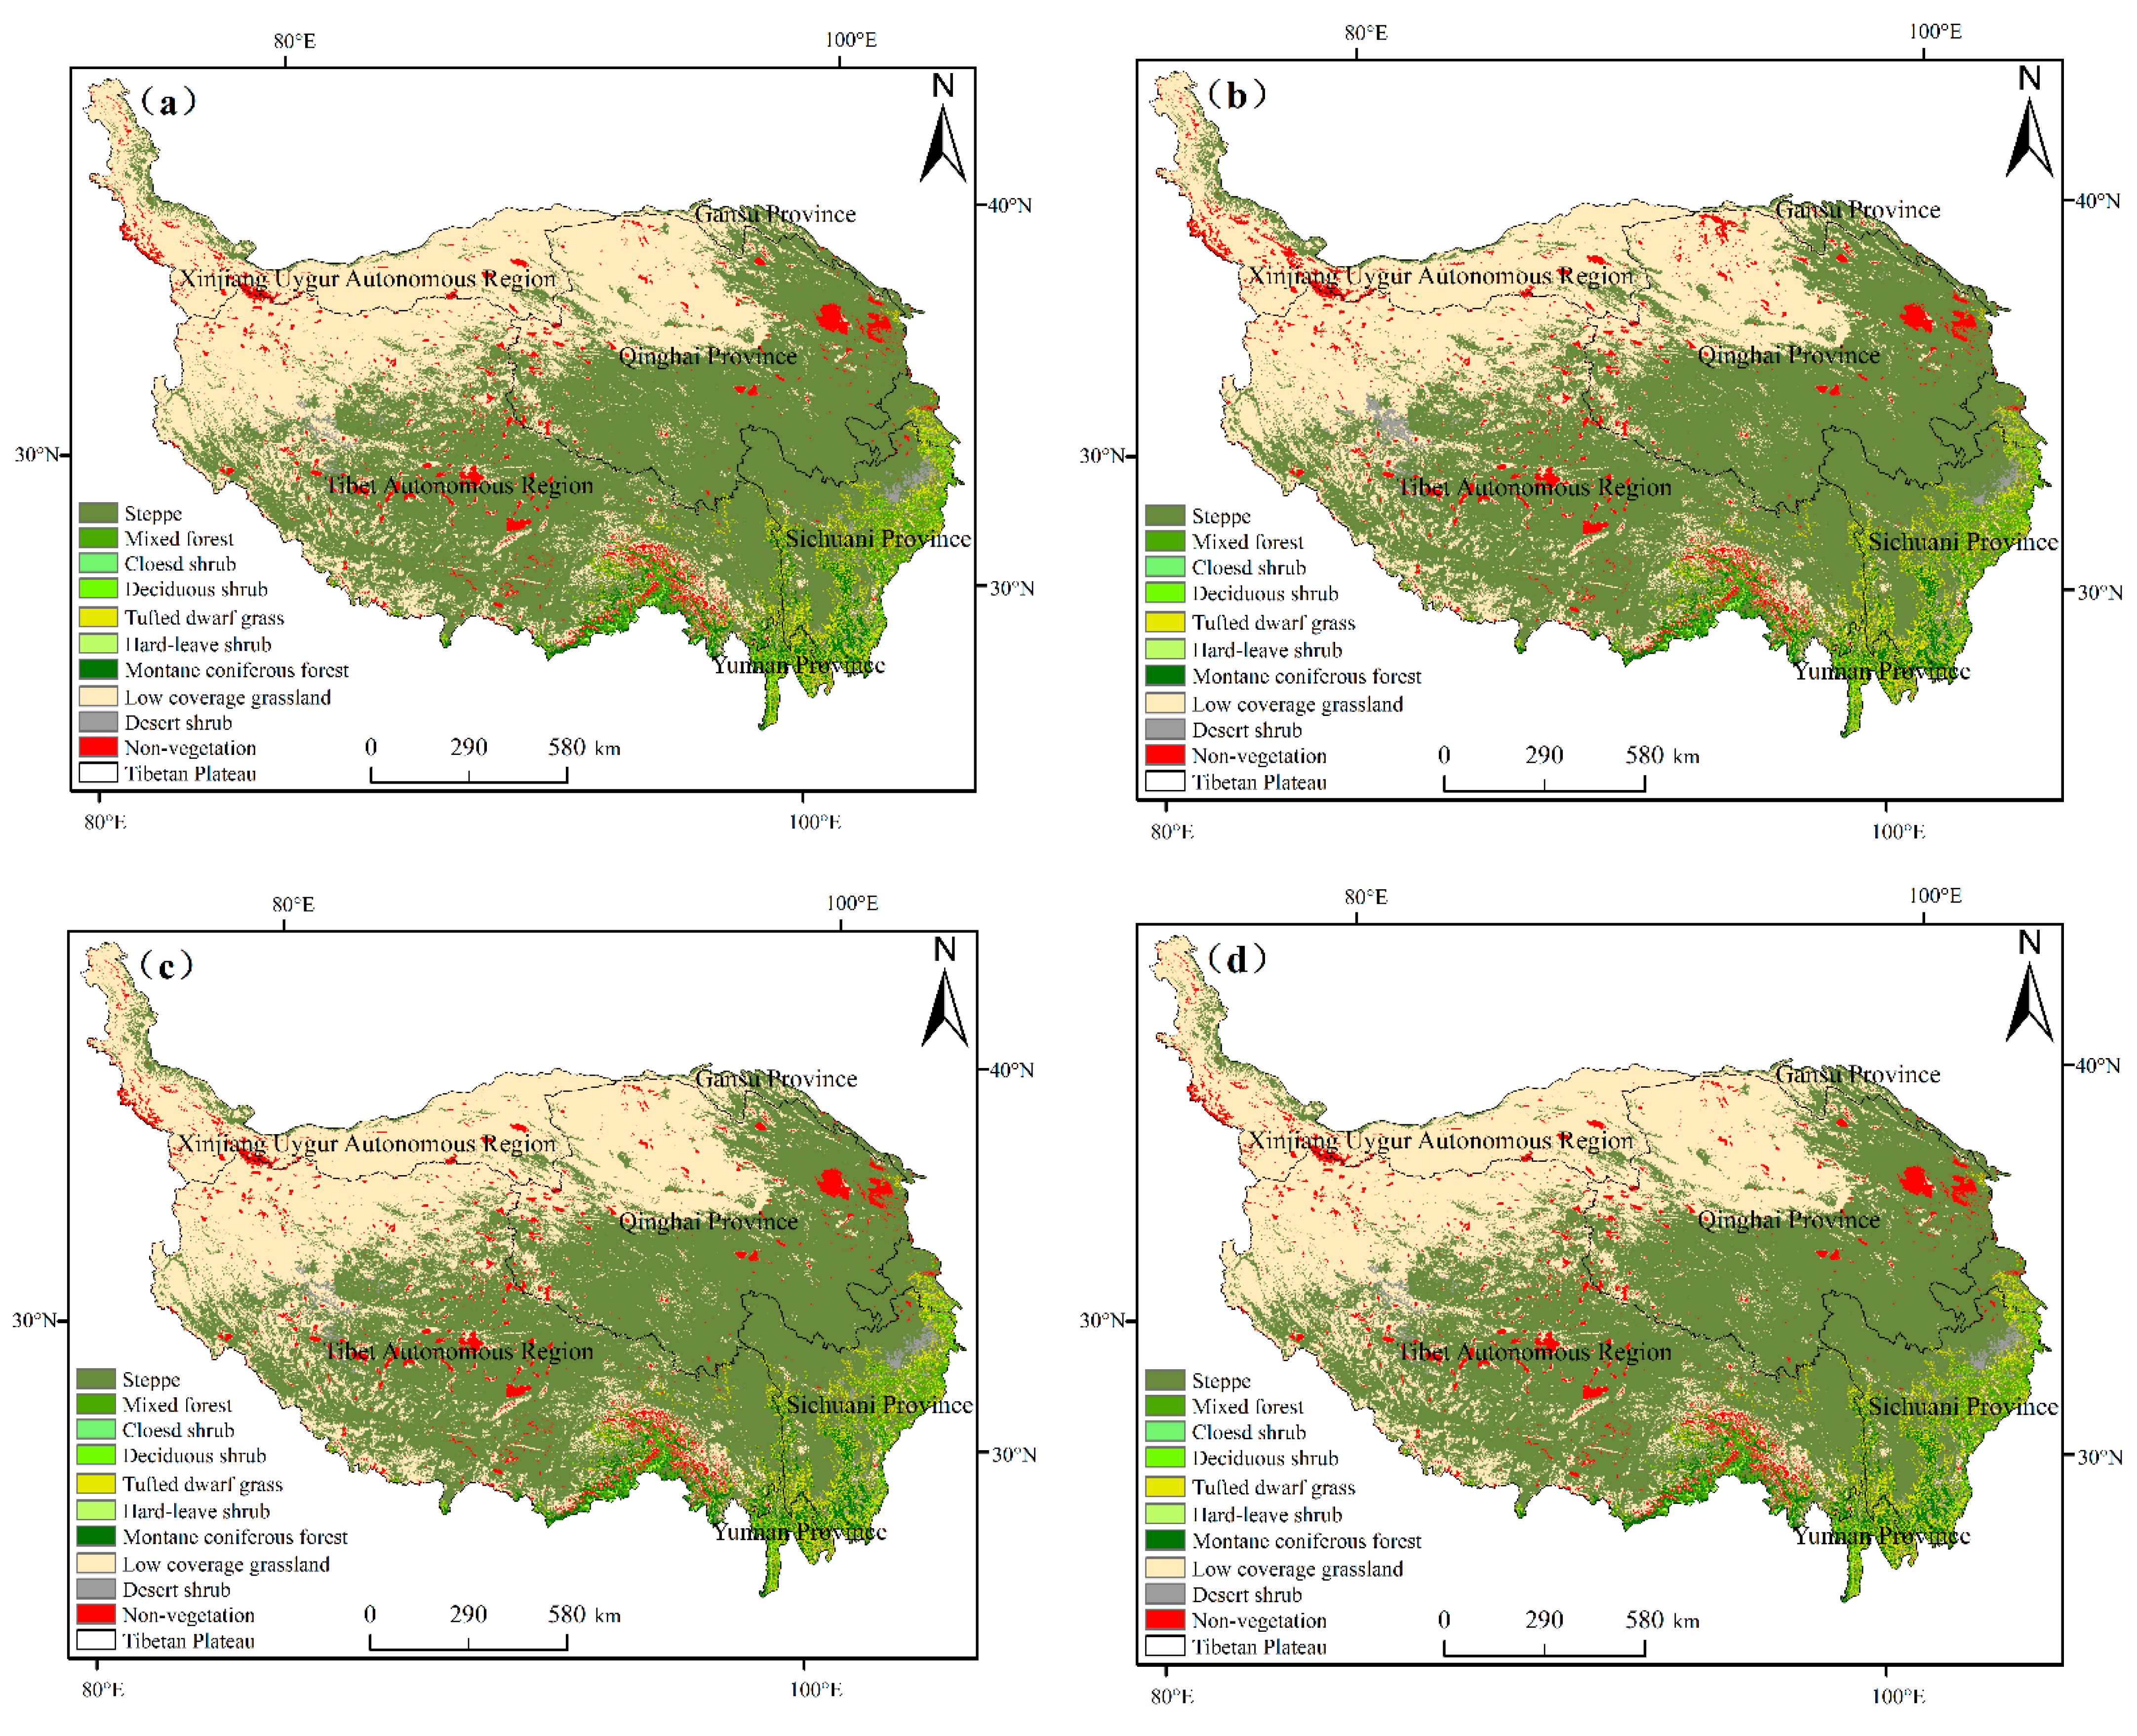
In 2020, steppe and low-coverage grassland were the most widely distributed vegetation types in the Tibetan Plateau, accounting for 52.29% and 37.51%, respectively, which was followed by non-vegetation and tufted dwarf grass, accounting for 3.17% and 2.44%, respectively. During 2000–2020, the area of deciduous shrub, mixed forest and low coverage grassland in the Tibetan Plateau showed a decreasing trend, decreasing by 1795.50 km2, 334.25 km2 and 37,298.25 km2, respectively (Table 4). The area proportion of deciduous shrub and mixed forest decreased from 0.32% to 0.25% and from 1.79% to 1.78%, respectively. Additionally, the area proportion of low-coverage grassland decreased from 38.98% to 37.51%. The largest area increase in steppe was 15,236.50 km2, followed by desert shrub (9529.25 km2) and non-vegetation area (9486.00 km2). The area of closed shrub changed the slightest, only increasing by 0.75 km. Among all vegetation types, the area proportion of low-coverage grassland decreased the severest.
Zones converted to desert brush and non-vegetation zones were 16,536.50 km2 and 7007.25 km2, respectively, while those converted from these types were 18,405.75 km2 and 8919.75 km2, respectively (Table 5 and Figure 2). The converted area of deciduous shrub was 3649.75 km2, of which 40.47% was mixed forest and 30.15% was tufted dwarf grass. The montane coniferous forest was mainly distributed in Zedang County, Linzhi County and Changdu City of Tibet Autonomous Region, Nujiang Li Autonomous Prefecture and Zhongdian County of Yunnan Province and Kangding County and Xichang City of Sichuan Province. The montane coniferous forest was mainly converted to tufted dwarf grass and mixed forest. The converted areas were 3651.75 km2 and 2535.25 km2, and areas converted into these types were 4066.00 km2 and 4786.50 km2, respectively. The area of hard-leaf shrub was relatively low, accounting for only 0.11%, which was mainly distributed in the southern part of the Tibetan Plateau, such as Zedang County and Linzhi County in Tibet Autonomous Region and Nujiang Li Autonomous Prefecture in Yunnan Province. It was mainly converted to mixed forest, with a conversion area of 215.00 km2, accounting for 76.72% of the total area of this vegetation type that was converted. The deciduous shrub vegetation was mainly distributed in Kangding County and Malkang County of Sichuan Province, Nujiang Li Autonomous Prefecture of Yunnan Province, and Xiahe County of Gansu Province. The deciduous shrub vegetation was mainly converted to mixed forest and tufted dwarf grass, with areas of 1477.00 km2 and 1100.25 km2, respectively.
During 2000–2020, a total area of 190,487.75 km2 changed in the Tibetan Plateau, accounting for 7.49%. The area of vegetation degradation was 78,442.25 km2, while that of vegetation optimization was 112,045.50 km2. Vegetation degradation zones were mainly distributed in Gaer County, Shigatse City, Nagqu County and Linzhi County of the Tibet Autonomous Region, Kangding County, Malkang County and Xichang City of Sichuan Province, and the Nujiang Li Autonomous Prefecture of Yunnan Province. The area of steppe degradation was the largest, accounting for 42.90% of the degradation zones. This was followed by that of low-coverage grassland degradation–no vegetation, with an area of 14,725.25 km2. The vegetation optimization area was mainly distributed in Jiuquan City of Gansu Province, Ulan County of Qinghai Province, Malkang County, Kangding County, Xichang City of Sichuan Province and Linzhi County of the Tibet Autonomous Region. The area of low-coverage grassland optimization was the largest with steppe, at 60,945.00 km2, accounting for 54.39% of the optimization area. This was followed by steppe optimization–desert shrub, with an area of 12,579.50 km2.

3.2. Spatio-Temporal Variation Characteristics of Carbon Storage in the Tibetan Plateau during 2000–2020

3.2.1. Variation Characteristics of Carbon Storage

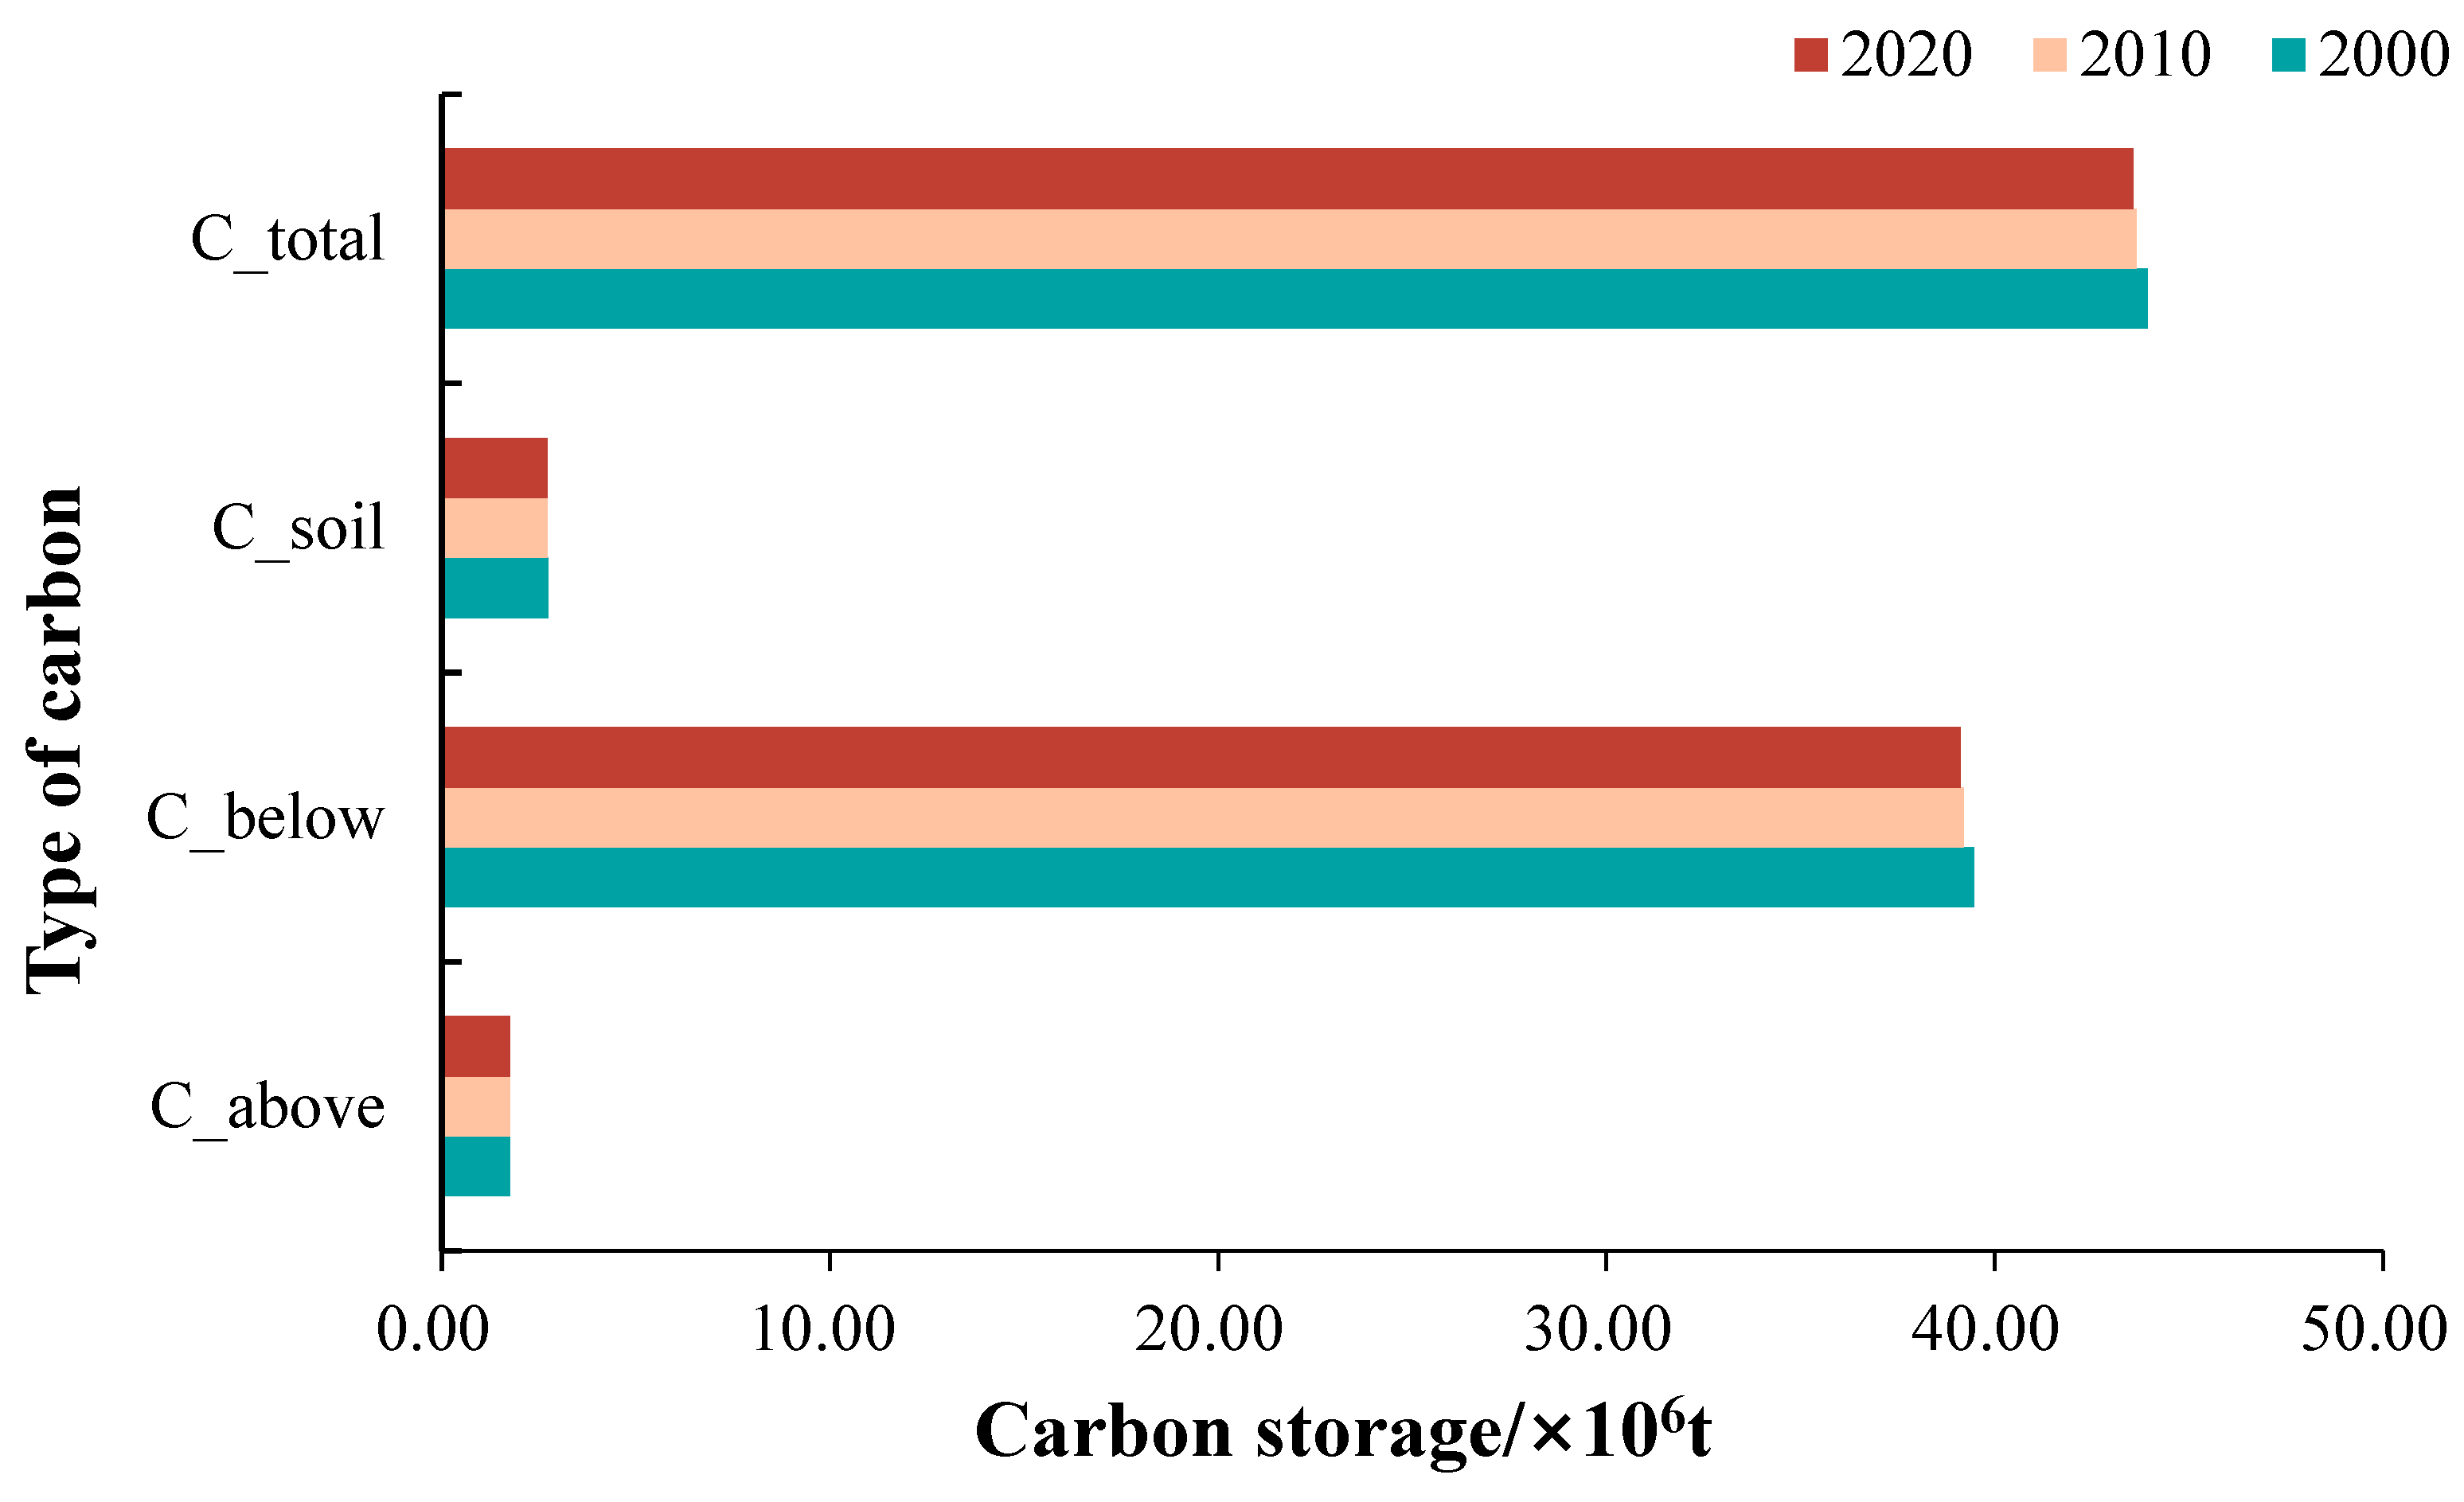
This study used the Carbon Storage and Sequencing module of the InVEST model to calculate the carbon storage of the Tibetan Plateau in 2000, 2010 and 2020, with 43.94 × 10⁶ t, 43.6543.94 × 106 t and 43.5643.94 × 106 t as the results, respectively. During 2000–2020, the total carbon storage showed a decreasing trend, with a decrease of 0.37 × 10⁶ t compared to that of 2000 (Figure 3). During 2000–2020, the type of carbon storage in the Tibetan Plateau was mainly underground carbon storage, at 39.45 × 10⁶ t, 39.19 × 10⁶ t and 39.11 × 10⁶ t, accounting for 89.80%, 89.78% and 89.77% of the total carbon storage, respectively. From the overall changes in carbon storage in the Tibetan Plateau, due to the reduction of aboveground carbon storage, underground carbon storage and soil carbon storage in different degrees, the carbon storage had generally shown a decreasing trend. The aboveground carbon storage, underground carbon storage and soil carbon storage decreased by 0.01 × 10⁶ t, 0.34 × 10⁶ t and 0.02 × 10⁶ t, respectively.
During 2000–2020, the low-cover grassland had the largest carbon storage of 21.05 × 10⁶ t, 20.44 × 10⁶ t and 20.26 × 10⁶ t, accounting for 47.91%, 46.82% and 46.50%, respectively. This was followed by steppe, with 19.43 × 10⁶ t, 19.75 × 10⁶ t and 19.66 × 10⁶ t of carbon storage, accounting for 19.43%, 19.75% and 19.66%, respectively. The carbon storage values of closed shrub and deciduous shrub were extremely low, with average carbon storage values of 0.01 × 10⁶ t and 0.06 × 10⁶ t, respectively. During 2000–2020, the carbon storage of the desert shrub continued to increase, from 0.29 × 10⁶ t to 0.47 × 10⁶ t, while that of the low-coverage grassland continued to decrease, by a total of 0.79 × 10⁶ t. The carbon storage of montane coniferous forest, hard-leaf shrub and tufted dwarf grass remained basically unchanged, with average carbon storage values of 0.25 × 10⁶ t, 0.10 × 10⁶ t and 0.15 × 10⁶ t, respectively.

3.2.2. Spatial Variation Characteristics of Carbon Storage

The carbon storage in Nagqu County was the largest, with 6466.75 t, 6428.07 t and 6438.40 t, respectively, which was followed by that of Gaer County with 5707.29 t, 5692.49 t and 5680.95 t, respectively. The carbon storage in Xining City was the smallest, with 72.20 t, 75.27 t and 78.89 t, respectively. During 2000–2020, the carbon storage in Malkang County showed the largest increase, by 50.34 t during 2000–2010 and 95.36 t during 2010–2020, leading to a net increase of 45.01 t. The net decrease in carbon storage in Linzhi County was 96.62 t, with an increase of 2.09 t during 2000–2010, and a decrease of 98.71 t during 2010–2020. During the study period, the carbon storage in Ulan County decreased continuously by 55.74 t during 2000–2010, and 45.82 t during 2010–2020, with a total decrease of 101.56 t. The carbon storage in Xiahe County increased continuously by 36.40 t, with an increase of 2.77 t during 2000–2010, and an increase of 33.64 t during 2010–2020. During 2000–2020, the carbon storage in the Nujiang Li Autonomous Prefecture, Xining City and Ping’an County showed an increase, with a net increase of 24.67 t, 6.69 t and 4.59 t, respectively, while the carbon storage in Kangding County, Hotan City, Korla City, Jiuquan City and Zhongdian County showed a decrease, with a net decrease of 43.38 t, 30.07 t, 28.08 t, 19.85 t and 17.40 t, respectively.
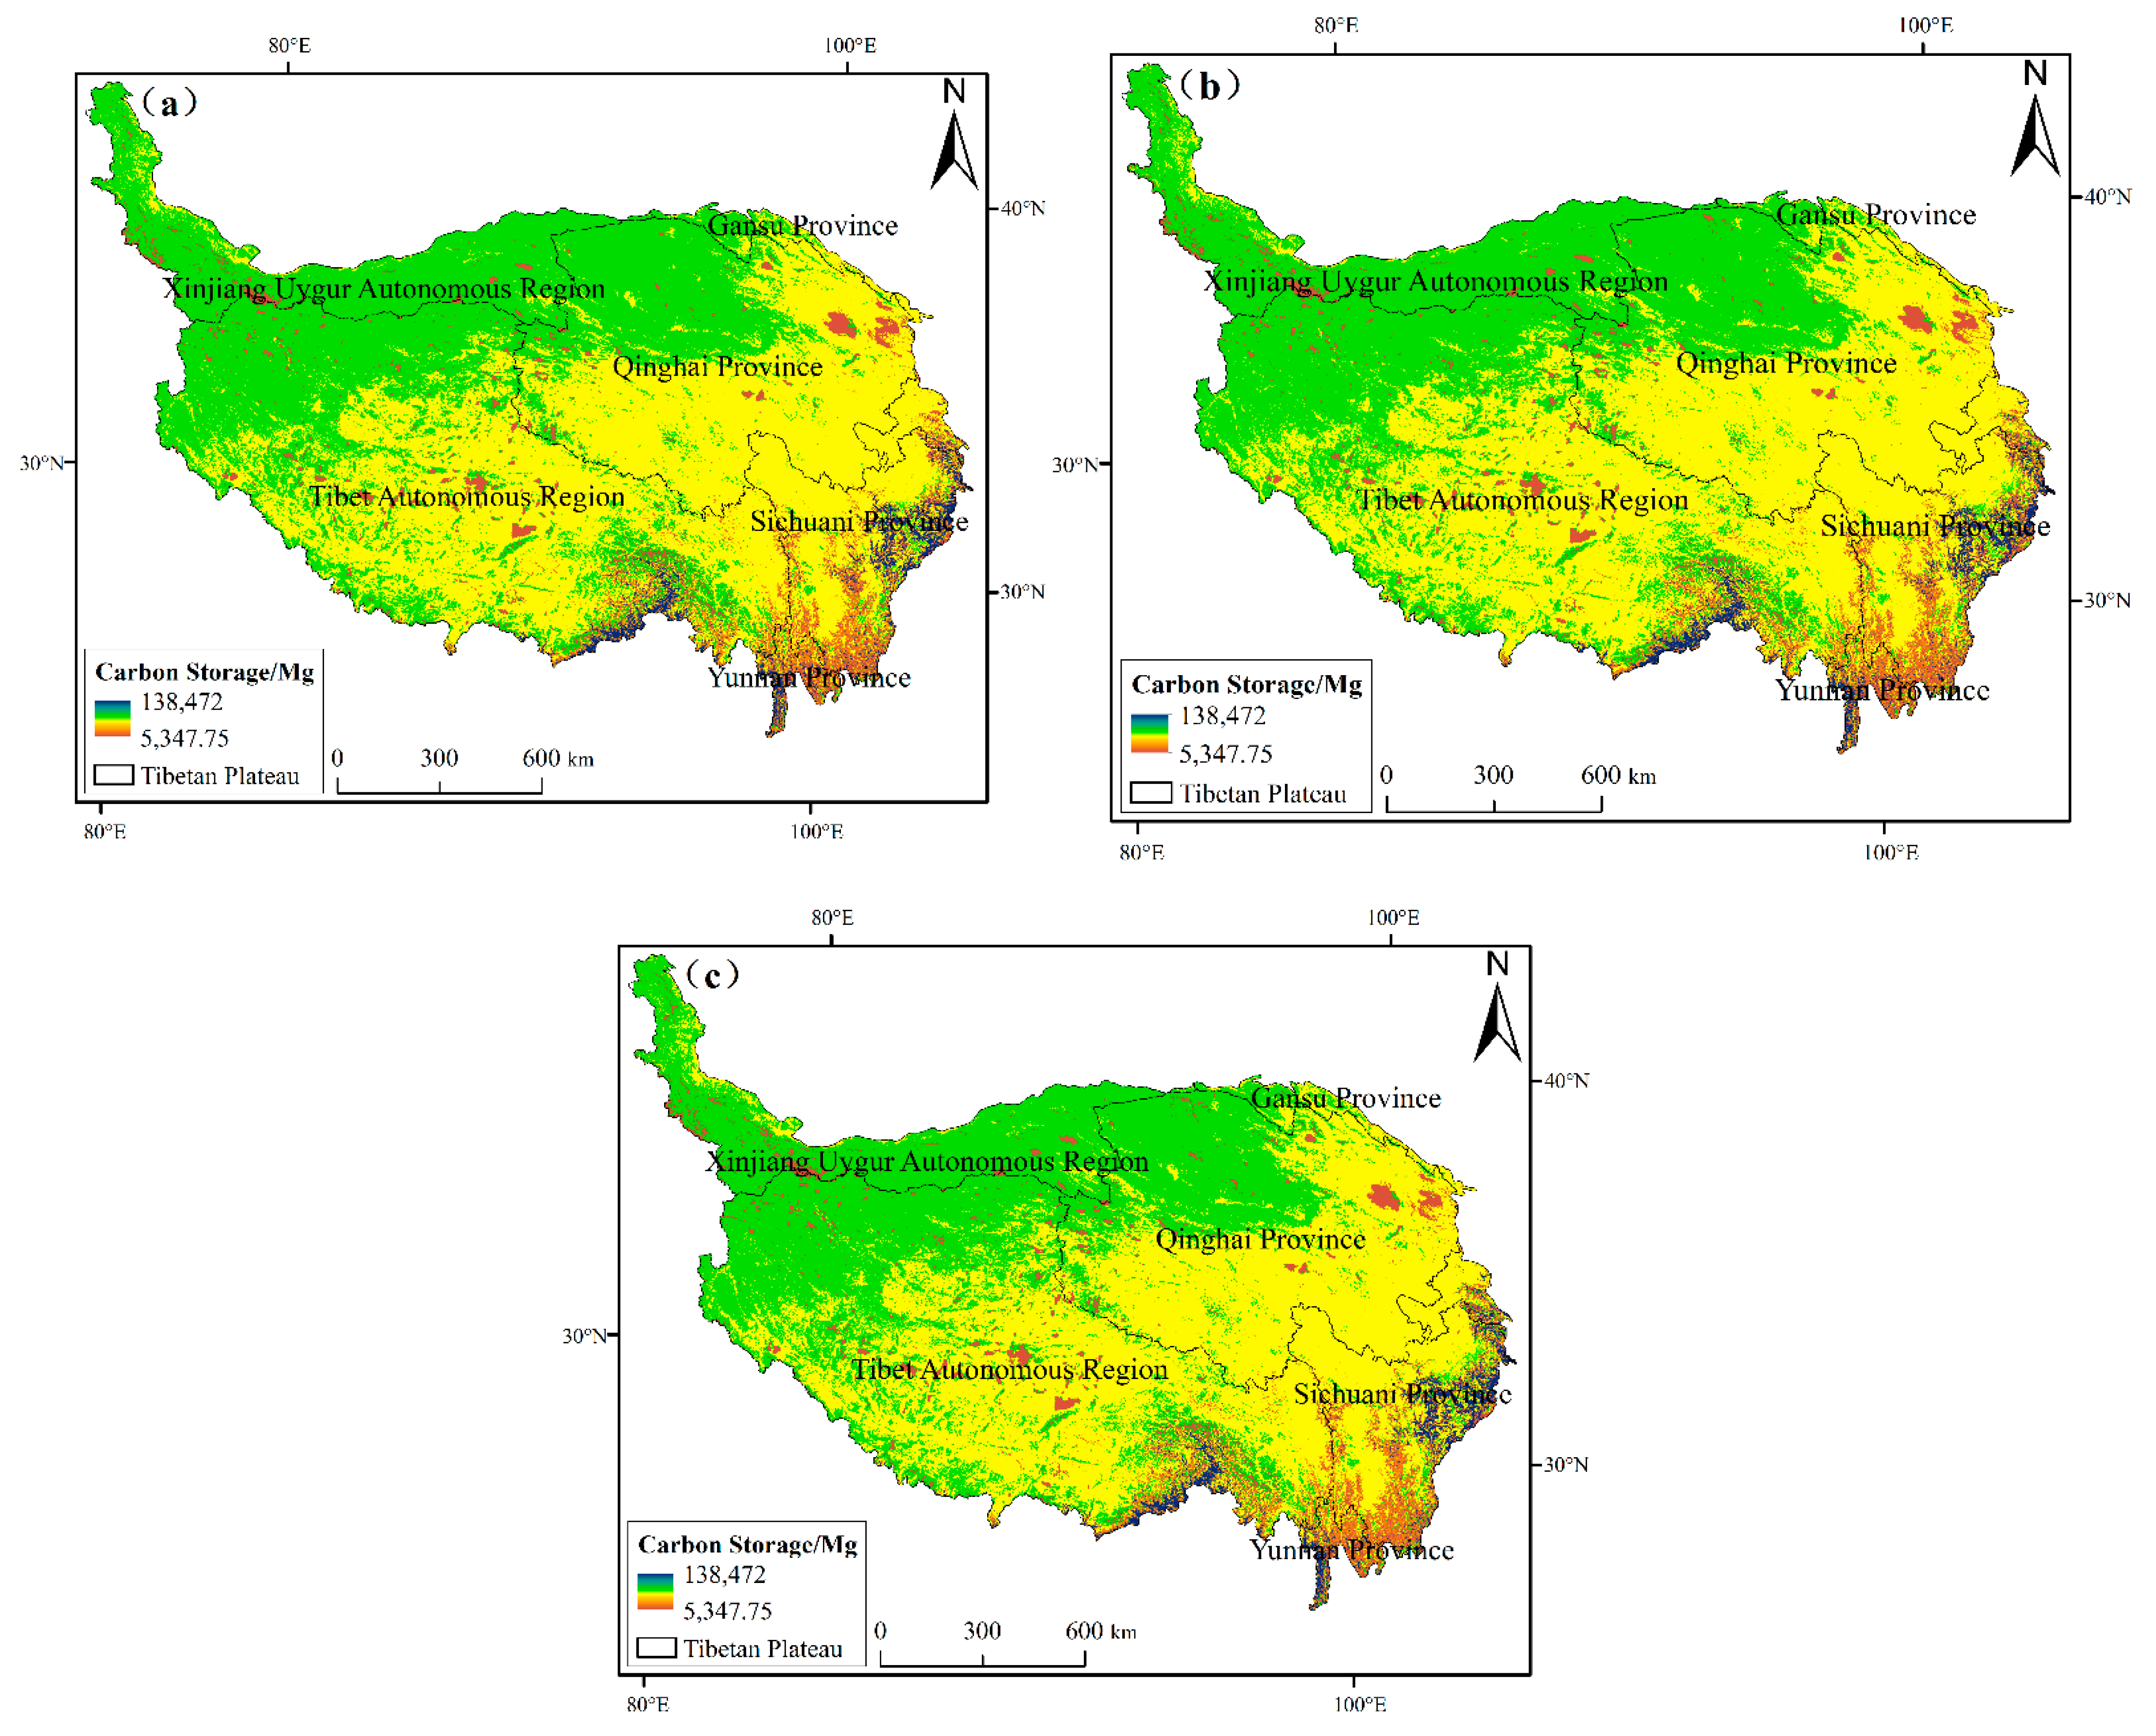
During 2000–2020, carbon storage in the Tibetan Plateau generally showed a distribution pattern of low in the southeast and high in the northwest (Figure 4), which was influenced by the spatial distribution of vegetation types. In the southeast Tibet Autonomous Region, central Linzhi County, western Nujiang Li Autonomous Prefecture in Yunnan Province, northeastern and central Kangding County and southern and eastern Malkang County in Sichuan Province, the vegetation types were mainly mixed forest and closed shrub, with a carbon density of 5399.86 g/m2 and 5538.88 g/m2, respectively.
Figure 5 and Table 6 showed that the change values of carbon storage during the study period ranged from −10,000 Mg to 10,000 Mg. The area of the stable zone was 2,351,132.75 km2, accounting for 92.51%, which was continuously distributed in the study area. The increasing zone (10,000 Mg–70,000 Mg) had the second largest area of 101,360.25 km2, accounting for 3.99%. This was sporadically distributed in Nagqu County, Linzhi County, Gaer County and Shigatse City of the Tibet Autonomous Region, Ulan County of Qinghai Province and Kangding County of Sichuan Province. The decreasing zone (−10,000 Mg–70,000 Mg), with an area of 69,252.25 km2, accounted for 2.72%, and was sporadically distributed in Nagqu County, Gaer County, Linzhi County and Shigatse City of the Tibet Autonomous Region, Kangding County and Malkang County of Sichuan Province. The severely increasing zone (≥70,000 Mg), with an area of 10,102.50 km2, accounted for 0.40%, which was sporadically distributed in Linzhi County and Zedang County of the Tibet Autonomous Region, Kangding County, Malkang County and Xichang City of Sichuan Province, Zhongdian County and the Nujiang Li Autonomous Prefecture of Yunnan Province. The severely decreasing zone (≤−70,000 Mg), with the smallest area of 9772.75 km2, accounted for 0.38%, and was sporadically distributed in Malkang County, Kangding County and Xichang City of Sichuan Province, Linzhi County of the Tibet Autonomous Region, Xiahe County of Gansu Province, the Nujiang Li Autonomous Prefecture and Zhongdian County of Yunnan Province.

3.3. Carbon Storage Prediction and Analysis of Vegetation Types in the Tibetan Plateau

3.3.1. The Analysis of Vegetation Changes under Multi-Scenario Constraints

Based on the PLUS model, the distribution of vegetation type under the constraints of three scenarios in 2030 and 2060 were predicted in the Tibetan Plateau (Figure 6 and Table 7). Under the constraint of an inertial development scenario, some vegetation types in 2030–2060 showed the same trend as 2000–2020 (Table 6). Deciduous shrub, mixed forest and low-coverage grassland showed a decreasing trend of 412.50 km2, 363.00 km2 and 42,039.50 km2, respectively. The montane coniferous forest, hard-leaf shrub, desert shrub, steppe and non-vegetation zone showed an increasing trend of 2124.00 km2, 100.25 km2, 4397.50 km2, 35,262.25 km2 and 7158.75 km2, respectively. The change in vegetation type was dominated by the conversion of low-coverage grassland to steppe, followed by the conversion of low-coverage grassland to a non-vegetation zone and the conversion of montane coniferous forest to tufted dwarf grass. Under the constraints of the farmland protection scenario, the conversion of the non-vegetation zone to other vegetation types was limited. The expansion trends of tufted dwarf grass in 2030 and 2060 were obviously controlled, at 1204.00 km2 and 1641.00 km2, lower than that in 2020. Hard-leaf shrub also decreased by 197.00 km2 and 71.50 km2, respectively. The non-vegetation zone increased by 7762.00 km2 and 14,370.25 km2. Under the constraint of the ecological priority development scenario, the non-vegetation zone significantly decreased in 2030 and 2060, at −687.75 km2 and −1769.00 km2, respectively, while the steppe area increased by 3411.25 km2 and 30,384.50 km2. The ecological priority development scenario limited the expansion trend of the non-vegetation zone in the ecological reserve, but the expansion trend of hard-leaf shrub was not well-assisted, reducing by 55.00 km2 and 35.75 km2, respectively.

3.3.2. The Analysis of Carbon Storage Changes under Multi-Scenario Constraints

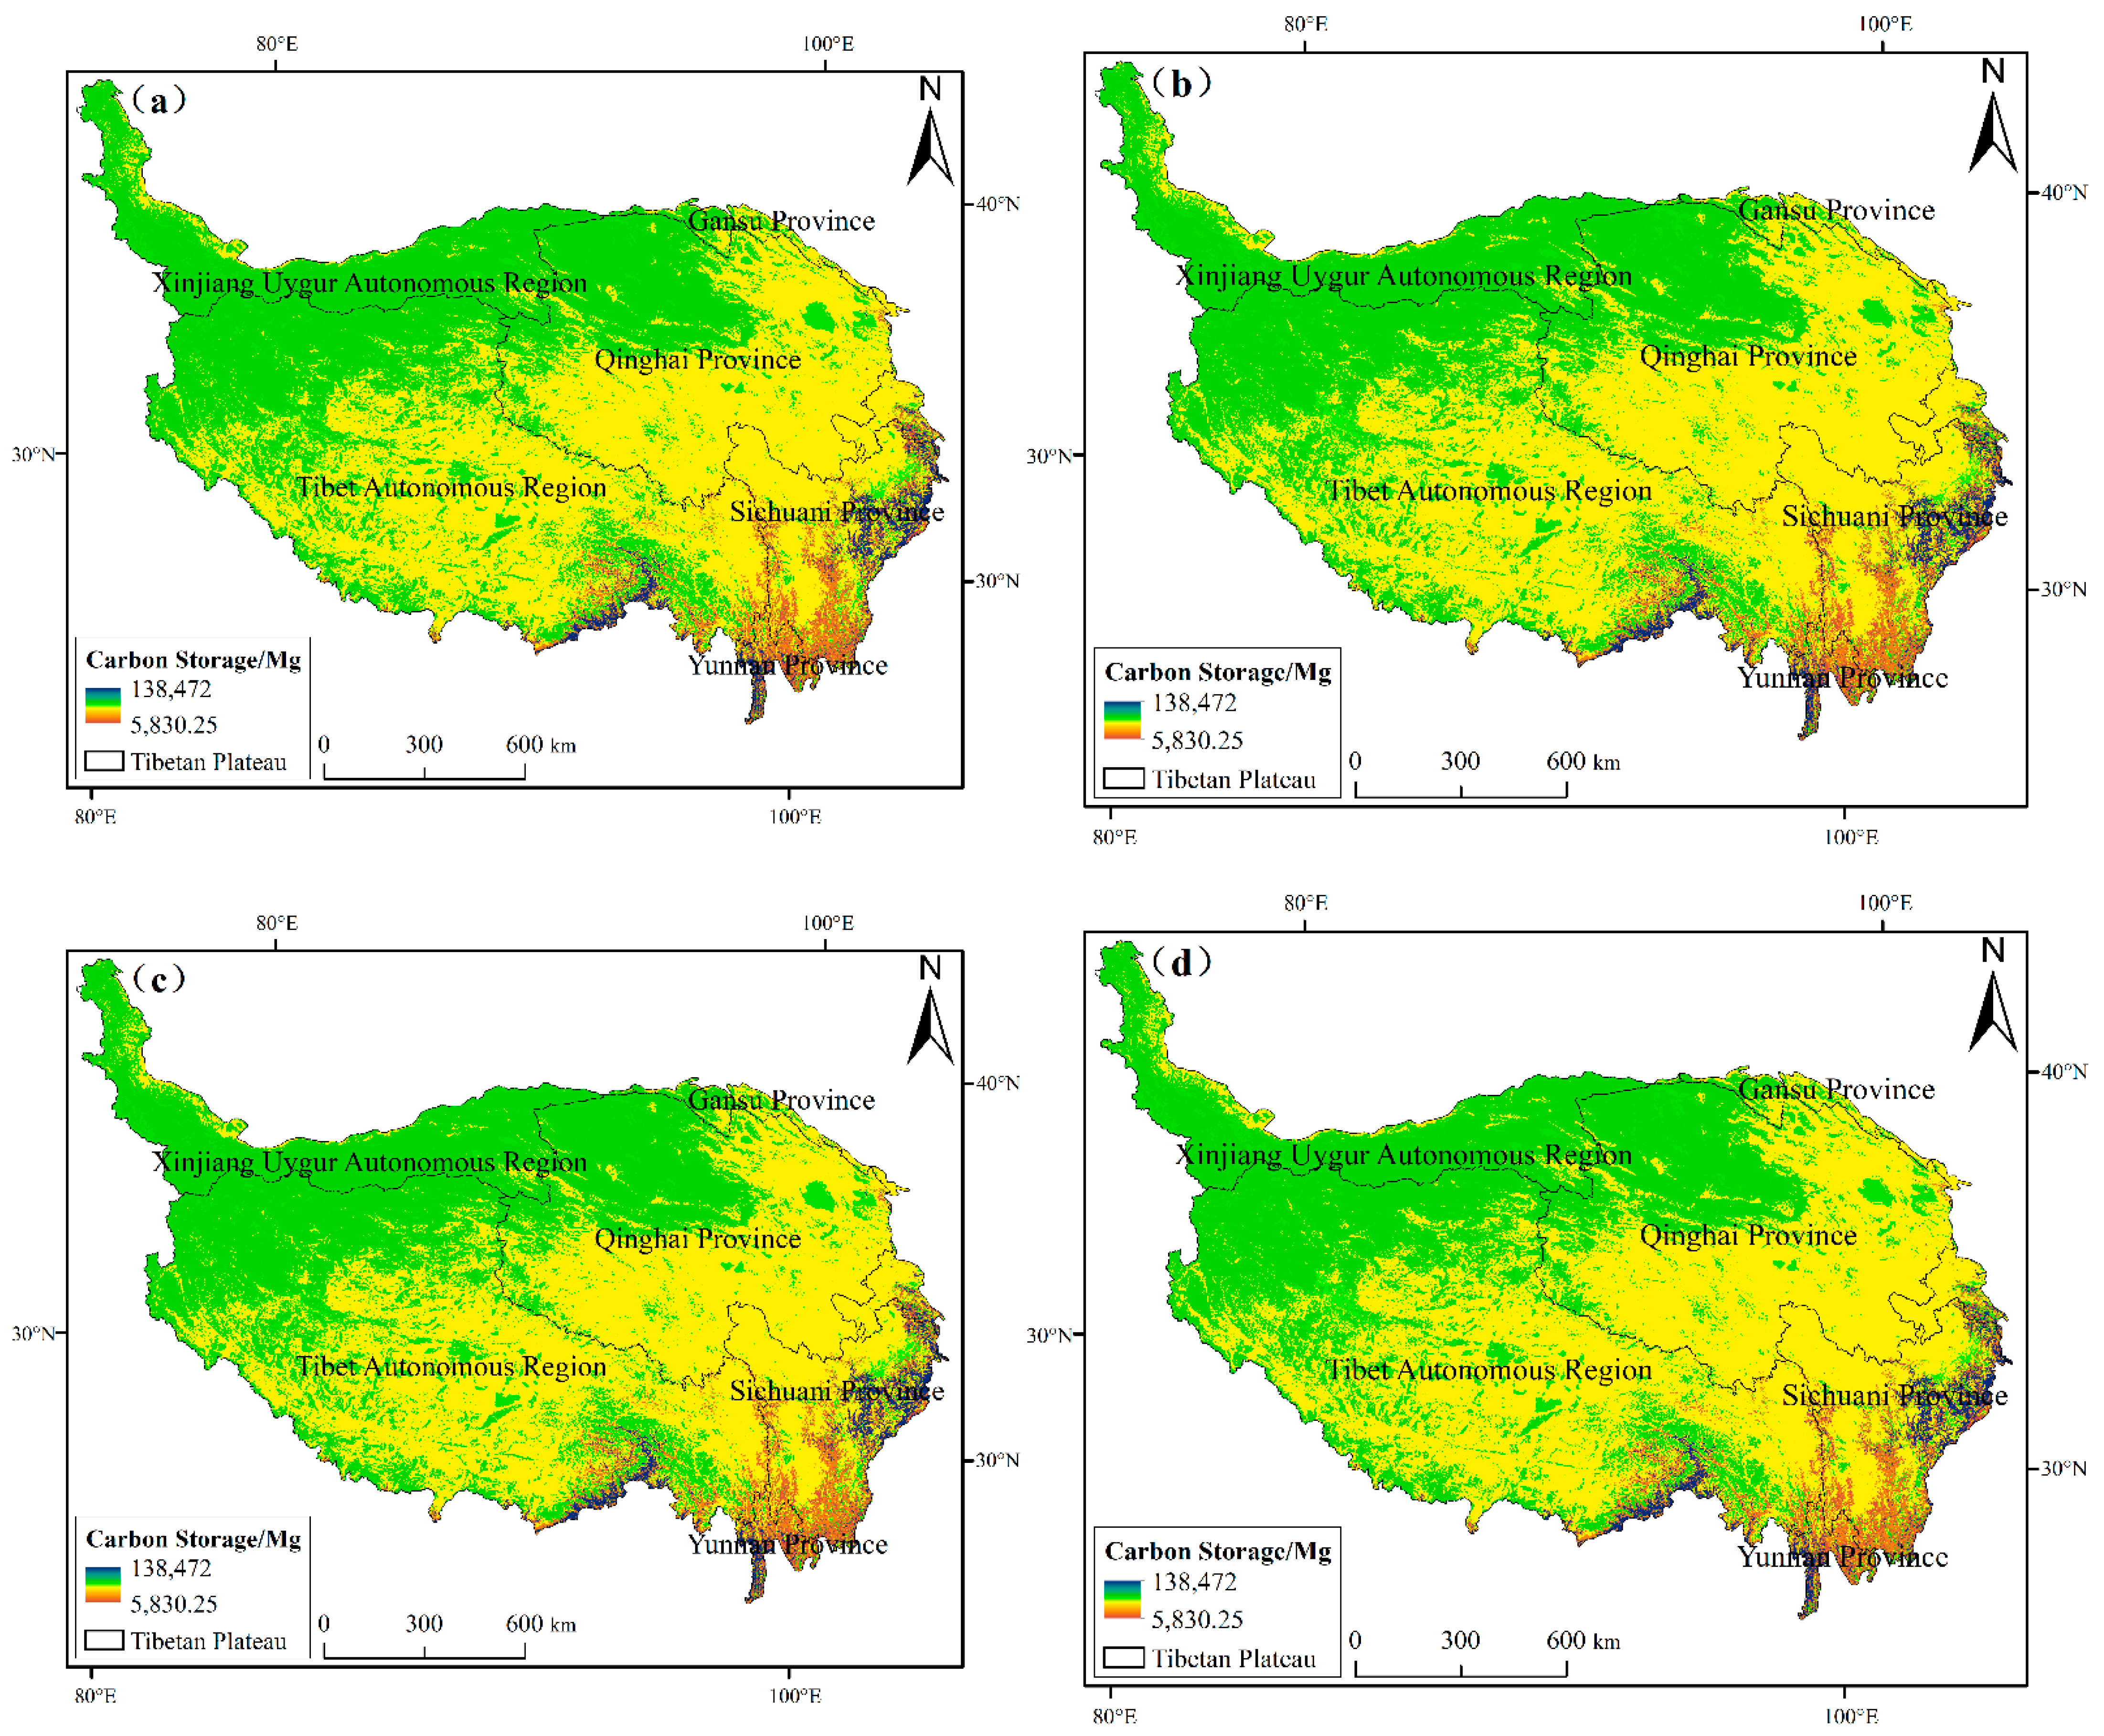
During 2000–2020, the carbon storage of the Tibetan Plateau showed a decreasing trend, and the vegetation type data were predicted in 2030 and 2060 under three scenarios based on the InVEST model (Figure 6 and Figure 7). Compared with the carbon storage in 2020, the total carbon storage under the three scenarios showed a decreasing trend (Figure 8). In the ecological priority development scenario, the carbon storage in 2030 and 2060 was 43.55 × 10⁶ t and 43.40 × 10⁶ t. In this scenario, the carbon storage would decrease by 0.01 × 10⁶ t and 0.16 × 10⁶ t compared with that of 2020. The largest reduction in carbon storage was found in the inertial development scenario, at 0.12 × 10⁶ t and 0.43 × 10⁶ t, lower than that in 2020, mainly due to the reduction in low-coverage grassland, deciduous shrub and mixed forest. In summary, under the constraints of an ecological priority development scenario, the reduction in carbon storage was significantly controlled; under the constraints of the farmland protection scenario, the reduction in carbon storage was controlled to a certain extent. In the inertial development scenario, the carbon storage decreased the most.

3.4. Driving Factors of Carbon Storage Changes in the Tibetan Plateau

3.4.1. Dominant Single Factor Analysis

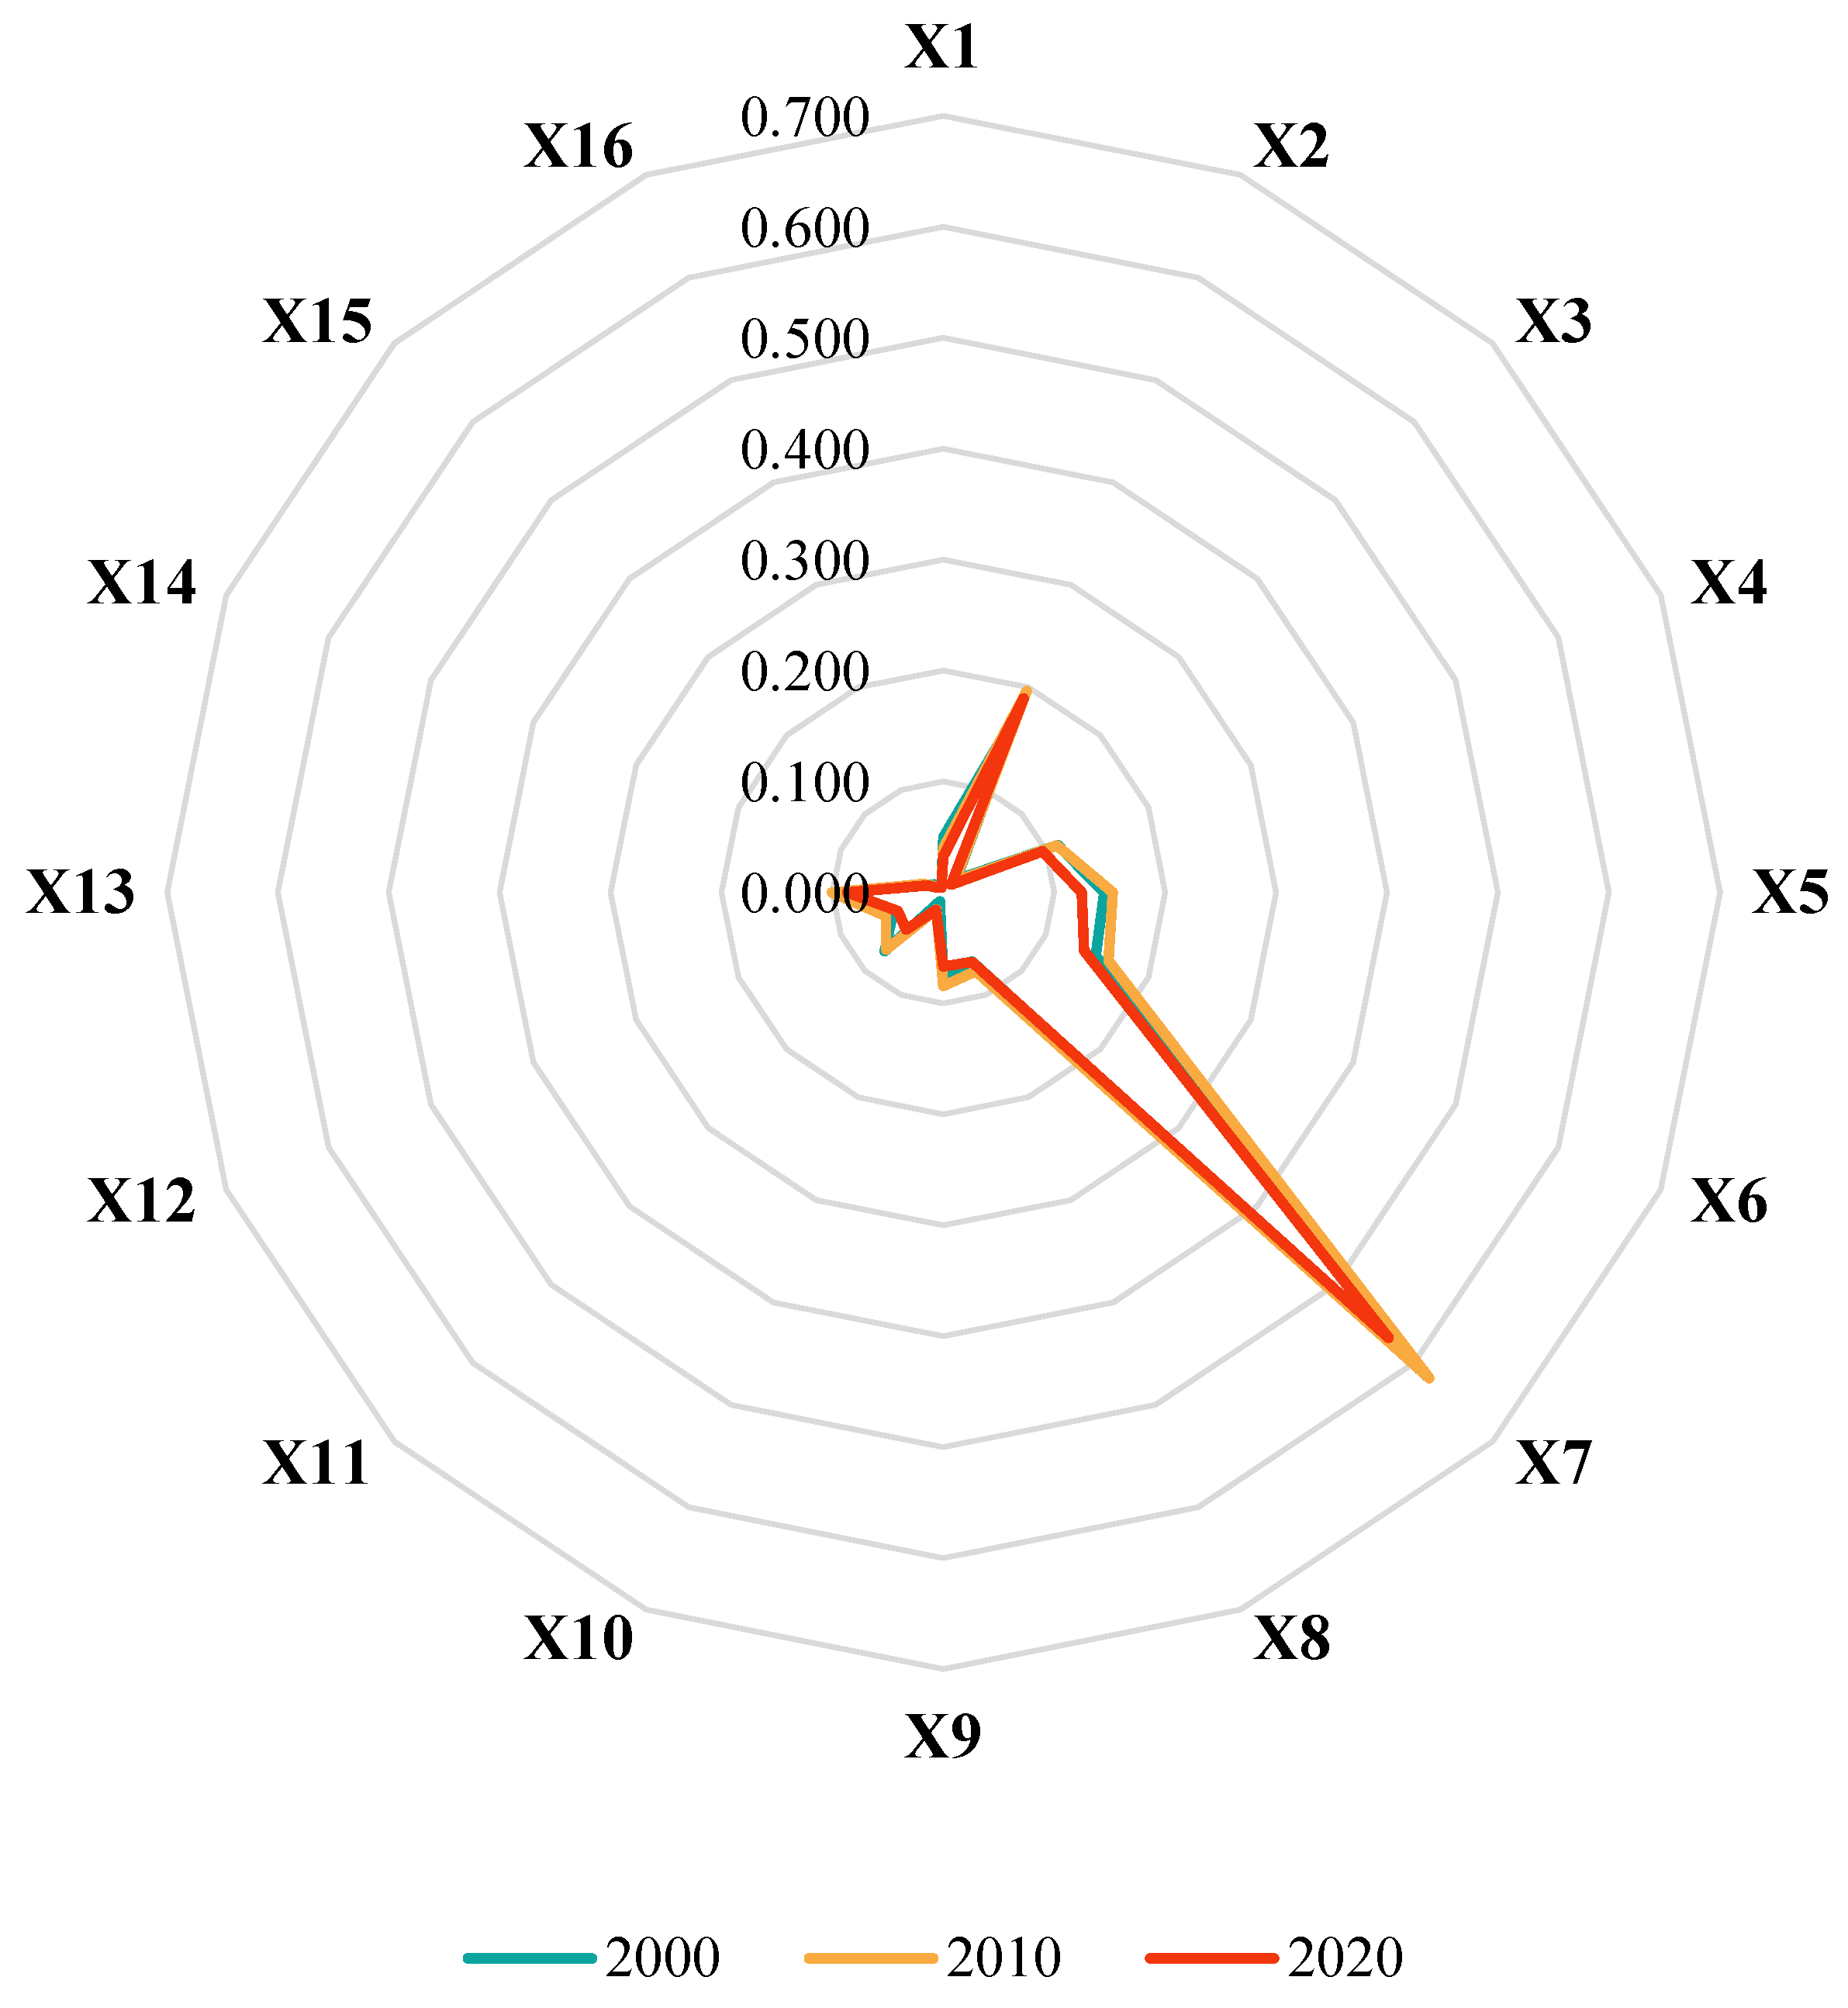
As shown in Figure 9, other natural factors had the greatest impacts on the changes in carbon storage in the Tibetan Plateau, with an average q value of 0.17. This was followed by climate factors, with an average q value of 0.13, while that of socio-economic factors was only 0.03. During 2000–2020, the dominant factor was FVC, with q values of 0.616, 0.619 and 0.567, respectively. DEM had the second largest q values of 0.181, 0.197 and 0.189, respectively. The POP had the smallest explanatory power on the changes in carbon storage in the Tibetan Plateau, with the q value of 0.005. The explanatory power of slope and aspect on carbon storage changes continued to decrease. During 2000–2020, the q value of the slope decreased from 0.050 to 0.032, while that of aspect decreased from 0.016 to 0.010. The explanatory power of temperature and sunshine hour also decreased. The explanatory power of socio-economic factors on the changes in carbon storage was generally low. During 2000–2020, the q values of the distance to farmland were 0.049, 0.056 and 0.044, while that of the distance to town were 0.094, 0.101 and 0.087. Moreover, the q values of the distance to road were 0.018, 0.020 and 0.016, while that of GDP were 0.010, 0.007 and 0.006.

3.4.2. Dominant Interaction Factor Analysis

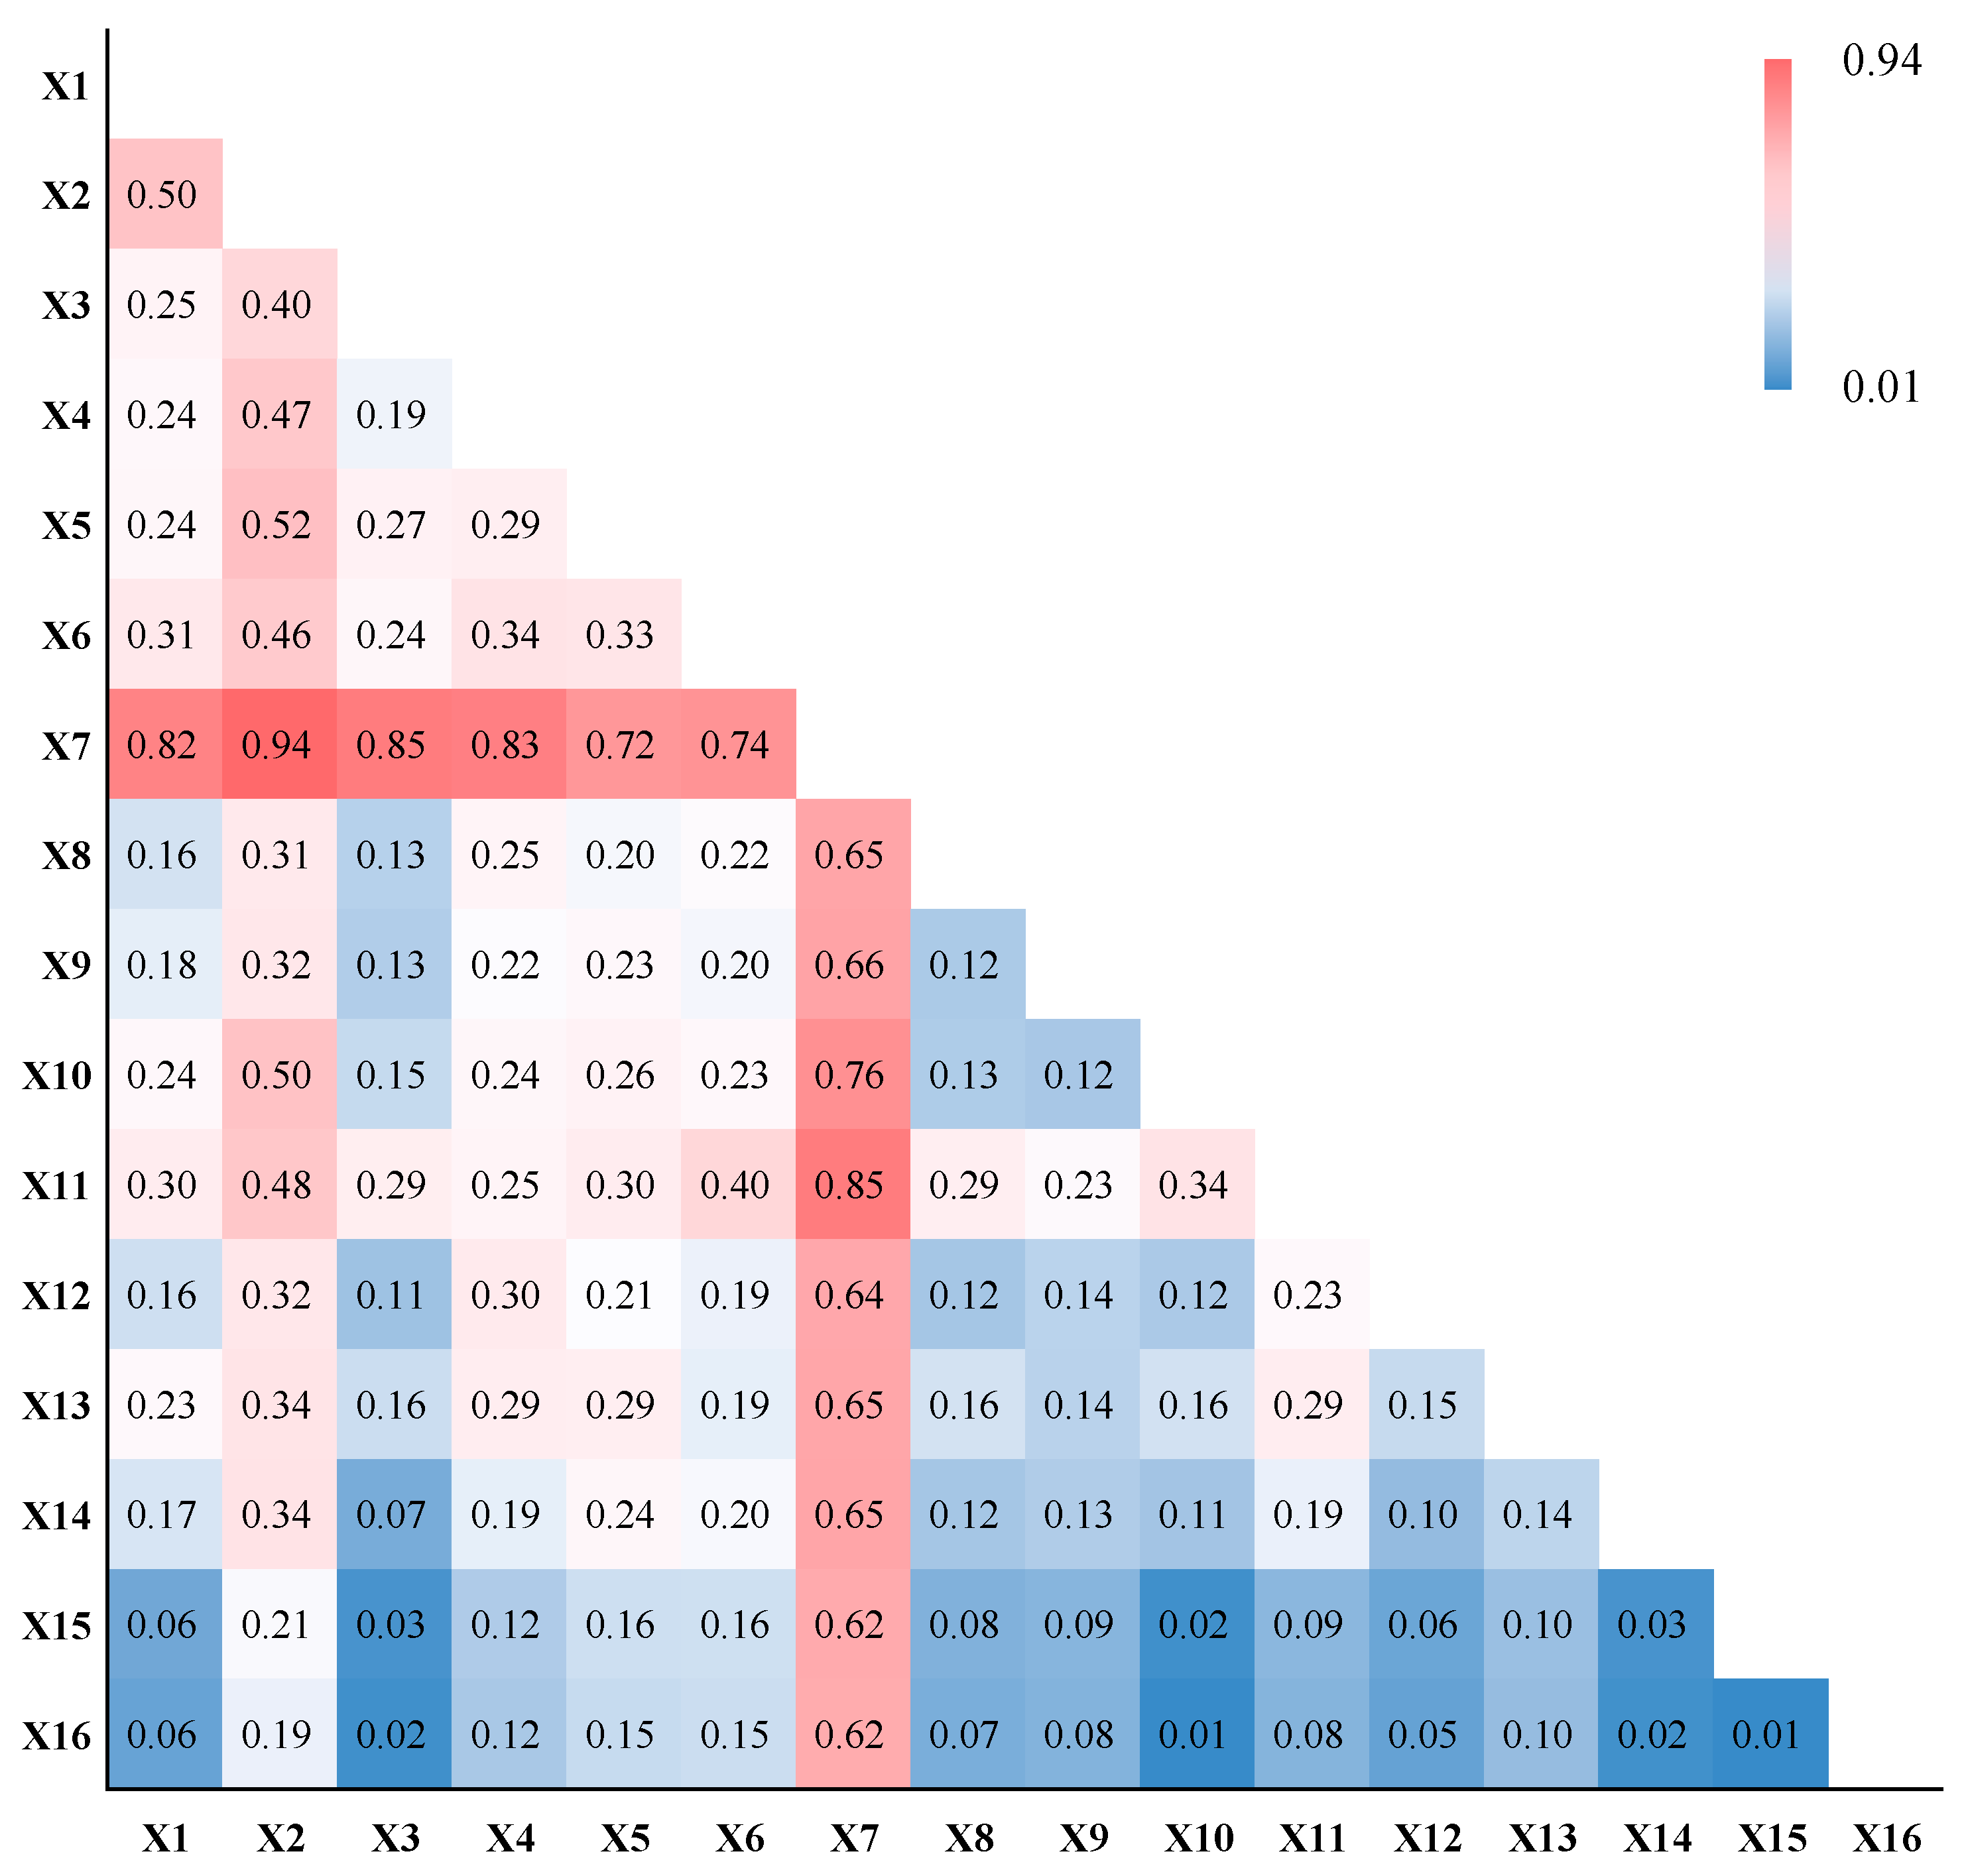
In 2000, the interactions between the driving factors on the changes in carbon storage in the Tibetan Plateau were mostly nonlinear enhancement and double-factor enhancement (Figure 10). The interactive factors with a greater explanatory power were FVC and DEM (0.94), FVC and aspect (0.85), distance to grassland and FVC (0.85), FVC and temperature (0.83) and FVC and slope (0.82), indicating that the interactions between FVC and natural factors such as topographic factors and climatic factors had a greater explanatory power than interactions between other factors (such as FVC, distance to woodland, distance to lake, etc.). In 2000, there were eight interactive factors with a q value greater than 0.70, and the interactions between DEM, distance to lake, distance to grassland and other factors showed a nonlinear enhancement effect.
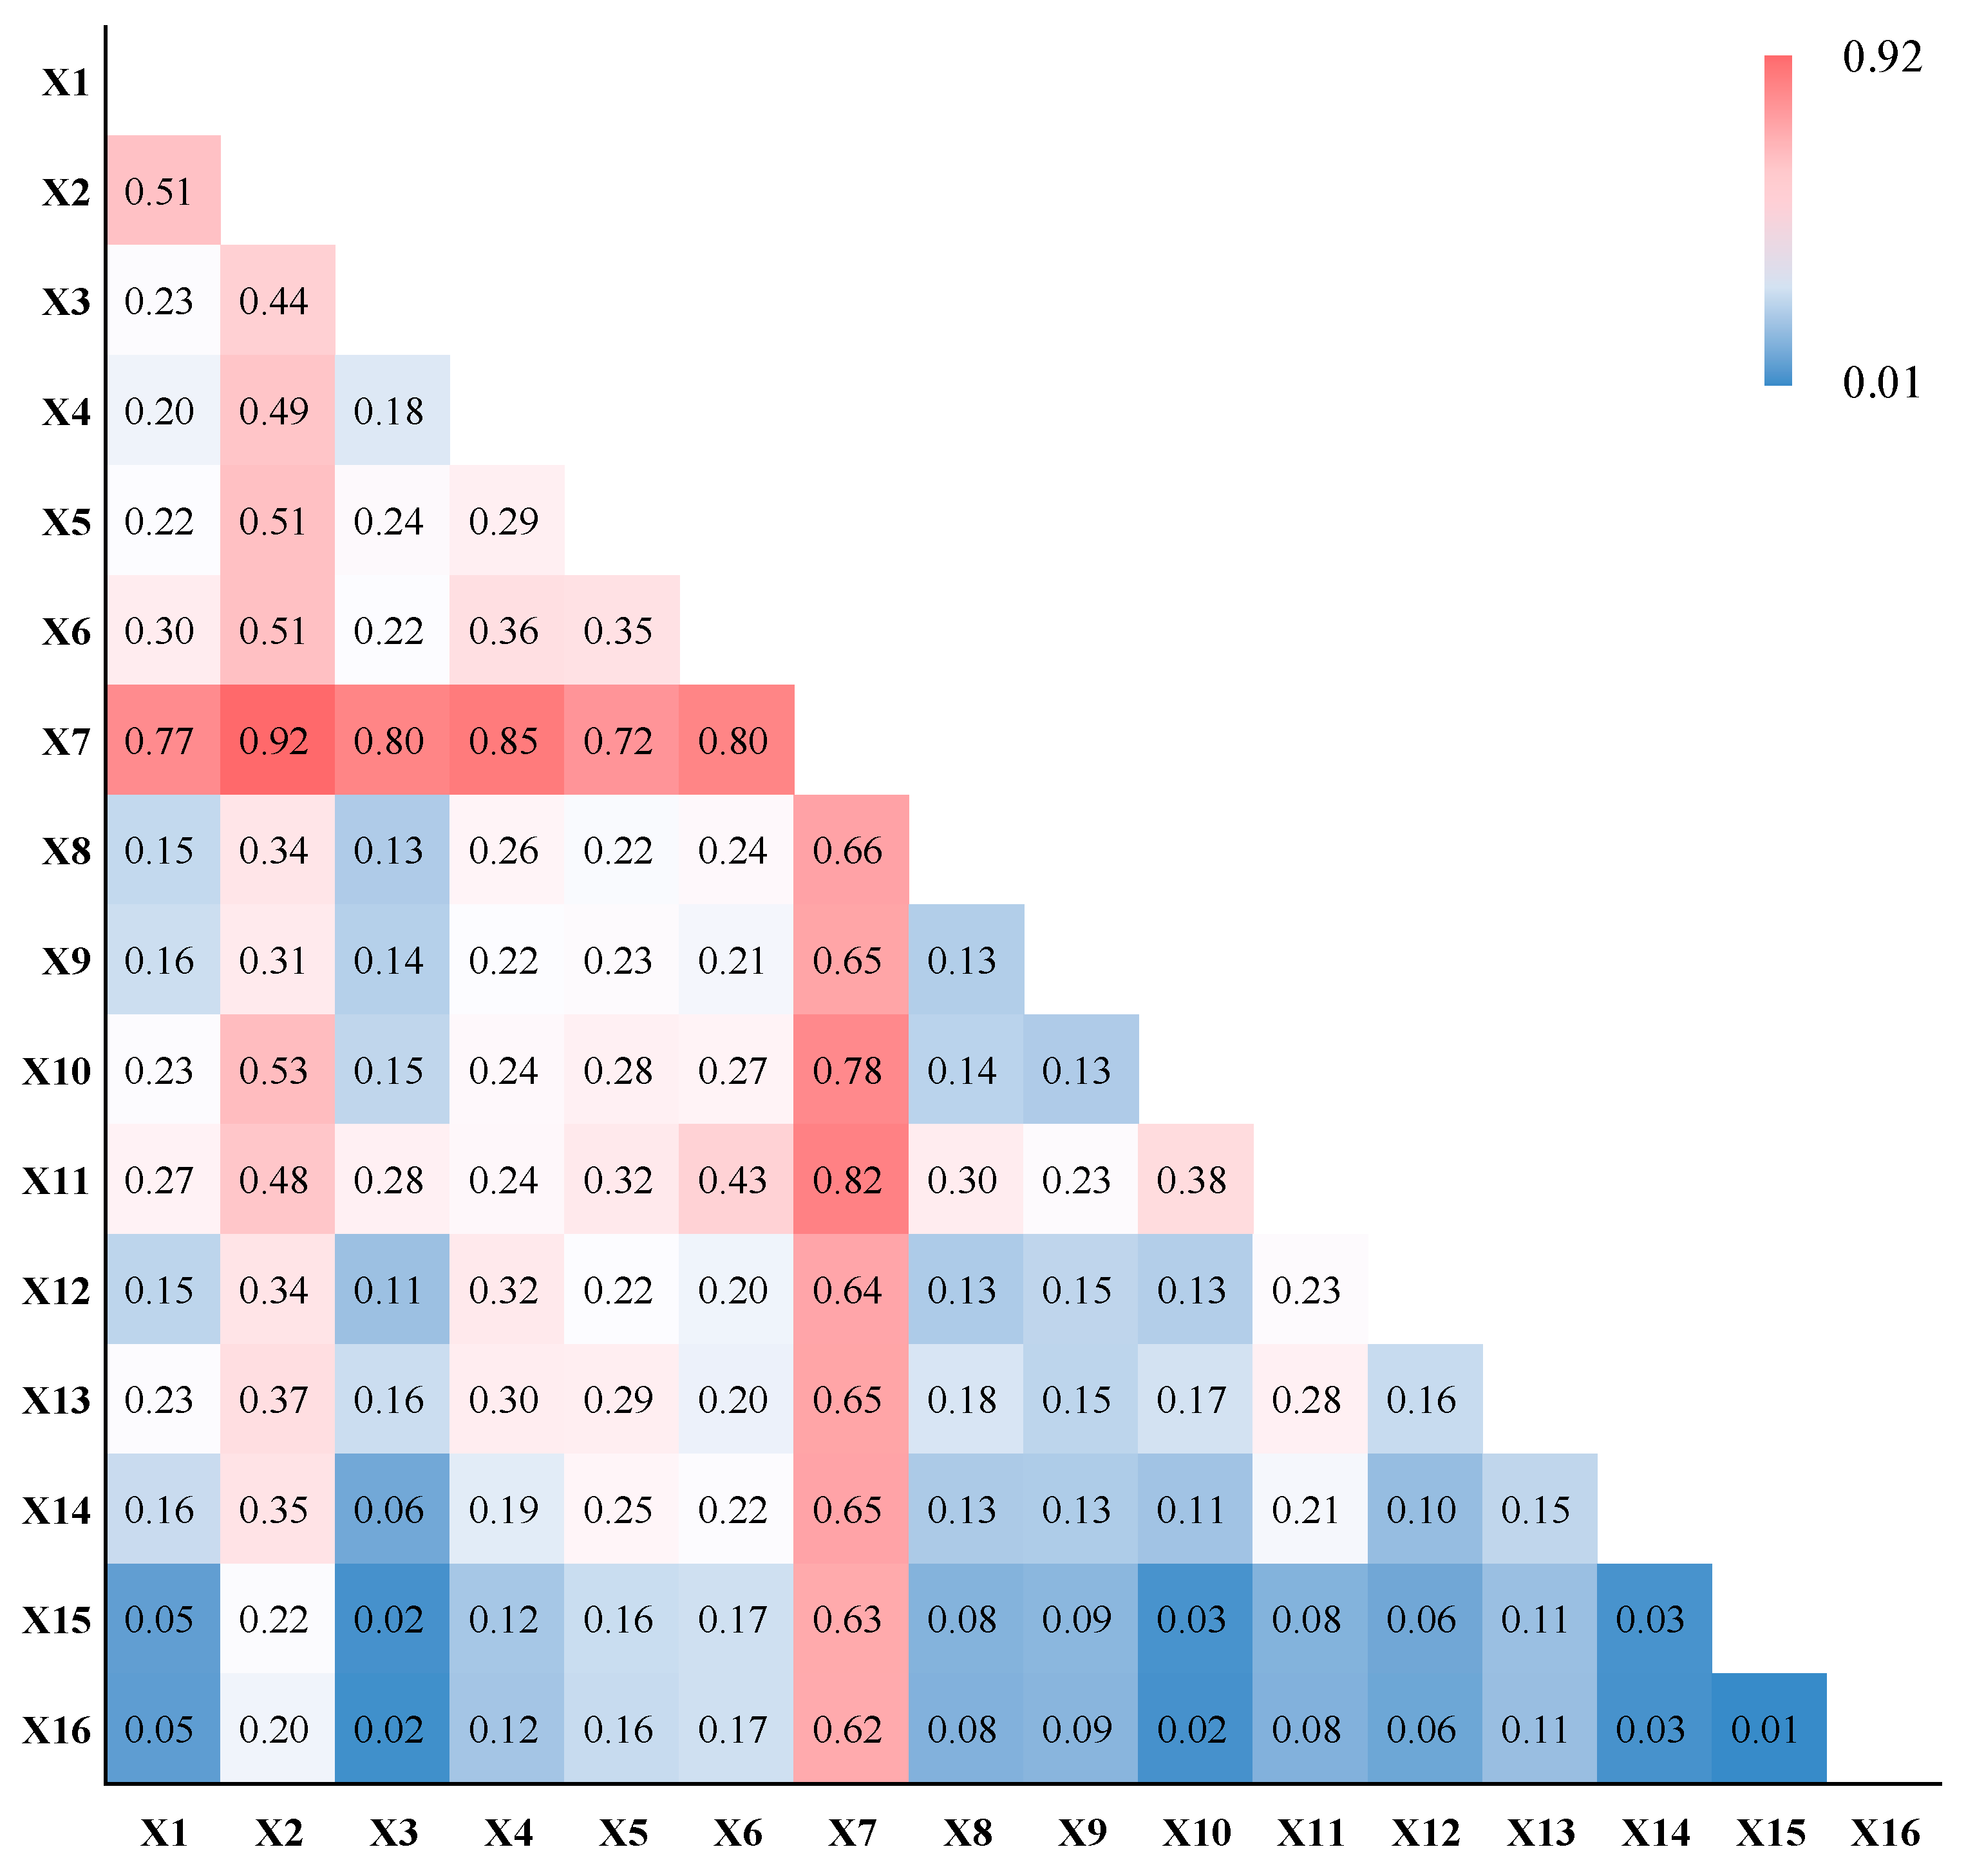
In 2010, the interactions between driving factors of the changes in carbon storage was mostly in the form of the interactions between nonlinear enhancement and double-factor enhancement, and there were no independent and nonlinear weakening factors (Figure 11). The interactive factors with greater explanatory power were FVC and DEM (0.92), FVC and aspect (0.80), FVC and precipitation (0.80), FVC and temperature (0.85) and distance to grassland and FVC (0.82). The results showed that the interactions between FVC and natural factors such as topographic factors and climatic factors had a greater explanatory power than interactions between other factors. In 2010, there were eight interactive factors with a q value greater than 0.70. The interactions between DEM, distance to lake, distance to grassland and other factors showed a nonlinear enhancement effect. Compared with 2000, the interactions between distance to river and hours of sunshine, POP and precipitation, and distance to town and distance to woodland changed from a nonlinear enhancement effect to a double-factor enhancement effect, while the interactions between FVC and precipitation changed from a double-factor enhancement effect to a nonlinear enhancement effect.
In 2020, interactions between the driving factors and the changes in carbon storage were mostly in the form of interactions between nonlinear enhancement and double-factor enhancement (Figure 12). The interactive factors with greater explanatory power were FVC and DEM (0.90), distance to lake and FVC (0.77), FVC and aspect (0.74), FVC and temperature (0.74), FVC and slope (0.73) and distance to grassland and FVC (0.72). The results showed that the interactions between FVC and natural factors, such as topographic factors and climatic factors, had a greater explanatory power than interactions between other factors. In 2020, there were six interactive factors with q values greater than 0.70, among which the interactions between DEM, distance to lake, distance to grassland and other factors showed a nonlinear enhancement effect. Compared with 2010, the interactions between FVC and precipitation and GDP and sunshine hours changed from a nonlinear enhancement effect to a double-factor enhancement effect, while the interactions between distance to woodland and precipitation, GDP and precipitation, GDP and distance to river, and GDP and distance to road changed from a double-factor enhancement effect to a nonlinear enhancement effect.

4. Discussion

4.1. The Relationship between Carbon Storage and Vegetation Types in the Tibetan Plateau

Changes in vegetation types were considered to be an important factor leading to changes in global terrestrial ecosystem carbon storage. During 2000–2020, deciduous shrub, mixed forest and low-coverage grassland showed decreasing trends of 1795.50 km2, 334.25 km2, and 37,298.25 km2, respectively, while the non-vegetation zones increased by 9486.00 km2. The reason lays in the fact that human activities, such as urbanization, overgrazing and steep slope reclamation, destroy the regional vegetation ecosystems that reduce the carbon storage in sparse vegetation zones [28]. Meanwhile, with global warming, the rising temperatures and increasing precipitation would be conductive to the vegetation grown in non-vegetation zones [26]. In 2000–2010, deciduous shrub and low-coverage grassland decreased by 977.50 km2 and 28,864.50 km2, respectively, accounting for 54.44% and 77.39% of the total reduction. During 2000–2020, the total carbon storage decreased by 0.37 × 10⁶ t, of which 0.29 × 10⁶ t decreased from 2000 to 2010, accounting for 77.48% of the total reduction, consistent with the change in vegetation types [34]. The dominant single factor and interactive dominant factors that had the greatest impact on carbon storage changes were FVC, FVC and DEM, respectively, indicating that vegetation coverage and terrain played an important role in the process of carbon storage changes during 2000–2020. The reason was that the grassland was the dominant plant type and the terrain had greatly influenced the spatial distribution of precipitation, temperature and plant type [38].
Since 2008, the ecosystem function of the Tibetan Plateau has improved, and the reason for this is that the surface vegetation coverage of the Tibet Autonomous Region has shown an increasing trend [39]. In 2000–2015, the area of soil erosion, desertification and rocky desertification decreased. By 2018, the implementation of major ecological projects progressed smoothly, including grassland ecological protection and construction projects, woodland ecological protection and construction projects, comprehensive soil erosion control projects and desertification land control projects; the area of desertification reduced, and the effect of sand control in the project area was remarkable [40]. Forest ecological engineering improved quality and efficiency, carbon sequestration capacity significantly improved and returning grazing land to grassland effectively promoted grassland restoration. Since the implementation of the Natural Forest Protection Project, the forest coverage rate in the Tibet Autonomous Region has increased [41]. After the ban on deforestation, the total consumption of forest resources decreased. The carbon storage of plantations in the Tibet Autonomous Region also increased [42].

4.2. Land-Use Policy Recommendations for the Tibetan Plateau

Through an analysis of the spatio-temporal changes and the dominant driving factors of carbon storage in the Tibetan Plateau during 2000–2020, it was found that the non-vegetation zone rapidly expanded, occupying a large area of low-coverage grassland, steppe, montane coniferous forest and tufted dwarf grass. According to the expansion trend of land-use types and related policies, the distributions of vegetation types in the study area in 2030 and 2060 were predicted and analyzed under three scenarios. The farmland protection scenario and ecological priority development scenario could effectively promote increases in deciduous shrub, closed shrub, tufted dwarf grass, steppe and low-coverage grassland. The main reason for this is that the ecological priority development scenario limits the expansion of non-vegetation zones with low carbon density and promotes an increase in ecological land, thus slowing down the decreasing trend of carbon storage. In view of these phenomena, this study put forward the following suggestions for regional land-use planning in the Tibetan Plateau.
(1) Reasonable planning of urban construction and development boundaries, restoration of severely degraded vegetation zone and vegetation reconstruction.
It is necessary to rationally plan the urban expansion boundary to ensure that it is concentrated and reasonable in form. When expanding the urban boundary, attention should be paid to avoiding ecological protection areas and national key ecological function areas, and not to occupying permanent basic farmland or occupying such areas less. Vegetation reconstruction was carried out on severely degraded ‘bare land’ grassland using artificial grassland. Grazing fallow and grassland fencing can be used to restore slightly or moderately degraded grassland [43].
(2) Establish the concept of an ecological red line to achieve ecological co-governance and environmental co-protection.
The ecological protection red line is an important control boundary in territorial space planning. Establishing the concept of an ecological red line is key to promoting the balanced development of the population, resources and environment, and ensuring the complementarity and coordination of economic, social and ecological benefits in order to preserve and protect the original ecological land that has been degraded and destroyed via vegetation reconstruction and restoration.

5. Conclusions

Based on the vegetation type data during 2000–2020, the carbon storage of the Tibetan Plateau was estimated using the InVEST model. Additionally, its spatial and temporal changes were analyzed and predicted using the PLUS model. Finally, the dominant driving factors of carbon storage changes were detected using Geodetector. The main conclusions were as follows.
(1) During 2000–2020, the vegetation area of the Tibetan Plateau showed a decreasing trend. Among the reduced vegetation area, 80.0% of the low-coverage grassland was transformed into non-vegetation zones, and 17.28% of the steppe was transferred to non-vegetation zones.
(2) During 2000–2020, the carbon storage showed a spatial distribution pattern of low in the southeast and high in the northwest, with a decrease of 0.37 × 10⁶ t. The area of the decreased zone was 69,252.25 km2, accounting for 2.72%, while that of the severely decreased zone was 9772.75 km2, accounting for 0.38%.
(3) In 2030 and 2060, under the constraint of the ecological priority development, the reduction in carbon storage was the smallest, at 0.01 × 10⁶ t and 0.16 × 10⁶ t, respectively. Under the constraint of the inertial development, carbon storage had the largest reduction, at 0.12 × 10⁶ t and 0.43 × 10⁶ t, respectively.
(4) FVC, DEM, slope and temperature were the dominant driving factors of carbon storage changes. The interactions between driving factors and carbon storage changes mainly involved nonlinear enhancement and double-factor enhancement. FVC and DEM, FVC and aspect, distance to grassland and FVC, and FVC and temperature had a greater explanatory power for carbon storage changes.

Author Contributions

Conceptualization, methodology, writing—original draft preparation, H.Z.; investigation, supervision, project administration, funding acquisition, B.G.; investigation, G.W. B.G. and G.W. contributed to this paper as corresponding authors equally. All authors have read and agreed to the published version of the manuscript.

Funding

This research was funded by Natural Science Foundation of Shandong Province, grant number ZR2021MD047, Scientific Innovation Project for Young Scientists in Shandong Provincial Universities, grant number 2022KJ224, National Natural Science Foundation of China, grant number 42101306 and 52101405, A grant from State Key Laboratory of Resources and Environmental Information System.

Data Availability Statement

Not applicable.

Conflicts of Interest

The authors declare no conflict of interest.

Appendix A

Table A1. Prediction of demand for each vegetation type in the Tibetan Plateau (km2).
Vegetation Type20302060
Montane coniferous forest39,952.2541,845.00
Hard-leaf shrub2802.002755.75
Deciduous shrub5750.255022.25
Mixed forest45,629.2545,266.25
Closed shrub91.25105.25
Creosote bush desert28,569.0032,966.50
Tufted dwarf grass60,181.7567,798.00
Steppe1,324,129.501,359,391.75
Low coverage grassland945,921.00891,580.50
Non-vegetation88,594.2594,889.25
Table A2. Transition matrix of each vegetation type in the Tibetan Plateau.
20302060
1234567891012345678910
Inertia development scenario110110111011011011101
211010111001101001000
311110111001111011100
411110111001111001100
510001111001001111100
600100111100011011111
710110111001011011100
800000111110000011111
900000101110000010111
1000000101111000011111
Farmland protection scenario110110111011011011101
211010111011101001001
311110111011111011101
411110111011111001101
510001111011001111101
600100111110011011111
710110111011011011101
800000111110000011111
900000101110000010111
1000000000010000000001
Ecological priority development scenario111111111101111111110
211111111101111111110
311111111101111111110
411111111101111111110
511111111101111111110
611111111101111111110
711111111101111111110
811111111101111111110
911111111101111111110
1011111111111111111111
Note: 1–10 represent vegetation types: 1 is Montane coniferous forest, 2 is hard-leaf shrub, 3 is deciduous shrub, 4 is mixed forest, 5 is closed shrub, 6 is desert shrub, 7 is tufted dwarf grass, 8 is steppe, 9 is low-coverage grassland, 10 is non-vegetation. The conversion rules were set according to the transfer proportion of each vegetation type in the inertial development scenario. When the transfer proportion was greater than or equal to 0.1, it was set to be convertible; that is, the transfer cost was 1; conversely, it was 0.
Table A3. Neighborhood weight assignments for each vegetation type in the Tibetan Plateau.
Vegetation Type20302060
Inertia Development ScenarioFarmland Protection ScenarioEcological Priority Development ScenarioInertia Development ScenarioFarmland Protection ScenarioEcological Priority Development Scenario
Montane coniferous forest0.660.661.000.710.711.00
Hard-leaf shrub0.630.631.000.620.621.00
Deciduous shrub0.520.521.000.400.401.00
Mixed forest0.610.611.000.600.601.00
Closed shrub0.530.531.000.670.671.00
Desert shrub0.760.761.000.940.941.00
Tufted dwarf grass0.570.571.000.690.691.00
Steppe0.600.601.000.620.621.00
Low-coverage grassland0.590.591.000.540.541.00
Non-vegetation0.701.000.700.781.000.78

References

  1. Wang, F.; Joshua, S.; Liu, X. Carbon emission flow in the power industry and provincial CO2 emissions: Evidence from cross- provincial secondary energy trading in China. J. Clean. Prod. 2017, 159, 397–409. [Google Scholar] [CrossRef]
  2. Zhao, M.M.; He, Z.B.; Du, J.; Chen, L.F.; Lin, P.F.; Fang, S. Assessing the effects of ecological engineering on carbon storage by linking the CA-Markov and InVEST models. Eco. Indic. 2019, 98, 29–38. [Google Scholar] [CrossRef]
  3. Houghton, R.A. Revised estimates of the annual net flux of carbon to the atmosphere from changes in land use and land management 1850–2000. Tellus B Chem. Phys. Meteorol. 2003, 55, 378–390. [Google Scholar]
  4. Hu, Q.W.; Li, T.T.; Deng, X.; Wu, T.W.; Zhai, P.M.; Huang, D.Q.; Fan, X.W.; Zhu, Y.K.; Lin, Y.C.; Xiao, X.C.; et al. Intercomparison of global terrestrial carbon fluxes estimated by MODIS and Earth system models. Sci. Total Environ. 2022, 810, 152231. [Google Scholar] [CrossRef]
  5. Wang, Z.P.; He, Y.T.; Niu, B.; Wu, J.S.; Zhang, X.Z.; Zu, J.X.; Huang, K.; Li, M.; Cao, Y.A.; Zhang, Y.J.; et al. Sensitivity of terrestrial carbon cycle to changes in precipitation regimes. Eco. Indic. 2020, 113, 106223. [Google Scholar] [CrossRef]
  6. Guo, B.; Yang, F.; Fan, Y.W.; Zang, W.Q. The dominant driving factors of rocky desertification and their variations in typical mountainous karst areas of Southwest China in the context of global change. Catena 2023, 220, 106674. [Google Scholar] [CrossRef]
  7. Li, G.D.; Zhang, J.H.; Chen, C.; Tian, H.F.; Zhao, L.P. Research progress on carbon storage and flux in different terrestrial ecosystem in China under global climate change. Ecol. Environ. Sci. 2013, 22, 873–878. [Google Scholar]
  8. Wang, Z.H.; Liu, H.M.; Guan, Q.W.; Wang, X.J.; Hao, J.P.; Ling, N.; Shi, C. Carbon storage and density of urban forest ecosystems in Nanjing. J. Nanjing For. Univ. (Nat. Sci. Ed.) 2011, 35, 18–22. [Google Scholar]
  9. Yuan, N.; Wang, E.H.; Lv, S.F.; Tang, X.P.; Wang, T.Y.; Wang, G.; Zhou, Y.F.; Zhou, G.M.; Shi, Y.J.; Xu, L. Degradation reduces greenhouse gas emissions while weakening ecosystem carbon sequestration of Moso bamboo forests. Sci. Total Environ. 2023, 877, 162915. [Google Scholar] [CrossRef]
  10. Chuai, X.W.; Huang, X.J.; Lai, L.; Wang, W.J.; Peng, J.W.; Zhao, R.Q. Land use structure optimization based on carbon storage in several regional terrestrial ecosystems across China. Environ. Sci. Policy 2013, 25, 50–61. [Google Scholar] [CrossRef]
  11. Liu, X.J.; Li, X.; Liang, X.; Shi, H.; Ou, J.P. Simulating the Change of Terrestrial Carbon Storage in China Based on the FLUS-InVEST Model. Trop. Geogr. 2019, 39, 397–409. [Google Scholar]
  12. Liao, L.L.; Zhou, L.; Wang, S.Q.; Wang, X.Q. Carbon sequestration potential of biomass carbon pool for new afforestation in China during 2005–2013. Acta Geogr. Sin. 2016, 71, 1939–1947. [Google Scholar]
  13. Zhao, M.W.; Yue, T.X.; Zhao, N.; Sun, X.F.; Zhang, X.Y. Combining LPJ-GUESS and HASM to simulate the spatial distribution of forest vegetation carbon stock in China. J. Geogr. Sci. 2014, 24, 249–268. [Google Scholar] [CrossRef]
  14. Tao, Y.; Li, F.; Liu, X.S.; Zhao, D.; Sun, X.; Xu, L.F. Variation in ecosystem services across an urbanization gradient: A study of terrestrial carbon stocks from Changzhou, China. Ecol. Model. 2015, 318, 210–216. [Google Scholar] [CrossRef]
  15. Zhang, Y.; Shi, X.Y.; Tang, Q. Carbon storage assessment in the upper reaches of the Fenhe River under different land use scenarios. Acta Ecol. Sin. 2021, 41, 360–373. [Google Scholar]
  16. Liang, Y.; Hashimoto, S.; Liu, L. Integrated assessment of land–use/land–cover dynamics on carbon storage services in the Loess Plateau of China from 1995 to 2050. Eco. Indic. 2021, 120, 106939. [Google Scholar] [CrossRef]
  17. Wang, Z.; Li, X.; Mao, Y. Dynamic simulation of land use change and sassessment of carbon storage based on climate change scenarios at the city level: A case study of Bortala, China. Eco. Indic. 2022, 134, 108499. [Google Scholar] [CrossRef]
  18. Hou, J.K.; Chen, J.J.; Zhang, K.Q. Temporal and spatial variation characteristics of carbon storage in the source region of the Yellow River based on InVEST and GeoSoS—FLUS models and its response to different future scenarios. Environ. Sci. 2022, 43, 5253–5262. [Google Scholar]
  19. Javier, L.P.; Zachary, H.F.; Ivette, P.; John, V. The importance of shade trees in promoting carbon storage in the coffee agroforest systems. Agr. Ecosyst. Environ. 2023, 355, 108594. [Google Scholar]
  20. Tristan, R.M.B.; Renats, T.; Jeannette, E.; Cecilia, A. The effect of spatial and temporal planning scale on the trade-off between the financial value and carbon storage in production forests. Land Use Policy 2023, 127, 106583. [Google Scholar]
  21. Simone, R.; Laure, K.; Timothy, S. Nature-based solutions for climate change mitigation: Assessing the Scottish Public’s preferences for saltmarsh carbon storage. Ecol. Econ. 2023, 211, 107863. [Google Scholar]
  22. Zhang, F.T.; Su, W.C.; Liang, Y.H. A case study of ecological regionalization in Chongqing Three Gorges Reservoir area. J. Chongqing Norm. Univ. (Nat. Sci.) 2008, 25, 22–26+123. [Google Scholar]
  23. Tian, Y.Q.; Ou, Y.H.; Xu, X.L.; Song, M.H.; Zhou, C.P. Distribution characteristics of soil organic carbon storage and density on the Qinghai-Tibet Plateau. Acta Pedol. Sincia 2008, 45, 933–942. [Google Scholar]
  24. Li, R.W.; Ye, C.C.; Wang, Y.; Han, G.D.; Sun, J. Carbon storage estimation and its drivering force analysis based on InVEST model in the Qinghai-Tibetan Plateau. Acta Agrestia Ainica 2021, 29, 43–51. [Google Scholar]
  25. Wang, X.Y.; Ke, B.Y.; Huang, Z.Q.; Yang, G.; Huang, G.H.; Hu, Q.P.; Sun, L.L. Quantification of forest carbon storage in Qinghai-Tibetan Plateau. For. Environ. Sci. 2020, 36, 9–19. [Google Scholar]
  26. Guo, B.; Lu, M.; Fan, Y.W.; Wu, H.W.; Yang, Y.; Wang, C.L. A novel remote sensing monitoring index of salinization based on three dimensional feature space model and its application in the Yellow River Delta. Geoma. Nat. Haz. Risk 2023, 14, 95–156. [Google Scholar] [CrossRef]
  27. Li, W.; Cao, W.X.; Wang, J.L.; Li, X.L.; Xu, C.L.; Shi, S.L. Effects of grazing regime on vegetation structure, productivity, soil quality, carbon and nitrogen storage of alpine meadow on the Qinghai-Qinghai-Tibetan Plateau. Ecol. Eng. 2017, 98, 123–133. [Google Scholar] [CrossRef]
  28. Liu, Y.F.; Guo, B.; Lu, M.; Zang, W.Q.; Yu, T.; Chen, D.H. Quantitative distinction of the relative actions of climate change and human activities on vegetation evolution in the Yellow River Basin of China during 1981–2019. J. Arid Land 2023, 15, 91–108. [Google Scholar] [CrossRef]
  29. Ding, J.; Liu, X.Y.; Guo, Y.C.; Ren, H.R. Study on Vegetation Change in the Qinghai-Tibet Plateau from 1980 to 2015. Ecol. Environ. Sci. 2021, 30, 288–296. [Google Scholar]
  30. Wang, Z.C.; Gao, Z.Q.; Jiang, X.P. Analysis of the evolution and driving forces of tidal wetlands at the estuary of the Yellow River and Laizhou Bay based on remote sensing data cube. Ocean Coast. Manag. 2023, 237, 106535. [Google Scholar] [CrossRef]
  31. Yu, Y.; Guo, B.; Wang, C.L.; Zang, W.Q.; Huang, X.Z.; Wu, Z.W.; Xu, M.; Zhou, K.D.; Li, J.L.; Yang, Y. Carbon storage simulation and analysis in Beijing-Tianjin-Hebei region based on CA-plus model under dual-carbon background. Geoma. Nat. Haz. Risk 2023, 14, 2173661. [Google Scholar] [CrossRef]
  32. Sharma, H.; Pant, K.S.; Bishist, R.; Gautam, K.L.; Ludarmani; Dogra, R.; Kumar, M.; Amit, K. Estimation of biomass and carbon storage potential in agroforestry systems of north western Himalayas, India. Catena 2023, 255, 107009. [Google Scholar] [CrossRef]
  33. Lin, C.Y.; Kuo, L.S.; Chen, T.Y.; Wu, S.W.; Tseng, C.W. Estimation and application of spatial distribution of carbon storage in Wushe reservoir watershed based on environmental indicators in Taiwan. Eco. Indic. 2022, 145, 109626. [Google Scholar] [CrossRef]
  34. Fu, J.J.; Wang, W.; Hunter, P.D.; Li, W.; Sun, J.Y. Trends in normalized difference vegetation index time series in differently regulated cascade reservoirs in Wujiang catchment, China. Eco. Indic. 2023, 146, 109831. [Google Scholar] [CrossRef]
  35. Mao, Y.F.; Zhou, Q.G.; Wang, T.; Luo, H.R.; Wu, L.J. Spatial-temporal variation of carbon storage and its quantitative attribution in the Three Gorges Reservoir area coupled with PLUS-InVEST Geodector model. Resour. Environ. Yangtze River 2023, 32, 1042–1057. [Google Scholar]
  36. Wei, Q.Q.; Mukadasi, A.; Halike, A.; Yao, K.X.; Yao, L.; Tang, H.; Tuheti, B. Temporal and spatial variation analysis of habitat quality on the PLUS-InVEST model for Ebinur Lake Basin, China. Eco. Indic. 2022, 145, 109632. [Google Scholar] [CrossRef]
  37. Liu, L.; Chen, Z.L. Urban growth simulation by incorporating planning policies into a CA-based future land-use simulation model. Int. J. Geog. Inf. Sci. 2018, 32, 2294–2316. [Google Scholar]
  38. Liu, J.; Xu, Q.L.; Yi, J.H.; Huang, X. Analysis of the heterogeneity of urban expansion landscape patterns and driving factors based on a combined Multi-Order Adjacency Index and Geodetector model. Eco. Indic. 2022, 136, 108655. [Google Scholar] [CrossRef]
  39. Wang, X.; Peng, S.T.; Sun, J.H.; Li, M.W.; Wang, L.; Li, Y.C.; Wang, J.J.; Sun, L.J.; Zheng, T.L. Altitude restricts the restoration of community composition and vegetation coverage of quarries on the Qinghai-Tibet Plateau. Eco. Indic. 2023, 151, 110339. [Google Scholar] [CrossRef]
  40. Fu, B.J.; Ouyang, Z.Y.; Shi, P.; Fan, J.; Wang, X.D.; Zheng, H.; Zhao, W.W.; Wu, F. Current Condition and Protection Strategies of Qinghai-Tibet Plateau Ecological Security Barrier. Policy Manag. Res. 2021, 36, 1298–1306. [Google Scholar]
  41. Yu, H.B.; Zhang, Y.L.; Liu, L.S.; Chen, C.; Qi, W. Floristic characteristics and diversity patterns of seed plants endemic to. The Qinghai-Tibetan Plateau. Biodivers. Sci. 2018, 26, 130–137. [Google Scholar] [CrossRef] [Green Version]
  42. Musa, G.; Hall, C.M.; Higham, J.E.S. Tourism sustainability and health impacts in high altitude adventure, cultural and ecotourism destinations: A case study of Nepal’s Sagarmatha National Park. J. Sustain. Tour. 2004, 12, 306–331. [Google Scholar] [CrossRef]
  43. Rashid, W.; Shi, J.B.; Rahim, I.U.; Dong, S.K.; Sultan, H. Issues and opportunities associated with trophy hunting and tourism in Khunjerab National Park, Northern Pakistan. Animals 2020, 10, 597. [Google Scholar] [CrossRef] [Green Version]
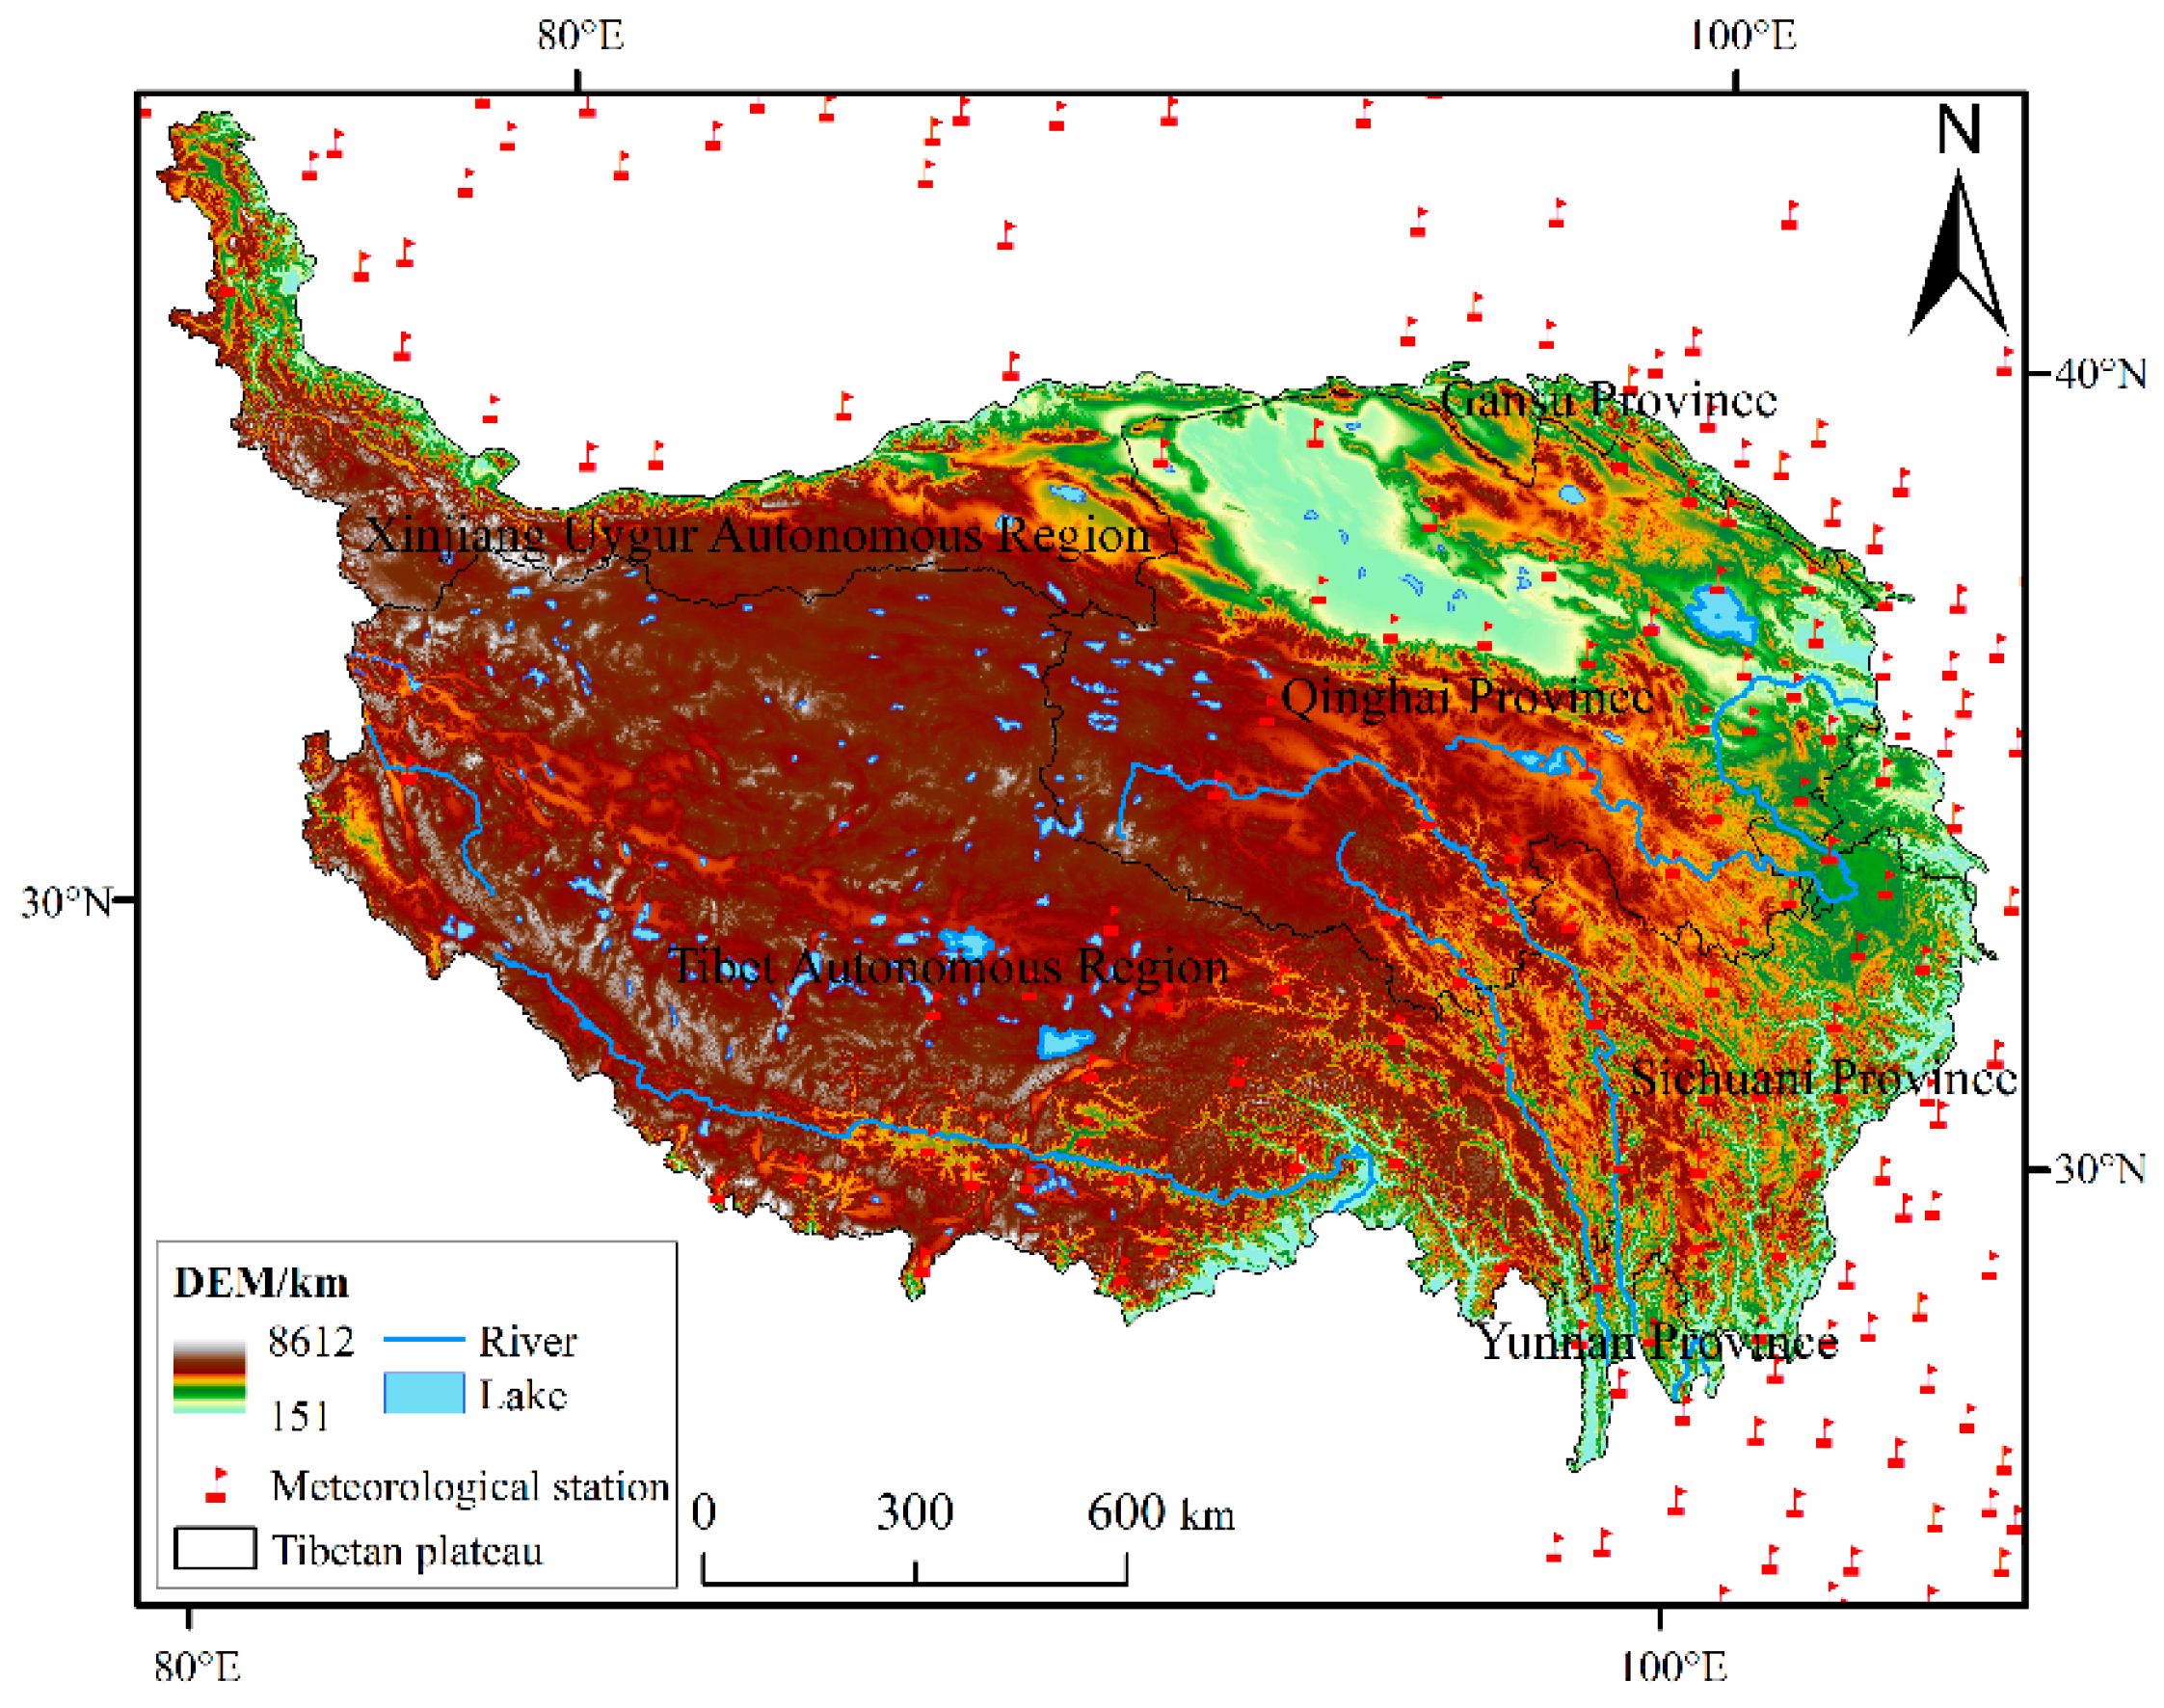
Figure 1. Study area and its terrain.
Forests 14 01352 g001
Figure 2. Spatial distribution and changes in vegetation types in the Tibetan Plateau. (a) 2000; (b) 2010; (c) 2020; (d) 2000–2020.
Forests 14 01352 g002
Figure 3. Carbon storage changes in the Tibetan Plateau during 2000–2020.
Forests 14 01352 g003
Figure 4. Spatial distribution of carbon storage in the Tibetan Plateau during 2000–2020. (a) 2000; (b) 2010; (c) 2020.
Forests 14 01352 g004
Figure 5. Spatial distribution of carbon storage changes in the Tibetan Plateau during 2000–2020.
Forests 14 01352 g005
Figure 6. Prediction of vegetation type distribution in the Tibetan Plateau under different scenario constraints in 2030 and 2060. (a) Inertia development scenario in 2030; (b) inertia development scenario in 2060; (c) farmland protection scenario in 2030; (d) farmland protection scenario in 2060; (e) ecological priority development scenario in 2030; (f) ecological priority development scenario in 2060.
Forests 14 01352 g006aForests 14 01352 g006b
Figure 7. Prediction of carbon storage distribution in the Tibetan Plateau under different scenario constraints in 2030 and 2060. (a) inertia development scenario in 2030; (b) inertia development scenario in 2060; (c) farmland protection scenario in 2030; (d) farmland protection scenario in 2060; (e) ecological priority development scenario in 2030; (f) ecological priority development scenario in 2060.
Forests 14 01352 g007aForests 14 01352 g007b
Figure 8. The change in carbon storage in the Tibetan Plateau during 2000–2060. Note: A was Inertia development scenario, B was farmland protection scenario, C was ecological priority development scenario.
Forests 14 01352 g008
Figure 9. Explanatory power of different single factors on carbon storage changes in the Tibetan Plateau during 2000–2020. X1 is slope, X2 is DEM, 3 is aspect, X4 is temperature, X5 is hours of sunshine, X6 is precipitation, X7 is FVC, X8 is distance to woodland, X9 is distance to river, X10 is distance to lake, X11 is distance to grassland, X12 is distance to farmland, X13 is distance to town, X14 is distance to road, X15 is GDP, X16 is POP.
Forests 14 01352 g009
Figure 10. Dominant interactive factors of carbon storage changes in 2000.
Forests 14 01352 g010
Figure 11. Dominant interactive factors of carbon storage changes in 2010.
Forests 14 01352 g011
Figure 12. Dominant interactive factors of carbon storage changes in 2020.
Forests 14 01352 g012
Table 1. Driving factor data of vegetation type/carbon storage changes.
Data TypeNumberData NameResolution (m)Data SourcesPretreatment Process
Vegetation type dataYVegetation type500United States Geological Survey (http://www.usgs.gov/ (accessed on 5 January 2023))Reclassify
Topographic FactorsX1Slope200Geospatial Data Cloud (https://www.gscloud.cn/ (accessed on 5 January 2023))Resample
X2Digital elevation model (DEM)200Resample
X3Aspect200Resample
Climatic factorsX4Temperature500The China Meteorological Data Service Center (http://www.nmic.cn/ (accessed on 5 January 2023))Kriging interpolation
X5Hours of sunshine500
X6Precipitation500
Other natural factorsX7Vegetation coverage (FVC)1000United States Geological Survey (http://www.usgs.gov/ (accessed on 5 January 2023))Band math, Resample
X8Distance to woodland500Resource and Environment Science and Data Center (https://www.resdc.cn/ (accessed on 4 January 2023))Euclidean distance
X9Distance to river500
X10Distance to lake500
X11Distance to grassland500
Socio-economic factorX12Distance to farmland500
X13Distance to town500National Catalogue Service for Geographic Information
(https://www.webmap.cn/ (accessed on 5 January 2023))
X14Distance to road500
X15The density of Gross Domestic Product (GDP)1000Resource and Environment Science and Data Center (https://www.resdc.cn/ (accessed on 3 January 2023))Resample
X16The density of population (POP)1000Resample
Table 2. Carbon density value of each vegetation type in the Tibetan Plateau (g/m2).
CodeNameC_AboveC_BelowC_Soil
1Montane coniferous forest72.82591.8934.21
2Hard-leaf shrub44.733793.8367.82
3Deciduous shrub70.56637.5586.45
4Mixed forest188.115023.27188.48
5Closed shrub170.675128.69239.52
6Desert shrub57.461732.45101.67
7Tufted dwarf grass17.38182.6533.18
8Steppe64.061323.2791.67
9Low-coverage grassland74.841915.1134.85
10Non-vegetation46.35100.1867.38
Table 3. Interaction mode between independent variable and dependent variable.
CriterionInteraction
q   ( C 1 C 2 ) < Min q C 1 ,   q C 2 Nonlinear weakening
Min q C 1 , q C 2 < q C 1 C 2 < M ax q C 1 , q C 2 Single-factor nonlinear weakening
q   ( C 1 C 2 ) > Max q C 1 ,   q C 2 Double-factor enhancement
q C 1 C 2 = q C 1 + q C 2 Independent
q C 1 C 2 > q C 1 + q C 2 Nonlinear enhancement
Table 4. Area changes and dynamics of vegetation types during 2000–2020.
Vegetation TypeArea/km2Area Change and Dynamic Degree during 2000–2020
200020102020Area/km2Dynamic Degree/%
Montane coniferous forest35,240.5035,240.5037,828.252587.757.34
Hard-leaf shrub2691.002616.502713.7522.750.85
Deciduous shrub8060.757083.256265.25−1795.50−22.27
Mixed forest45,564.2544,454.2545,230.00−334.25−0.73
Closed shrub97.50126.2598.250.750.77
Desert shrub15,074.7518,396.5024,604.009529.2563.21
Tufted dwarf grass59,419.2565,213.2561,984.252565.004.32
Steppe1,313,770.751,335,069.501,329,007.2515,236.501.16
Low-coverage grassland990,668.75961,804.25953,370.50−37,298.25−3.76
Non-vegetation71,033.0071,616.2580,519.009486.0013.35
Table 5. Vegetation type transfer matrix in the Tibetan Plateau during 2000–2020 (km2).
2020
12345678910
20001--5.50156.752535.257.00155.503651.75753.753.25163.50
231.75--1.25215.000.001.5026.751.500.002.50
3448.5047.00--1477.001.50196.251100.25379.000.000.25
44786.50123.75437.75--3.0099.753735.50852.502.5047.50
56.250.000.251.25--24.7525.5021.250.250.00
664.259.75127.7579.002.25--1531.004145.25924.75123.25
74066.00104.75570.754838.0026.002320.25--4325.5023.25163.25
8486.7512.25547.75594.0040.2512,579.508789.75--33,653.003180.25
912.750.000.250.000.251013.2512.2560,945.00--14,725.25
10117.250.0011.7515.000.00145.75130.003696.254803.75--
Note: 1–10 represent vegetation types; 1 is Montane coniferous forest, 2 is hard-leaf shrub, 3 is deciduous shrub, 4 is mixed forest, 5 is closed shrub, 6 is desert shrub, 7 is tufted dwarf grass, 8 is Steppe, 9 is low-coverage grassland, 10 is non-vegetation.
Table 6. Statistics of carbon storage changes in the Tibetan Plateau during 2000–2020.
Type of ChangeMeaning (Mg)Area (km2)Proportion (%)
Severe increase≥70,00010,102.50 0.40
Increase10,000~70,000101,360.25 3.99
Stable−10,000~10,0002,351,132.75 92.51
Decrease−10,000~−70,00069,252.25 2.72
Severe decrease≤−70,0009772.75 0.38
Table 7. Statistics of vegetation type area in the Tibetan Plateau under different scenario constraints in 2030 and 2060.
Vegetation TypeArea of Vegetation Types in 2030/km2Area of Vegetation Types in 2060/km2
Inertia Development ScenarioFarmland Protection ScenarioEcological Priority Development ScenarioInertia Development ScenarioFarmland Protection ScenarioEcological Priority Development Scenario
Montane coniferous forest39,952.2539,952.2537,861.0036,675.5036,746.0037,937.00
Hard-leaf shrub2536.752516.752658.752637.002642.252678.00
Deciduous shrub5798.755750.256138.005386.255412.256167.00
Mixed forest45,629.2545,629.2545,629.2545,266.2545,266.2545,266.25
Closed shrub91.2591.2591.2584.2585.0097.25
Desert shrub28,569.0028,569.0028,569.0032,966.5032,966.5025,583.75
Tufted dwarf grass61,262.2560,780.2562,502.5060,442.2560,343.2561,680.50
Steppe1,324,129.501,324,129.501,332,418.501,359,391.751,359,391.751,359,391.75
Low-coverage grassland945,921.00945,921.00945,921.00903,881.50903,878.00924,069.00
Non-vegetation87,730.5088,281.0079,831.2594,889.2594,889.2578,750.00
Disclaimer/Publisher’s Note: The statements, opinions and data contained in all publications are solely those of the individual author(s) and contributor(s) and not of MDPI and/or the editor(s). MDPI and/or the editor(s) disclaim responsibility for any injury to people or property resulting from any ideas, methods, instructions or products referred to in the content.