Article

Si Supply Could Alter N Uptake and Assimilation of Saplings—A 15N Tracer Study of Four Subtropical Species

1
College of Forestry, Jiangxi Agricultural University, Nanchang 330045, China
2
Fujian Academy of Forestry, Fuzhou 350002, China
3
School of Humanities and Public Administration, Jiangxi Agricultural University, Nanchang 330045, China
*
Author to whom correspondence should be addressed.
Forests 2023, 14(7), 1353; https://doi.org/10.3390/f14071353
Submission received: 19 May 2023 / Revised: 9 June 2023 / Accepted: 29 June 2023 / Published: 30 June 2023
(This article belongs to the Section Forest Ecophysiology and Biology)

Abstract

:
Si availability may be altered by bamboo expansion when other trees are replaced by bamboo due to the influence of plant communities on the quantity of phytoliths and Si accumulation. It has been shown that Si availability can modify nutrient-use efficiency (e.g., N and P) of some Si-accumulating plants. However, it is unclear how Si availability might alter N uptake and assimilation between Si-accumulating plants such as bamboo compared to other species, particularly for different chemical forms such as ammonium (NH4+) and nitrate (NO3). To explore the influences of Si availability on uptake and assimilation rates for different forms of inorganic N between bamboo and other trees, we selected one-year-old seedlings of bamboo (Phyllostachys pubescens) and three other native subtropical species, namely Phoebe bournei, Schima superba, and Cunninghamia lanceolata. We applied three levels of Si and 15N tracers in a pot experiment and then measured the concentrations of Si (total Si, soluble Si, and exchangeable Si), C, N (total N, NH4+-N, and NO3-N), and N uptake and assimilation rates for both roots and leaves. We found that there were higher inorganic N root uptake and assimilation rates for bamboo compared to other species, likely due to higher biomass accumulation and quicker turnover of fine roots. Moreover, Si supply did not change the uptake preference for N forms or overall uptake and assimilation rates in most species; however, a high concentration of the Si supply slightly increased NO3-N uptake and assimilation rates in fine roots and leaves of P. bournei, particularly immediately following the addition of Si. These results have implications for predicting the coexistence and competition between bamboo and other trees through the uptake and assimilation of different forms of inorganic N (i.e., high Si-accumulating plants compared to other plants), particularly when Si availability is altered in ecosystems.

1. Introduction

Plant communities can control both the quantity of phytoliths and Si accumulation in soils, which can alter the biogeochemical Si cycle in ecosystems [1,2,3]. For example, bamboo (Phyllostachys pubescens) expansion that replaces native trees with bamboo may accelerate the biogeochemical Si cycle due to the quick turnover of Si, including increasing Si uptake by bamboo and its higher production of phytoliths [4]. Indeed, the ability of plants to uptake and accumulate Si is beneficial and differs greatly among plant species due to variation in Si uptake by roots through active, passive, or exclusive processes [5,6]. Bamboo, as an Si-accumulator, has a higher preference for Si than other tree species and can actively take up dissolved silicic acid (Si(OH)4) from soil via specific Si transporters in fine roots.
It has been proposed that Si availability could modify the nutrient-use efficiency and C:N:P stoichiometry of some Si-accumulating plants, such as some grasses and crop plants [7,8,9]. Nitrogen (N) is the major nutrient element limiting the growth of plants and regulating photosynthesis [10,11], and it is available to plants in different chemical forms, such as ammonium (NH4+), nitrate (NO3), and dissolved organic N [12,13]. Several studies have focused on Si as a fertilizer that can improve plant growth and increase uptake of N and P [14,15,16]. However, the consequences of Si supply on different forms of nitrogen uptake so far have not been investigated, and these interactions between Si and nutrients have not been compared between Si accumulators such as bamboo and other native plants.
Generally, although plants can use small quantities of organic N, plants utilize inorganic N forms (such as NH4+ and NO3) as their primary N sources, and species vary greatly in their ability to absorb different N forms [12,13,17]. Nutrient use is an important mechanism underlying species coexistence and competition and could influence the coexistence of bamboo and other trees during bamboo expansion. It has been reported that bamboo expansion reduces the available soil N pool, slows N cycling, and alters soil N mineralization, including enhancing ammonification rates while reducing nitrification rates [18,19]. Although a considerable number of studies indicate that bamboo expansion could alter N content and inorganic N forms in forest soils, the consequences of altered soil N availability for forest plants are poorly understood because bamboo and other tree species have different mechanisms for utilizing inorganic N forms [17,20]. There is no consensus on the uptake and preference of different N forms in bamboo and other tree species, which hinders our ability to predict the performance of bamboo and other trees in capturing inorganic N, particularly where the available Si pool has been altered during bamboo expansion.
Si application has the potential to alter N assimilation rates in some Si-accumulating plants, such as rice and wheat [8,21,22]. This also means that plant uptake and utilization of different forms of inorganic N could be affected by altered available Si pools following bamboo expansion. Moreover, plant utilization of inorganic N under altered available Si in soils may differ between bamboo and other trees due to their active, passive, or exclusive mechanisms with respect to Si uptake [5,6,23]. To explore the influences of Si availability on plant uptake and utilization of different forms of inorganic N between bamboo and other trees, we selected one-year saplings of Phyllostachys pubescens, Phoebe bournei, Schima superba, and Cunninghamia lanceolata and conducted a pot experiment using three different levels of Si supply and 15N labeling (15NH4+ vs. 15NO3). Our goals were as follows: (1) to compare the N-uptake strategies of bamboo to other trees and (2) to explore whether the N-uptake strategies used by different species were affected by Si application. Our work contributes to a better understanding of the responses of a range of physiologically different and commercially and ecologically important plant species to Si supply, which helps us predict the uptake and utilization of different forms of inorganic N between bamboo and other trees due to altered Si availability following bamboo expansion.

2. Materials and Methods

2.1. Plant Material, Growth Conditions, and Experimental Design

We conducted a pot experiment from March to November 2019 at the Fujian Academy of Forestry Sciences, Fuzhou, Fujian, China (26.15° N 119.29° E). We selected four species, namely P. pubescens, P. bournei, S. superba, and C. lanceolata (heights and diameters were 40–50 cm and 4–6 mm, respectively), which are the dominant species associated with bamboo expansion in subtropical forests in this region. In January 2019, we planted one-year saplings into plastic pots (D: 20 cm, H: 35 cm), which were filled 3.5 kg sieved and homogeneous soil. We frequently relocated the position of each potted plant to prevent rooting underground and prevent variation due to differences in the ambient environment, such as light and humidity.
All saplings were grown under natural environmental conditions with the same temperature and light exposure, and we measured growth traits monthly, including height and diameter. Then, all saplings were treated with three levels of Si supply: 0 (control), 7 g/m2, and 14 g/m2 (equal to 0, 0.2, and 0.4 g per pot) (Figure 1). A solution of Na2SiO3·9H2O (analytical reagent) neutralized with diluted H2SO4 was used as a silicon source [24,25]. The 15N labeling was conducted before the first sampling. The 15N labeling solutions were made of 15NH4NO3 (99.12 atom%) or NH415NO3 (99.21 atom%). For each species, half of the individual saplings received a solution of 15NH4NO3 (n = 48), and the other half received a solution of NH415NO3 so that each species received the same molar concentration of NH4+-N and NO3-N. In detail, for each sapling, 1.09 g of 15NH4NO3 or NH415NO3 was dissolved in 20 L of water (0.675 mM) as stock solution, and then, 250 mL was sprayed evenly in each plastic pot (equal to 2 mm precipitation, 50 mg 15N m−2). We sampled saplings before the 15N tracer application, and then, we collected all biomass from saplings (n = 4) 1, 15, 75, and 100 days after the 15N tracer application. All sampled saplings under varying intensities of Si supply and 15N tracer application were completely randomized for a total of 96 saplings per species.

2.2. Plant Samplings and Biomass

At the end of the experiment, all saplings were collected, washed, and separated into leaves, stems, and roots; fully dried (65 °C) for 3 days; then weighed to calculate biomass. All plant samples were ball-milled in preparation for chemical analyses. To determine soil chemical properties, we mixed soil in each plastic pot (about 300–400 g wet weight per sample). Then, soil samples were pooled, air-dried, and ground through a 2 mm sieve. There were in total 384 soil samples.

2.3. Chemical Analyses

All plant and soil samples (i.e., leaves, stems, roots, and soil) were analyzed for 15N, total N, and total carbon (C) by elemental analyzer–isotope ratio mass spectrometry (Vario EL, Elementar Analysensysteme GmbH, Langenselbold, Germany) with acetanilide as an external standard. Four compounds were used as references: L-histidine, D-glutamic acid, glycine, and acetanilide. The analytical precisions for δ15N and δ13C were both 0.2‰. All C/N measurements were run in duplicate, and the average deviations of replicate analyses from the means were 1.1% for N and 0.2% for C concentrations, so our data are presented as the average of both analytical replicates. In addition, 10 g soil samples were extracted with 2 M potassium chloride (KCl) solution in a soil:solution ratio of 1:5 (the KCl was pre-combusted at 450 °C for 48 h). The mixture was shaken on a shaker table for 1 h, then the extracts were filtered, and nitrate and ammonium were determined colorimetric [26,27] using a continuous chemical analyzer (SmartChem200, Rome, Italy).
Total Si (SiTOT) was extracted from soil (0.1 g) and plant tissues (0.25 g) using sodium hydroxide at 650 °C in a muffle furnace and a hydrochloric acid (1:1) dissolution method [25,26,28]. To extract soluble and exchangeable Si (SiSOL/Acid Na-acetate-Si) from soil, we added 30 mL of 1 M acid Na–acetate buffer solution at pH 4.0 to 0.75 g soil in a 50 mL centrifuge tube, agitated the sample for 24 h, and centrifuged the sample, representing the most easily absorbed form of Si utilized by plants [29,30]. Both digested samples (including extractions for SiTOT (soil and plant) and SiSOL (soil)) were then analyzed using spectroscopy with the silicon molybdenum blue colorimetric method and a molybdate–ascorbic acid procedure at a pH of 1.2~1.3 using an ultraviolet–visible spectrophotometer (680 nm, UV-5100) [31,32] calibrated with a standard solution (5 mg L−1 SiO42−).
To extract P in plant samples, 150 mg of dried plant powder from each sample was digested using H2SO4 and H2O2 at 350 °C for half an hour using a microwave digestion system (JKXZ06-8B, Nanchang, China), followed up with a deionized water wash (up to 100 mL final volume). Before analysis, all digested samples were then determined using the molybdenum antimony spectroscopic method and a molybdate–ascorbic acid procedure using an ultraviolet–visible spectrophotometer (880 nm, UV-5100, Shanghai, China) calibrated with a standard solution (2.5 mg L−1 KH2PO4) [26]. All measurements were run in duplicate and taken as the average because variation among replicates was less than 5%.

2.4. Calculations

N isotope ratios of all samples are presented using δ notation [33]:
δ N 15 = ( R s a m p l e R s t a n d a r d 1 ) × 100
where Rsample and Rstandard are the ratios between 15N and 14N of the sample and the standard, respectively. The atmospheric N2 is used as a standard with Rstandard = 0.003665.
15N enrichment was used to express the isotope enrichment in a sample from a labeled sapling (δ15Nsample) vs. a reference sample from a non-labeled sapling (δ15Nref) [34]:
N 15 e n r i c h m e n t = δ N 15 s a m p l e δ N 15 r e f δ N 15 r e f + 1000 × 1000
The 15N atom % excess (APE) was calculated as the 15N percentage difference between the labeled samples and the control. Uptake and assimilation of 15N by plants (ug 15N d−1) was calculated by biomass (g), APE, N content (%), and labeled time [35]. The calculations were as follows:
APE (%) = At% labeled − At% control
15Nuptake or assimilation rate = biomass × Ncontent × APE/labeled time
where biomass was the mass of root (uptake) or leaf (assimilation) biomass (g), Ncontent was plant N content (%), At%labeled refers to the atom% 15N from the 15N-labeled plant, and At%control refers to the atom% 15N from the same plant in the control treatment.

2.5. Statistical Analysis

Differences among three levels of Si concentrations were determined for each response variable, including the concentrations of Si, C, total N, NH4+-N, NO3-N, soluble Si, and 15N enrichment, and were determined using analysis of variance (ANOVA) and a protected least significant difference (LSD) test (Duncan 1955). We also compared differences in the concentrations of Si, C, total N, NH4+-N, NO3N, SiSol, and 15N enrichment among Si supply treatment and species. For all tests, the criterion for significant differences was p < 0.05. All statistical analyses were performed using SPSS (IBM, SPSS 24.0., Chicago, IL, USA), and graphs were created using Graphpad Prism 9.

3. Results

3.1. Plant and Soil Properties

We found that the root biomass of bamboo was 2–3 times higher than that of other plant species, whereas no significant difference was found in leaf and stem biomass among species (Table S1). Si concentrations for all tissue types in bamboo were 8–16 times higher than other plants (total: F(3, 236) = 75.465, p < 0.001; leaves: F(3, 75) = 170.39, p < 0.001; stems: F(3, 99) = 398.509, p < 0.001; roots: F(3, 75) = 41.009, p < 0.001), while the C concentrations of bamboo were lower than other plants, particularly in leaves and roots (F(3, 314) = 118.619, p < 0.001 and F(3, 324) = 71.603, p < 0.001, respectively).
When comparing Si supply treatments, bamboo showed significantly higher Si concentrations for the high-Si-supply treatments (leaves: F(2, 9) = 2.78, p = 0.015; stems: F(2, 9) = 4.3, p = 0.049; roots: F(2, 9) = 8.31, p = 0.046), while P. bournei showed higher Si concentrations in leaves and roots for both medium- and high-Si-supply treatments (F(2, 19) = 1.836, p = 0.018 and F(2, 19) = 3.943, p = 0.037, respectively). In contrast, C. lanceolata showed higher Si concentrations in stems and roots for the control (Si + 0) treatment (Table 1; F(2, 21) = 8.692, p = 0.002 and F(2, 21) = 12.748, p < 0.0001, respectively).
Moreover, the concentrations of C in bamboo tissues were lower under high-Si-supply treatments than controls (leaves: F(2, 44) = 1.144, p = 0.032; stems: F(2, 44) = 1.972, p = 0.015; roots: F(2, 44) = 2.75, p = 0.034). We found that there were lower concentrations of N in leaves of P. bournei under Si supply treatments than controls (F(2, 90) = 1.927, p = 0.047). Bamboo did not show differences in N or P among Si treatments for any tissue type (Table 1). For both P. bournei and S. superba, there were significantly higher N concentrations in control leaves, and for P. bournei, there were significantly lower N concentrations for high-Si-supply root tissues (Table 1). There were no significant differences in P concentrations for any saplings among the three Si treatments (Table 1). In addition, there were no significant differences in the concentrations of N (total N, NH4+-N, and NO3-N), SiTOT, or SiSOL in soils among the three levels of Si supply (Table S2).

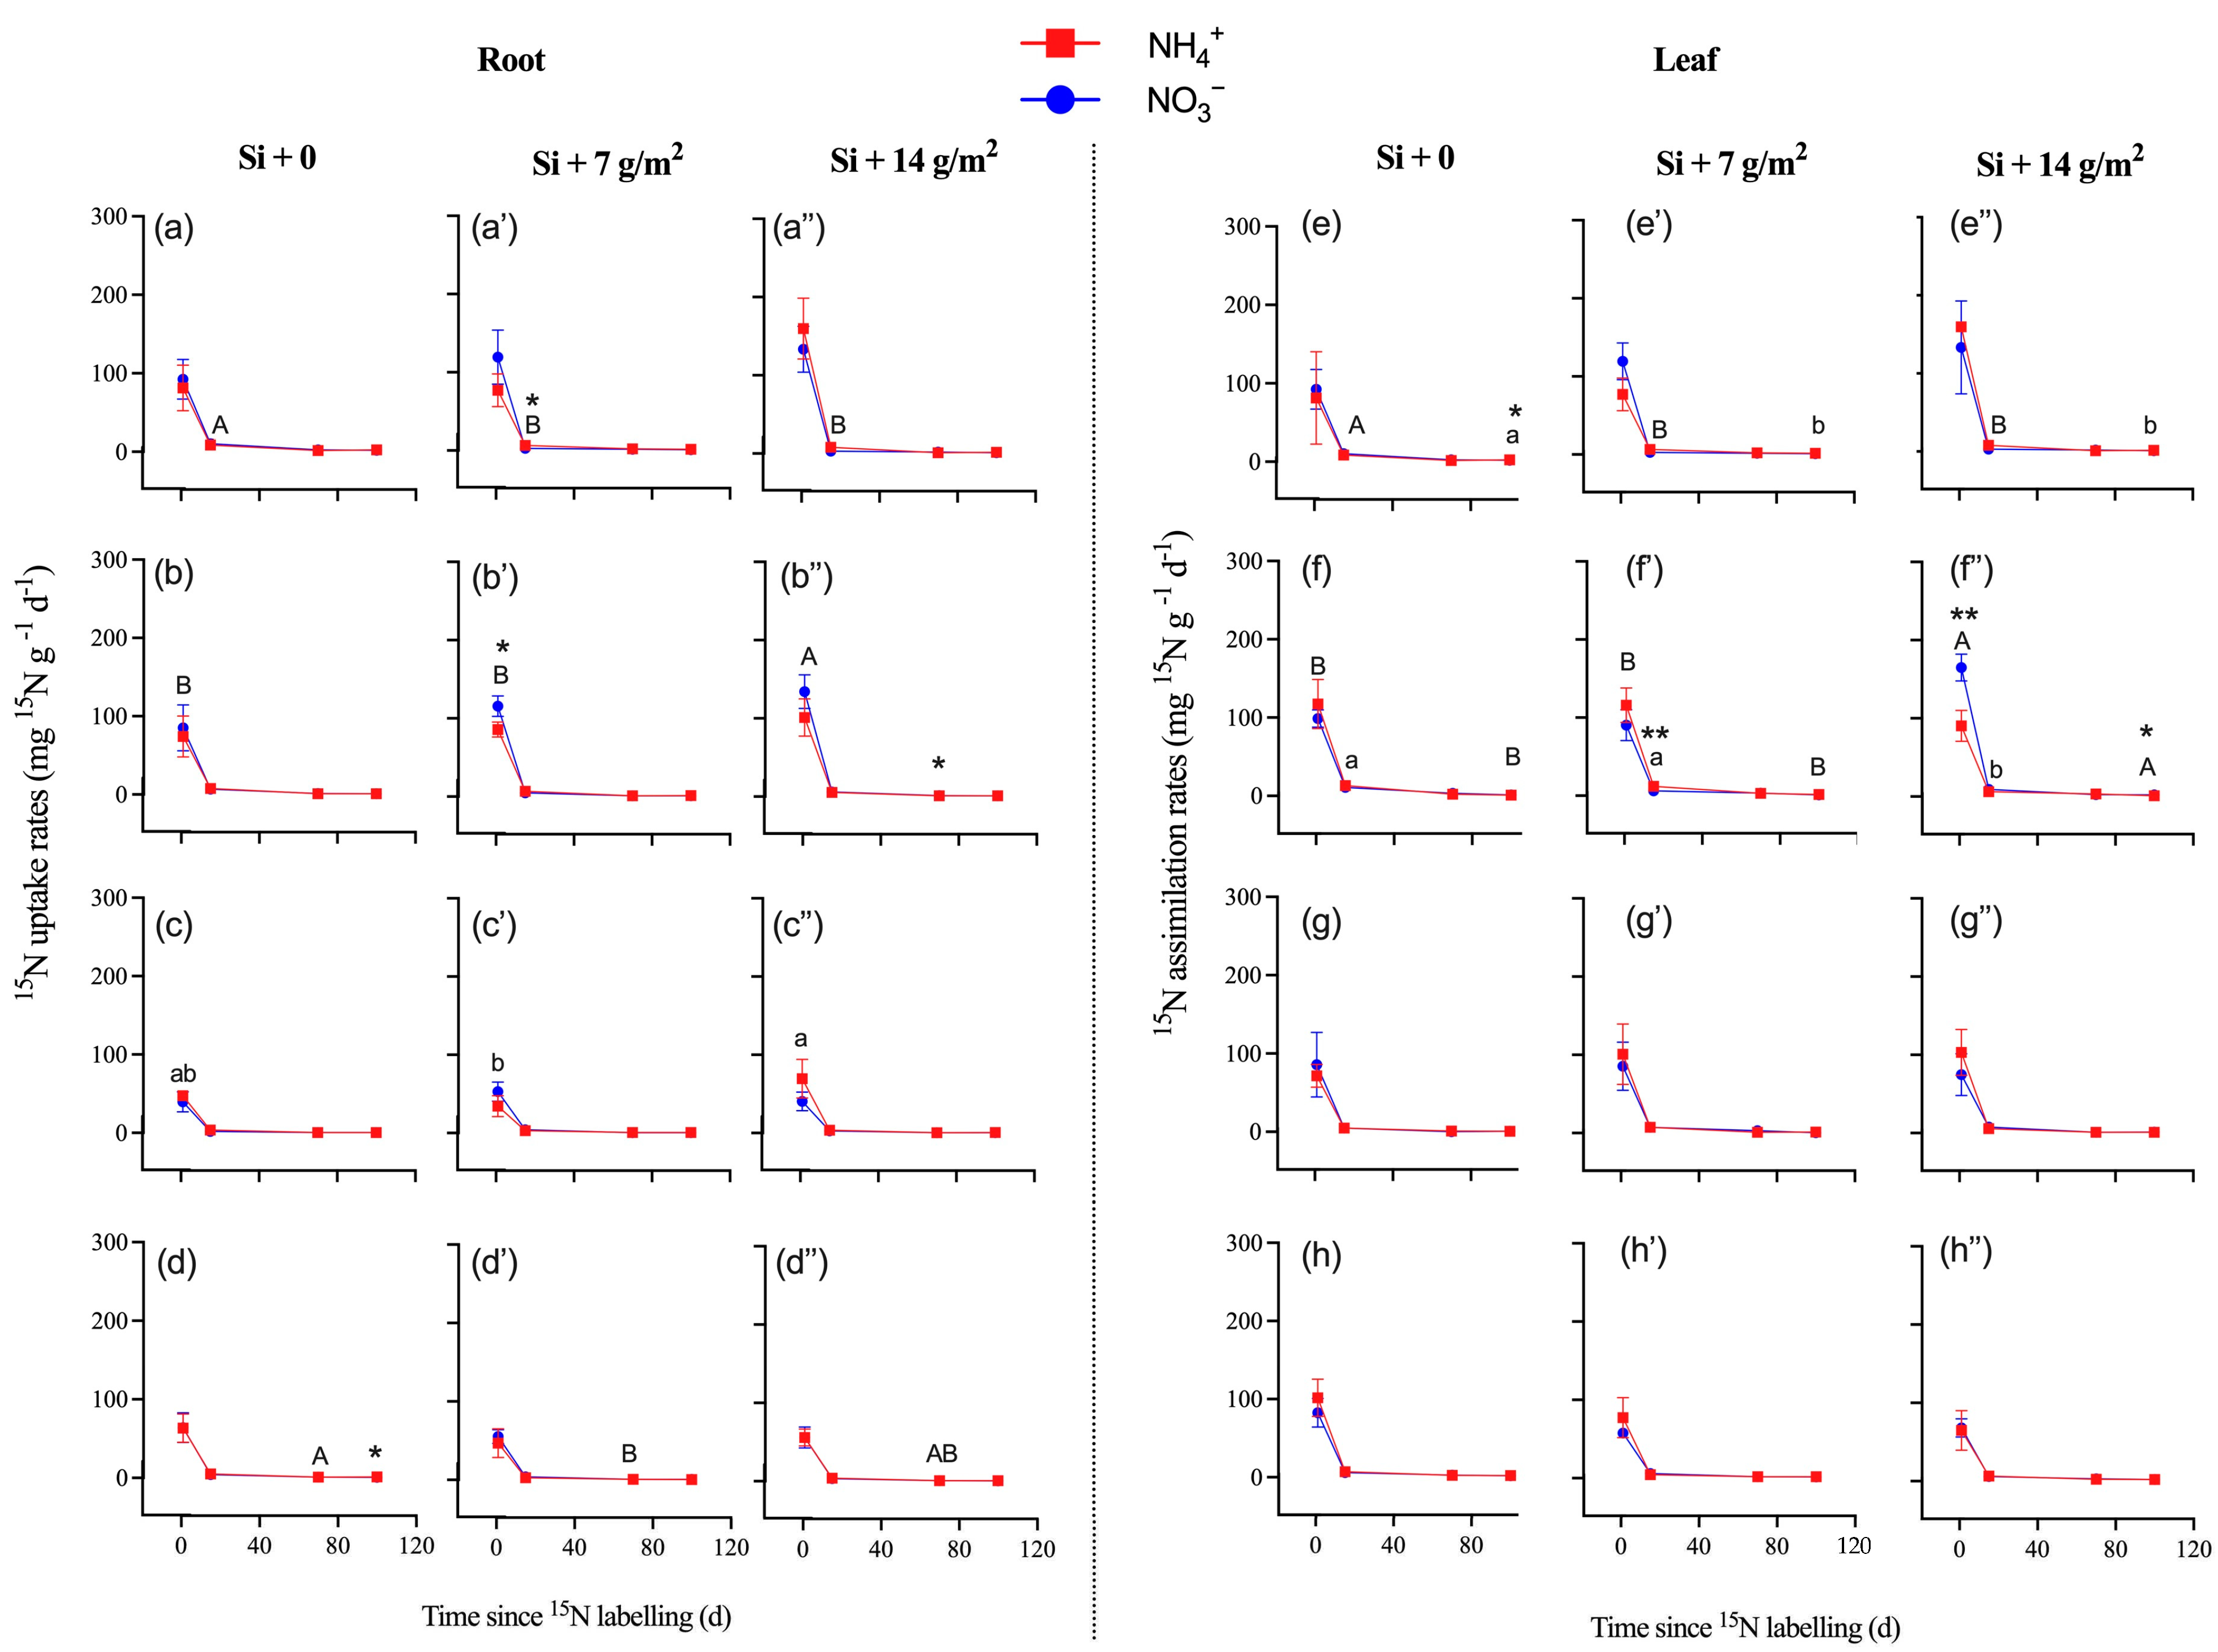
3.2. 15N Enrichment, Uptake, and Assimilation of Saplings

After NH4+-15N labeling, the 15N enrichment in all tissues increased rapidly and substantially and peaked to 498‰ at day 15 and was then maintained at that level or decreased (P. pubescens), which was different from NO3-15N labeling in roots, which peaked to 246‰ at day 1 and then remained decreased (Figure 2a–a”,e–e”,i–i”). The 15N enrichment in tissues of P. bournei with 15NO3 labeling was significantly higher than that with 15NH4+ labeling, particularly under high concentrations of Si supply (Figure 2b–b”, f–f”, j–j”). Moreover, high concentrations of Si supply (Si + 14 g/m2) significantly increased 15N enrichment in tissues of P. bournei with 15NO3 labeling (Figure 2b–b”, f–f”, j–j”; p < 0.05).
There were higher uptake and assimilation rates in the roots and stems of P. pubescens compared to other tree saplings (Table 2, Figure 3; p < 0.05). During the entire experimental period, the 15N uptake and assimilation rates of fine roots and leaves ranged from 0.5 to 100.4 mg 15N g−1 d−1 for 15NH4+ and 0.5 to 114.2 mg 15N g−1 d−1 for 15NO3 (Table S3). For bamboo and other tree saplings, there was no significant difference in 15N uptake or assimilation rates between label types of 15NH4+ and 15NO3 (Table 2; p > 0.05), which indicated that Si supply did not alter the preference of saplings for NH4+ or NO3 (Table S3). Overall, there was no significant difference in 15N uptake or assimilation rates of fine roots and leaves among the three levels of Si supply, except for in P. bournei (Figure 3). Specifically, a high concentration of Si supply increased the NO3-15N uptake and assimilation rates of roots and leaves (i.e., P. bournei and S. superba at day 1) but decreased the NO3-15N uptake and assimilation rates of roots and leaves in P. pubescens at day 15 and the NH4+-15N uptake rates of C. lanceolata roots at day 1.

4. Discussion

4.1. Effects of Si Supply on Plant Properties

We found that the Si concentrations of all tissues in bamboo were 8–16 times higher than other plants, while the C concentrations of bamboo were lower than that of other plants. Si could be acting as a substitute for C compounds in bamboo, providing some protection against chewing and sucking insects since Si incorporation into plant tissues requires lower energy costs relative to organic compounds [7,8]. In addition, there were higher concentrations of Si in bamboo tissues under high Si supply than control treatments. Here, we suspect that the varying concentrations of Si among four species could be mostly attributed to passive absorption of Si through differences in transpiration. Plants can actively take up silicic acid (Si(OH)4) via specific transporters mediating the xylem loading of Si and passively through transpiration [2,8], particularly in Si-accumulating plants such as bamboo. These mechanisms likely confer more competitive advantages to bamboo due to increased Si defense compared to other trees during bamboo expansion.
In this study, there was no significant difference in the concentration of SiSOL or SiTOT in soils among the three levels of Si supply. This is in part due to the fact that silicic acid was readily and quickly taken up by the roots of plants actively via specific transporters or passively through transpiration [2]. Second, amorphous Si is unstable and easily transformed to silicic acid and keeps a dynamic balance with other forms of Si in soil [36], contributing to relatively unchanged concentrations of SiSOL. The concentration of SiTOT was minimally changed by Si supply in this study because total Si was an abundant element in the soil, mostly determined by crystalline Si and influenced by parent material and rock weathering [4,37].
In addition, there were lower concentrations of C and N in tissues of P. pubescens and P. bournei under high Si supply compared to control treatments, indicating that C concentrations in aboveground tissues may decline with increasing Si supply, a pattern seen for other species such as rice, wheat, and sugarcane [7,38]. Indeed, the observed decline in C concentrations with increased Si supply might be due to a partial substitution of organic C with Si in aboveground tissues of P. pubescens [8,39,40]. This would be advantageous for the plant because Si deposits, including phytoliths, are energetically cheaper to form and can confer similar defenses to alleviate biotic or abiotic stress in plants [41,42,43]. However, high concentrations of Si could limit N absorption for P. bournei but likely not the other native plant species examined in this study. Previous studies found that N concentrations in wheat did not vary despite increased nutrient-use efficiency and N:P ratios under elevated Si supply [7,44].

4.2. Effects of Si Supply on Plants’ N Uptake and Assimilation

Plants utilize different inorganic N forms (such as NH4+ and NO3) as their primary N sources, and species vary greatly in their ability to absorb different N forms. Indeed, the presence of abundant fine roots provides more favorable conditions for bamboo to capture inorganic N rapidly and effectively from the soil compared to other trees, which supports its high growth and propagation [19,45]. In addition, both growth and turnover rates of bamboo’s fine roots have been shown to be faster than those of other trees, contributing to greater access to nutrients [46]. Overall, our results suggested that the N uptake and assimilation rates of bamboo roots and leaves were significantly higher than those of other species; however, there were no clear preferences for NH4+ or NO3 among the four species (Table 2, Figure 3). Previous evidence suggests that plant species can differ in their preferences for NH4+ and NO3, and preferences can differ during different growth stages of plants [35]. Furthermore, studies also suggest that the preference for N form is strongly affected by the dominant form of N in soils [47,48].
If plants are able to utilize different forms of N, it could improve the coexistence of species and alleviate competition during bamboo expansion [17]. Some studies have proposed that bamboo expansion enhances ammonification rates but reduces nitrification rates [19,49,50]. Here, at least among three levels of Si supply, we did not demonstrate a preference of saplings for either NH4+ or NO3, and there was no significant difference in N uptake or assimilation rates by fine roots or leaves. One pattern we found was that under high concentrations of Si supply, we saw slightly higher NO3-N uptake and assimilation rates for roots and leaves early in the experiment. Other studies have shown 3–80 times higher Si storage in bamboo litter than in other litter types [51,52] and that Si can be released through litter decomposition and phytolith dissolution. Previous studies have found that more phytoliths were released and deposited in the soil during bamboo expansion through litter fall and root decomposition, which transferred more primary soluble Si and increased Si availability in soils [4,32]. Bamboo could be more competitive than other species following bamboo expansion due to its higher N uptake and assimilation rates by fine roots and leaves. However, other species’ (i.e., P. bournei) uptake rates were negatively affected by high Si availability in soil, so it can be inferred that P. bournei would not be competitive and would be eliminated earlier than the other tree species due to the increased soil ammonification and reduced soil nitrification accompanying bamboo expansion, coupled with NH4+-dominated N deposition in the region [53].

5. Conclusions

Si is indispensable for Si-accumulating bamboo, in which C concentrations of plant tissues decline with Si supply due to a partial substitution of organic C compounds by Si. In this study, there were higher N uptake and assimilation rates of bamboo compared to other species due to higher biomass and quicker turnover of fine roots. Although Si supply did not change the uptake preference for N forms, high concentrations of Si supply could increase NO3-N uptake and assimilation rates by fine roots and leaves in P. bournei. We infer that bamboo could be more competitive than other species due to its higher N uptake and assimilation rates, and P. bournei would not be competitive and would be eliminated earlier than other tree species. Mechanisms for these changes could include more phytoliths being released and deposited and reduced soil nitrification accompanying bamboo expansion, coupled with NH4+-dominated N deposition. These results suggest mechanisms for competition between bamboo and other trees due to altered Si availability in ecosystems during bamboo expansion and predict species’ coexistence and elimination.

Supplementary Materials

The following are available online at https://www.mdpi.com/article/10.3390/f14071353/s1, Table S1: The biomass (g) of Phyllostachys pubescens, Phoebe bournei, Schima superba, and Cunninghamia lanceolata among three levels of Si supply (n = 8); Table S2: The concentration of Si, C, N (total N, N-NH4+, and N-NO3-), soluble Si, and 15N enrichment of soil under varying silicon supplies (n = 16); Table S3: The rate of root uptake and leaf assimilation among Phyllostachys pubescens, Phoebe bournei, Schima superba, Cunninghamia lanceolata (n = 4).

Author Contributions

Data curation, D.H.; formal analysis, X.L., X.T., M.D. and Q.S.; funding acquisition, J.L.; resources, X.T. and Q.Y.; supervision, Q.Y. and D.H.; visualization, H.R.; writing—original draft, X.L.; writing—review and editing, J.L. All authors have read and agreed to the published version of the manuscript.

Funding

This research was supported by the National Natural Science Foundation of China (42067050, 41807028, 32060319) and JIANGXI “DOUBLE THOUSAND PLAN” (jxsq2020101079).

Institutional Review Board Statement

Not applicable.

Informed Consent Statement

Not applicable.

Data Availability Statement

All data generated or analyzed during this study are included in this published article.

Acknowledgments

We would like to thank the Fujian Academy of Forestry Sciences for experimental location support. Peer review by three anonymous reviewers significantly improved this manuscript. English language edits provided by Carri J. LeRoy at The Evergreen State College.

Conflicts of Interest

The authors declare no conflict of interest.

References

  1. Deshmukh, R.; Sonah, H.; Belanger, R.R. New evidence defining the evolutionary path of aquaporins regulating silicon uptake in land plants. J. Exp. Bot. 2020, 71, 6775–6788. [Google Scholar] [CrossRef] [PubMed]
  2. Mandlik, R.; Thakral, V.; Raturi, G.; Shinde, S.; Nikolić, M.; Tripathi, D.K.; Sonah, H.; Deshmukh, R. Significance of silicon uptake, transport, and deposition in plants. J. Exp. Bot. 2020, 71, 6703–6718. [Google Scholar] [CrossRef] [PubMed]
  3. Yang, X.; Song, Z.; Liu, H.; Van Zwieten, L.; Song, A.; Li, Z.; Hao, Q.; Zhang, X.; Wang, H. Phytolith accumulation in broadleaf and conifer forests of northern China: Implications for phytolith carbon sequestration. Geoderma 2018, 312, 36–44. [Google Scholar] [CrossRef]
  4. Liu, X.; Fang, P.; Xiong, Y.; Peng, Q.; Yu, Z.; Luan, F.; Song, Q.; Fang, X.; Yang, Q.; Liu, J. Assessment of the influence of bamboo expansion on Si pools and fluxes in a disturbed subtropical evergreen broadleaved forest. Catena 2022, 213, 106136. [Google Scholar] [CrossRef]
  5. Cornelis, J.-T.; Delvaux, B.; Titeux, H. Contrasting silicon uptakes by coniferous trees: A hydroponic experiment on young seedlings. Plant Soil 2010, 336, 99–106. [Google Scholar] [CrossRef]
  6. Ma, J.F.; Yamaji, N. Silicon uptake and accumulation in higher plants. Trends Plant Sci. 2006, 11, 392–397. [Google Scholar] [CrossRef]
  7. Neu, S.; Schaller, J.; Dudel, E.G. Silicon availability modifies nutrient use efficiency and content, C:N:P stoichiometry, and productivity of winter wheat (Triticum aestivum L.). Sci. Rep. 2017, 7, 40829. [Google Scholar] [CrossRef] [Green Version]
  8. Schaller, J.; Brackhage, C.; Gessner, M.O.; Bäuker, E.; Dudel, E.G. Silicon supply modifies C:N:P stoichiometry and growth of Phragmites australis. Plant Biol. 2012, 14, 392–396. [Google Scholar] [CrossRef]
  9. Teixeira, G.C.M.; Prado, R.D.M.; Rocha, A.M.S.; Piccolo, M.D.C. Root- and foliar-applied silicon modifies C:N:P ratio and increases the nutritional efficiency of pre-sprouted sugarcane seedlings under water deficit. PLoS ONE 2020, 15, e0240847. [Google Scholar] [CrossRef]
  10. Guo, J.; Jia, Y.; Chen, H.; Zhang, L.; Yang, J.; Hu, X.; Ye, X.; Li, Y.; Zhou, Y. Growth, photosynthesis, and nutrient uptake in wheat are affected by differences in nitrogen levels and forms and potassium supply. Sci. Rep. 2019, 9, 1248. [Google Scholar] [CrossRef] [Green Version]
  11. Hermans, C.; Hammond, J.P.; White, P.J.; Verbruggen, N. How do plants respond to nutrient shortage by biomass allocation? Trends Plant Sci. 2006, 11, 610–617. [Google Scholar] [CrossRef]
  12. Burger, M.; Jackson, L.E. Microbial immobilization of ammonium and nitrate in relation to ammonification and nitrification rates in organic and conventional cropping systems. Soil Biol. Biochem. 2003, 35, 29–36. [Google Scholar] [CrossRef]
  13. Javaid, A. Arbuscular Mycorrhizal Mediated Nutrition in Plants. J. Plant Nutr. 2009, 32, 1595–1618. [Google Scholar] [CrossRef]
  14. Greger, M.; Landberg, T.; Vaculík, M. Silicon Influences Soil Availability and Accumulation of Mineral Nutrients in Various Plant Species. Plants 2018, 7, 41. [Google Scholar] [CrossRef] [Green Version]
  15. Li, Z.-C.; Song, Z.-L.; Yang, X.-M.; Song, A.-L.; Yu, C.-X.; Wang, T.; Xia, S.; Liang, Y.-C. Impacts of silicon on biogeochemical cycles of carbon and nutrients in croplands. J. Integr. Agric. 2018, 17, 2182–2195. [Google Scholar] [CrossRef]
  16. Liu, H.; Shen, X.; Guo, Z. Effects of silicon addition on seed germination and seedling growth of alfalfa. Acta Prataculturae Sin. 2012, 20, 155–160. [Google Scholar]
  17. Song, Q.-N.; Ouyang, M.; Yang, Q.-P.; Lu, H.; Yang, G.-Y.; Chen, F.-S.; Shi, J.-M. Degradation of litter quality and decline of soil nitrogen mineralization after moso bamboo (Phyllostachys pubscens) expansion to neighboring broadleaved forest in subtropical China. Plant Soil 2016, 404, 113–124. [Google Scholar] [CrossRef]
  18. Li, Z.; Zhang, L.; Deng, B.; Liu, Y.; Kong, F.; Huang, G.; Zou, Q.; Liu, Q.; Guo, X.; Fu, Y.; et al. Effects of moso bamboo (Phyllostachys edulis) invasions on soil nitrogen cycles depend on invasion stage and warming. Environ. Sci. Pollut. Res. 2017, 24, 24989–24999. [Google Scholar] [CrossRef] [PubMed]
  19. Song, Q.-N.; Lu, H.; Liu, J.; Yang, J.; Yang, G.-Y.; Yang, Q.-P. Accessing the impacts of bamboo expansion on NPP and N cycling in evergreen broadleaved forest in subtropical China. Sci. Rep. 2017, 7, 40383. [Google Scholar] [CrossRef] [PubMed] [Green Version]
  20. Chen, H.; Huang, X.; Shi, W.; Kronzucker, H.J.; Hou, L.; Yang, H.; Song, Q.; Liu, J.; Shi, J.; Yang, Q.; et al. Coordination of nitrogen uptake and assimilation favours the growth and competitiveness of moso bamboo over native tree species in high-NH4+ environments. J. Plant Physiol. 2021, 266, 153508. [Google Scholar] [CrossRef]
  21. de Carvalho, J.S.; Frazão, J.J.; Prado, R.D.M.; Júnior, J.P.D.S.; Costa, M.G. Silicon modifies C:N:P stoichiometry and improves the physiological efficiency and dry matter mass production of sorghum grown under nutritional sufficiency. Sci. Rep. 2022, 12, 16082. [Google Scholar] [CrossRef] [PubMed]
  22. Wu, X.; Yu, Y.; Baerson, S.R.; Song, Y.; Liang, G.; Ding, C.; Niu, J.; Pan, Z.; Zeng, R. Interactions between nitrogen and silicon in rice and their effects on resistance toward the brown planthopper Nilaparvata lugens. Front. Plant Sci. 2017, 8, 28–39. [Google Scholar] [CrossRef] [Green Version]
  23. Ma, J.F.; Yamaji, N. A cooperative system of silicon transport in plants. Trends Plant Sci. 2015, 20, 435–442. [Google Scholar] [CrossRef] [PubMed]
  24. Coskun, D.; Deshmukh, R.; Sonah, H.; Menzies, J.G.; Reynolds, O.; Ma, J.F.; Kronzucker, H.J.; Bélanger, R.R. The controversies of silicon’s role in plant biology. New Phytol. 2019, 221, 67–85. [Google Scholar] [CrossRef] [PubMed] [Green Version]
  25. Pavlovic, J.; Samardzic, J.; Maksimović, V.; Timotijevic, G.; Stevic, N.; Laursen, K.H.; Hansen, T.H.; Husted, S.; Schjoerring, J.K.; Liang, Y.; et al. Silicon alleviates iron deficiency in cucumber by promoting mobilization of iron in the root apoplast. New Phytol. 2013, 198, 1096–1107. [Google Scholar] [CrossRef]
  26. Lu, R. Methods of Soil and Agrochemical Analysis; China Agricultural Science and Technology Press: Beijing, China, 2000. (In Chinese) [Google Scholar]
  27. Zhou, X.; Wang, A.; Hobbie, E.A.; Zhu, F.; Qu, Y.; Dai, L.; Li, D.; Liu, X.; Zhu, W.; Keisuke, K. Mature conifers assimilate nitrate as efficiently as ammonium from soils in four forest plantations. New Phytol. 2021, 229, 3184–3194. [Google Scholar] [CrossRef]
  28. Reza Ramdan, R.; Takuji, M.; Tatsuya, A.; Arata, Y.; Shuoye, C.; Junji, S.; Yuki, T.; Toshiaki, U.; Masaru, K. Limiting silicon supply alters lignin content and structures of sorghum seedling cell walls. Plant Sci. 2022, 321, 111325. [Google Scholar]
  29. Klotzbücher, T.; Marxen, A.; Jahn, R.; Vetterlein, D. Silicon cycle in rice paddy fields: Insights provided by relations between silicon forms in topsoils and plant silicon uptake. Nutr. Cycl. Agroecosystems 2016, 105, 157–168. [Google Scholar] [CrossRef]
  30. Sauer, D.; Saccone, L.; Conley, D.J.; Herrmann, L.; Sommer, M. Review of methodologies for extracting plant-available and amorphous Si from soils and aquatic sediments. Biogeochemistry 2006, 80, 89–108. [Google Scholar] [CrossRef]
  31. Georgiadis, A.; Sauer, D.; Herrmann, L.; Breuer, J.; Zarei, M.; Stahr, K. Development of a method for sequential Si extraction from soils. Geoderma 2013, 209, 251–261. [Google Scholar] [CrossRef]
  32. Song, Z.; Liu, H.; Li, B.; Yang, X. The production of phytolith-occluded carbon in China’s forests: Implications to biogeochemical carbon sequestration. Glob. Chang. Biol. 2013, 19, 2907–2915. [Google Scholar] [CrossRef]
  33. Fry, B. Stable Isotope Ecology; Springer: New York, NY, USA, 2006. [Google Scholar]
  34. Friedrich, U.; Falk, K.; Bahlmann, E.; Marquardt, T.; Meyer, H.; Niemeyer, T.; Schemmel, S.; von Oheimb, G.; Härdtle, W. Fate of airborne nitrogen in heathland ecosystems: A 15N tracer study. Glob. Chang. Biol. 2011, 17, 1549–1559. [Google Scholar] [CrossRef] [Green Version]
  35. Cui, J.; Yu, C.; Qiao, N.; Xu, X.; Tian, Y.; Ouyang, H. Plant preference for NH4+ versus NO3—At different growth stages in an alpine agroecosystem. Field Crop. Res. 2017, 201, 192–199. [Google Scholar] [CrossRef]
  36. Sommer, M.; Kaczorek, D.; Kuzyakov, Y.; Breuer, J. Silicon pools and fluxes in soils and landscapes—A review. J. Plant Nutr. Soil Sci. 2006, 169, 310–329. [Google Scholar] [CrossRef]
  37. Yang, X.; Song, Z.; Yu, C.; Ding, F. Quantification of different silicon fractions in broadleaf and conifer forests of northern China and consequent implications for biogeochemical Si cycling. Geoderma 2020, 361, 114036. [Google Scholar] [CrossRef]
  38. Vandegeer, R.K.; Cibils-Stewart, X.; Wuhrer, R.; Hartley, S.E.; Tissue, D.T.; Johnson, S.N. Leaf silicification provides herbivore defence regardless of the extensive impacts of water stress. Funct. Ecol. 2021, 35, 1200–1211. [Google Scholar] [CrossRef]
  39. Katz, O.; Puppe, D.; Kaczorek, D.; Prakash, N.B.; Schaller, J. Silicon in the Soil–Plant Continuum: Intricate Feedback Mechanisms within Ecosystems. Plants 2021, 10, 652. [Google Scholar] [CrossRef]
  40. Song, Z.; Müllerb, K.; Yanga, X. Silicon regulation of soil organic carbon stabilization and its potential tomitigate climate change. Earth-Sci. Rev. 2018, 185, 463–475. [Google Scholar] [CrossRef]
  41. Johnson, S.N.; Waterman, J.M.; Wuhrer, R.; Rowe, R.C.; Hall, C.R.; Cibils-Stewart, X. Siliceous and non-nutritious: Nitrogen limitation increases anti-herbivore silicon defences in a model grass. J. Ecol. 2021, 109, 3767–3778. [Google Scholar] [CrossRef]
  42. Ryalls, J.M.W.; Moore, B.D.; Johnson, S.N. Silicon uptake by a pasture grass experiencing simulated grazing is greatest under elevated precipitation. BMC Ecol. 2018, 18, 53. [Google Scholar] [CrossRef] [Green Version]
  43. Schoelynck, J.; Bal, K.; Backx, H.; Okruszko, T.; Meire, P.; Struyf, E. Silica uptake in aquatic and wetland macrophytes: A strategic choice between silica, lignin and cellulose? New Phytol. 2010, 186, 385–391. [Google Scholar] [CrossRef]
  44. Bin, Z.; Zhang, R.; Zhang, W.; Xu, D. Effects of nitrogen, phosphorus and silicon addition on leaf carbon, nitrogen, and phosphorus concentration of Elymus nutans of alpine meadow on Qinghai-Tibetan Plateau, China. Acta Ecol. Sin. 2015, 35, 4699–4706. [Google Scholar]
  45. Li, Z.-J.; Lin, P.; He, J.-Y.; Yang, Z.-W.; Lin, Y.-M. Silicon’s organic pool and biological cycle in moso bamboo community of Wuyishan Biosphere Reserve. J. Zhejiang Univ. B 2006, 7, 849–857. [Google Scholar] [CrossRef] [PubMed] [Green Version]
  46. Liu, J.; Yang, Q.P.; Song, Q.N.; Yu, D.K.; Shi, J.M. Strategy of fine root expansion of Phyllostachys pubescens population into evergreen broadleaved forest. Chin. J. Plant Ecol. 2013, 37, 230–238. [Google Scholar] [CrossRef]
  47. Houlton, B.Z.; Sigman, D.M.; Schuur, E.A.G.; Hedin, L.O. A climate-driven switch in plant nitrogen acquisition within tropical forest communities. Proc. Natl. Acad. Sci. USA 2007, 104, 8902–8906. [Google Scholar] [CrossRef] [Green Version]
  48. McKane, R.B.; Johnson, L.C.; Shaver, G.R.; Nadelhoffer, K.J.; Rastetter, E.B.; Fry, B.; Giblin, A.E.; Kielland, K.; Kwiatkowski, B.L.; Laundre, J.A.; et al. Resource-based niches provide a basis for plant species diversity and dominance in arctic tundra. Nature 2002, 415, 68–71. [Google Scholar] [CrossRef]
  49. Chen, Z.; Li, Y.; Chang, S.X.; Xu, Q.; Li, Y.; Ma, Z.; Qin, H.; Cai, Y. Linking enhanced soil nitrogen mineralization to increased fungal decomposition capacity with Moso bamboo invasion of broadleaf forests. Sci. Total. Environ. 2021, 771, 144779. [Google Scholar] [CrossRef]
  50. Miao, D.; Peng, X.; Teng, Q.; Sardar, M.F.; Zhang, Q.; Zhu, X.; Li, Y. Different contributions of bacterial and fungal communities to nitrogen mineralization in Moso bamboo-invaded subtropical forests. J. Soils Sediments 2023, 23, 1123–1134. [Google Scholar] [CrossRef]
  51. Ikegami, N.; Satake, T.; Nagayama, Y.; Inubushi, K. Changes in silica in litterfall and available silica in the soil of forests invaded by bamboo species (Phyllostachys pubescens and P. bambusoides) in western Japan. Soil Sci. Plant Nutr. 2014, 60, 731–739. [Google Scholar] [CrossRef]
  52. Ikegami, N.; Satake, T.; Nagayama, Y.; Inubushi, K. Biogeochemical Si cycling in bamboo forests with evergreen broad-leaved forest and coniferous forest in a temperate climate. Jpn. J. For. Environ. 2015, 57, 7–17. [Google Scholar]
  53. Zou, N.; Shi, W.; Hou, L.; Kronzucker, H.J.; Huang, L.; Gu, H.; Yang, Q.; Deng, G.; Yang, G. Superior growth, N uptake and NH4+ tolerance in the giant bamboo Phyllostachys edulis over the broad-leaved tree Castanopsis fargesii at elevated NH4+ may underlie community succession and favor the expansion of bamboo. Tree Physiol. 2020, 40, 1606–1622. [Google Scholar] [CrossRef] [PubMed]
Figure 1. The treatment of Si supply level and 15N labeling in this experiment. Silicon additions: +0 (control), +7, and +14 g/m2. Nitrogen source treatments: 15NH4NO3 and NH415NO3. Four species were included: Phyllostachys pubescens, Phoebe bournei, Schima superba, and Cunninghamia lanceolata.
Forests 14 01353 g001
Figure 2. The nitrogen-15 (15N) enrichment of roots (ad,a’d’,a”d”), stems (eh,e’h’,e”h”), and leaves (il,i’l’,i”l”) collected from four studied species of (a,e,i) Phyllostachys pubescens, (b,f,j) Phoebe bournei, (c,g,k) Schima superba, and (d,h,l) Cunninghamia lanceolata (means ± SE, n = 4). Asterisks indicate significant differences in the 15N enrichment between N forms within each species (independent samples test. * p < 0.05; ** p < 0.01; *** p < 0.001). Lowercase letters denotes significant differences in nitrogen-15 (15N) enrichment (15NH4NO3) among Si treatments, and uppercase letters denote significant differences in nitrogen-15 (15N) enrichment (NH415NO3) among Si treatments.
Forests 14 01353 g002
Figure 3. The nitrogen-15 (15N) uptake rates of roots (ad,a’d’,a”d”) and nitrogen-15 (15N) assimilation rates of leaves (eh,e’h’,e”h”) collected from four studied species of (a,e) Phyllostachys pubescens, (b,f) Phoebe bournei, (c,g) Schima superba, and (d,h) Cunninghamia lanceolata (means ± SE, n = 4). Asterisks indicate significant differences in the 15N enrichment between N forms within each species (one-way ANOVA. * p < 0.05; ** p < 0.01). Lowercase letters denotes significant differences in 15N enrichment (15NH4NO3) among Si treatments, and uppercase letters denote significant differences in 15N enrichment (NH415NO3) among Si treatments.
Forests 14 01353 g003
Table 1. The concentrations of Si, C, N, and P in different tissues of P. pubescens, P. bournei, S. superba, and C. lanceolata under varying Si supply levels (n = 8). The data represent mean values for the concentrations of Si, C, N, and P. Lowercase letters (a, b) denote significant differences in concentration of Si, C, N, and P among varying silicon supply levels (one-way ANOVA. p < 0.05) within species and tissue types.
ElementsSi TreatmentP. pubescensP. bourneiS. superbaC. lanceolata
LeafStemRootLeafStemRootLeafStemRootLeafStemRoot
Si (g kg−1)Si + 028.0 b17.2 b30.9 b6.2 b1.75.3 b4.22.713.14.82.9 a14.8 a
Si + 7 g/m228.7 b19.2 ab36.3 ab10.0 a2.210.0 ab4.82.69.53.81.8 b7.7 b
Si + 14 g/m237.0 a21.8 a44.8 a9.3 a2.416.9 a4.72.39.76.61.4 b5.7 b
C (%)Si + 042.4 a45.7 a37.1 a46.945.345.246.046.444.945.445.744.7
Si + 7 g/m241.5 ab42.7 b37.2 a46.745.245.646.545.544.845.845.645.2
Si + 14 g/m241.5 b42.7 b35.1 b46.745.845.346.445.244.645.345.645.6
N (%)Si + 01.820.390.631.75 a0.421.30 ab1.68 a0.520.671.220.510.72
Si + 7 g/m21.780.430.601.52 b0.451.46 a1.76 a0.550.721.260.540.78
Si + 14 g/m21.790.410.551.49 b0.411.22 b1.32 b0.510.801.310.510.71
P (g kg−1)Si + 00.790.710.520.620.710.710.690.360.690.740.510.40
Si + 7 g/m20.570.350.530.520.350.690.730.520.840.660.460.39
Si + 14 g/m20.620.610.530.480.610.710.710.280.700.780.590.36
Table 2. The comparison of 15N uptake and assimilation rates in plant tissue (including roots and leaves) among Phyllostachys pubescens, Phoebe bournei, Schima superba, and Cunninghamia lanceolata (n = 12). The data represent mean values (standard error) for uptake and assimilation rates (mg 15N d−1) under two different 15N treatments (15NH4NO3 and NH415NO3). Lowercase letters denote significant differences in 15N uptake and assimilation rates among four species (one-way ANOVA. p < 0.05). There were no significant differences between 15N treatments (15NH4NO3 and NH415NO3).
TissueSpecies1 d15 d75 d100 d
15NH4NO3NH415NO315NH4NO3NH415NO315NH4NO3NH415NO315NH4NO3NH415NO3
RootPhyllostachys pubescens93.0 (20.6) a114.2 (17.2) a7.5 (1.5) a5.0 (1.5) ab1.6 (0.3) a2.0 (0.3) a1.8 (0.3) a1.3 (0.2) a
Phoebe bournei100.4 (9.8) a78.7 (7.8) b6.7 (0.5) a5.9 (0.4) a1.1 (0.1) b1.2 (0.1) b1.1 (0.1) b1.0 (0.1) a
Schima superba50.3 (6.1) b44.3 (7.1) c3.4 (0.4) b2.9 (0.4) c0.5 (0.1) c0.4 (0.1) c0.6 (0.1) c0.5 (0.1) b
Cunninghamia lanceolata55.3 (5.4) b58.3 (5.1) bc3.9 (0.5) b3.8 (0.4) bc0.8 (0.1) bc0.9 (0.1) b0.8 (0.2) bc0.5 (0.1) b
LeafPhyllostachys pubescens110.2 (26.4) ab157.1 (16.2) a10.6 (0.9) a9.4 (2.4)3.8 (0.7) a5.0 (0.7) a3.6 (0.3) a3.1 (0.3) a
Phoebe bournei125.4 (7.1) a111.4 (7.9) b10.7 (1.0) a8.7 (0.9)2.4 (0.2) b3.1 (0.2) b1.4 (0.1) c1.5 (0.2) bc
Schima superba91.9 (9.9) ab82.0 (16.8) bc6.0 (0.8) b6.7 (0.7)1.0 (0.2) c1.5 (0.5) c1.1 (0.2) c0.9 (0.2) c
Cunninghamia lanceolata81.4 (13.3) b69.3 (4.6) c6.0 (0.6) b5.9 (0.8)2.4 (0.4) b2.5 (0.3) bc2.1 (0.2) b1.9 (0.3) b
Disclaimer/Publisher’s Note: The statements, opinions and data contained in all publications are solely those of the individual author(s) and contributor(s) and not of MDPI and/or the editor(s). MDPI and/or the editor(s) disclaim responsibility for any injury to people or property resulting from any ideas, methods, instructions or products referred to in the content.

