Article

Afforestation Influences Soil Aggregate Stability by Regulating Aggregate Transformation in Karst Rocky Desertification Areas

1
School of Karst Science, Guizhou Normal University, Guiyang 550001, China
2
State Engineering Technology Institute for Karst Desertification Control, Guiyang 550001, China
*
Author to whom correspondence should be addressed.
Forests 2023, 14(7), 1356; https://doi.org/10.3390/f14071356
Submission received: 18 May 2023 / Revised: 9 June 2023 / Accepted: 28 June 2023 / Published: 30 June 2023

Abstract

:
Surface vegetation has a substantial impact on soil aggregate stability, which is an important indicator of soil quality. However, there is still limited research on the response of soil aggregate stability indicators and the organic carbon, total nitrogen, and total phosphorus content in soil aggregates for different vegetation patterns in rocky desertification fragile ecological areas. Therefore, in order to study the effects of different vegetation restoration models on soil aggregate stability and aggregate related nutrient content and their promoting relationships in the karst rocky desertification areas in southwest China, soil samples under three artificial restoration vegetation measures (Juglans regia L.-Rosa roxburghii Tratt., Rosa roxburghii Tratt.-Lolium perenne L., Juglans regia L.-Lolium perenne L.) were collected in 0–10 cm and 10–20 cm soil, and the traditional farmland (Zea mays L.) was used as the control, combined with dry and wet sieving experiments for the research and analysis. The results showed that there were significant differences in the distribution of aggregates and soil nutrients among the four types of plots. Compared with traditional agricultural land, artificial afforestation increased the content of soil large macroaggregates (LMAs) and decreased the proportion of microaggregates (MIAs) and silt+clay (SCA), which enhanced the soil aggregate stability and reduced the soil fragmentation and erodibility. The afforestation restoration increased the content of soil aggregate-related SOC, TN, and TP, and increased with the decrease in the aggregate particle size. Research has found that soil aggregate stability indicators are significantly influenced by the particle size distribution of soil aggregates. In the positive succession process of vegetation types, soil nutrient accumulation is controlled by changes in the soil aggregate particle size, which affects the soil aggregate stability and reduces soil erodibility, thereby protecting the soil nutrient loss. The composite management of forest and irrigation in degraded ecological areas has certain reference and indicative significance for ecological restoration in rocky desertification areas.

1. Introduction

Irrational land use can lead to soil degradation, deplete soil nutrients, and change the stability of soil structure [1,2], which seriously affects the natural environment and agroecological sustainability. As an important measure to prevent soil degradation, artificial afforestation can alter the soil structure by the accumulation of plant root exudates and litter to reduce the soil erodibility [3]. Karst areas are among the highest nutrient loss and soil erosion areas in the world [4], including the European Mediterranean region, Dinaric karst, and southwest China [5], and ecological problems have attracted great attention. Therefore, understanding the influence of soil aggregate stability on soil nutrients under different vegetation restoration types in karst rocky desertification areas is thus critical to studying karst ecological restoration.
Soil aggregates, a key component of soil structure, are critical for improving soil fertility, carbon sequestration, soil aggregate stability, and resistance to water erosion [6]. At the same time, its stability is intimately tied to the rainfall erosivity, surface runoff, and soil loss rate [7,8]. Soil erodibility is a term used to describe the sensitivity of the soil to water erosion, which can impair soils’ ability to support ecosystem functions, including food production, pollution prevention, flood control, and climate change mitigation [9]. Investigating the changes in soil structure and erosion resistance during vegetation restoration measures is important for analyzing the effectiveness of ecological management measures in rocky desertification areas and providing a basis for further management.
The type of vegetation has been shown to influence the accumulation of the C, N, and P contents in soil, and irrational agricultural activities have been shown to significantly affect the distribution of aggregates and changes in aggregate-related nutrients [10,11], In addition, soil nutrients play an important role in soil growth [12], and the ability to resist erosion also affects the potential changes in soil nutrients [13,14]. However, in karst rocky desertification areas, most studies have concentrated only on the ability of vegetation types to increase nutrients or improve erodibility, and it is not clear how the differences in soil aggregate stability and the resulting ability to affect soil nutrients are improved by artificial afforestation patterns [15,16], and most use the mean weight diameter (MWD) and the geometric mean diameter (GMD) to evaluate soil aggregate stability [17,18] without combining stability with the promotion relationship of nutrients in aggregates. Therefore, it is necessary to combine various stability indicators to elaborate the ability of different vegetation types in rocky desertification areas to improve soil aggregate stability and nutrients, as well as to determine the promotion relationship between them, which will help to develop more effective vegetation restoration strategies in order to maximize the ecological advantages of vegetation restoration.
As a result, we chose the demonstration area of integrated management of rocky desertification in the Plateau Mountain, Bijie Salaxi, to further investigate the impact of vegetation restoration on soil aggregate stability and soil nutrients in karst rocky desertification areas in southern China, as well as to provide a foundation for preventing soil erosion and the development of effective management strategies for sustainable ecosystem functions in rocky desertification areas. The main research contents are (1) an investigation into the capacity of different vegetation types to improve soil nutrients and ameliorate soil aggregate stability and (2) to reveal the promotion relationship between the aggregate particle size on soil aggregate stability and aggregate nutrients under different vegetation restoration measures.

2. Materials and Methods

2.1. Study Area and Soil Sampling

The Bijie Salaxi rocky desertification comprehensive management demonstration area was taken as the study area (Figure 1). The research area is in Southwest China’s karst region, covering an area of 86 km2, of which 74% is a karst landform, the rocky desertification grade is mainly potential–mild, and the region is dominated by highland mountainous terrain, with an altitude of 1600–2081 m. The climate is subtropical monsoon climate, with an annual temperature variation range of −7.2–30.1 °C, an annual average temperature of 12.7 °C, and an accumulated temperature of ≥10 °C between 3717 and 4109 °C. The total annual rainfall is 984 mm, with the rainy season from June to September, during which the rainfall accounts for 52% of the total annual rainfall. In addition, the soil in the area is mainly yellow soil, with a small amount of yellow brown soil and calcareous soil distributed in some mountain valleys and depressions. The vegetation is mainly composed of secondary evergreen deciduous coniferous broad-leaved mixed forests, covering two major categories, 130 families, 426 genera, and 697 species of seed and spore plants. Since the implementation of ecological management in this area, a certain scale of forest and grass vegetation restoration models have gradually emerged, including single and mixed species of Juglans regia L., Rosa roxburghii Tratt., Lolium perenne L. In April 2019, four land use types (Zea mays L., Juglans regia L.-Rosa roxburghii Tratt., Rosa roxburghii Tratt.-Lolium perenne L., and Juglans regia L.-Lolium perenne L.) were selected in the study area(Table 1), and three quadrats were laid out on each study plot with a size of 10 m × 10 m. According to the “S” type of spotting, five sample locations were chosen, and 1 kg of undisturbed soil samples were collected at depths that varied between 0 and 10 cm and 10 and 20 cm. Each soil sample was immediately placed in a PE plastic bag and sealed before being transported to the lab in an ice box for the analyses of the physical and chemical parameters.

2.2. Soil Analysis

The soil was screened by a 10 mm sieve after natural air-drying, and then the soil aggregate content was determined by two experimental methods, dry sieving and wet sieving, under natural water content and water erosion conditions, respectively [19]. The experiment obtained the mass of four grade aggregates: >2 mm large macroaggregates (LMA), 0.25–2 mm small macroaggregates (SMA), 0.053–0.25 mm microaggregates (MIAs), and <0.053 mm silt+clay (SCA).
Take soil samples from various levels of aggregates obtained through wet sieving analysis and pass them through a 0.05 mm sieve to determine the content of soil organic carbon (SOC), total nitrogen (TN), and total phosphorus (TP) [20]. The SOC was determined by wet digestion with a mixture of 5 mL of 0.8 mol/L potassium dichromate (K2Cr2O7) and 5 mL of concentrated sulfuric acid (H2SO4), TN and (TP) are digested by sulfuric acid-potassium sulfate: copper sulfate (9:1) and sulfuric acid-perchloric acid respectively, and the filtrate is measured by a continuous flow analyzer.

2.3. Soil Aggregate Stability Index

The mean weight diameter (MWD) [21], geometric mean diameter (GMD) [22], K factor [23], fractal dimension (Dm) [24], and structure failure rate (PAD) [25] were used to express the soil aggregate stability.
The following equations [21,22] were used to calculate the mean weight diameter (MWD) and geometric mean diameter (GMD):
M W D = i = 1 n W i X i i = 1 n W i
G M D = E X P i = 1 n W i ln X i i = 1 n W i
where n is the number of aggregate size fractions, Xi is the i-th aggregate particle size mean diameter, Wi is the i-th aggregate particle size weight.
The following equation [24] was used to determine the fractal dimension (Dm):
D m = 3 l o g W δ < R i / W 0 l o g R i / R m a x
where Ri is the average value of two adjacent grain sizes (mm), Rmax is the average value of the largest grain size aggregate (mm), W is the accumulation of the mass of aggregate with diameters less than Ri (g), and W0 is the total sum of aggregate content of each grain size (g).
In order to express the soil erodibility, the K factor [23] was calculated using the following equation:
K = 7.954 × {0.0017 + 0.0494 × exp[−0.5 × (lgHGMD + 1.675/0.6986)2]}
The structure failure rate (PAD) of the soil aggregates is a crucial indicator for assessing the erosion durability, and was calculated with the following equation:
P A D = a b a
where a is the percentage of aggregates >0.25 mm, measured by Yoder’s method (dry sieving) [19], and b is the percentage of aggregates >0.25 mm, measured by Yoder’s method [19]. Higher p values imply a lower soil aggregate stability.

2.4. Statistical Analysis

Excel 2010 and SPSS 22 were used to organize and evaluate the data collected after the studies, using one-way ANOVA and Duncan’s test, the study data were evaluated for significance of differences (a = 0.05). The correlation analysis used the Pearson coefficient. We compared the standardized values of various indicators. The plotting was performed in Origin 2018.
Standardization can eliminate the impact of different factor dimensions. The factors were separated into positive and negative indicators, and their ranges were normalized to 0–1. The factors’ main components were then extracted using principal component analysis.
Positive indicator:
y i = x i x m i n x m a x x m i n
Negative indicator:
y i = x m a x x i x m a x x m i n
where yi was the standardized value of the i-th index. xi was the original value. xmax and xmin were the maximum and minimum values, respectively.

3. Results

3.1. Soil Aggregate Size Distribution

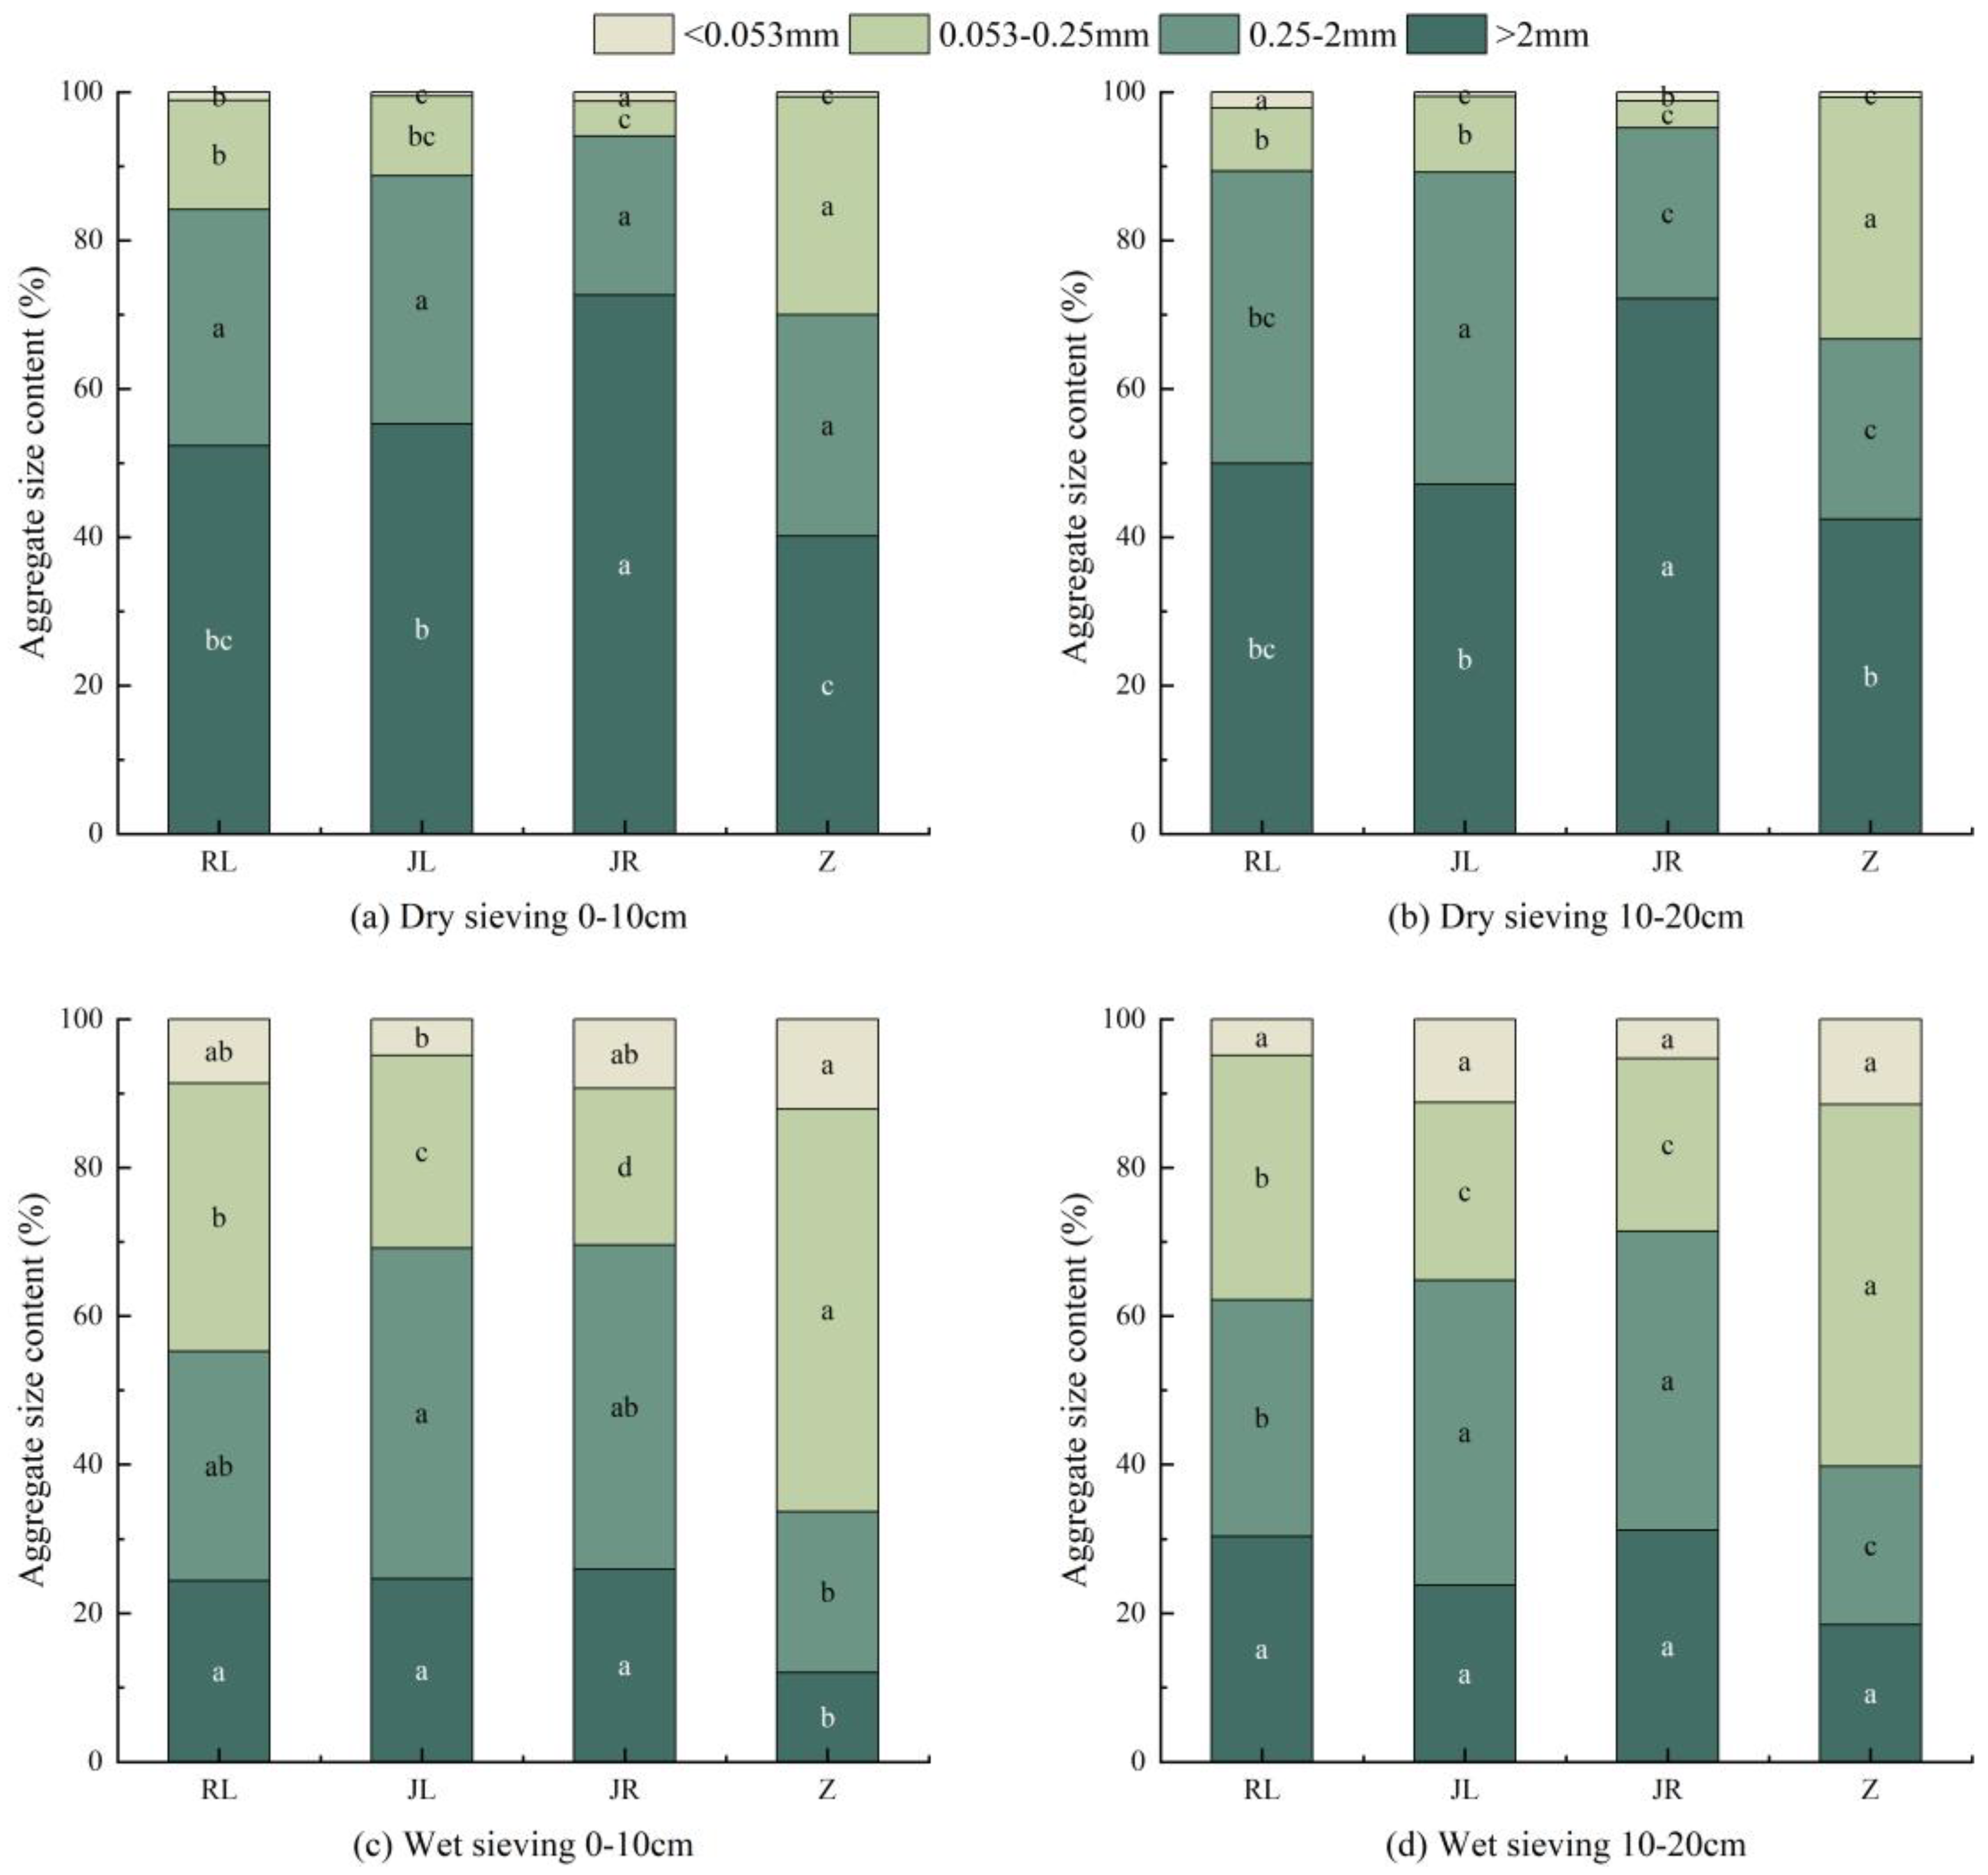
Figure 2 indicates the characteristics of the aggregate particle size distribution under different land use methods and soil depths, and, under the various plant patterns, there are clear changes in the distribution of each soil particle size. The results of the dry sieving experiments showed (Figure 2a,b) that the LMA (>2 mm) content dominated the aggregates (40.17%–72.61%) in all sample sites, and the LMA content increased significantly after the transformation of cultivated land (Z) into plantation grassland, while the MIAs showed the opposite trend. The LMA content decreased with an increasing soil depth except for cultivated land (Z), and the SMA content showed an opposite trend. In the outcomes of the wet sieving tests (c and d), JL and JR were dominated by the SMA content (40.23%–44.46%), while RL and Z had the most MIA content (32.94%–54.23%). When cultivated land was converted to artificial grassland, the LMA content showed an increasing trend, and the MIA content decreased significantly. Compared to Z, the RL distribution decreased by 75.21%, 46.52%, and 61.67%. This result shows that afforestation has a major impact on the soil aggregation findings.

3.2. Soil Aggregate Stability

Statistical analysis of soil aggregate stability indicators (MWD, GMD, Dm, PAD, and K) for each site (Figure 3) showed that the one-way ANOVA showed that the type of planting in the sample site had a remarkable influence on each soil aggregate stability index (p < 0.05). The cultivated land has the lowest MWD and GMD values, and the stability indexes were improved after the transformation of cultivated land into artificial forest grassland, with the highest in JR. Compared with the cultivated land, MWD increased 1.65 times and GMD increased 2.76 times in the dry sieving results and 1.98 and 2.81 times in the wet sieving results, respectively. The Dm values in sample plot Z were slightly higher than those in the rest of the sample plots. At the same time, both PAD and K values showed a decline with increasing depth of the soil layer (Figure 4), and the fragmentation rate of the soil aggregates and erodibility K values were significantly greater in the cultivated area than in the other sample sites. This shows that the plantations not only enhance the soil structure and aggregate stability, but also reduce soil erodibility. Among the three plantation types, the combination of Juglans regia L.-Rosa roxburghii Tratt. was superior to Rosa roxburghii Tratt.-Lolium perenne L. and Juglans regia L.-Lolium perenne L.

3.3. Soil Nutrients of Different Vegetation Restoration Types

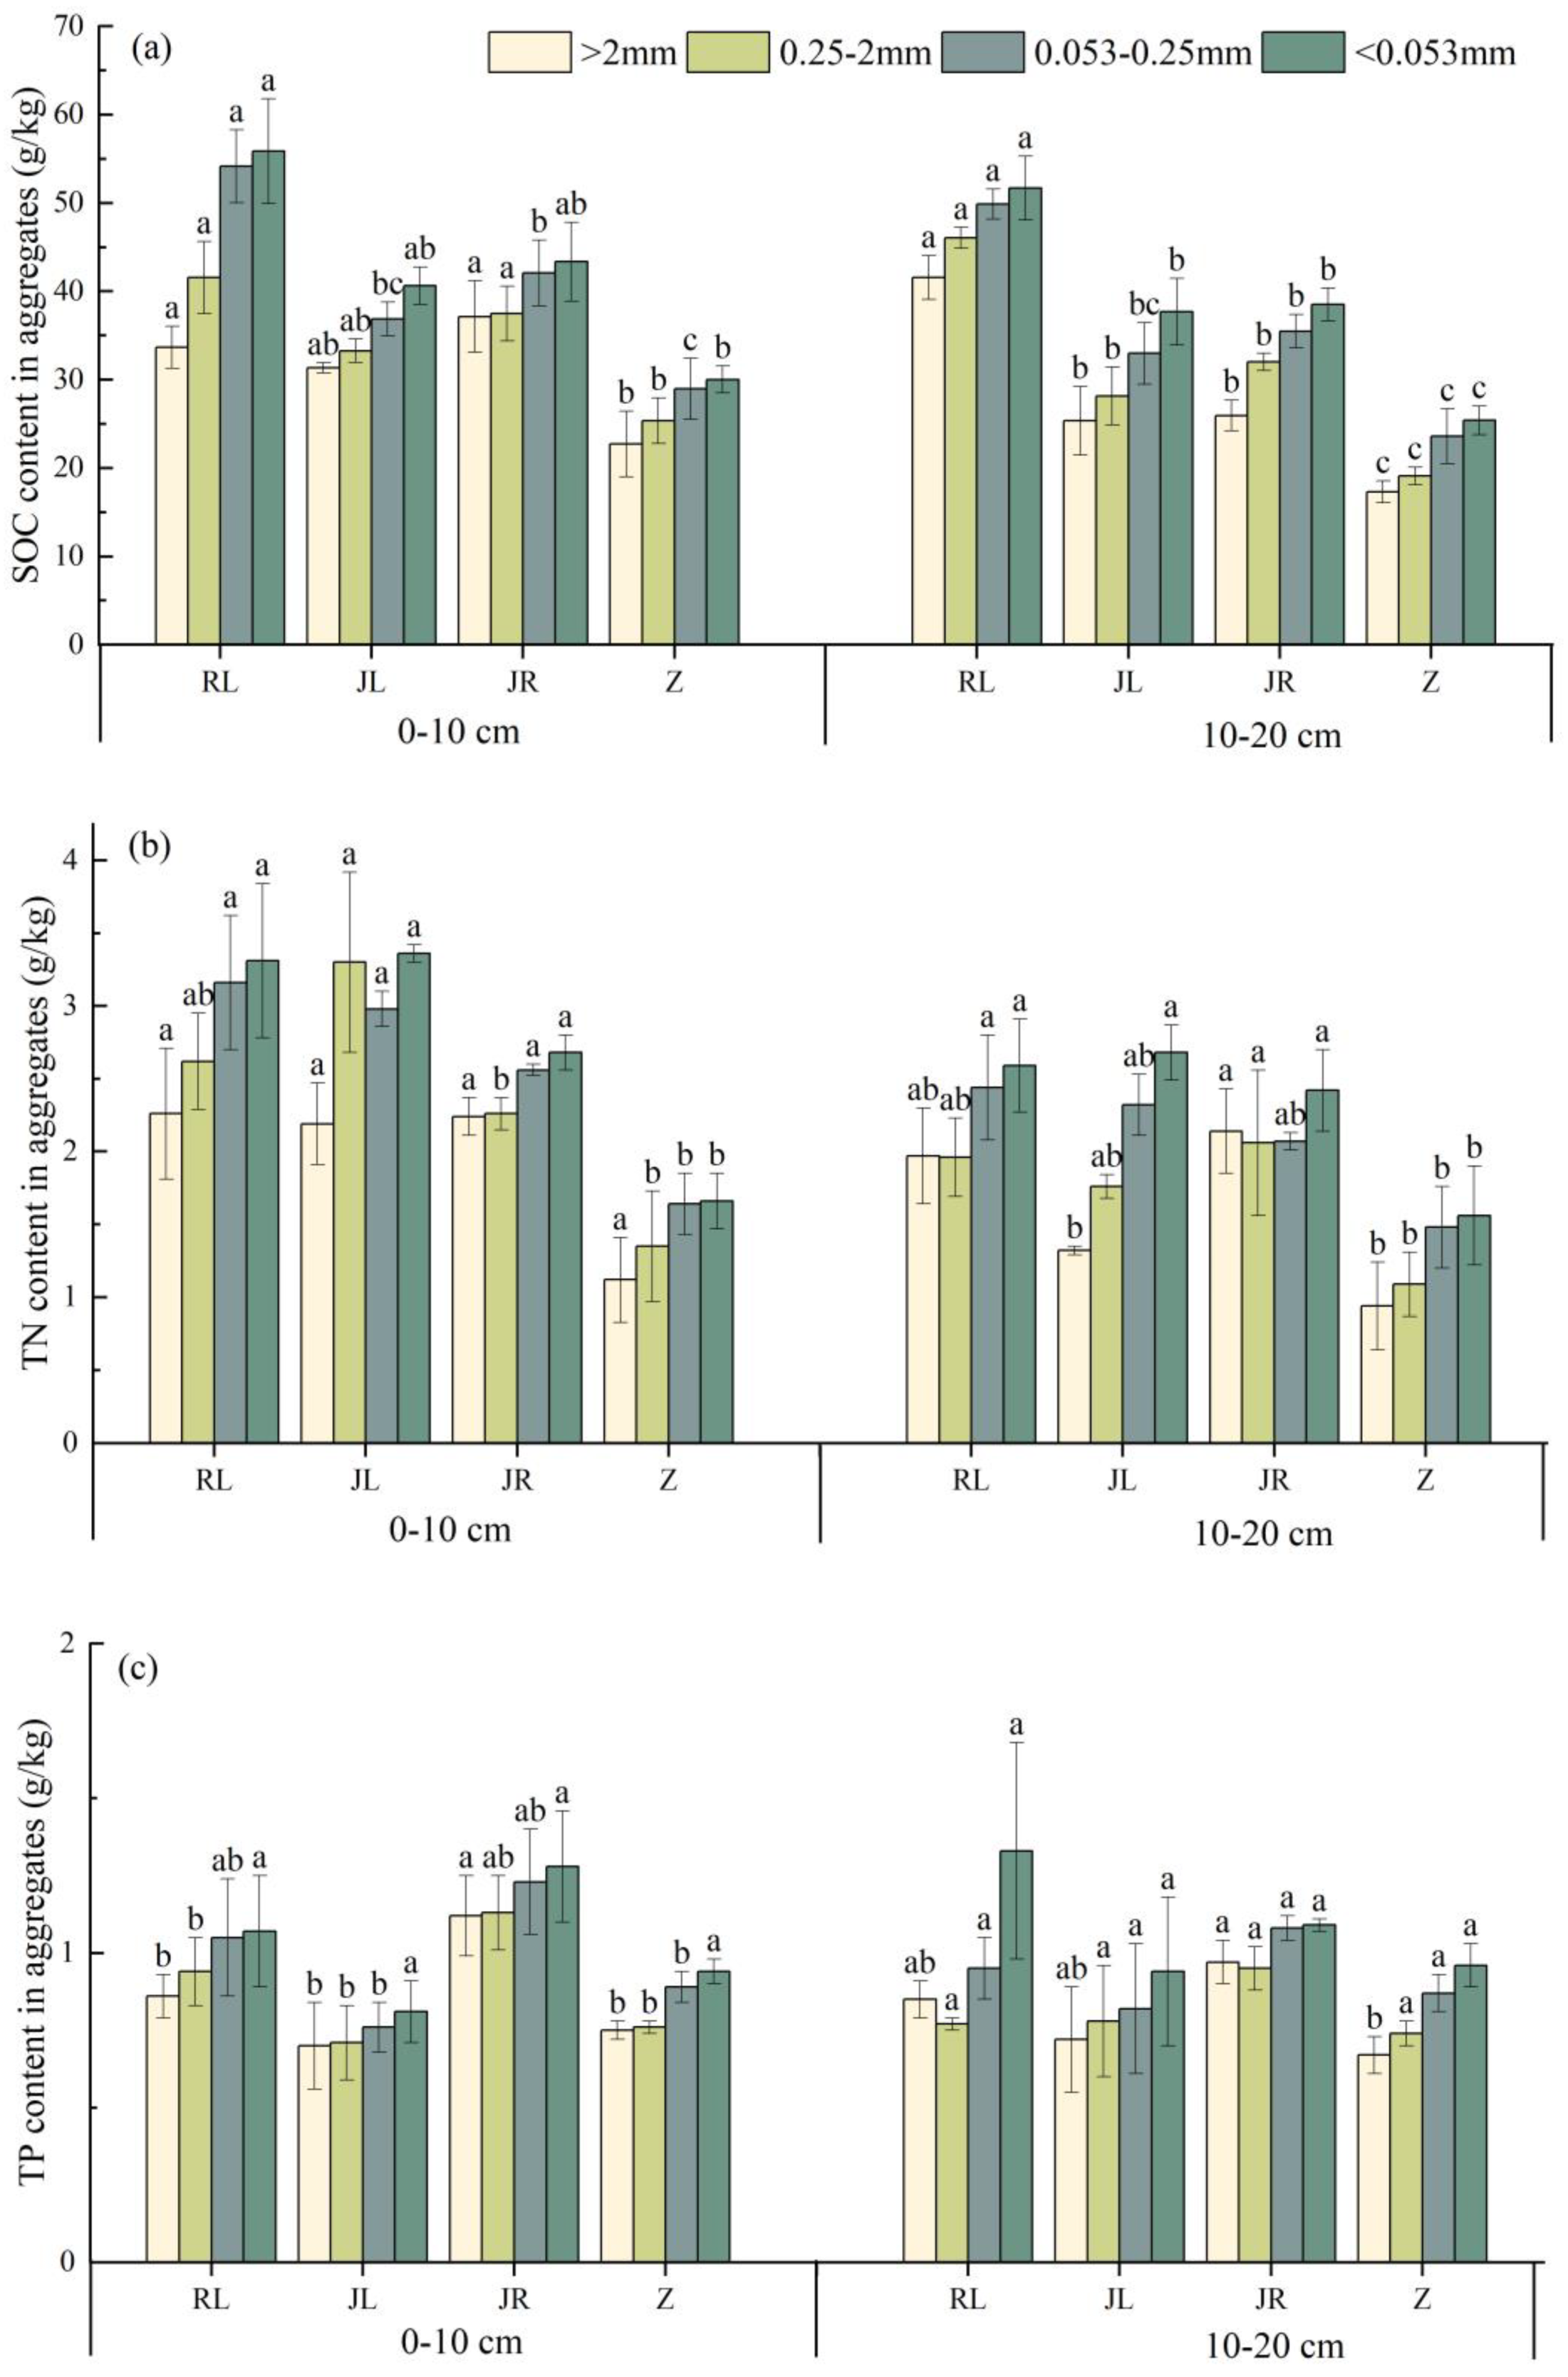
Aggregate-related SOC, TN, and TP were significantly influenced by the land use type and soil depth (Figure 5). The nutrient content was higher at the 10 cm layer, and the soil aggregate-related SOC and TN content was significantly increased by 7.89–26.96 g/kg and 0.38–1.95 g/kg for RL, JL, and JR, compared to the cultivated land (Figure 5a,b), and the TP content increased by 0.03–0.37 g/kg for RL and JR compared to the cultivated land. In addition, in different land use types, the content of nutrients associated with aggregates was negatively correlated with the aggregate diameter and increased with a decreasing particle size, and the cultivated land had the lowest SOC content among all the aggregate particle sizes. In the 10–20 cm soil layer, the SOC1, SOC2, SOC3, and SOC4 (LMAs, SMAs, MIAs, SCAs, aggregate SOCs) were significantly lower than those in the rest of the sample plots. The TN content also showed a similar pattern. The TN4 (<0.053 mm aggregate TN) content of the cultivated land was significantly lower than that of the other plots, and the TN3 (0.053–0.25 mm aggregate TN) content was the highest in RL. The total phosphorus content of the aggregates at all levels in the range of 0–20 cm ranged from 0.67 to 1.28 g/kg, and the content of the 10–20 cm soil layer was slightly lower than that of the 0–10 cm soil layer. The variation in total phosphorus content in different particle sizes between different types of plots was poor. In conclusion, afforestation contributes to the accumulation of soil nutrients.

3.4. Relationships between Aggregate Stability and Soil Nutrients

To see how different plant restoration categories affect the soil aggregate stability, further analysis of the correlation between aggregate particle size and soil structure and soil nutrients was conducted. Based on the measured data, the structure of soil was divided into two categories: the stability factor SST (MWD, GMD, Dm, PAD) and erodibility factor (K). The standardized average value of each factor extreme value was taken as the input parameter of the correlation analysis. The soil nutrient data were processed similarly by taking the average of the standardized values of SOC, TN, and TP, and the combined nutrients of different particle size aggregates were expressed as LMAN, SMAN, MIAN, and SCAN. The findings showed that the aggregate size was closely related to the soil structure index and aggregate nutrients, and LMA and MIA aggregates were particularly well represented. As shown in Table 2, the LMA clusters showed significant positive and negative correlations with the SST and K values, respectively, while in contrast, the MIA clusters showed significant negative and positive correlations with SST and K values, respectively. The SMA and SCA aggregates showed different degrees of a negative correlation with SST and K, and most of them did not reach the significance level. In addition, there was a high positive relationship between the SST and different grain size soil nutrients with the highest correlation coefficient of 0.606 (p < 0.001) with the LMA large particle size aggregate nutrients, indicating that macro-aggregates are more favorable for the soil nutrient aggregation. Unlike SST, the relationship between the K values and all four grain sizes of soil nutrients was significantly negatively correlated, showing that the smaller the grain size, the higher the negative correlation coefficient. This shows that the aggregate size shift has a direct effect on promoting the soil structure and soil nutrient changes.
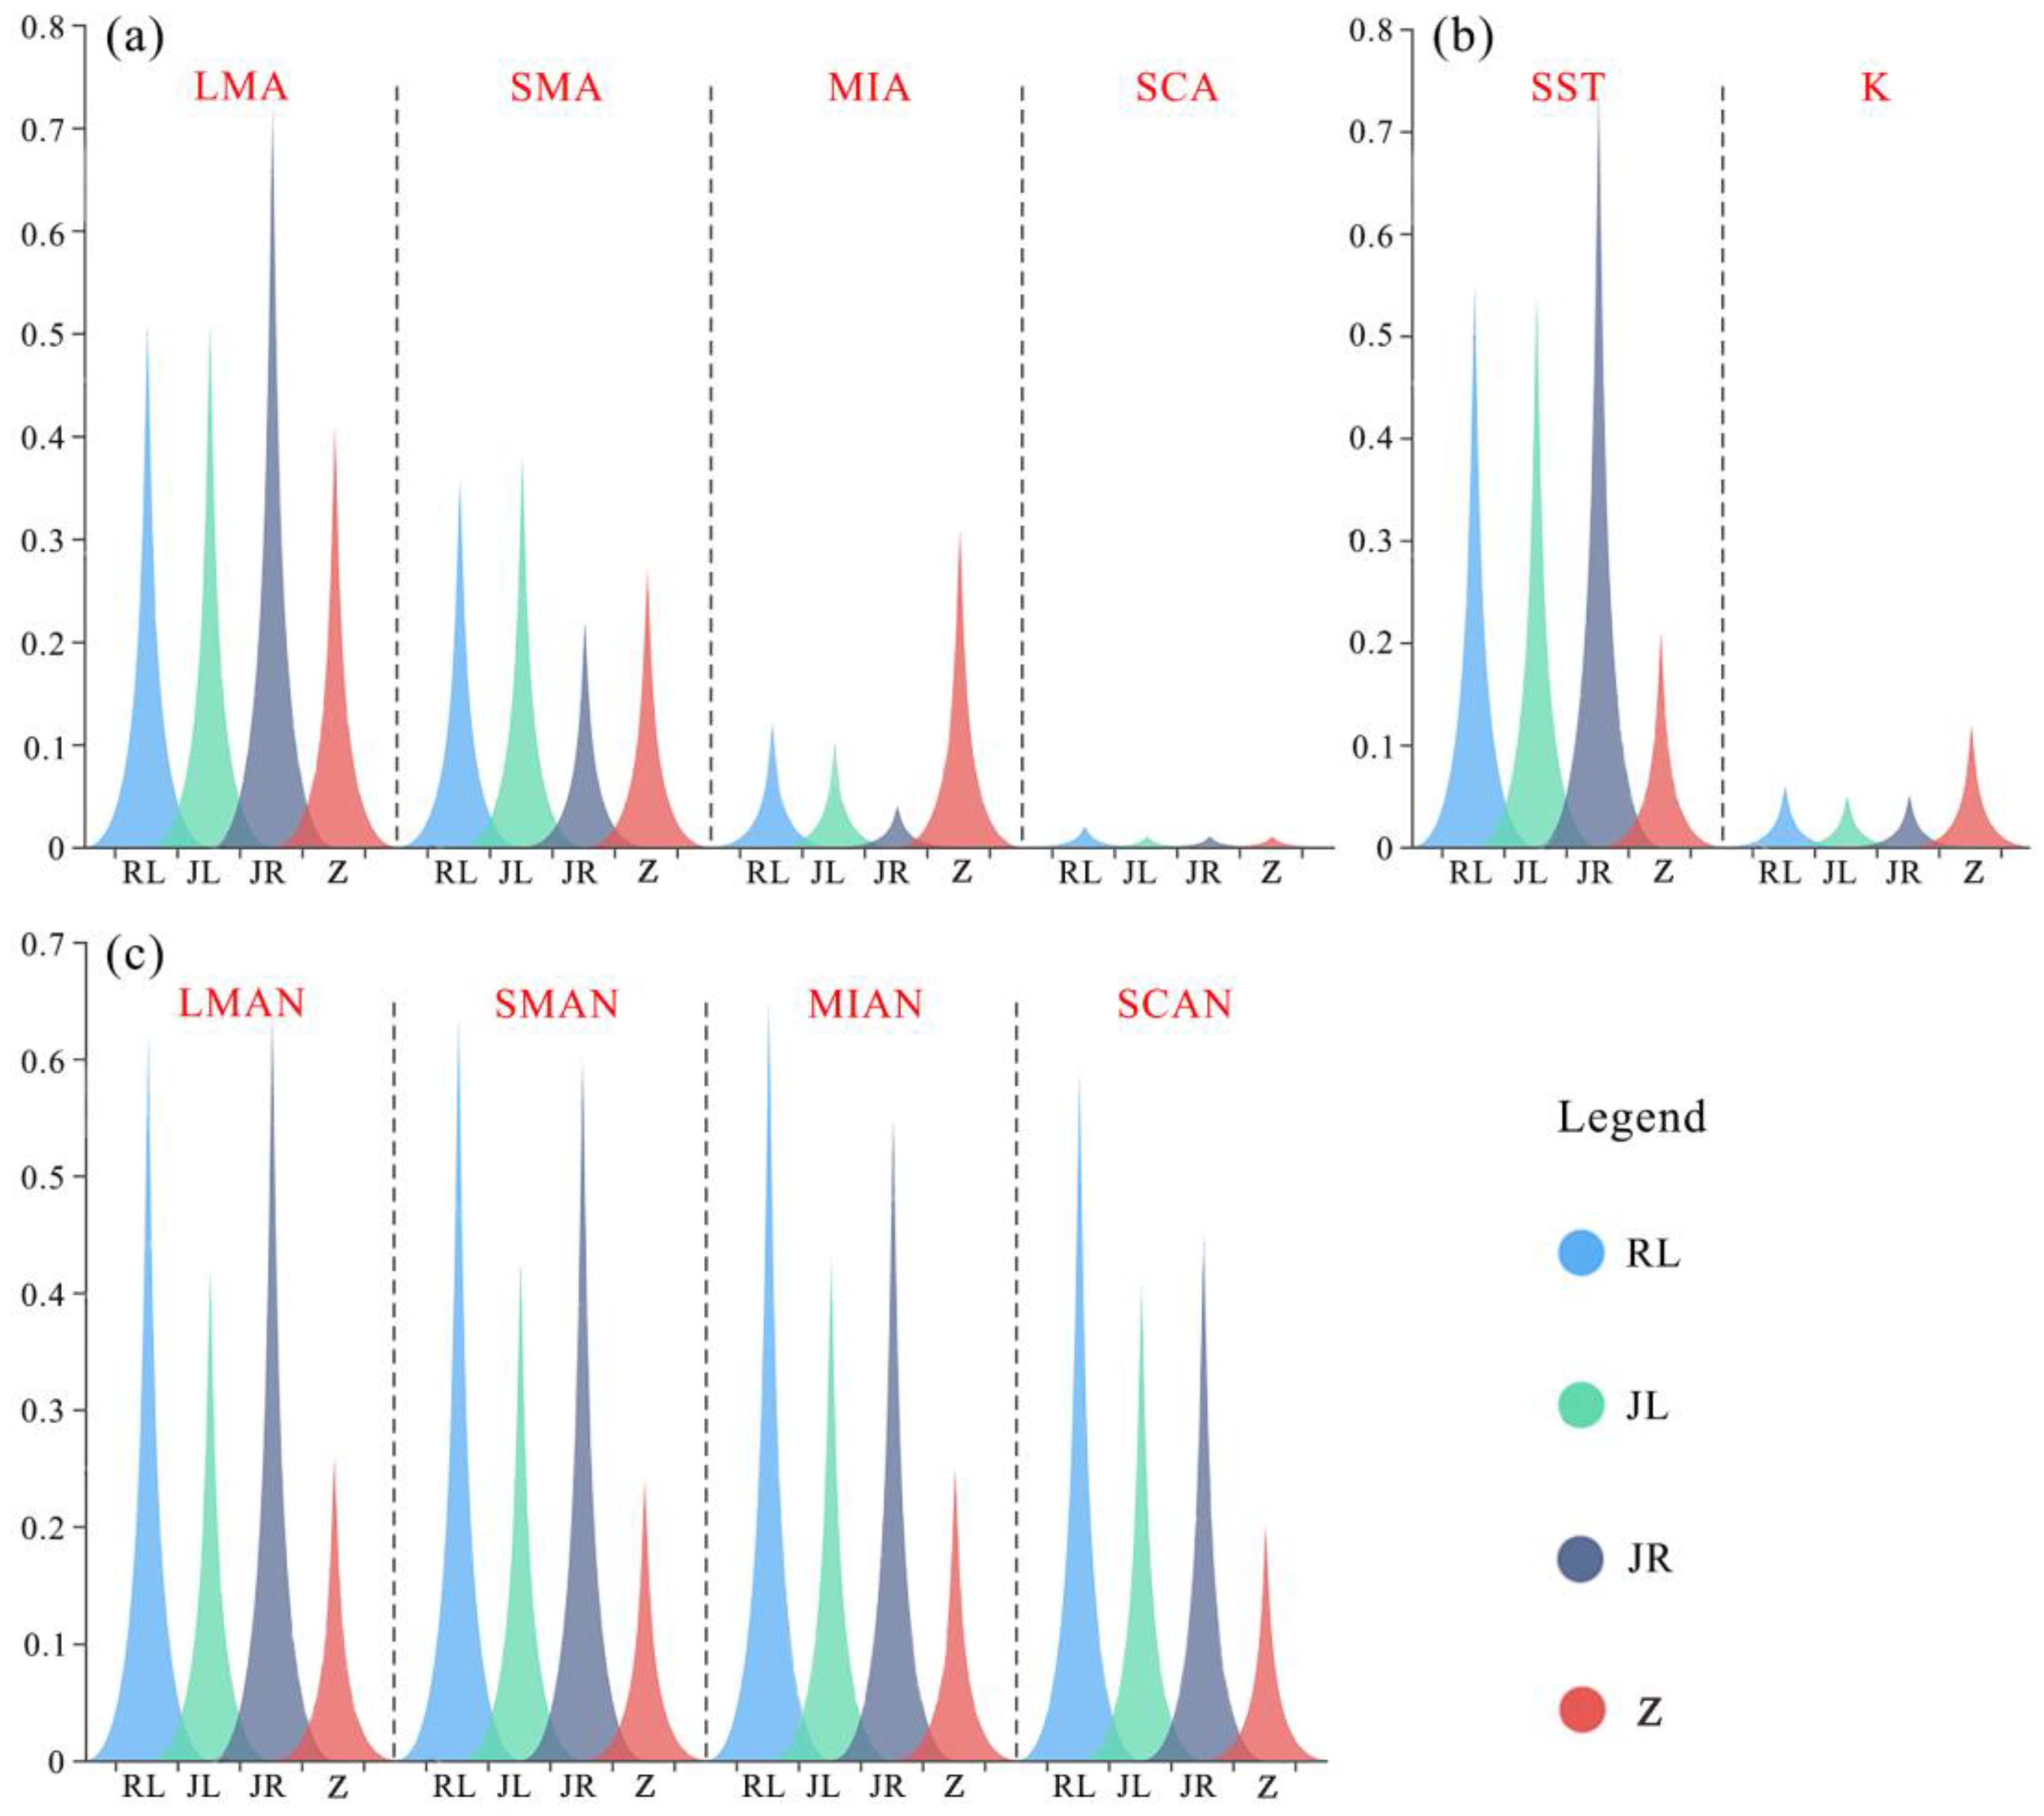
In addition, the differences in the standardized values of the soil aggregate stability indicators between the plantation grass model and the conventional tillage model were further compared (Figure 6). By comparison, it was found that the LMAs’ large particle size aggregates of the three plantation grasslands were obviously higher than those of the cultivated land, while the MIA microaggregates were all smaller than those of the cropland, with the highest standardized value of macroaggregates for the mixed use of Juglans regia L. and Lolium perenne L., which was approximately 1.76 times higher than that of the cropland. Mixed land forestry and grass use not only promoted changes in aggregate particle size types but were also visualized in soil structure, with substantial increases in stability and erosion resistance. The average SST of the three land use types, RL, JL, and JR, is approximately three times greater than that of cropland, while the average K is only 42% of that of cropland. In terms of standardized values of soil nutrients, the LMANs, SMANs, MIANs, and SCANs of the three mixed land use types were significantly greater than that of the arable monoculture, and the larger the particle size of the aggregates, the higher the degree of soil nutrient aggregation. Compared with traditional cultivated land, artificial afforestation in rocky desertification areas promotes the transformation of microaggregates to macroaggregates to a certain extent, which in turn improves soil nutrients and enhances the soil aggregate stability and is of significant indicative importance for fragile eco-restoration of rocky desertification.

4. Discussion

4.1. Effects of Artificial Afforestation on Soil Aggregate and Chemical Properties

In this study, the karst rocky desertification area had a high degree of soil fragmentation and low land use efficiency. Land use types have a major effect on soil structure and stability (Figure 2, Figure 3 and Figure 4). Cultivated land had the greatest MIA and SCA content of all land use types, which was in line with the findings of earlier research [26]. Rainfall-induced soil erosion is a significant factor in the rocky desertification process in karst regions [27], which makes the macroaggregates decompose into MIAs and SCAs, thus reducing the stability of the test soil [28]. The higher LMA content in the three different forest grasslands compared to the cultivated land, with similar trends to the SMA content, was mainly attributed to the breakdown of soil macroaggregates by long-term tillage [29], suggesting that the conversion of cultivated land to forest grassland influences the distribution characteristics of soil aggregates by regulating the LMA aggregate content [30].
In addition, we found that forest-irrigated land had the highest stability, and forest-grassland and forest-irrigated land had the best erosion resistance, followed by irrigated land. On the one hand, plant roots and plant residues in the soil produce more stable compounds [31]; on the other hand, the binding agents of fungi and organic matter in plantation forestland increase with apoplast, forming organic binders that enhance the stability of soil aggregates [32]. The instability of soil aggregates on agricultural land is a major factor in soil erosion. which leads to soil nutrient loss, and natural forestland, due to the vegetation cover, prevents the direct destruction of soil aggregates by heavy rainfall [33]. Soil nutrients such as in woodlands can bind the soil together more [34,35]. Therefore, the planting patterns of Juglans regia L.-Rosa roxburghii Tratt., Rosa roxburghii Tratt.-Lolium perenne L., and Juglans regia L.-Lolium perenne L. in the vegetation restoration used in the management process of karst areas are feasible.
Soil nutrients are regulated by the plant and soil features and have a favorable role in preserving the soil productivity and reducing soil deterioration. In this study, aggregate particle size-related SOC, TN, and TP were strongly impacted by land use type. For example, compared with other sample soils, the highest organic carbon and total nitrogen contents were found in the irrigated grassland, and the highest total phosphorus contents were found in the forested irrigated land, while the nutrients associated with each grain size cluster were significantly lower in the cultivated land than in the other sample soils. Rocky desertification areas have different effects on the nutrients associated with aggregates due to sediment transport under different land use types [31,36]. Additionally, aggregate-associated nutrients were slightly higher in the topsoil layer than in the 10–20 cm soil layer; this might be the result of artificially disturbed soil and factors such as root secretions and surface apoplast influencing the loss and accumulation of aggregate-associated nutrients. In contrast, the TP content associated with forest grassland increased with an increasing soil depth, probably due to the different particle size distributions of the aggregates with increasing soil depth [26]. The fact that the carbon and nitrogen contents of the soil and aggregates were lower in the 10–20 cm soil layer than in the 0–10 cm soil layer suggests that the forest and grass vegetation restoration techniques used in the study area significantly increased the soil’s ability to sequester elements by enhancing the vegetation cover and boosting the source of organic matter. The nutrient content in SCA aggregates was slightly higher than in other aggregate particle sizes. Zheng et al. [37] and Liu et al. [38] also reported similar results. More and more organic matter will be absorbed as the aggregates’ specific surface area and smaller particle size increase. Thus, small particle size aggregates have a greater surface area of the soil particles, which in turn leads to a greater nutrient content.

4.2. Differences in Soil Structure and Chemical Properties of Different Vegetation Types

Soil properties, environmental factors, land use types, rainfall erosivity, and other factors all influence soil aggregate stability [2,39], and soil nutrients are also closely related to soil structure [17,26,40]. The research results show that there is a significant correlation between the content of large and small soil aggregates, soil aggregate stability indicators, and aggregate nutrients. The transformation of vegetation type has a significant impact on the particle size of aggregates [41]. Compared with traditional cultivated land, a plantation increases the content of soil macroaggregates, changes the soil structure, enhances the soil aggregate stability, and reduces the soil K, Dm, and PAD, and the anthropogenic disturbance in cultivation activities makes the soil fragmentation rate higher in this environment. In contrast, the vegetation cover, litter in the surface soil, and plant roots of planted forests protect the soil and effectively mitigate the impact of natural factors such as precipitation on the soil structure [42].
Most of the nutrients in soils are found in aggregates, the formation of which is critical to the accumulation of nutrients in aggregates, and the disruption of aggregates can lead to nutrient losses [43], affecting the content of nutrients associated with soil aggregates at all levels. In this study, all nutrient levels were higher in the artificial afforestation pattern than in the traditional cultivated land pattern. Compared to traditional cultivated land, afforestation changes the distribution characteristics of soil aggregates, and this change is related to the intensity of disturbance and overstory plant species under different restoration patterns [44]. The change in plant species reduces runoff, and sediment significantly reduces nutrient loss and promotes nutrient accumulation [45,46,47]. At the same time, plants secrete large amounts of organic matter, which promotes the growth and secretion of microorganisms, together with the increase in the plant apoplast, helps to regulate nutrient cycling and soil fertility [48], and improves the availability of soil nutrients [49]. The low correlation between the soil aggregate characteristics and soil TP content in this study maybe as a result of the changing soil microbial characteristics and functions during afforestation, which affect microbial metabolism through the enzymatic activities of soil cellulase, β-1,4-N-acetylglucosamnidase, etc., and directly increase the accumulation of soil carbon and nitrogen without directly affecting the accumulation of phosphorus [50].
The statistical analysis of this paper shows that the stability structure and nutrient structure of soil aggregates under the artificial mixed afforestation pattern are superior to those under the traditional single tillage pattern. Compared with the mixed land use type, the vegetation coverage of cultivated land is low and has obvious seasonal differences. When rainfall occurs, microaggregates are more likely to be splashed by raindrops, resulting in the mineralization of the organic matter inside them. Additionally, after harvest, the nutrients in plants cannot be returned to the soil, which is unfavorable to the buildup of soil nutrients [40]. The shift from cultivated land to a plantation mode induces the aggregation of MIAs into LMA macroaggregates, leading to changes in stability indicators such as soil aggregate fragmentation rate, PAD, and erodibility K values, and an increase in the physical protection of nutrients, with a significant accumulation of soil nutrients realized in typical degraded karst areas [51]. Therefore, in terms of the nutrient fixation and stability of the soil, the anthropogenic configuration of forest, irrigation, and grass complex planting in rocky desertification areas has a positive influence on fragile ecological restoration.

4.3. Limitations and Prospects

Long-term artificial plant restoration can significantly improve the soil aggregate stability and encourage nutrient buildup, which is of practical significance for ecosystem vegetation restoration and land use regulation in karst areas. However, the ecological environment of the southwest karst region is complex, and many factors affect the soil environment [52]. Therefore, in subsequent studies, multiple sampling can be performed to increase the number of comparative experiments in the time scale and to explore the variability of the dual spatial and temporal scales. We should not only combine the factors of field differences such as different topography and altitude, but also consider multidisciplinary intersections and combine factors such as surface plant nutrient differences, surface moss crust characteristics, and soil microbial activity in rocky desertification areas to conduct in-depth research on soil aggregates and their nutrients in karst areas.

5. Conclusions

Through the present study, we analyzed the impact of vegetation restoration on the structure of soil aggregates, soil aggregate stability, and the distribution of aggregate-related organic carbon, total nitrogen, and total phosphorus, as well as the nutrient content response to the soil aggregate stability in the rocky desertification area of the Karst Plateau Mountains in southern China, using four typical land use practices and two soil layers. Research has shown that (1) vegetation restoration significantly affects the LMA content of soil; (2) among the three types of artificial forests, the soil aggregate stability of Juglans regia L.-Rosa roxburghii Tratt. is better than that of Rosa roxburghii Tratt.-Lolium perenne L. and Juglans regia L.-Lolium perenne L.; (3) soil nutrients have significantly improved with the restoration of vegetation; and (4) compared to traditional cultivated land, artificial afforestation in rocky desertification areas has to some extent promoted the transformation of microaggregates to macroaggregates, and the larger the particle size of aggregates, the higher the soil nutrient aggregation. In general, afforestation influences soil aggregate stability by regulating aggregate transformation in karst desertification areas. This study provides a theoretical reference for promoting ecological restoration in rocky desertification areas.

Author Contributions

Conceptualization, D.Z.; methodology, Q.Y.; software, Q.Y.; validation, D.Z. and Q.Y.; formal analysis, Q.Y., Y.Z. and Z.C.; investigation, Z.W. and R.L.; resources, Y.H. and J.N.; data curation, Q.Y.; writing—original draft preparation, D.Z.; writing—review and editing, D.Z. All authors have read and agreed to the published version of the manuscript.

Funding

This work was supported by the National Natural Science Foundation of China (No. 41907042) and the special project of Guizhou Normal University on Academic Seedling Cultivation and Innovation Exploration (Grant No. 2019).

Data Availability Statement

The processed data required to reproduce these findings cannot be shared at this time as the data also forms part of an ongoing study.

Conflicts of Interest

The authors state no conflict of interest.

References

  1. Liu, X.B.; Zhang, X.Y.; Wang, Y.X.; Sui, Y.Y.; Zhang, S.L.; Herbert, S.J.; Ding, G. Soil degradation: A problem threatening the sustainable development of agriculture in Northeast China. Plant Soil Environ. 2010, 56, 87–97. [Google Scholar] [CrossRef] [Green Version]
  2. Dong, L.B.; Li, J.W.; Liu, Y.L.; Hai, X.Y.; Li, M.Y.; Wu, J.Z.; Wang, X.Z.; Shangguan, Z.P.; Zhou, Z.C.; Deng, L. Forestation delivers significantly more effective results in soil C and N sequestrations than natural succession on badly degraded areas: Evidence from the Central Loess Plateau case. Catena 2022, 208, 105734. [Google Scholar] [CrossRef]
  3. Lan, J. Changes of soil aggregate stability and erodibility after cropland conversion in degraded karst region. J. Soil Sci. Plant Nutr. 2021, 21, 3333–3345. [Google Scholar] [CrossRef]
  4. He, J.H.; Zhang, K.L.; Cao, Z.; Ke, Q.H. Tracer vertical movement and its affecting factors in karst soil profiles in simulated leaching context. J. Soils Sediments 2021, 22, 229–237. [Google Scholar] [CrossRef]
  5. Jiang, Z.; Lian, Y.; Qin, X. Rocky desertification in Southwest China: Impacts, causes, and restoration. Earth-Sci. Rev. 2014, 132, 1–12. [Google Scholar] [CrossRef]
  6. Six, J.; Bossuyt, H.; Degryze, S.; Denef, K. A history of research on the link between (micro) aggregates, soil biota, and soil organic matter dynamics. Soil Tillage Res. 2004, 79, 7–31. [Google Scholar] [CrossRef]
  7. Le Bissonnais, Y. Aggregate stability and assessment of soil crustability and erodibility: I. Theory and methodology. Eur. J. Soil Sci. 1996, 47, 425–437. [Google Scholar] [CrossRef]
  8. Wuddivira, M.N.; Stone, R.J.; Ekwue, E.I. Clay, organic matter, and wetting effects on splash detachment and aggregate breakdown under intense rainfall. Soil Sci. Soc. Am. J. 2009, 73, 226–232. [Google Scholar] [CrossRef]
  9. Zhang, K.L.; Shu, A.P.; Xu, X.L.; Yang, Q.K.; Yu, B. Soil erodibility and its estimation for agricultural soils in China. J. Arid. Environ. 2008, 72, 1002–1011. [Google Scholar] [CrossRef]
  10. Park, S.I.; Yang, H.I.; Park, H.J.; Seo, B.S.; Jeong, Y.J.; Lim, S.S.; Kwak, J.H.; Kim, H.Y.; Yoon, K.S.; Lee, S.M.; et al. Rice straw cover decreases soil erosion and sediment-bound C, N, and P losses but increases dissolved organic C export from upland maize fields as evidenced by δ13C. Sci. Total Environ. 2021, 753, 142053. [Google Scholar] [CrossRef]
  11. Lan, M.; Xue, C.; Yang, J.; Wang, N.; Sun, C.; Wu, G.; Chen, H.; Su, Z. Changes in Plant Diversity and Soil Factors under Different Rocky Desertification Degrees in Northern Guangdong, China. Forests 2023, 14, 694. [Google Scholar] [CrossRef]
  12. Yılmaz, E.; Çanakcı, M.; Topakcı, M.; Sönmez, S.; Ağsaran, B.; Alagöz, Z.; Çıtak, S.; Uras, D.S. Effect of vineyard pruning residue application on soil aggregate formation, aggregate stability and carbon content in different aggregate sizes. Catena 2019, 183, 104219. [Google Scholar] [CrossRef]
  13. Guo, M.M.; Chen, Z.X.; Wang, W.L.; Wang, T.C.; Wang, W.X.; Cui, Z.Q. Revegetation induced change in soil erodibility as influenced by slope situation on the Loess Plateau. Sci. Total Environ. 2021, 772, 145540. [Google Scholar] [CrossRef]
  14. Wang, H.; Wang, J.; Zhang, G. Impact of landscape positions on soil erodibility indexes in typical vegetation-restored slope-gully systems on the Loess Plateau of China. Catena 2021, 201, 105235. [Google Scholar] [CrossRef]
  15. Guan, Y.J.; Zhou, W.; Bai, Z.K.; Cao, Y.G.; Huang, Y.H.; Huang, H.Y. Soil nutrient variations among different land use types after reclamation in the Pingshuo opencast coal mine on the Loess Plateau, China. Catena 2020, 188, 104427. [Google Scholar] [CrossRef]
  16. Dong, L.; Li, J.; Zhang, Y.; Bing, M.Y.; Liu, Y.L.; Wu, J.Z.; Hai, X.Y.; Li, A.; Wang, K.B.; Wu, P.X.; et al. Effects of vegetation restoration types on soil nutrients and soil erodibility regulated by slope positions on the Loess Plateau. J. Environ. Manag. 2022, 302, 113985. [Google Scholar] [CrossRef]
  17. Yan, H.; Wang, L.; Wang, T.W.; Wang, Z.; Shi, Z.H. A synthesized approach for estimating the C-factor of RUSLE for a mixed-landscape watershed: A case study in the Gongshui watershed, southern China. Agric. Ecosyst. Environ. 2020, 301, 107009. [Google Scholar] [CrossRef]
  18. Zheng, J.Y.; Zhao, J.S.; Shi, Z.H.; Wang, L. Soil aggregates are key factors that regulate erosion-related carbon loss in citrus orchards of southern China: Bare land vs. grass-covered land. Agric. Ecosyst. Environ. 2021, 309, 107254. [Google Scholar] [CrossRef]
  19. Yoder, R.E. A direct method of aggregate analysis of soils and a study of the physical nature of erosion losses. Soil Sci. Soc. Am. J. 1936, 28, 337–351. [Google Scholar] [CrossRef]
  20. Bao, S.D. Analysis of Soil Agrochemical, 3rd ed.; Agriculture Press: Beijing, China, 2000. [Google Scholar]
  21. Van Bavel, C.H.M. Mean weight-diameter of soil aggregates as a statistical index of aggregation. Proc. Soil Sci. Soc. Am. 1950, 14, 20–23. [Google Scholar] [CrossRef] [Green Version]
  22. Gardner, W.R. Representation of soil aggregate-size distribution by a logarithmic-normal distribution. Soil Sci. Soc. Am. J. 1956, 20, 151–153. [Google Scholar] [CrossRef]
  23. Shirazi, M.A.; Boersma, L. A unifying quantitative analysis of soil texture. Soil Sci. Soc. Am. J. 1984, 48, 142–147. [Google Scholar] [CrossRef]
  24. Yang, P.L.; Luo, Y.P.; Shi, Y.C. Soil fractal characteristics characterized by weight distribution of particle size. Chin. Sci. Bull. 1993, 20, 1896–1899. [Google Scholar]
  25. Liu, W.L.; Wu, J.G.; Fu, M.J.; Liang, Y.J.; Zhao, X.Y. Effect of different cultivation years on composition and stability of soil aggregate fractions in orchard. J. Soil Water Conserv. 2014, 28, 129–135. [Google Scholar]
  26. Tang, X.; Qiu, J.; Xu, Y.; Li, J.H.; Chen, J.H.; Li, B.; Lu, Y. Responses of soil aggregate stability to organic C and total N as controlled by land-use type in a region of south China affected by sheet erosion. Catena 2022, 218, 106543. [Google Scholar] [CrossRef]
  27. Zhu, D.; Xiong, K.; Xiao, H. Multitime scale variability of rainfall erosivity and erosivity density in the karst region of southern China, 1960–2017. Catena 2021, 197, 104977. [Google Scholar] [CrossRef]
  28. Zhang, J.; Yang, M.; Deng, X.; Liu, Z.; Zhang, F. The effects of tillage on sheet erosion on sloping fields in the wind-water erosion crisscross region of the Chinese Loess Plateau. Soil Tillage Res. 2019, 187, 235–245. [Google Scholar] [CrossRef]
  29. Barreto, R.C.; Madari, B.E.; Maddock, J.E.L.; Machado, P.L.; Torres, E.; Franchini, J.; Costa, A.R. The impact of soil management on aggregation, carbon stabilization and carbon loss as CO2 in the surface layer of a Rhodic Ferralsol in Southern Brazil. Agric. Ecosyst. Environ. 2009, 132, 243–251. [Google Scholar] [CrossRef]
  30. He, Y.; Zhang, Q.; Wang, S.; Jiang, C.; Lan, Y.; Zhang, H.; Ye, S. Mixed Plantations Induce More Soil Macroaggregate Formation and Facilitate Soil Nitrogen Accumulation. Forests 2023, 14, 735. [Google Scholar] [CrossRef]
  31. Li, H.; Zhu, H.; Liang, C.; Wei, X.; Yao, Y. Soil erosion significantly decreases aggregate-associated OC and N in agricultural soils of Northeast China. Agric. Ecosyst. Environ. 2022, 323, 107677. [Google Scholar] [CrossRef]
  32. Zeng, Q.; Darboux, F.; Man, C.; Zhu, Z.; An, S. Soil aggregate stability under different rain conditions for three vegetation types on the Loess Plateau (China). Catena 2018, 167, 276–283. [Google Scholar] [CrossRef] [Green Version]
  33. Ruiz-Colmenero, M.; Bienes, R.; Eldridge, D.J.; Marques, M.J. Vegetation cover reduces erosion and enhances soil organic carbon in a vineyard in the central Spain. Catena 2013, 104, 153–160. [Google Scholar] [CrossRef]
  34. Ayoubi, S.; Karchegani, P.M.; Mosaddeghi, M.R.; Honarjoo, N. Soil aggregation and organic carbon as affected by topography and land use change in western Iran. Soil Tillage Res. 2012, 121, 18–26. [Google Scholar] [CrossRef]
  35. Wang, X.; Cammeraat, E.L.H.; Cerli, C.; Kalbitz, K. Soil aggregation and the stabilization of organic carbon as affected by erosion and deposition. Soil Biol. Biochem. 2014, 72, 55–65. [Google Scholar] [CrossRef]
  36. Liu, M.; Han, G.; Li, X. Contributions of soil erosion and decomposition to SOC loss during a short-term paddy land abandonment in Northeast Thailand. Agric. Ecosyst. Environ. 2021, 321, 107629. [Google Scholar] [CrossRef]
  37. Zheng, Z.C.; He, S.Q.; Li, T.X.; Wang, Y.D. Effect of land use patterns on stability and distributions of organic carbon in the hilly region of Western Sichuan, China. Afr. J. Biotechnol. 2011, 10, 13107–13114. [Google Scholar] [CrossRef]
  38. Liu, D.; Ju, W.; Jin, X.; Li, M.; Shen, G.T.; Duan, C.J.; Guo, L.; Liu, Y.; Zhao, W.; Fang, L. Associated soil aggregate nutrients and controlling factors on aggregate stability in semiarid grassland under different grazing prohibition timeframes. Sci. Total Environ. 2021, 777, 146104. [Google Scholar] [CrossRef]
  39. Nciizah, A.D.; Wakindiki, I.I.C. Physical indicators of soil erosion, aggregate stability and erodibility. Arch. Agron. Soil Sci. 2015, 61, 827–842. [Google Scholar] [CrossRef]
  40. Guo, Y.; Fan, R.; Zhang, X.; Zhang, Y.; Wu, D.; Mclaughlin, N.; Zhang, S.; Chen, X.; Jia, S.; Liang, A. Tillage-induced effects on SOC through changes in aggregate stability and soil pore structure. Sci. Total Environ. 2020, 703, 134617. [Google Scholar] [CrossRef]
  41. Fonte, S.J.; Nesper, M.; Hegglin, D.; Velásquez, J.E.; Ramirez, B.; Rao, I.M.; Bernasconi, S.M.; Bünemann, E.K.; Frossard, E.; Oberson, A. Pasture degradation impacts soil phosphorus storage via changes to aggregate-associated soil organic matter in highly weathered tropical soils. Soil Biol. Biochem. 2014, 68, 150–157. [Google Scholar] [CrossRef]
  42. Yan, Y.C.; Wang, X.; Guo, Z.J.; Chen, J.Q.; Xin, X.P.; Xu, D.W.; Yan, R.R.; Chen, B.R.; Xu, L.J. Influence of wind erosion on dry aggregate size distribution and nutrients in three steppe soils in northern China. Catena 2018, 170, 159–168. [Google Scholar] [CrossRef]
  43. Jiang, W.; Li, Z.; Xie, H.; Ouyang, K.; Yuan, H.; Duan, L. Land use change impacts on red slate soil aggregates and associated organic carbon in diverse soil layers in subtropical China. Sci. Total Environ. 2023, 856, 159194. [Google Scholar] [CrossRef]
  44. Robert, J.H.; Sarah, J.R.; Ian, A.D.; Duane, A.P.; David, A.C. Species-and community-level patterns in fine root traits along a 120,000-year soil chronosequence in temperate rainforest. J. Ecol. 2011, 99, 954–963. [Google Scholar] [CrossRef]
  45. Cleveland, C.C.; Townsend, A.R.; Taylor, P.; Alvarez-Clare, S.; Bustamante, M.M.C.; Chuyong, G.; Dobrowski, S.Z.; Grierson, P.; Harms, K.E.; Houlton, B.Z.; et al. Relationships among net primary productivity, nutrients and climate in tropical rainforest: A pan-tropical analysis. Ecol. Lett. 2011, 14, 939–947. [Google Scholar] [CrossRef]
  46. Wang, S.Q.; Huang, Y.Z.; Ye, S.M. Distribution of organic carbon and nutrients in soil aggregates under different stand types of Cunninghamia lanceolata in southern Guangxi of China. Soil Sci. Plant Nutr. 2021, 67, 427–438. [Google Scholar] [CrossRef]
  47. Hou, E.Q.; Wen, D.Z.; Jiang, L.F.; Luo, X.Z.; Kuang, Y.W.; Lu, X.K.; Chen, C.R.; Allen, K.T.; He, X.J.; Huang, X.Z.; et al. Latitudinal patterns of terrestrial phosphorus limitation over the globe. Ecol. Lett. 2021, 24, 1420–1431. [Google Scholar] [CrossRef]
  48. Zhang, Y.; Zhang, B.; Xu, Q.; Gao, D.; Xu, W.; Ren, R.; Jiang, J.; Wang, S. The effects of plant and soil characteristics on partitioning different rainfalls to soil in a subtropical Chinese fir forest ecosystem. Forests 2022, 13, 123. [Google Scholar] [CrossRef]
  49. Philippot, L.; Raaijmakers, J.M.; Lemanceau, P.; Van der Putten, W.H. Going back to the roots: The microbial ecology of the rhizosphere. Nat. Rev. Microbiol. 2013, 11, 789–799. [Google Scholar] [CrossRef]
  50. Luo, X.; Hou, E.; Zhang, L.; Kuang, Y.; Wen, D. Altered soil microbial properties and functions after afforestation increase soil carbon and nitrogen but not phosphorus accumulation. Biol. Fertil. Soils 2023, 1–14. [Google Scholar] [CrossRef]
  51. Lan, J.; Long, Q.; Huang, M.; Jiang, Y.; Hu, N. Afforestation-induced large macroaggregate formation promotes soil organic carbon accumulation in degraded karst area. For. Ecol. Manag. 2022, 505, 119884. [Google Scholar] [CrossRef]
  52. Wang, X.; Huang, X.; Xiong, K.; Hu, J.; Zhang, Z.; Zhang, J. Mechanism and Evolution of Soil Organic Carbon Coupling with Rocky Desertification in South China Karst. Forests 2022, 13, 28. [Google Scholar] [CrossRef]
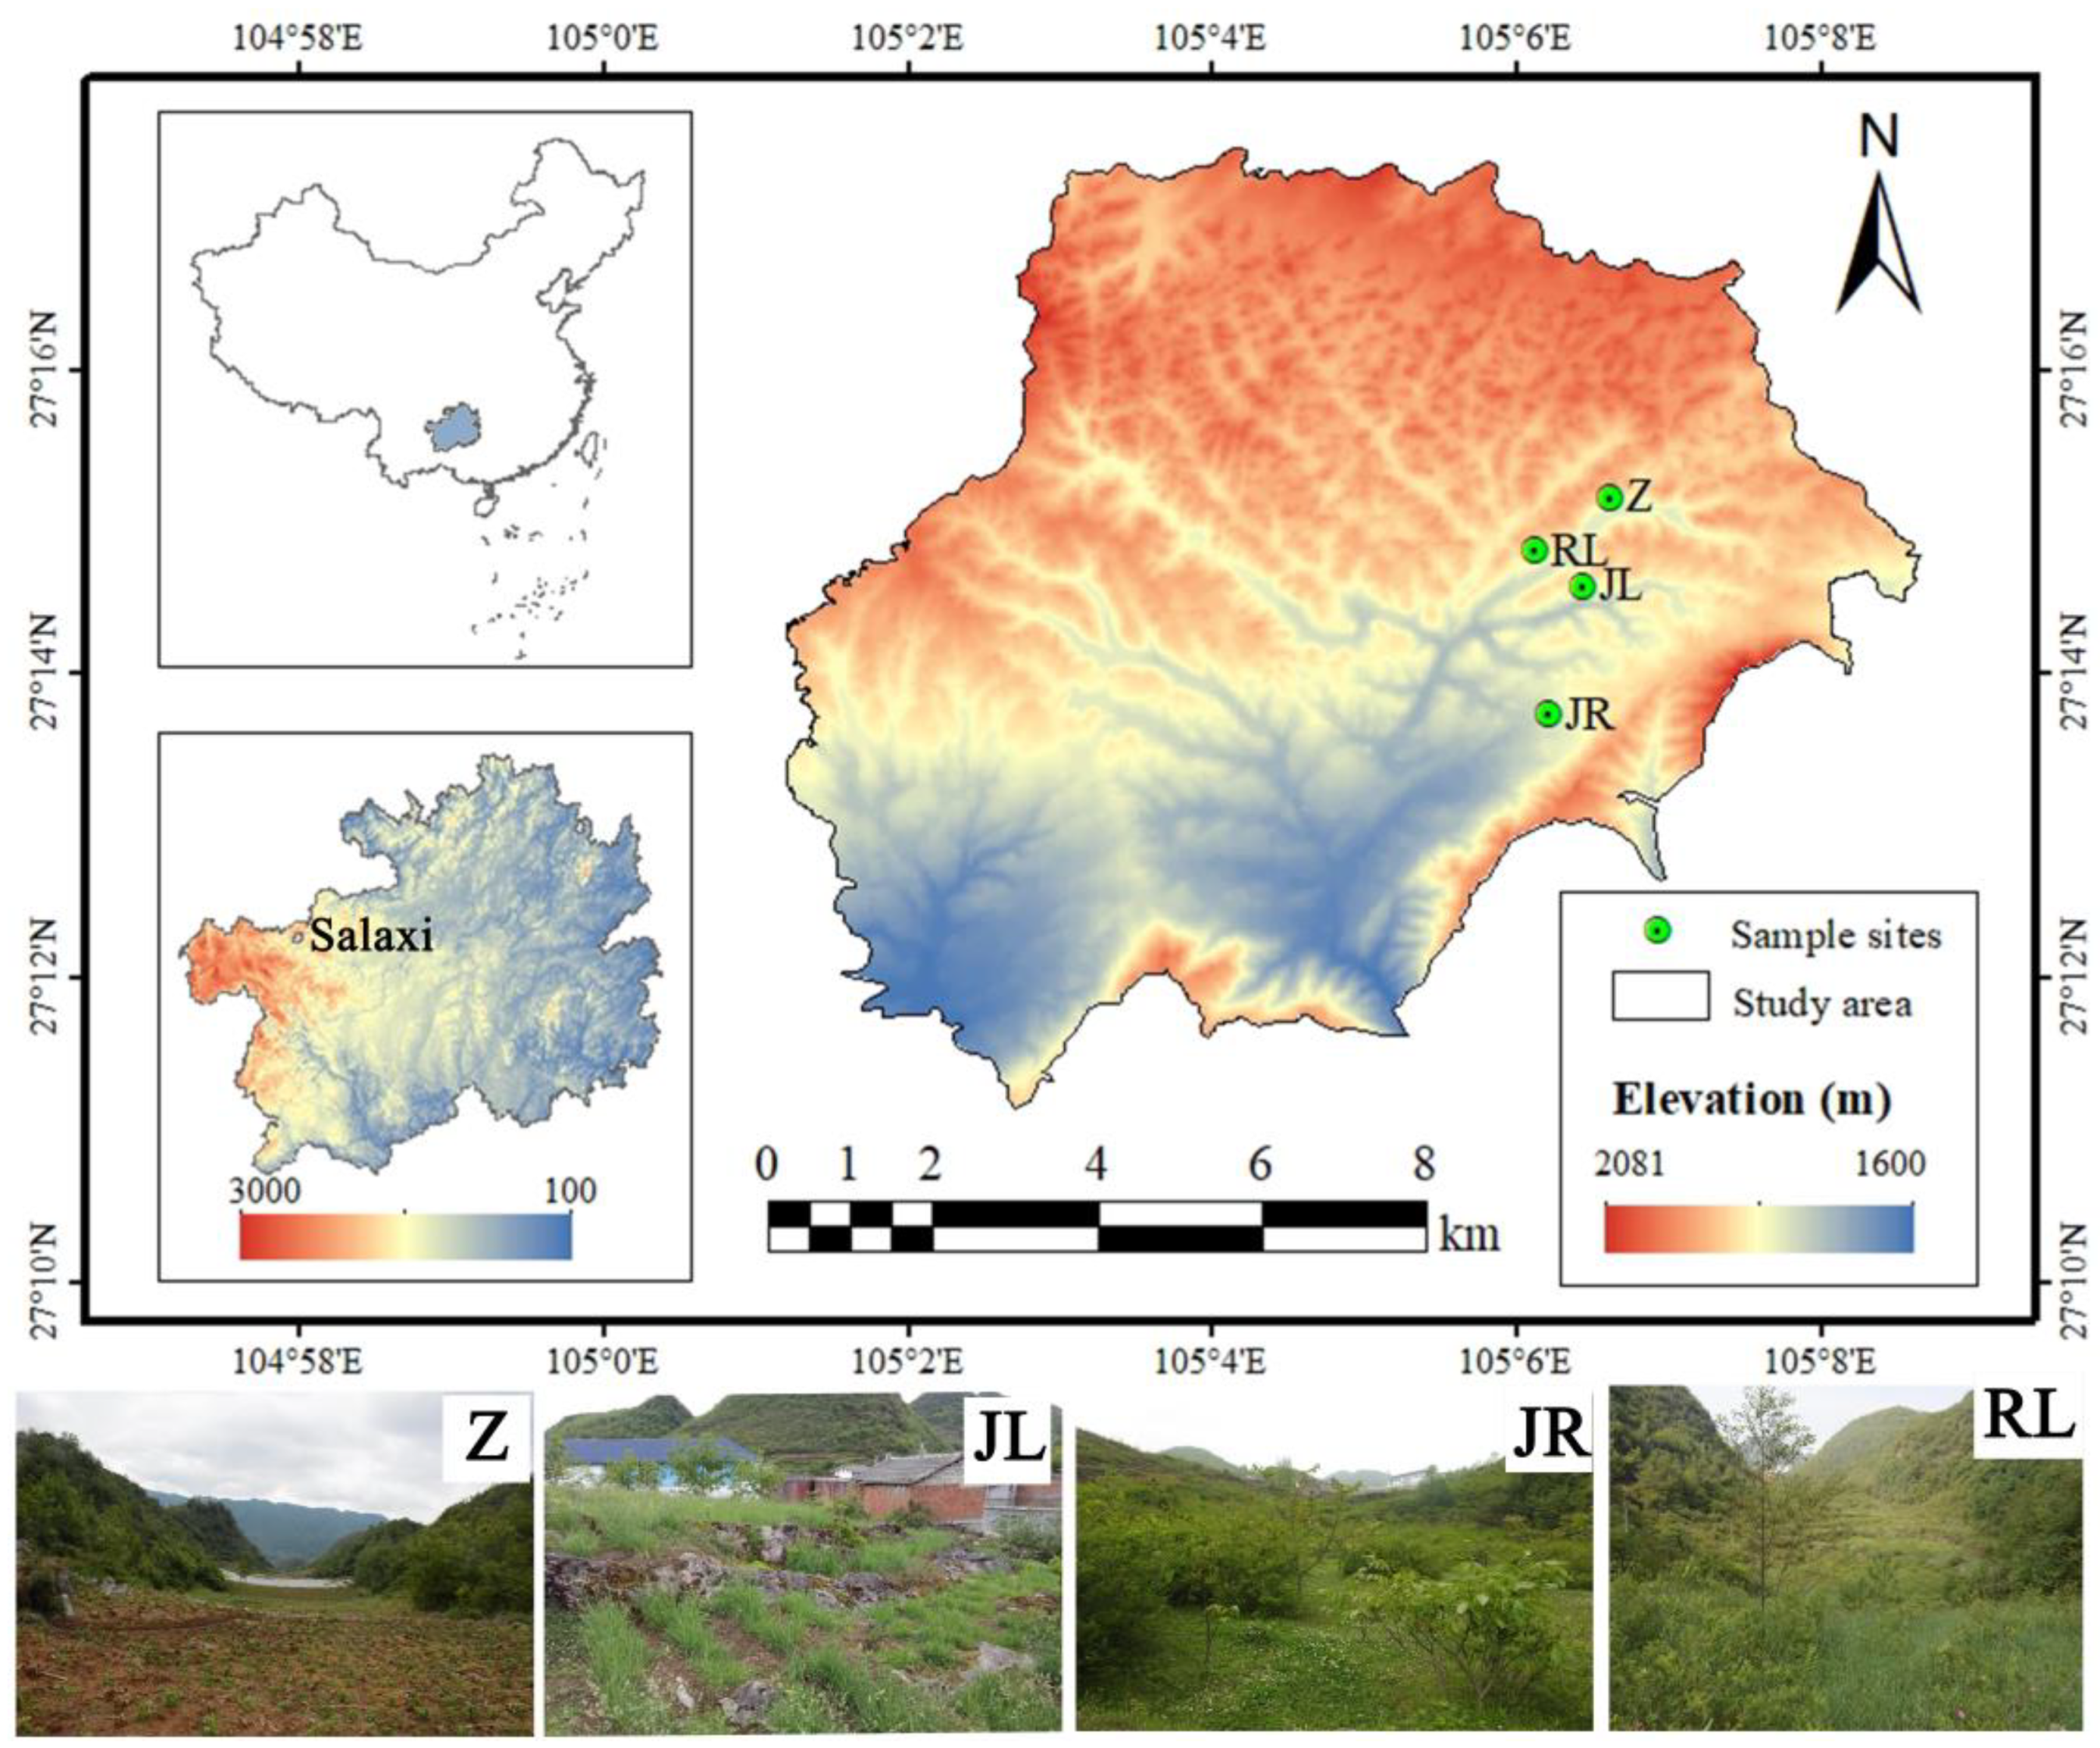
Figure 1. The location of the study area and the distribution of sample sites.
Forests 14 01356 g001
Figure 2. Soil aggregate particle size distribution characteristics. Note: various lowercase letters indicate significant differences (p < 0.05) in the same soil layer at various sites for the same grain size, as shown below.
Forests 14 01356 g002
Figure 3. Distribution characteristics of MWD, GMD, and Dm values of soils. Note: various Minuscule indicate significant differences (p < 0.05) in the same soil layer at different locations.
Forests 14 01356 g003
Figure 4. Distribution characteristics of soil PAD and erodibility K values. Note: various Minuscule indicate significant differences (p < 0.05) in the same soil layer at different locations.
Forests 14 01356 g004
Figure 5. Nutrient content distribution characteristics of soil aggregates. Note: (a) SOC content in aggregates; (b) TN content in aggregates; (c) TP content in aggregates. Various lowercase letters indicate significant differences (p < 0.05) in the same soil layer at various sites for the same grain size.
Forests 14 01356 g005
Figure 6. Comparison of aggregate structure and nutrients under different land use patterns. Note: (a) Soil aggregates particle size; (b) Soil aggregate stability; (c) Soil aggregate nutrients.
Forests 14 01356 g006
Table 1. Basic information about the sample plot.
Land Use TypeLongitudeLatitudeAltitude/mSlope Inclination/◦Slope AspectLand Use
Zea mays L. (Z)105°06′38″E27°15′10″ N176017Half shady slopeStill growing Zea mays L.
Rosa roxburghii Tratt.-Lolium perenne L. (RL)105°06′08″E27°14′49″ N182616Half shady slopeReforestation in 2010
Juglans regia L.-Lolium perenne L. (JL)105°06′27″E27°14′35″ N189219Half shady slopeReforestation in 2010
Juglans regia L.-Rosa roxburghii Tratt. (JR)105°06′13″E27°13′44″ N175114Half shady slopeReforestation in 2009
Table 2. Correlation of aggregate size with the soil structure and stability indicators.
LMASMAMIASCASSTKLMANSMANMIANSCAN
LMA1−0.55 **−0.74 **0.360.83 **−0.61 **0.63 **0.56 **0.53 **0.40
SMA 1−0.15−0.06−0.14−0.12−0.17−0.05−0.060.14
MIA 1−0.42 *−0.87 **0.82 **−0.63 **−0.64 **−0.60 **−0.60 **
SCA 10.51 *−0.360.54 **0.47*0.58 **0.51 *
SST 1−0.90 **0.61 **0.59 **0.60 **0.55 **
K 1−0.52 **−0.55 **−0.56 **−0.56 **
LMAN 10.95 **0.91 **0.82 **
SMAN 10.95 **0.89 **
MIAN 10.92 **
SCAN 1
Note: The use of an asterisk indicates statistically significant differences. * p < 0.05; ** p < 0.01.
Disclaimer/Publisher’s Note: The statements, opinions and data contained in all publications are solely those of the individual author(s) and contributor(s) and not of MDPI and/or the editor(s). MDPI and/or the editor(s) disclaim responsibility for any injury to people or property resulting from any ideas, methods, instructions or products referred to in the content.