Article

Production, Concentration and Flux of Major and Trace Elements in Juniperus przewalskii Litter of the Qilian Mountains, China

1
State Key Laboratory of Herbage Improvement and Grassland Agro-Ecosystems, Key Laboratory of Grassland Livestock Industry Innovation, Ministry of Agriculture and Rural Affairs, Engineering Research Center of Grassland Industry, Ministry of Education, College of Pastoral Agriculture Science and Technology, Lanzhou University, Lanzhou 730000, China
2
Key Laboratory for Environmental Pollution Prediction and Control, Gansu Province, College of Earth and Environmental Sciences, Lanzhou University, Lanzhou 730000, China
*
Author to whom correspondence should be addressed.
Forests 2023, 14(7), 1364; https://doi.org/10.3390/f14071364
Submission received: 9 June 2023 / Revised: 28 June 2023 / Accepted: 30 June 2023 / Published: 2 July 2023
(This article belongs to the Special Issue Trace Elements Biogeochemical Cycling in Forests Ecosystem)

Abstract

:
Forest litter is an important guarantee for maintaining forest soil fertility and circulating material in forest ecosystems. The input of litter plays an important role in soil organic matter formation and biogeochemical cycles in forest ecosystems. However, the production and elements concentrations of Juniperus przewalskii (JP) litter in the Qilian Mountains are still unknown. In this study, we investigated the production of needle, branch and bark, cone, and impurity litters. We determined the concentrations and fluxes of major (K, Mg, Al, and Fe) and trace (Na, Mn, Zn, Cr, Ni, Cu, Pb, Co, Cd, and Ag) elements in needle litter of JP from September 2020 to August 2021. The results showed that the annual litter production was 4040.74 ± 495.96 kg ha−1 a−1. Needle and cone litters were the main components of the total litter production. The major elements (MEs) and trace elements (TEs) fluxes of litter were consistent with the litter production trend. The concentrations and fluxes of MEs and TEs in needle litter decreased in the order: K > Mg > Al > Fe > Na > Mn > Zn > Cr > Ni > Cu > Pb > Co > Cd > Ag. These results have important implications for understanding the migration processes of MEs and TEs in forest ecosystems of the Qilian Mountains.

Graphical Abstract

1. Introduction

Litter refers to all organic matter produced by plants in the ecosystem and returned to the soil surface. As the main source of soil organic matter [1], litter can build soil texture, maintain primary production, and regulate microbial metabolism [2,3,4]. Several studies have demonstrated that litter decomposition is the main driving force of soil carbon (C) input and nutrient cycling in the forest ecosystem. In most ecosystems, more than 90% of nitrogen (N) and phosphorus (P), 60% of nutrient elements are absorbed from litter [5,6]. Therefore, it is of great significance to understand the production dynamics, nutrient fluxes, and decomposition process of litter in various ecosystems.
Forest litter is the organic matter produced by the forest and returned to the soil surface. It can be divided into different components such as needle, branch, bark, cone, and impurity (moss, tree debris, insect carcasses, and animal feces, etc.) [7]. Litter is an important guarantee for maintaining forest soil fertility and vegetation regeneration [1]. It can also promote nutrient circulation and energy flow [8,9]. In recent years, most studies focused on litter production dynamics [10,11], mixed decomposition [12,13], factors affecting the decomposition rate [14,15], and the nutrient release mechanism of litter [9,16]. Previous studies demonstrated that the production of forest litter varies with climate and forest category [17]. Forest litter production was highest in broad-leaved forests (57%), followed by coniferous forests (25%) and other forests (18%) [6]. Leaf litter accounts for the largest proportion of litter components and accounts for 60–80% of the total litter amount [18]. It is necessary to understand the production of forest litter and the concentrations of major elements (MEs) and trace elements (TEs) returning to forest ecosystems.
Plants are rich in nutrient elements to sustain the activity of plant growth. After the plant wilt, the nutrients are released to the soil by leaching and decomposition, which are reabsorbed and utilized by plants. Therefore, forest litter has the potential to accelerate the biogeochemical cycling of nutrients in forest ecosystems. C, N, and P are the nutrient elements of plants, which are the major constraint on forest growth and productivity [19]. C is the basic building block of living organisms, accounting for more than 50% of all elements. N is the component of chlorophyll in plants [13]. P can enhance plant resistance and promote root growth [20]. Elements with concentrations > 1000 mg kg−1 in plants are MEs and elements with concentrations < 100 mg kg−1 are TEs [21]. Different elements play different roles in the plant growth period, and the demand for elements is different in each growth stage. MEs refer to the essential nutrient elements required for the growth and development of plants [9]. They are crucial to respiratory metabolism, redox, and other processes in plants [22]. TEs are also indispensable in the process of plant growth, the content of TEs in plants is very low, but lack or excess of some elements will cause plant physiological abnormalities [9]. Many studies have examined that Cu, Mn, Zn, and Ni as essential TEs, have a certain concentration range. If the content exceeds the critical value, it may lead to plant physiological disorders, cause acute or chronic toxicity, and block the growth and development of plants [23,24]. At present, the study of elements in the litter mainly focused on the concentrations of C, N, and P in the litter, and the effect of element addition on the decomposition rate of litter [20,25]. However, studies on the MEs and TEs in the litter of forest ecosystems are poorly understood, which has greatly precluded the study of TEs and MEs regression in the litter.
The Qilian Mountains are located at the border of Gansu and Qinghai Provinces in China. Forest is the dominant ecosystem of the Qilian Mountains. It plays an indispensable role in responding to climate change, sustainable area ecological stability, and water conservation. Forest of the Qilian Mountains covering 5864.15 km2, Picea crassifolia and Juniperus przewalskii (JP) are the dominant species. However, there are few studies on the MEs and TEs of forest litter in the Qilian Mountains. We hypothesized that different litter components showed different seasonal dynamics, and needle litter accounted for the largest proportion of total litter production. The concentration range of MEs and TEs in the needle litter of JP is still not definite. To validate the hypothesis and solve the problem, we conducted a one-year litter collection experiment in a JP sample plot in the Tianlaochi catchment of the Qilian Mountains. The purposes were to (1) investigate the monthly dynamics of litter production in the JP forest; (2) analyze the concentrations and fluxes of MEs and TEs in needle litter. Information from this study can help to assess the biomass and nutrient cycling of litter in the area.

2. Materials and Methods
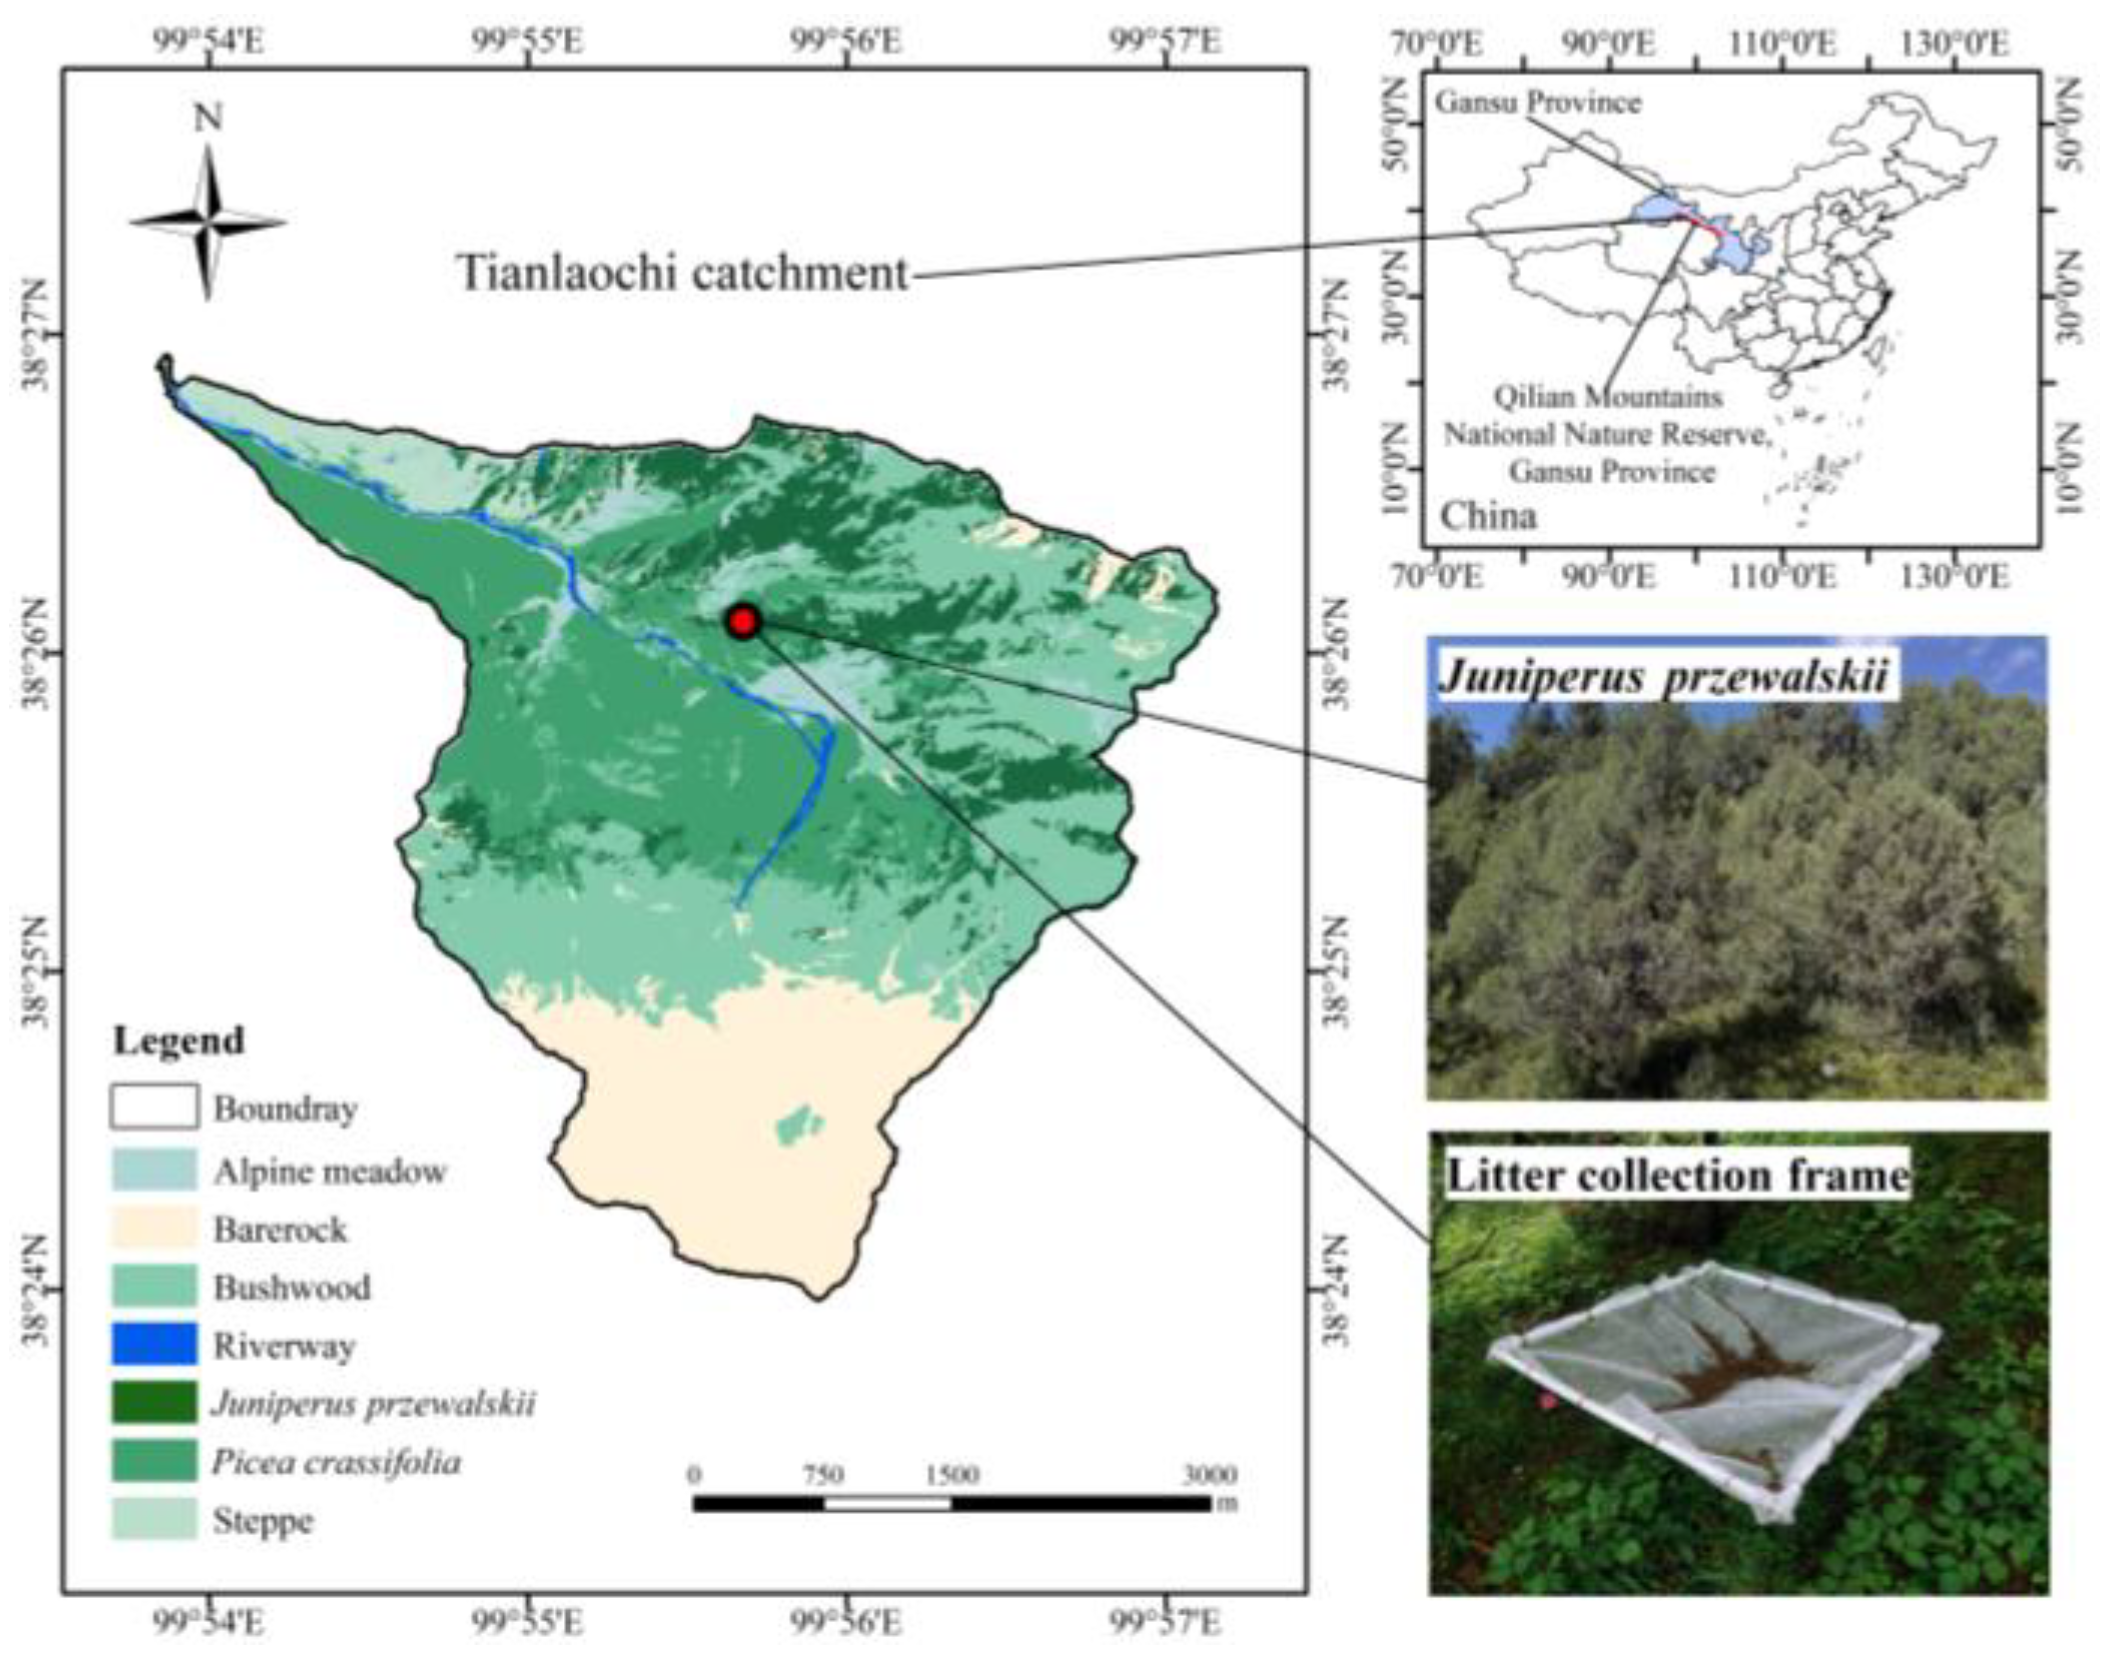
2.1. Study Site

The Qilian Mountains are located in the Gansu and Qinghai provinces of China and are one of the prominent mountains. The experimental site is located in the Tianlaochi catchment (38°23′58″–38°26′56″ N, 99°53′50″–99°57′10″ E) of the central Qilian Mountains (Figure 1). The catchment covers an area of 12.8 km2, and an elevation of 2650–4450 m. The mean annual temperature of the catchment is 0.6 °C. The relative humidity is 59%. The mean annual precipitation is 535.9 mm from 2014 to 2019 [26]. The precipitation concentrated from May to September, more than 80% occurred during the whole year. The climate is classified as semi-arid alpine [27]. The dominant vegetation types are Picea crassifolia, JP, Potentilla fruticasa, Spiraea alpina Pall, Caragana jubata, and Salix gilashanica. With the elevation increasing, the distribution of vegetation types formed a significant vertical differentiation law. From high to low elevation, there are meadows, shrubs, forests, and grasslands. Forest is the main ecosystem in the catchment. The dominant forest species are Picea crassifolia and JP. The area of the two forests is 3.25 and 1.71 km2 [26,28]. JP is sensitive to climate change but can adapt to harsh environmental conditions and tolerate cold and drought. In the Qilian Mountains, JP occupies 13.34% of the land area of the catchment and is widely distributed on the sunny slopes at the elevation of 2700–3250 m [27]. JP can reach 12 m tall and live for more than 100 years.

2.2. Experimental Design

This experiment was located in JP plot (20 m × 20 m) at the elevation of 3050 m above sea level in the Tianlaochi catchment. We selected six litter collection sites randomly in the plot as six replicates. Litter samples were collected by collection frames, which were composed of polyvinyl chloride tubes and nylon mesh with 1 mm aperture. The area of each frame is 0.49 m2 (70 cm × 70 cm). The collection frames were fixed to the surrounding tree trunks with ropes, and they were about 1 m from the ground. We collected the litter samples every month from September 2020 to August 2021. The samples were brought back to the lab for indoor analysis.

2.3. Sample Pretreatment

When collecting samples in the field, we wore rubber gloves to put all litter inside the frame into polyethylene ziplock bags. We placed all the litter into the envelope immediately after returning to the lab. Litter samples were sequentially dried at 60 °C to a constant weight, and then they were sorted by needle, branch and bark, cone, and impurity. The litter production and components in each month were recorded. The dried samples were ground with a grinder and passed through a 100 mesh nylon sieve and stored in polyethylene ziplock bags for chemical analysis. Because the mountain was inaccessible in winter, it is difficult to collect samples, so we collected litter samples once from October 2020 to April 2021. Six duplicate collection frames were collected monthly, classified into four different components, with 144 samples in total.

2.4. Chemical Analysis

We selected needle litter to determine the concentrations of MEs (K, Mg, Al, and Fe) and the TEs (Na, Mn, Zn, Cr, Ni, Cu, Pb, Co, Cd, and Ag). Because the production of needle litter was the most stable and accounted for the highest percentage. The dry needle samples (0.2 g) were mixed with 8 mL HNO3 and 2 mL H2O2 in a digestion tube for 120 min. The mixture was then digested in a microwave digestion instrument (Multiwave PRO, Anton Paar, Austria). The concentrations of MEs (Mg, Al, K, and Fe) and TEs (Na, Cr, Mn, Co, Ni, Cu, Zn, Ag, Cd, and Pb) in needle litter were determined by inductively coupled plasma mass spectrometer (ICP-MS, Agilent 7800, USA). We used blank samples, duplicate samples, and standard reference samples of wheat (GBW10046 (GSB-24)) for quality control. In plant standard reference samples, the recoveries of Mg, Al, K, and Fe were 101.5, 88.3, 94.6, and 97.3%, respectively. The recoveries of Na, Cr, Mn, Co, Ni, Cu, Zn, Ag, Cd, and Pb were 97.6, 91.8, 96.2, 95.3, 101.4, 104.7, 104.7, 92.9, 96.8, and 86.8%, respectively. The blank samples were lower than the detection limit of the instrument.

2.5. Data Analysis

The litter production, element concentration, and element flux were calculated by the following equation:
M = m / S × 10
where M is the litter production (kg ha−1), m is the mass of the litter (g), and S is the area of the litter collection frames (0.49 m2).
W = ρ × V × D / m
where W is the measured element concentration in the litter (mg∙kg−1), ρ is minus the concentration of blank test solution (mg∙L−1), V is the constant volume of the test liquid (25 mL), D is the dilution ratio of the sample before determination, and m is the weight of the plant sample (0.2 g).
M e = W × M × 10 3
where Me is the element flux (kg∙ha−1), and 10−3 is the unit conversion factor.
The data were processed by Excel 2016, and the results were presented by the mean value and standard deviation. One-way ANOVA was used to analyze the litter production of JP and its components by SPSS 27.0. The map of the study area was produced using ArcGIS 10.8.

3. Results

3.1. Monthly Dynamics of Litter Production

The litter production of JP was calculated for one year in the Tianlaochi catchment, exhibiting marked seasonal variations from September 2020 to August 2021 (Figure 2). Needle litter was the most productive component in July, August, and September, accounting for 85.16%, 87.39%, and 70.41% of total litter production, respectively. Cone litter dominated the litter production from October to June, accounting for 31.47%–47.25% of total litter production. In August, needle litter production was the highest at 1225.67 ± 266.14 kg ha−1, significantly higher than other months (p < 0.05), while the lowest needle litter production was 65.82 ± 36.18 kg ha−1 in May. The production of branch and bark litter was 204.45 ± 61.60 kg ha−1 in October–April, significantly higher than in other months (p < 0.05), with the lowest production of 45.66 ± 18.04 kg ha−1 in June. There was no significant difference in cone litter production among different months (p < 0.05). Nevertheless, the production of impurities was significantly higher in October–April than in other months (p < 0.05).
In this study, we compared the annual litter production of twelve forest species (Table 1). Results showed that the litter production varied greatly among different forest species. In the coniferous forests, the litter production decreased in the order: Casuarina equisetifolia > Pinus elliottii > JP > Abies faxoniana > Abies pindrow. In the broad leaved forests, the litter production decreased in the order: Sonneratia caseolaris > Kandelia candel > Betula utilis > Kandelia obovata. Our study found that the JP forest has a relatively high annual production of needle litter compared to other forests, such as Abies pindrow. However, the annual production of needle litter in the JP forest was lower than Casuarina equisetifolia and Pinus elliottii. The annual production of branch and bark litter in the JP forest was lower than Camphor tree and masson pine mixed forest and Betula pendula and Quercus robur mixed forest. The JP forest had a higher annual production of cone litter compared to Camphor tree and masson pine mixed forest and Kandelia obovata, but the cone litter production of JP was lower than that of Abies pindrow and similar to Betula pendula and Quercus robur mixed forest. The annual production of impurity litter in the JP forest was lower than Camphor tree and masson pine mixed forest, Casuarina equisetifolia, and Betula utilis, but higher than Abies faxoniana. Apart from Abies pindrow, needle litter accounted for 65%–83% of the total litter production, branch and bark accounted for 7%–16%, and impurities accounted for 4%–7%.

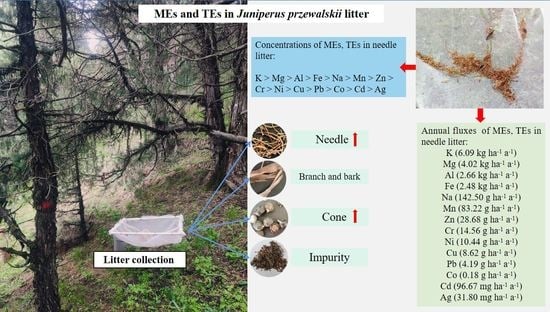
3.2. Concentrations and Fluxes of MEs in Needle Litter

The concentrations of the MEs ranged from 2.15 to 4.57 g kg1 for K, 1.43 to 1.74 g kg1 for Mg, 0.98 to 1.47 g kg1 for Al, and 0.86 to 1.37 g kg1 for Fe. Figure 3 displayed the concentrations of MEs in the needle litter of JP, with K exhibiting the highest concentrations, followed by Mg, Al, and Fe. The concentrations of these MEs varied significantly with time, with K (4.57 ± 2.48 g kg1) and Mg (1.75 ± 0.17 g kg1) exhibiting significantly higher concentrations in needle litter during October–April compared to other months (p < 0.05). Moreover, the concentrations changes of Al and Fe were consistent. Al (1.47 ± 0.14 g kg1) and Fe (1.37 ± 0.13 g kg1) concentrations were significantly higher in June than in other months (p < 0.05), while Al (0.91 ± 0.01 g kg1) and Fe (0.86 ± 0.06 g kg1) concentrations reached their lowest levels in August.
In Figure 4, the needle litter of JP exhibited the highest fluxes in K, followed by Mg, Al, and Fe. These MEs showed a consistent trend throughout the year, with their monthly fluxes decreasing in the following order: August > July > September > October–April > June > May. Significantly higher fluxes of K (2.71 ± 1.48 kg ha1), Mg (1.79 ± 0.31 kg ha1), Al (1.11 ± 0.01 kg ha1), and Fe (1.05 ± 0.03 kg ha1) were observed in the needle litter during August compared to other months (p < 0.05). On the other hand, significantly lower fluxes of K (0.17 ± 0.05 kg ha1), Mg (0.09 ± 0.01 kg ha1), Al (0.09 ± 0.02 kg ha1), and Fe (0.08 ± 0.02 kg ha1) were observed in May compared to other months (p < 0.05).

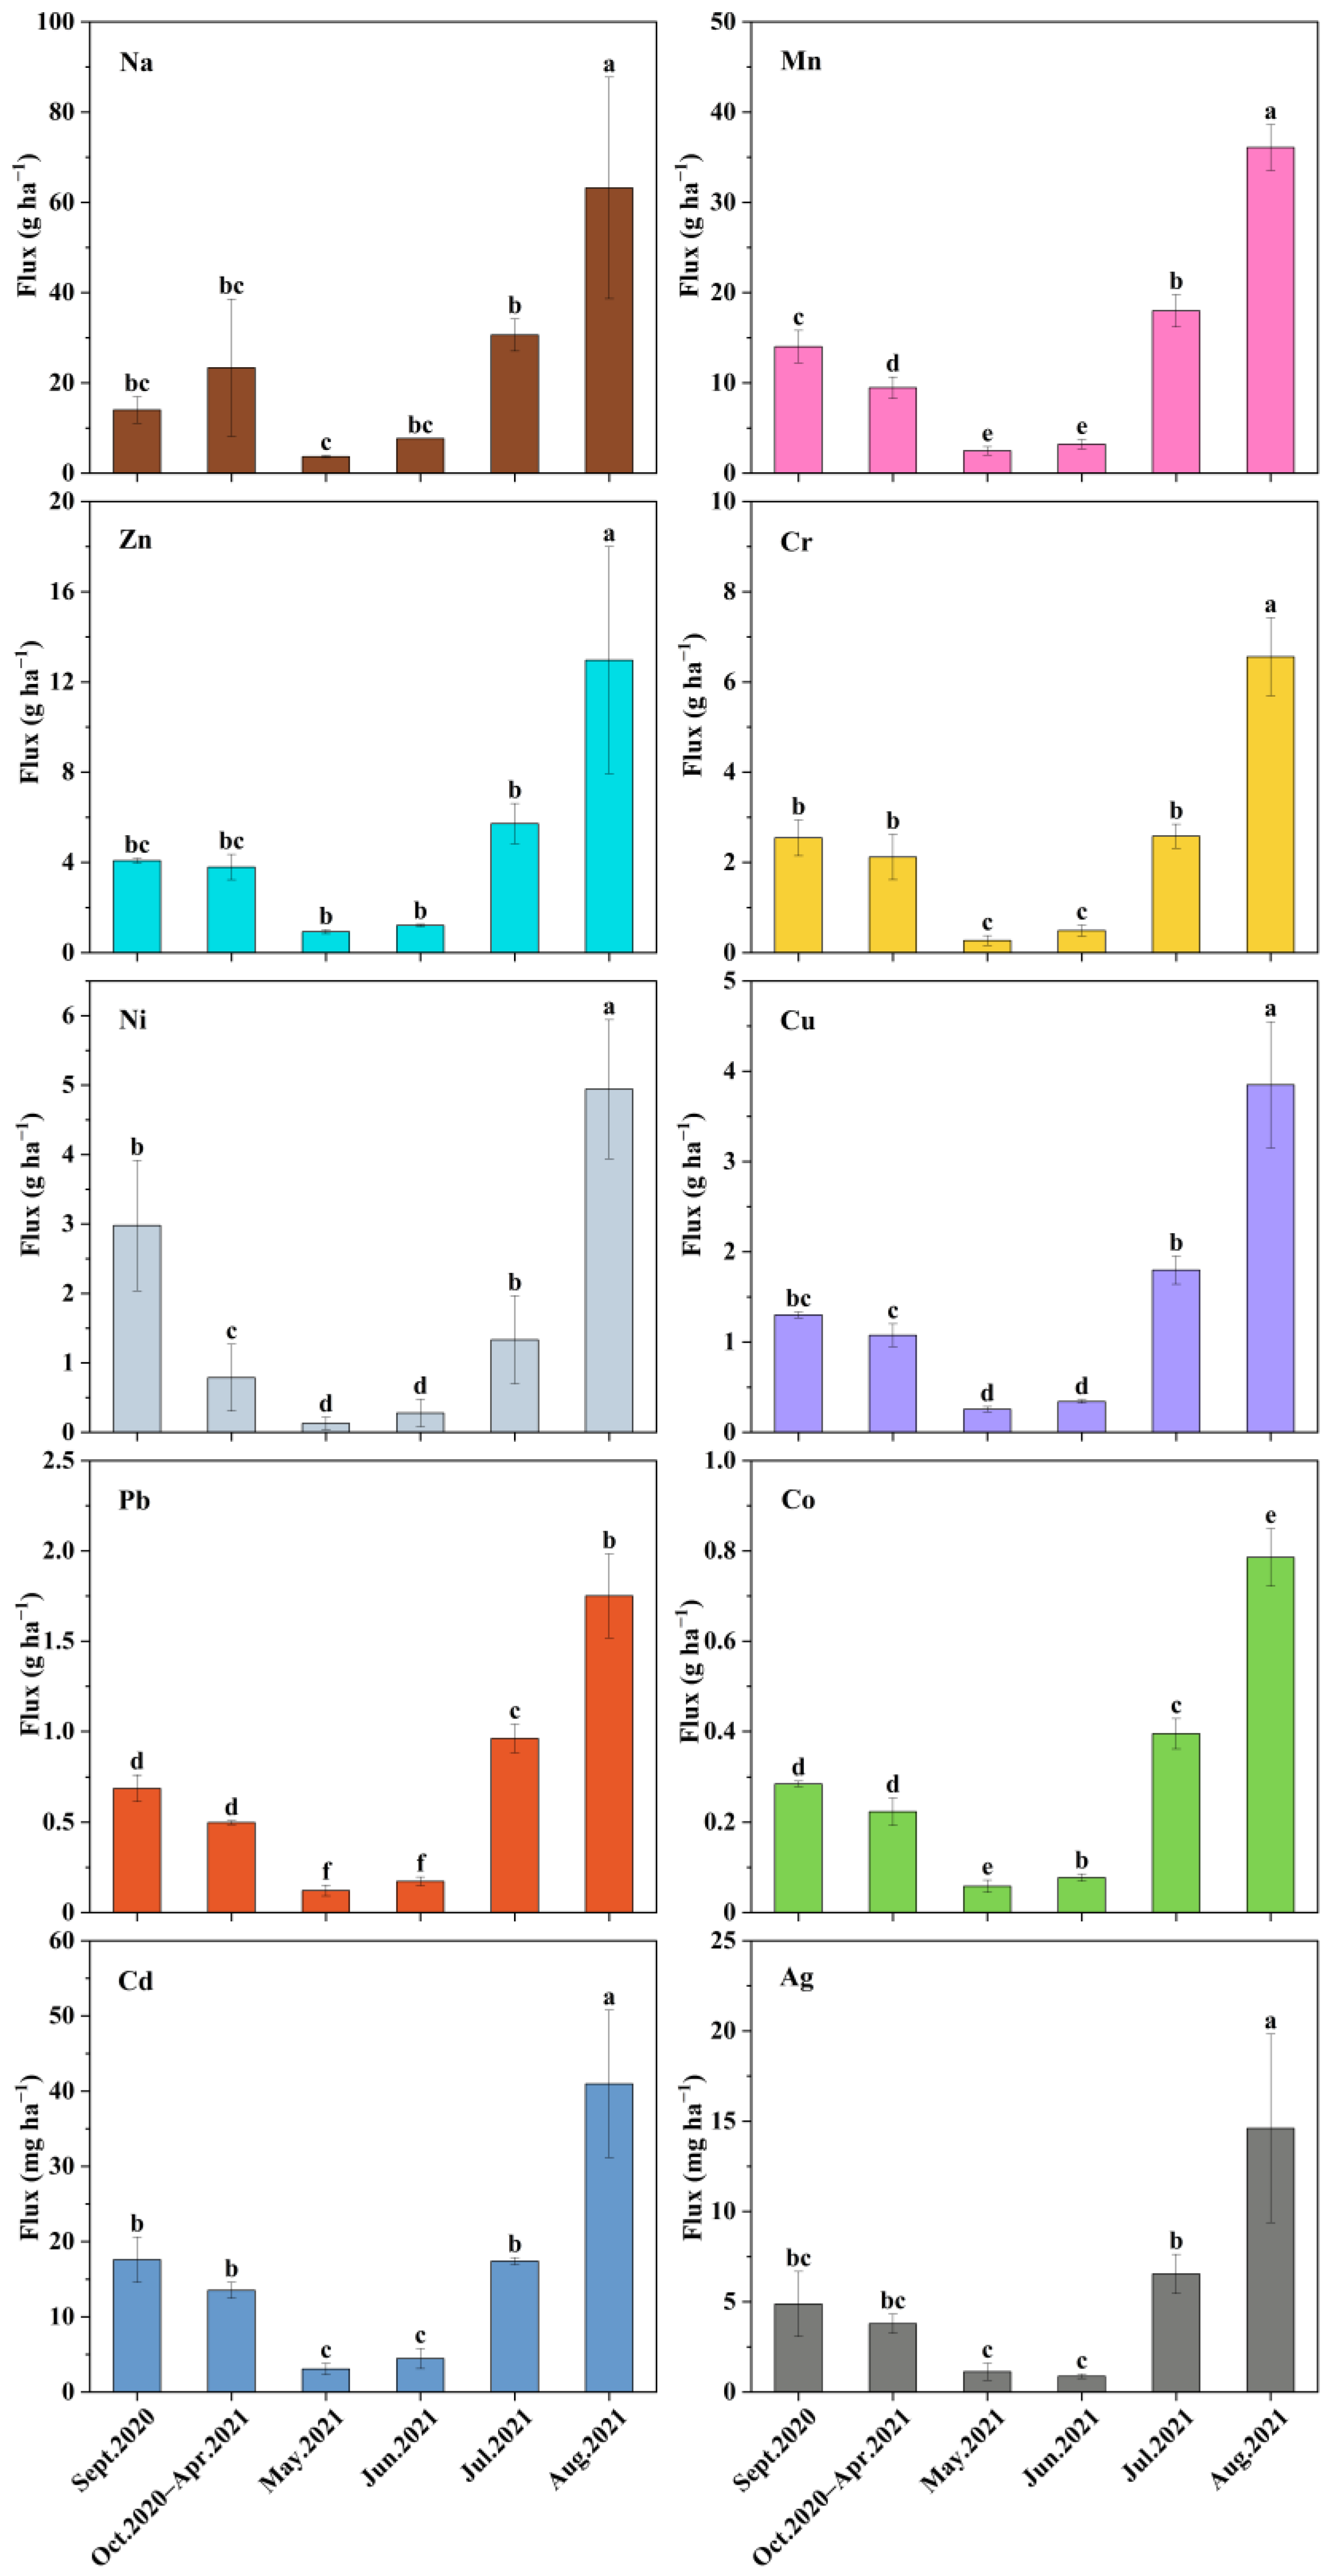
3.3. Concentrations and Fluxes of TEs in Needle Litter

The TEs concentrations in needle litter of the JP varied significantly (p < 0.05, Figure 5). The concentrations of Na in needle litter were the highest, followed by Mn, Zn, Cr, Ni, Cu, Pb, Co, Cd, and Ag. The concentrations of Mn, Zn, Cu, Co, and Cd were the highest in June. The concentrations of Mn, Zn, Cu, Co, and Cd were lowest in July (p < 0.05). The concentrations of Mn, Co, Zn, Cd, and Pb in June were significantly higher than in other months.
Figure 6 showed that the TEs fluxes in needle litter of the JP varied significantly among months. The monthly fluxes of all TEs were significantly higher in August than in other months (p < 0.05). They were decreased in the order: Na (63.20 ± 24.52 g ha−1) > Mn (36.08 ± 2.55 g ha−1) > Zn (12.97 ± 5.03 g ha−1) > Cr (6.56 ± 0.87 g ha−1) > Ni (3.98 ± 1.00 g ha−1) > Cu (3.85 ± 0.70 g ha−1) > Pb (1.75 ± 0.23 g ha−1) > Co (0.79 ± 0.06 g ha−1) >Cd (40.96 ± 9.80 mg ha−1) > Ag (14.61 ± 5.22 mg ha−1). The fluxes of Na, Mn, Zn, Ni, Cr, Cu, Pb, Co, and Cd were significantly lower in May than in other months (p < 0.05). The fluxes of Ag were significantly lower in June than in other months (p < 0.05).

4. Discussion

4.1. Litter Input and Composition

Litter serves as a crucial source of soil organic carbon and nutrient supplements [31,32] and can demonstrate the ecosystem productivity of forest areas. Previous studies have indicated that litter input declines with both increasing latitude and altitude [9]. Furthermore, factors such as precipitation, temperature, tree species, and wind speed have significant effects on litter production [11,33,34]. Previous studies have identified three distinct patterns of monthly dynamics in litter production: unimodal, bimodal, and irregular [35]. In our study, the litter production of JP was highest in August. This can be attributed to the substantial amount of precipitation in the catchment during this period [26], which accelerated the forest metabolism and prompts new needle growth while shedding older needle. Additionally, wind can increase litter production by blowing dead matter from the forest canopy [11]. From October to April, the catchment enters a snow-covered season characterized by dormancy in plant growth [36]. As a result, litter production during this period was relatively stable and low. Several previous studies have confirmed that autumn is a prolific season for litter production in many tree species [33], as it marks a reduction in available nutrients and water sources. To prepare for winter, leaves are shed and stored nutrients in the roots, indicative of forest adaptations to ecological environments [37,38,39,40].
The composition of litter production is influenced by both biotic and abiotic factors. Previous studies have concluded that needles account for 60%–80% of total litter production [17,33,41], which is similar to our study of 65.33% [18]. The total production of needles and litter had a similar shed pattern, which also illustrates the above conclusion from another aspect. Litter composition is an integral factor that affects nutrient returns [9]. In our study, needle litter was the primary component from July to September, given that litter material does not fall immediately after death or maturity; instead, they fall in large quantities during strong winds or rainfall events [40,42]. From October 2020 to June 2021, the cone became the main component due to differences in organ growth periods and rates of growth, given their allometric growth relationships [43]. The activity of insects and birds in the forest also produces residues such as feces and carcasses, increasing the production of impurities in the litter. Litter inputs can intercept water and reduce surface evapotranspiration [44], while their decomposition can increase SOC and adjust soil structure [2,6]. So, litter played a vital role in maintaining the stability of the forest ecosystem’s structure and function. Understanding litter production patterns is important for ecosystem management and conservation. The findings suggest that JP forests have unique litter production characteristics, which may reflect differences in tree species, climate, and other environmental factors [11,30,33,34]. As litter decomposes, it releases nutrients back into the soil, enriching the nutrient pool and supporting the growth of plants and microorganisms. The organic carbon contained in litter also contributes to the overall carbon storage of the forest ecosystem. Continuous monitoring of litter production patterns in JP forests and other forests is, therefore, critical to investigating the potential impacts of climate change and other influence factors.

4.2. Element Concentrations and Fluxes of the Needle Litter

The concentrations of TEs in JP have decreased in the order: Na > Mn > Zn > Cr > Ni > Cu > Pb > Co > Cd > Ag. While Al is highly toxic to plant roots, the rate of Al transfer to leaves is low for most plant species [45]. Only a few species have cumulative concentrations of Al in their leaves exceeding 1.00 g kg−1 [46]. In our study, the concentrations of Al in the needle ranged from 0.9 to 1.5 g kg−1, which was slightly above the study of Kopittke [46]. Cr concentrations in plants typically range between 1 and 5 mg kg−1. Pb concentrations in the needle ranged from 0.04 to 1.67 mg kg−1 [47]. Cd concentrations in the needle were 0.1–0.9 mg kg−1. Co concentrations in higher plant tissues have been reported to be usually below 1 mg kg−1. Ni concentrations in needles generally do not exceed 5 mg kg−1 [48,49]. Based on our results, it can be concluded that the concentrations of Ni and Cr of needle litter in this study area were high. In contrast, Cd concentrations were low, and Co concentrations were similar to the previous study [49]. Mn, Zn, Ni, and Cu are all essential TEs for the forest, and they play crucial roles in soil and nutrient cycling, protein activity, and redox reactions [22,50]. They are also involved in many physiological and biochemical processes [21,51,52]. The experimental data showed that the concentrations of TEs vary widely. Forest has evolved adaptive strategies to spontaneously activate homeostatic mechanisms. Adequate amounts of essential TEs are taken up according to normal growth and developmental requirements. To accumulate in cells, TEs are isolated via the soil layer by root uptake and then transported to the lignin and above-ground parts, and finally into cells. Each step requires a complex interaction of chelating compounds and transporters that affect the rate of TE accumulation [21,53]. In addition, TEs can enter organic soils through atmospheric deposition [54,55]. Then passes to the needles, where the concentrations of TEs in the needles are increased.
In addition, we observed that the fluxes of TEs and MEs in July, August, and September were generally higher than in other months. This was consistent with the previous study [9], and it was likely due to increased photosynthesis leading to higher needle metabolism and subsequently increased TE and ME flow [56,57]. Toxic elements were also found to be transferred to senescing parts before litter fall [58,59,60,61]. Additionally, our study revealed that the monthly dynamics of TE and ME fluxes and litter production in JP needle litter were generally consistent, indicating that litter production affects MEs and TEs fluxes [57]. We have calculated the annual fluxes of needle litter in the JP forest. Our results showed that the annual fluxes of K, Mg, Al, and Fe in needle litter were 6.09 ± 2.66, 4.02 ± 0.77, 2.66 ± 0.16, and 2.48 ± 0.15 kg ha−1 a−1, respectively, which were higher than those of Abies faxoniana [9,61]. The results showed that the JP forest ecosystem has a higher MEs cycle rate and stronger productivity. We observed annual fluxes of Na, Mn, Zn, Cr, Ni, and Cu in JP litter of 142.50 ± 46.47, 83.22 ± 8.30, 28.68 ± 6.73, 14.56 ± 2.26, 10.44 ± 3.99, and 8.62 ± 1.06 g ha−1 a−1, respectively. Additionally, the annual fluxes of TEs such as Pb, Co, Cd, and Ag were extremely low. They were 4.19 ± 0.45, 0.18 ± 0.16 g ha−1 a−1, 96.67 ± 16.46, and 31.80 ± 9.24 mg ha−1 a−1, respectively. Previous studies have shown that Pb and Co can inhibit leaf photosynthesis and nutrient absorption, leading to stunted forest growth and leaf yellowing [47,49]. Cd is a toxic heavy metal that easily accumulates in the soil and affects the growth and development of forests [62]. Ag as an antibacterial agent, can kill some microorganisms and affect the ecological balance of the forest [63]. Therefore, Pb, Co, Cd, and Ag have certain potential harm to the forest ecosystem. The annual fluxes of Pb, Co, Cd, and Ag in our study area were all very low. These results indicated that the JP forest in the Qilian Mountains is a healthy forest ecosystem with low pollution. In conclusion, our study provided valuable insights into the concentrations of MEs and TEs in needle litter in JP. The variations observed in these concentrations highlight the complex dynamics of ME and TE accumulation in forest ecosystems. Understanding the mechanisms and factors influencing ME and TE accumulation is crucial for assessing the ecological impacts and potential risks associated with elevated ME and TE concentrations in forest ecosystems. Further research in this area will contribute to our knowledge of ME and TE cycling and their effects on forest health and sustainability.

4.3. Novelty, Limitations, and Potential Implications

In this study, we investigated the dynamics of litter production in JP. The litter can be divided into four fractions according to their characteristics: needle, branch and bark, cone, and impurity. The concentrations and fluxes of MEs and TEs in the needle were analyzed, while previous studies focused on the concentrations of C, N, and P [19,56], which was different from our study. This study can be regarded as one of the most significant and essential works conducted in the Qilian Mountains forest ecosystem. It provided novel insights and study prospects to comprehend the MEs and TEs cycle in forest litter. But our study is still lacking in three limitations. First, we previously mentioned that we did not collect litter monthly due to natural reasons and only conducted a one-year experiment of litter collection without observing the annual variation. Second, we investigated only one elevation, and meteorological conditions vary greatly along the elevation. Therefore, multi-elevation investigations are very important. Third, our measurements of litter TEs and MEs were limited to the needle, while other litter fractions were not analyzed, which limited our ability to derive robust results for ME and TE concentrations of different litter compositions. It is very important to study litter production and TEs and MEs in forest litter. The nutrients in the litter are an important source of nutrients needed for forest growth [1]. The concentrations of TEs and MEs affect the healthy growth of forests and play a crucial role in improving forest nutrition and forest productivity. Our study can provide data for the study of MEs and TEs cycles in forest ecosystems. Further study in this area will help refine our understanding of the intricate relationships between litter production, climate, and forest productivity.

5. Conclusions

The monthly productions of the litter of each component were significantly different. Needle litter was most productive in July, August, and September. The cone was the most productive litter from October to June. For MEs, the highest concentration of K was 4.57 g kg−1 in October 2020, and the lowest concentration of K was 1.33 g kg−1 in September. The highest concentration of Fe was 1.37 g kg−1 in June 2021 and the lowest concentration of Fe was 0.86 g kg−1 in August 2021. For TEs, the highest concentration of Na was 100.93 mg kg−1 in June and the lowest concentration of Na 34.72 mg kg−1 in September. The fluxes of all MEs and TEs were highest in August and lowest in May. Future studies can focus on explaining how environmental factors, litter quality, soil properties, and decomposer organisms affect litter production and decomposition processes.

Author Contributions

Conceptualization, F.H., F.Z. and C.Z.; data curation, F.H. and N.L.; funding acquisition, F.Z. and X.Z.; investigation, X.Z.; methodology, F.H., F.Z. and Z.N.; Writing—Original draft, F.H.; Writing—Review & editing, F.H., F.Z., Z.N., S.W. and C.Z. All authors have read and agreed to the published version of the manuscript.

Funding

This work was funded by the National Natural Science Foundation of China (32271710), “Innovation Star” project of Gansu Province’s outstanding graduate students (2022CXZX-094), and Forestry and grassland science and technology project of Gansu Province (2021kj072).

Data Availability Statement

All data included in this study are available upon request by contact with the corresponding author.

Conflicts of Interest

The authors declare that they have no known competing financial interest or personal relationship that could have appeared to influence the work reported in this paper.

References

  1. Petraglia, A.; Cacciatori, C.; Chelli, S.; Fenu, G.; Calderisi, G.; Gargano, D.; Abeli, T.; Orsenigo, S.; Carbognani, M. Litter decomposition: Effects of temperature driven by soil moisture and vegetation type. Plant Soil 2019, 435, 187–200. [Google Scholar] [CrossRef]
  2. Schreeg, L.A.; Mack, M.C.; Turner, B.L. Nutrient-specific solubility patterns of leaf litter across 41 lowland tropical woody species. Ecology 2013, 94, 94–105. [Google Scholar] [CrossRef] [PubMed]
  3. Wang, J.; Liu, L.; Wang, X.; Chen, Y. The interaction between abiotic photodegradation and microbial decomposition under ultraviolet radiation. Global Chang. Biol. 2014, 21, 2095–2104. [Google Scholar] [CrossRef]
  4. Qin, Q.; Wang, H.; Li, X.; Xie, Y.; Lei, X.; Zheng, Y.; Yang, D.; Wang, F. Spatial heterogeneity and affecting factors of litter organic carbon and total nitrogen over natural spruce-fir mixed forests in northeastern China. Catena 2019, 174, 293–300. [Google Scholar] [CrossRef]
  5. Wei, X.; Blanco, J.A.; Jiang, H.; Hamish Kimminsc, J.P. Effects of nitrogen deposition on carbon sequestration in Chinese fir forest ecosystems. Sci. Total Environ. 2012, 416, 351–361. [Google Scholar] [CrossRef] [PubMed] [Green Version]
  6. Shen, G.; Chen, D.; Wu, Y.; Liu, L.; Liu, C. Spatial patterns and estimates of global forest litterfall. Ecosphere 2019, 10, e02587. [Google Scholar] [CrossRef] [Green Version]
  7. Li, Z.; Yan, W.; Zheng, W.; Liang, X.; Wang, G.; Zhu, F. Litter fall production and nutrient dynamic of Cinnamomum camphora and Pinus massoniana mixed forests in subtropics China. Acta Ecol. Sin. 2013, 33, 7707–7714. [Google Scholar]
  8. Kuzyakov, Y.; Friedel, J.K.; Stahr, K. Review of mechanisms and quantification of priming effects. Soil Biol. Biochem. 2000, 32, 1485–1498. [Google Scholar] [CrossRef]
  9. Wu, W.; Zhang, Y.; Wang, L.; Zhou, Y.; Chen, Y.; He, S.; Zhang, J.; Liu, Y. Litterfall and Element Return in an Abies faxoniana Forest in Tibet-A Five-Year Study. Forests 2021, 12, 1577. [Google Scholar] [CrossRef]
  10. Chen, L.; Zan, Q.; Li, M.; Shen, J.; Liao, W. Litter dynamics and forest structure of the introduced Sonneratia caseolaris mangrove forest in Shenzhen, China. Estuar. Coast. Shelf Sci. 2009, 85, 241–246. [Google Scholar] [CrossRef]
  11. Li, K.; Shi, Y.; Zhao, W.; Lin, Y.; He, Z. Litterfall production and dynamics of five coastal protective plantations. Chin. J. Appl. Environ. Biol. 2021, 28, 317–324. [Google Scholar]
  12. Dong, X.; Gao, P.; Zhou, R.; Li, C.; Dun, X.; Niu, X. Changing characteristics and influencing factors of the soil microbial community during litter decomposition in a mixed Quercus acutissima Carruth. and Robinia pseudoacacia L. forest in Northern China. Catena 2021, 196, 104811. [Google Scholar]
  13. Luan, J.; Li, S.; Wang, Y.; Ding, L.; Cai, C.; Liu, S. Decomposition of diverse litter mixtures affected by drought depends on nitrogen and soil fauna in a bamboo forest. Soil Biol. Biochem. 2022, 173, 108783. [Google Scholar] [CrossRef]
  14. Lin, H.; Li, Y.; Bruelheide, H.; Zhang, S.; Ren, H.; Zhang, N.; Ma, K. What drives leaf litter decomposition and the decomposer community in subtropical forests-The richness of the above-ground tree community or that of the leaf litter? Soil Biol. Biochem. 2021, 160, 108314. [Google Scholar] [CrossRef]
  15. Liu, X.; Chen, S.; Li, X.; Yang, Z.; Xiong, D.; Xu, C.; Wanek, W.; Yang, Y. Soil warming delays leaf litter decomposition but exerts no effect on litter nutrient release in a subtropical natural forest over 450 days. Geoderma 2022, 427, 116139. [Google Scholar] [CrossRef]
  16. Wang, C.; Dong, X.; Du, R.; Zhang, Z.; Huang, X. Changes of nutrient release and enzyme activity during the decomposition of mixed leaf litter of Larix principis-rupprechtii and broadleaved tree species. Chin. J. Appl. Ecol. 2021, 32, 1709–1716. [Google Scholar]
  17. Staelens, J.; Nachtergale, L.; Schrijver, A.D.; Vanhellemont, M.; Wuyts, K.; Verheyen, K. Spatio-temporal litterfall dynamics in a 60-year-old mixed deciduous forest. Ann. For. Sci. 2011, 68, 89–98. [Google Scholar] [CrossRef] [Green Version]
  18. Ye, Y.; Chen, Y.; Chen, G. Litter production and litter elemental composition in two rehabilitated Kandelia obovata mangrove forests in Jiulongjiang Estuary, China. Mar. Environ. Res. 2013, 83, 63–72. [Google Scholar] [CrossRef]
  19. Wu, Q. Effects of snow depth manipulation on the releases of carbon, nitrogen and phosphorus from the foliar litter of two temperate tree species. Sci. Total Environ. 2018, 643, 1357–1365. [Google Scholar] [CrossRef]
  20. Tie, L.; Hu, J.; Peñuelas, J.; Sardans, J.; Wei, S.; Liu, X.; Zhou, S.; Huang, K. The amounts and ratio of nitrogen and phosphorus addition drive the rate of litter decomposition in a subtropical forest. Sci. Total Environ. 2022, 833, 155163. [Google Scholar] [CrossRef]
  21. DalCorso, G.; Manara, A.; Piasentin, S.; Furini, A. Nutrient metal elements in plants. Metallomics 2014, 6, 1770–1788. [Google Scholar] [CrossRef] [PubMed]
  22. Williams, L.; Salt, D.E. The plant ionome coming into focus. Curr. Opin. Plant Biol. 2009, 12, 247–249. [Google Scholar] [CrossRef] [PubMed] [Green Version]
  23. Li, J.; Richter, D.B.; Mendoza, A.; Heine, P. Four-decade responses of soil trace elements to an aggrading old-field forest: B, Mn, Zn, Cu, and Fe. Ecology 2008, 89, 2911–2923. [Google Scholar] [CrossRef] [Green Version]
  24. Richardson, J.B. Manganese and Mn/Ca ratios in soil and vegetation in forests across the northeastern US: Insights on spatial Mn enrichment. Sci. Total Environ. 2017, 581–582, 612–620. [Google Scholar] [CrossRef]
  25. Peng, Y.; Li, Y.; Song, S.; Chen, Q.; Chen, G.; Tu, L. Nitrogen addition slows litter decomposition accompanied by accelerated manganese release: A five-year experiment in a subtropical evergreen broadleaf forest. Soil Biol. Biochem. 2022, 165, 108511. [Google Scholar] [CrossRef]
  26. Wang, H.; Zhao, C.; Zang, F.; Rong, Z.; Chang, Y.; Liu, Y. Spatiotemporal patterns of precipitation based on the Bayesian maximum entropy method in a typical catchment of the Heihe River watershed, northwest China. Int. J. Digit. Earth 2022, 15, 911–933. [Google Scholar] [CrossRef]
  27. Zang, F.; Wang, H.; Zhao, C.; Nan, Z.; Wang, S.; Yang, J.; Li, N. Atmospheric wet deposition of trace elements to forest ecosystem of the Qilian Mountains, northwest China. Catena 2021, 197, 104966. [Google Scholar] [CrossRef]
  28. Wang, C.; Zhao, C.; Xu, Z.; Wang, Y.; Peng, H. Effect of vegetation on soil water retention and storage in a semi-arid alpine forest catchment. J. Arid. Land 2013, 5, 207–219. [Google Scholar] [CrossRef]
  29. Lee, S.Y. Litter production and turnover of the mangrove Kandelia candel (L.) druce in a Hong Kong tidal shrimp pond. Estuar. Coast. Shelf Sci. 1989, 29, 75–87. [Google Scholar] [CrossRef]
  30. Sanjay, G.; Ranbeer, S.R.; Dhar, U. Patterns of litterfall and return of nutrients across anthropogenic disturbance gradients in three subalpine forests of west Himalaya, India. J. For. Res. 2009, 14, 73–80. [Google Scholar]
  31. Bigelow, S.W.; Canham, C.D. Litterfall as a niche construction process in a northern hardwood forest. Ecosphere 2015, 6, 1–14. [Google Scholar] [CrossRef] [Green Version]
  32. Saarsalmi, A.; Starr, M.; Hokkanen, T.; Ukonmaanaho, L.; Kukkola, M.; Nojd, P.; Sievanen, R. Predicting annual canopy litterfall production for Norway spruce (Picea abies (L.) Karst.) stands. For. Ecol. Manag. 2007, 242, 578–586. [Google Scholar] [CrossRef]
  33. Giaccone, E.; Colombo, N.; Acquaotta, F.; Paro, L.; Fratianni, S. Climate variations in a high altitude Alpine basin and their effects on a glacial environment (Italian Western Alps). Atmosfera 2015, 28, 117–128. [Google Scholar] [CrossRef]
  34. Liu, C.; Ilvesniemi, H. Variation in Litterfall-Climate relationships between coniferous and broadleaf forests in Eurasia. Global Ecol. Biogeogr. 2004, 13, 105–114. [Google Scholar] [CrossRef]
  35. Pausas, J.G. Litter fall and litter decomposition in Pinus sylvestris forests of the eastern Pyrenees. J. Veg. Sci. 1997, 8, 643–650. [Google Scholar] [CrossRef] [Green Version]
  36. Lin, B.; Liu, Q.; Wu, Y.; He, H. Nutrient and litter patterns in three subalpine coniferous forests of western Sichuan, China. Pedosphere 2006, 16, 380–389. [Google Scholar] [CrossRef]
  37. Chave, J.; Navarrete, D.; Almeida, S.; Álvarez, E.; Aragão, L.E.O.C.; Bonal, D.; Châtelet, P.; Silva-Espejo, J.E.; Goret, J.Y.; von Hildebrand, P.; et al. Regional and seasonal patterns of litterfall in tropical South America. Biogeosciences 2010, 7, 43–55. [Google Scholar] [CrossRef] [Green Version]
  38. Enright, N.J. Litterfall dynamics in a mixed conifer-angiosperm forest in northern New Zealand. J. Biogeogr. 2001, 26, 147–157. [Google Scholar] [CrossRef]
  39. Kotowska, M.M.; Leuschner, C.; Triadiati, T.; Hertel, D. Conversion of tropical lowland forest reduces nutrient return through litterfall, and alters nutrient use efficiency and seasonality of net primary production. Oecologia 2016, 180, 601–618. [Google Scholar] [CrossRef]
  40. Zhu, X.; Zou, X.; Lu, E.; Deng, Y.; Luo, Y.; Chen, H.; Liu, W. Litterfall biomass and nutrient cycling in karst and nearby non-karst forests in tropical China: A 10-year comparison. Sci. Total Environ. 2021, 758, 143619. [Google Scholar] [CrossRef]
  41. Lonsdale, M.W. Predicting the Amount of Litterfall in Forests of the World. Ann. Bot. 1988, 61, 319–324. [Google Scholar] [CrossRef]
  42. Peixoto, K.S.; Marimon-Junior, B.H.; Cavalheiro, K.A.; Silva, N.A.; das Neves, E.C.; Freitag, R.; Mews, H.A.; Valadão, M.B.; Marimon, B.S. Assessing the effects of rainfall reduction on litterfall and the litter layer in phytophysiognomies of the Amazonia-Cerrado transition. Braz. J. Bot. 2018, 41, 589–600. [Google Scholar] [CrossRef]
  43. Enquist, B.J.; Brown, J.H.; West, G.B. Allometric scaling of plant energetics and population density. Nature 1998, 395, 163–165. [Google Scholar] [CrossRef]
  44. Zagyvai-Kiss, K.A.; Kalicz, P.; Szilágyi, J.; Gribovszki, Z. On the specific water holding capacity of litter for three forest ecosystems in the eastern foothills of the Alps. Agric. For. Meteorol. 2019, 278, 107656. [Google Scholar] [CrossRef]
  45. Kopittke, P.M. Role of phytohormones in aluminium rhizotoxicity. Plant Cell Environ. 2016, 39, 2319–2328. [Google Scholar] [CrossRef] [PubMed]
  46. Kopittke, P.M.; Menzies, N.W.; Wang, P.; Blamey, F.P.C. Kinetics and nature of aluminium rhizotoxic effects: A review. J. Exp. Bot. 2016, 67, 4451–4467. [Google Scholar] [CrossRef]
  47. Berthelsen, B.O.; Steinnes, E.; Solberg, W.; Jingsen, L. Heavy Metal Concentrations in Plants in Relation to Atmospheric Heavy Metal Deposition. J. Environ. Qual. 1995, 24, 1018–1026. [Google Scholar] [CrossRef]
  48. Adriano, D.C. Trace Elements in Terrestrial Environments: Biogeochemistry, Bioavailability, and Risks of Metals; Springer: New York, NY, USA, 2001; pp. 61–89. [Google Scholar]
  49. Tang, R.; Luo, J.; Yang, P.; She, J.; Chen, Y.; Gong, Y.; Zhou, J. Trace metals of needles and litter in timberline forests in the Eastern of Tibetan Plateau, China. Ecol. Indic. 2014, 45, 669–676. [Google Scholar] [CrossRef]
  50. López-Millán, A.F.; Ellis, D.R.; Grusak, M.A. Effect of zinc and manganese supply on the activities of superoxide dismutase and carbonic anhydrase in Medicago truncatula wild type and raz mutant plants. Plant Sci. 2005, 168, 1015–1022. [Google Scholar] [CrossRef]
  51. Hänsch, R.; Mendel, R.R. Physiological functions of mineral micronutrients (Cu, Zn, Mn, Fe, Ni, Mo, B, Cl). Curr. Opin. Plant Biol. 2009, 12, 259–266. [Google Scholar] [CrossRef]
  52. Pii, Y.; Cesco, S.; Mimmo, T. Shoot ionome to predict the synergism and antagonism between nutrients as affected by substrate and physiological status. Plant Physiol. Biochem. 2015, 94, 48–56. [Google Scholar] [CrossRef] [PubMed]
  53. Laskowski, R.; Niklinska, M.; Maryanski, M. The dynamics of chemical-elements in forest litter. Ecology 1995, 76, 1393–1406. [Google Scholar] [CrossRef]
  54. McGee, C.J.; Fernandez, I.J.; Norton, S.A.; Stubbs, C.S. Cd, Ni, Pb, and Zn Concentrations in Forest Vegetation and Soils in Maine. Water Air Soil Pollut. 2007, 180, 141–153. [Google Scholar] [CrossRef]
  55. Gandois, L.; Probst, A. Localisation and mobility of trace metal in silver fir needles. Chemosphere 2012, 87, 204–210. [Google Scholar] [CrossRef] [Green Version]
  56. Neumann, P.M.; Ukonmaanaho, L.; Johnson, J.; Benham, S.; Vesterdal, L.; Novotný, R.; Verstraeten, A.; Lundin, L.; Thimonier, A.; Michopoulos, P.; et al. Quantifying Carbon and Nutrient Input from Litterfall in European Forests Using Field Observations and Modeling. Global Biogeochem. Cycles 2018, 32, 784–798. [Google Scholar] [CrossRef]
  57. Mingorance, M.D.; Valdés, B.; Rossini-Oliva, S. Strategies of heavy metal uptake by plants growing under industrial emissions. Environ. Int. 2007, 33, 514–520. [Google Scholar] [CrossRef]
  58. Aznar, J.C.; Richer-Laflèche, M.; Bégin, C.; Bégin, Y. Lead Exclusion and Copper Translocation in Black Spruce Needles. Water Air Soil Pollut. 2009, 203, 139–145. [Google Scholar] [CrossRef]
  59. Probst, A.; Liu, H.; Fanjul, M.; Liao, B.; Hollande, E. Response of Vicia faba L. to metal toxicity on mine tailing substrate: Geochemical and morphological changes in leaf and root. Environ. Exp. Bot. 2009, 66, 297–308. [Google Scholar] [CrossRef] [Green Version]
  60. Mauclet, E.; Agnan, Y.; Hirst, C.; Monhonval, A.; Pereira, B.; Vandeuren, A.; Villani, M.; Ledman, J.; Taylor, M.; Jasinski, B.L.; et al. Changing sub-Arctic tundra vegetation upon permafrost degradation: Impact on foliar mineral element cycling. Biogeosciences 2022, 19, 2333–2351. [Google Scholar] [CrossRef]
  61. Wang, J.; Yang, S.; Zhang, B.; Liu, W.; Deng, M.; Chen, S.; Liu, L. Temporal dynamics of ultraviolet radiation impacts on litter decomposition in a semi-arid ecosystem. Plant Soil 2017, 419, 71–81. [Google Scholar] [CrossRef]
  62. Haider, F.U.; Cai, L.; Jeffrey, A.C.; Sardar, A.C.; Wu, J.; Zhang, R.; Ma, W.; Muhammad, F. Cadmium toxicity in plants: Impacts and remediation strategies. Ecotoxicol. Environ. Saf. 2021, 211, 111887. [Google Scholar] [CrossRef] [PubMed]
  63. Chaperon, S.; Sauvé, S. Toxicity interaction of metals (Ag, Cu, Hg, Zn) to urease and dehydrogenase activities in soils. Soil Biol. Biochem. 2007, 39, 2329–2338. [Google Scholar] [CrossRef]
Figure 1. The map of study area.
Forests 14 01364 g001
Figure 2. Monthly dynamics of litter production (needle, branch and bark, cone, and impurity) of JP from September 2020 to August 2021. The error bar represents the standard deviation (n = 6). Lowercase a, b, c, and d denote significant differences between the different months (Tukey, p < 0.05).
Forests 14 01364 g002
Figure 3. Concentrations of MEs in needle litter of the JP (n = 6). Whiskers represent the maximum and minimum concentrations of MEs. At the bottom and top of each box are the 25th and 75th percentiles of element concentrations. The line in the box is the median concentrations of the element. The small square represents the mean concentrations of MEs.
Forests 14 01364 g003
Figure 4. Fluxes of MEs in needle litter of the JP (n = 6). Whiskers represent the maximum and minimum fluxes of MEs. At the bottom and top of each box are the 25th and 75th percentiles of element fluxes. The line in the box is the median value of the element. The small square represents the mean value of MEs.
Forests 14 01364 g004
Figure 5. Concentrations of TEs (Na, Cr, Mn, Co, Ni, Cu, Zn, Ag, Cd, and Pb) in needle litter of JP from September 2020 to August 2021 (n = 6). The error bar represents the standard deviation. Lowercase a, b, c, and d denote significant differences between the different months (Tukey, p <0.05).
Forests 14 01364 g005
Figure 6. Fluxes of TEs (Na, Cr, Mn, Co, Ni, Cu, Zn, Ag, Cd, and Pb) in needle litter of the JP from September 2020 to August 2021 (n = 6). The error bar represents the standard deviation. Lowercase a, b, c, d, e and f denote significant differences between the different months (Tukey, p < 0.05).
Forests 14 01364 g006
Table 1. Comparison of litter production (kg ha−1 a−1) and its composition of the different forests at home and abroad.
Forest TypesNeedle/
Leaf
BranchBarkFlowerConeImpurityTotalReference
kg ha−1 a−1
Juniperus przewalskii *2640.35 ± 436.96581.65 ± 59.23626.15 ± 83.40192.59 ± 37.584040.74 ± 495.96This study
Camphor tree and masson pine mixed forest *3327 ± 232.301216 ± 346.63149 ± 97.7815.71391 ± 80.314634 ± 337.14[7]
Betula pendula and Quercus robur mixed forest345012605935512[17]
Pinus elliottii715380211210205239602[11]
Casuarina equisetifolia10,491963365353012,640[11]
Sonneratia caseolaris68531738531013,901[10]
Kandelia candel5971681450411,070[29]
Betula utilis131114125054173645[30]
Kandelia obovata *832.27 ± 84.98315.51 ± 44.6081.29 ± 22.3319.92 ± 6.011249.99 ± 97.78[18]
Abies pindrow6048117155182648[30]
Abies faxoniana27631154603976[19]
* The data are presented as mean ± standard deviation, the standard deviation of production data for some species is not available.
Disclaimer/Publisher’s Note: The statements, opinions and data contained in all publications are solely those of the individual author(s) and contributor(s) and not of MDPI and/or the editor(s). MDPI and/or the editor(s) disclaim responsibility for any injury to people or property resulting from any ideas, methods, instructions or products referred to in the content.

