Abstract
Forestry infrastructure plays a critical role in promoting tree growth to achieve carbon-neutral targets. However, as a quasi-public good, it faces challenges because of its non-excludability, meaning that everyone can use it whether they pay for it or not, which results in a phenomenon known as ‘free-riding’ and poor supply. In China, the government can regulate the supply behaviour by adjusting information feedback approaches, such as disclosing the supply value and revenue. This study examined three information feedback approaches: full feedback (disclosing supply and revenue), half feedback (disclosing only supply), and no feedback (no disclosure). It then combined these three information feedback methods with other three groups of variables, namely whether there was a reward or punishment mechanism, whether the return rate of forestry infrastructure was certain, and whether the foresters could communicate with each other, and 20 policy scenarios were designed. Using experimental economics, foresters’ supply behaviours in these policy scenarios were simulated. The results revealed that: (1) The scenario yielded the highest supply, which is with half feedback, certain return rate of forestry infrastructure, with a reward or punishment mechanism, and no communication. (2) When there is no reward or punishment mechanism, no communication, and the return rate of forestry infrastructure is certain, no feedback increases the supply. In the presence of rewards and punishments, half feedback leads to the highest supply. If there are no rewards or punishments but with a certain return rate and communication, full feedback results in the highest supply. (3) Implementing a reward or punishment mechanism and information feedback simultaneously increases the supply more effectively. The theoretical analysis and policy recommendations of this study aim to improve the supply status of forestry infrastructure.
1. Introduction
Forestry infrastructure encompasses both natural and man-made features that facilitate the management, utilisation, and protection of forest resources [1]. It includes various elements such as forest roads, trails, bridges for accessing remote areas, management buildings for equipment and supplies, and fire lookout towers and suppression systems for wildfire control and so on.
Forestry infrastructure plays a vital role in promoting tree growth and enabling the ecological functions of forests [1]. Recently, the global concern over climate change and its association with greenhouse gas (GHG) emissions [2,3,4] has underscored the importance of forests in purifying the air [5,6] as the trees absorb carbon dioxide, a major GHG, which leads countries and regions worldwide to focus on conserving and expanding forest resources. In this context, forestry infrastructure has attracted considerable attention, as it serves as a fundamental material foundation for maintaining healthy forests [7,8,9,10,11]. For example, forest roads, trails, and bridges provide access to various areas for activities such as tree planting, thinning, and monitoring. Fire lookout towers and suppression systems help prevent and control forest fires.
However, forestry infrastructure is considered a ‘quasi-public good’ with non-exclusivity [1], which means it is jointly used by foresters and funded through cooperation, resulting in a phenomenon known as ‘free-riding’, where foresters try to avoid paying for infrastructure, hoping that others will contribute more. This discourages foresters and results in a poor supply of forestry infrastructure [12,13,14].
The government can modify information feedback to regulate foresters’ supply behaviour [15]. Studying the supply behaviour of foresters under different feedback methods can help determine which approach would minimise the ‘free-riding’ phenomenon and improve the overall supply. In this study, three modes of information feedback were designed, namely full feedback (disclosing both supply and revenue), half feedback (only disclosing supply), and no feedback (no information disclosed).
Numerous studies have discussed the importance of forestry infrastructure and proposed suggestions for improving its supply [7,8,16,17,18,19,20,21,22,23]. However, such studies have not systematically analysed how to improve the supply or addressed the supply behaviour of foresters. Our previous work studied the mechanisms of the private voluntary [24] and leader supply [1] of forestry infrastructure, highlighting the character of forestry infrastructure as quasi-public goods and analysing how to reduce the free-riding behaviour. These studies have provided valuable foundational research into the supply mechanisms of forestry infrastructure. However, the scenarios set up in these studies were simple. They only explored whether information feedback could enhance the supply without studying which information feedback method would be more conducive to improving the supply by classifying information feedback methods.
Experimental economics can model how human behaviour changes in different scenarios. This method is widely used to study how to change the supply behaviour of suppliers of public goods. For example, Reeson and Tisdell [25] used experimental economics to analyse the impact of revenue inequality on public goods provision. Coricelli et al. [26] used experimental economics to examine the effect of partner selection on voluntary contributions to public goods. Nowell and Tinkler [27] discussed the impact of gender on public good provisions using experimental economics. Lotito et al. [28] analysed the impact of two types of relational goods on voluntary contributions to public goods. Peters et al. [29] examined the supply of family public goods using experimental economics.
A series of economic experiments were carried out in this study to understand the effect mechanism of information feedback approaches on the forestry infrastructure supply. First, in order to simulate as many supply scenarios as possible to be close to reality, besides information feedback methods, we selected three sets of variables, namely whether foresters can communicate with each other before supplying, whether there is a reward or punishment mechanism [1], and whether the return rate of quasi-public forestry infrastructure is certain [1]. Then, the four sets of variables were arranged and combined in various ways, and 20 scenarios were designed. Finally, volunteers were selected to play the role of foresters, and the changes in the supply and free-riding behaviours of foresters in different experimental scenarios were systematically analysed, and the factors influencing behaviour changes were discussed.
This study contributes to the literature in a two-fold manner. (1) It proposes different designs for various information feedback methods, and (2) thoroughly discusses the impact of information feedback methods in terms of the supply and free-riding.
The rest of this paper is organised as follows. Section 2 outlines game theory, the design of the scenarios, experimental progress, selection principles, and statistical characteristics of the volunteers. Section 3 discusses the influence of different information feedback approaches on foresters’ supply behaviour. Finally, the conclusions are summarised in Section 4 together with a brief discussion and policy implications.
2. Methodology and Data
Regarding the research methods, we first used game theory to analyse the equilibrium results of the supply behaviour of foresters without policy intervention. Then, experimental economics was used to simulate how foresters’ supply behaviour would change under different policy scenarios. Specifically, this section begins with a game theory analysis, followed by descriptions of the detailed experimental design and process, the volunteer selection process, and statistical characteristics. Then, the results’ analysis methods are introduced.
2.1. Game Theory
As a quasi-public good, forestry infrastructure is jointly supplied by two or multiple foresters. Due to the non-exclusive nature of quasi-public forest infrastructure, there is a phenomenon of ‘free-riding’, which leads to a game relationship between foresters.
To analyse this game relationship, we used two foresters as examples to describe their supply process, and the simplified game process is described by the payment matrix (Table 1). In this payment matrix, forester A and forester B choose game strategies according to the cost and the revenue brought by forestry infrastructure. We assumed that forester A and forester B are in the same forest area and that they both have a good understanding of the functions and construction process of forestry infrastructure.

Table 1.
The payment matrix.
Here, r1 refers to the revenue of forester A from supplying forestry infrastructure, and r2 refers to the revenue of forester B. The cost of constructing the facility is 2c, and if both foresters supply it simultaneously, the cost is shared equally, resulting in each forester bearing a cost of c.
When the revenues of foresters obtained from supplying forestry infrastructure outweigh the supply costs (i.e., r1-2c > 0 & r2-2c > 0), then the game equilibrium results will be (Supply, No Supply) or (No Supply, Supply). If the revenues from these facilities are lower than the supply costs (i.e., r1-2c < 0 & r2-2c < 0), then the equilibrium result will be (No Supply, No Supply).
Based on these equilibrium results, unless the revenue brought by the facility to foresters exceeds the cost of building it, their strategic choice, in the absence of government intervention, is likely to be ‘No Supply’. Therefore, it becomes crucial to explore the policies that should be implemented to incentivise foresters to increase their supply.
2.2. Experimental Scenarios Design
As analysed using the game theory above, when there was no policy intervention, the supply willingness of foresters was lower. Experimental economics could simulate how the supply behaviours of foresters changed under different policy scenarios. We used this method to study how the supply behaviour of foresters could change when the government adopts different information feedback methods to analyse which information feedback methods would be the most conducive to improving supply.
Information feedback refers to the process of government disclosure of the supplies and revenues of foresters. This study designed three types of information feedback methods, namely, no feedback (NF), half feedback (HF), and full feedback (F). If nothing is disclosed, it is considered no feedback (NF). If only supply information is disclosed with no disclosure of the revenue, it is half feedback (HF). If both supply and revenue information are disclosed, it is considered full feedback (F). As already mentioned, in order to simulate as many supply scenarios as possible to be close to reality, we considered three additional sets of variables alongside the information feedback methods, namely whether the foresters could communicate with each other before supply, whether there was a reward or punishment mechanism [1], and whether the return rate from forestry infrastructure was certain. Then, the four sets of variables were arranged and combined in various ways, and 20 scenarios were designed in the simulation game. The reward or punishment mechanism [1] refers to the implementation of rewards or punishments on foresters to reduce free-riding behaviour. The same person would not receive both rewards and punishments but would either be rewarded or punished. If a forester engaged in free-riding behaviour, he would be punished by other members. In contrast, if the member’s supply level was high with no free-riding, other members would reward him. The reward or punishment mechanism can only be implemented in situations of HF and F scenarios, as only in these two situations could the foresters see the supply of others. Reward and punishment behaviours were not implemented in the NF scenario. Finally, there were only four scenarios (NF1–NF4) in the NF scenario, whereas eight scenarios (HF1–HF8 and F1–F8) were designed in the HF and F scenarios (Table 2).
Table 2.
Detailed experimental scenarios.
2.3. Experimental Process
The experimental economic operation was realised using the z-Leaf and z-Tree [30] programs. Before the experiment, we thoroughly explained the concept of quasi-public forestry infrastructure and the experimental instructions to each volunteer. The volunteers were asked to sit for paper-based tests to ensure they fully understood the rules of the experimental process, and the basic operations of the z-Leaf and z-Tree were also introduced. Please refer to Supplementary Materials and reference [1] for the experimental instructions and tests. Then, all volunteers were moved to a laboratory, and each sat before a computer that had z-Leaf installed. The person in charge of the experiment had a computer with z-Tree installed and could control the interface of z-Leaf through coding.
During the experiments, multiple volunteers were selected to play the role of foresters, and a public account was constructed to simulate quasi-public forestry infrastructure. Each volunteer has 50 initial chips. The supply of forestry infrastructure was simulated when the volunteer invested chips into a public account. The revenues received by the volunteers from the public account represented the revenues received by foresters from supplying forestry infrastructure.
The formula for calculating the revenue (Figure A1) [15], obtained by supplying quasi-public forestry infrastructure, is given below.
where Π refers to revenue of the member obtained from supplying the forestry infrastructure. Xit represents the retained chips of member i in round t after supplying into public account. Gt refers to the total chips of public accounts, e refers to the initial chips of each member, git is the supply in the public account, and β is the return rate from the public account, where 0 < β < 1.
Π = xit + βGt = e-git + β∑git,
2.4. Selection and Statistical Characteristics of Volunteers
Three principles guided the selection of volunteers [15]: (1) the ability to read and understand the experimental rules; (2) having computer operating skills; and (3) having knowledge of quasi-public goods forestry infrastructure.
To ensure the rationality and reliability of the experimental results, each policy scenario was simulated four times, and four participants were selected for ten rounds of gaming each time. Each volunteer could only participate in one experiment scenario and could not participate repeatedly.
In this study, the volunteers were foresters selected through field investigations, and the locations of the field investigation were the same as in a previous study [1]. Table 3, which was derived from reference [1], describes the gender, nationality, age, loans availed, part-time jobs, and other characteristics of the participants, which were obtained through a questionnaire survey. For a detailed description of the questionnaire, please refer to reference [1].
Table 3.
Statistical analysis of the characteristics of the volunteers.
2.5. Mann–Whitney U test and Multiple Linear Regression
After collecting the supply data of foresters using experimental economics, the Mann–Whitney U test was used in this study to compare the differences in the data between the two groups and to discuss the influence of communication, reward or punishment mechanism, and the return rate on supply. If the p-value was less than 0.05, it was considered that this factor had a significant impact on supply [1]. In addition, the multiple linear regression (MLR) model was used to analyse the influence factors of volunteers’ next-round decisions [1].
3. Results
The supply results in 20 scenarios will be compared as well as the free-riding behaviours in this section. Then, the detailed analysis will be presented about the influence of reward or punishment mechanism, communication, and return rate on the supply when the information feedback methods are the identical. Finally, the factors influencing the next round of the supply behaviour of foresters in different scenarios were analysed.
3.1. Comparison of Supply and Free-Riding Behaviour in Different Scenarios
The supply trends were all downward in the first and second categories (Figure 1), which indicated that NF, HF, and F are not conducive to improving the supply in these two categories. In the third category, only F3 had an upward trend. In the fourth category, the trends of HF4 and F4 were upward while the trend of NF4 was downward. In the fifth and seventh categories, the supply trends first declined, then rose, and the supply of HF was higher than that of F, indicating that HF and F were beneficial to improving the supply. The supply trends were upward in the sixth and eighth categories, showing that HF and F could improve the supply levels in these two categories.
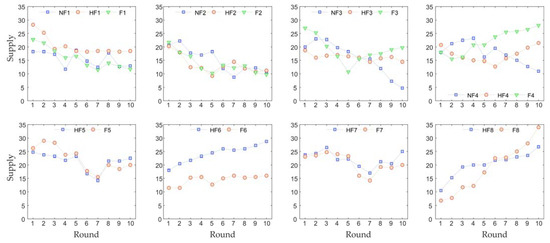
Figure 1.
Supply trends in different scenarios.
The supply (Figure 2) was statistically analysed for all 20 scenarios. Overall, the highest mean supply is under the scenario HF6 (HF × U × P × NC). The reason for this is that information feedback can provide three pieces of information: the supply of other members, the relationship between the supply and revenue of each member, and the relationship between the supply and the rewards and punishments they receive. In an NF scenario, none of these three pieces of information can be obtained, and decisions are only made based on the return rate. Moreover, the reward or punishment mechanism is not considered in NF scenarios, making it impossible to punish free-riding behaviour, which leads to significant supply differences among members and more free-riding, which cannot effectively improve the supply. If all three pieces of information are disclosed (F); by comparing the relationship between the returns and supply of each member, it can be visually found that the less they invest, the more revenue they receive, which means that free-riding can earn more revenue. At the same time, the members realize that only the person who invests the least receives the most punishment. Therefore, each member tries to reduce the supply appropriately so that it is close to the lowest supply in the last round, but not lower than that. When everyone has this mentality, the supply level will decrease. On the contrary, if HF is used, everyone can only see the supply in the last round, and cannot visually observe the rule that the less investment, the more the returns. In this case, rewards and punishments are their biggest concern. In order to obtain more rewards or avoid punishment, they will choose to increase their supply.
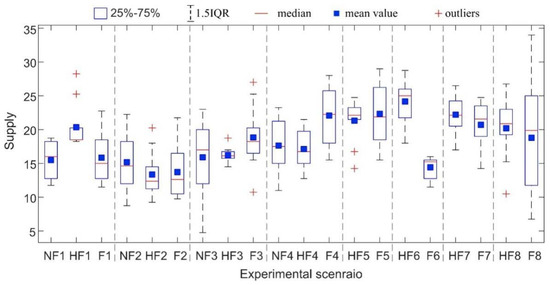
Figure 2.
Statistical analysis of supply in different scenarios.
From the objects of the categories, in the second category, NF2 had a higher mean, indicating that NF2 was conducive to improving the supply. In the first, sixth, seventh, and eighth categories, the mean supply in HF1, HF6, HF7, and HF8 were higher, suggesting that HF1, HF6, HF7, and HF8 were effective in improving the supply. In the third, fourth, and fifth categories, the mean supply in F3, F4, and F5 were higher, indicating that F3, F4, and F5 were conducive to improving the supply.
The standard deviation of the supply results of the subjects was used here to specifically describe their free-riding behaviour. A downward trend in the standard deviation over 10 rounds indicated that free-riding behaviour was decreasing. As shown in Figure 3, in the first category, the standard deviation of HF tended towards zero, revealing that HF could reduce free-riding. In the second category, the standard deviations of NF2 and HF2 tended towards zero, indicating that NF2 and HF2 could prevent free-riding. In the third category, the standard deviations of NF, HF, and F all tended towards zero, suggesting that free-riding would be prevented by all three approaches. In the fourth, fifth, sixth, seventh, and eighth categories, the standard deviations of HF and F tended towards zero, indicating that HF and F could prevent free-riding behaviour.
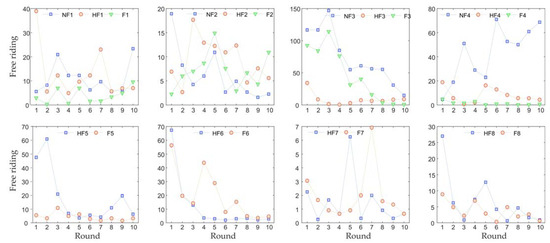
Figure 3.
Free-riding behaviour analysis in 20 scenarios.
Figure 4 depicts the supply and free-riding in the tenth round in different categories. In the first category, the supply of HF was the highest and the free-riding behaviour was the lowest. The free-riding behaviour of NF was the highest, and the supply of F was the lowest. Therefore, HF was superior to NF and F in the first category. In the second category, the supply of NF was highest and the free-riding behaviour was the lowest. The supply of HF was the higher. While the supply of F was the lowest, the free-riding behaviour was the highest. Hence, in the second category, NF was superior to HF and F. In the third and fourth categories, F had the highest supply and the least free-riding. Consequently, F was superior to NF and HF in these categories. In the fifth category, HF had the highest supply, but also exhibited the most serious free-riding behaviour. By contrast, F had the lowest supply and the least amount of free-riding behaviour. In the sixth and seventh categories, the supply of HF was greater than that of F, and the free-riding behaviour of HF was less than that of F. In the eighth category, the supply of F was greater than that of HF, and the free-riding behaviour of F was less than that of HF; that is, F was better than HF.
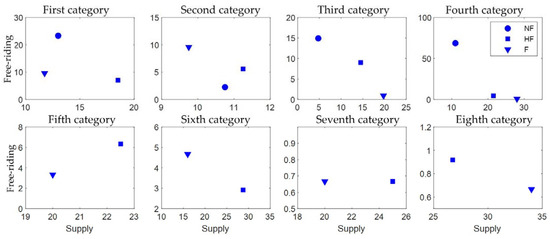
Figure 4.
The compare of supply and free-riding.
3.2. Effects of Communication on Supply with Identical Information Feedback Approaches
We divided the experimental scenarios into pairs (Table 4) to explore the effect of communication on the supply. Our analysis indicated that in most scenarios, the role of communication is not significant. Communication significantly affected the supply only in the HF1&HF2 and HF6&HF8 comparison groups. The means of HF1, HF2, HF6, and HF8 were 20.35, 13.35, 24.15, and 20.20, respectively. Specifically, in these two contrasting groups, communication was found to reduce the supply. This may be because the methods of information feedback influenced the role of communication.
Table 4.
Mann–Whitney U test of communication.
3.3. Effects of Return Rates on Supply with Identical Information Feedback Approaches
We grouped the 20 experimental scenarios into pairs based on the single-variable principle (Table 5) to investigate the impact of return rates on the supply. It can be observed that in the four control groups (HF1 and HF3, HF2 and HF4, F2 and F4, and F5 and F6), a certain return rate significantly impacted supply. Among them, the means of HF1, HF3, HF2, and HF4 were 20.35, 16.2, 13.35, and 17.13, respectively. The means of F2, F4, F5, and F6 were 13.73, 22.08, 22.33, and 14.43, respectively. This indicated that when communication is not allowed, a certain return rate can reduce the supply. However, when communication is allowed, a certain return rate can improve the supply.
Table 5.
Mann–Whitney U test of return rate.
3.4. Effects of Reward or Punishment Mechanism on Supply with Identical Information Feedback Approaches
We paired the 20 experimental scenarios based on the presence of the reward or punishment mechanism (Table 6) and discussed their impact on the supply. As shown in Table 6, reward or punishment mechanism significantly affected the supply in most scenarios. In the scenarios with a reward or punishment mechanism (HF5, HF6, HF7, HF8, F5, F6, F7, and F8), the average supply ranged from 14.43 to 24.15. In the scenarios without a reward or punishment mechanism (HF1, HF2, HF3, HF4, F1, F2, F3, F4), the average supply was between 13.35 and 22.08. The mean value for the scenarios with a reward or punishment mechanism was higher than that in the scenarios without a reward or punishment mechanism. This indicated that a reward or punishment mechanism can significantly increase the supply. In other words, if the reward or punishment mechanism and information feedback work together, the supply will be higher.
Table 6.
Mann–Whitney U test of reward or punishment mechanism.
3.5. Influential Factors on Next-Round Decision-Making
It can be seen from Figure 1 and Figure 3 that in ten consecutive rounds of games, the supply results always showed a significant increasing or decreasing trend, indicating that some factors have a potential impact on the subsequent supply, that is, the influence on the next round of decisions. We selected volunteer factors (EOR, SLR, and DSR), other volunteers’ factors (OMD, NOH, and ONR), and external factors (COD, SOA, SOP, and SPR). The multiple regression linear model was used to quantitatively analyse these influential factors in different scenarios (Figure 5).
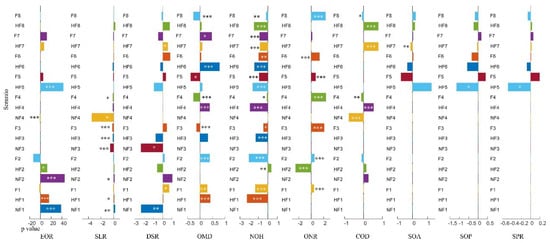
Figure 5.
Factors affecting the supply of the next round of the game in different scenarios. *** p < 0.001; ** p < 0.01; * p < 0.05. EOR is the estimated rate of return. SLR is the revenue of volunteers in the last round. DSR is the relationship between the volunteer’s supply and revenue (positive relationship = 1; negative relationship = 0). OMD refers to the lowest supply in the last round. NOH refers to the number of other volunteers whose supply exceeded their own supply. ONR is the revenue of other volunteers. COD refers to supply after communication. SOA is the reward received by volunteers. SOP denotes the punishment received by volunteers. SPR is the revenue after reward and punishment.
As shown in Figure 5, in the case of no information feedback, the main factors that affected the supply decision of next round were EOR and DSR. In the case of half feedback and full feedback, foresters not only referred to their own factors when making decisions, but also considered the behaviour of other foresters. In other words, they adjusted their supply behaviour according to the information feedback of others.
Figure 5 revealed that the supply trend of the sixth and eighth categories was upward, so we focus here on discussing the influencing factors of these two categories. In HF6, the factors affecting the supply were OMD and NOH. In F6, NOH adversely affected supply, whereas ONR had a positive impact. In HF8, COD positively affected the supply, but NOH had a negative effect. In F8, COD, OMD, and NOH had adverse effects on the supply, whereas NOH positively affected the supply.
In summary, in the case of no feedback or half-information feedback, the factors influencing the decision-making behaviour of foresters were the estimated rate of return, the revenue in the last round, and the relationship between revenue and supply in the last round. When there was full information feedback, the main factors influencing foresters’ decision-making behaviour were the supply and revenues of other foresters.
4. Discussion and Conclusions
Forestry infrastructure is fundamental to healthy and sustainable forests; however, the demand for forestry infrastructure exceeds the supply. In China, the government can adjust the supply behaviour of foresters by regulating information feedback methods. To explore how to use information feedback to improve the supply, three information feedback modes were considered in this study: full feedback (F), half feedback (HF), and no feedback (NF). Subsequently, 20 scenarios were designed in an experimental economics game simulation following experimental economic protocols. The conclusions of this study are as follows:
- (1)
- The scenario with the highest supply was under the condition when half feedback was provided along with a certain return rate, with a reward or punishment mechanism, and no communication among foresters before supplying (HF6: HF × U × P × NC). This is because in scenario NF, there is no reward or punishment mechanism, and so the free riding-behaviour cannot be punished and effectively reduced, which is not conducive to improving the supply. In scenario F, foresters can visually observe how much revenue free-riding will fetch them by observing the relationship between the supply and revenue of the other members, which will exacerbate free-riding behaviour and be detrimental to increasing the supply. In scenario HF, on the one hand, reward or punishment mechanisms can be implemented, and on the other hand, due to only disclosing the supply, foresters cannot visually observe the revenues gained from free-riding, which can reduce some free-riding behaviour and improve the supply.
- (2)
- The information feedback approaches will have different influences on the supply of forestry infrastructure in different scenarios. More disclosure does not always lead to an improvement in the supply. Surprisingly, not disclosing information (NF) can improve the supply of foresters in certain scenarios; for example, when there is an uncertain return rate of forestry infrastructure, no reward or punishment mechanism, and communication is present. Similarly, in scenarios involving a reward or punishment mechanism and effective communication, HF can lead to a higher supply. However, governments must disclose both the supply and revenues (F) in the scenarios including a certain return rate and no reward or punishment mechanism or in scenarios including an uncertain return rate, a reward or punishment mechanism, and no communication.
- (3)
- In China, governments should regulate information feedback methods by establishing a reward and punishment system that can improve the supply.
- (4)
- The relationship between the supply and revenue (DSR), the lowest supply of other volunteers in the last round (OMD), and the revenue after rewards or punishments (SPR) were found to be the most influential factors for decision-making behaviour.
The information feedback approach is a major factor that impacts the supply of quasi-public forestry infrastructure. Therefore, governments should adopt efficient information feedback methods to boost the supply. For one thing, appropriate information feedback methods should be selected for different scenarios. When there is no reward or punishment mechanism, an uncertain return rate, and no communication, it is recommended to use an NF system. When there is a reward or punishment mechanism, it is recommended to use an HF system. When there is no reward or punishment mechanism and the return rate is certain, it is recommended to use an F system. For another, a reward or punishment mechanism can effectively reduce free-riding behaviour and improve the supply, and the combination of the reward or punishment mechanism and information feedback methods can improve the supply more effectively. Therefore, the reward or punishment mechanism should be better designed. Specifically, foresters engaged in free-riding behaviour should be punished, whereas those who are not should be rewarded.
Some studies have suggested that information feedback can enhance the supply [15]. In our experimental scenarios, most results supported the idea that HF or F can improve the supply, which aligns with existing research. Additionally, a few scenarios showed that NF could increase the supply, which differed from previous research [31]. This was mainly because the experiments in this study considered other factors besides information feedback methods, including whether the forester can communicate, whether there is a reward or punishment mechanism, and whether there is a certain return rate from forestry infrastructure. After considering these variables comprehensively, the effects of different information feedback approaches on the supply were found to differ.
This study has several limitations. First, when designing the scenarios in this study, four sets of variables were mainly considered, but other variables may affect foresters’ supply behaviours, such as the strength of the rewards or punishments. In future research, this should receive more attention. Second, in the design of the experimental scenarios, there was no fund threshold [32], which means that the facility could be built when the funds raised reached a certain amount. Otherwise, the facility cannot be built, and the invested funds cannot be refunded. One of the principles of threshold public goods is that the threshold is higher than the initial funds of any individual, which is applicable to higher cost public goods. The forestry infrastructure discussed in this study is a comprehensive concept, which includes both lower-cost streetlamps, rest benches, etc., as well as higher cost facilities, such as roads and bridges. If thresholds are set generally, the results may not represent reality. In future research, we plan to refer to the concept of threshold public goods to subdivide forestry infrastructure into threshold public goods and general public goods based on the cost to obtain a more comprehensive understanding of the supply of forestry infrastructure.
Supplementary Materials
The following supporting information can be downloaded at: https://www.mdpi.com/article/10.3390/f14071422/s1. Experimental instructions and z-Tree software packages.
Author Contributions
L.Z.: Methodology, writing—original draft; C.W.: Conceptualization; Y.H.: writing—review and editing. All authors have read and agreed to the published version of the manuscript.
Funding
The authors gratefully acknowledge the support of the National Natural Science Foundation of China (52170175), the National Natural Science Foundation of China (72161147003), and the Major Projects of High-Resolution Earth Observation Systems of National Science and Technology under Grant 05-Y30B01-9001-19/20-4.
Informed Consent Statement
Informed consent was obtained from all volunteers involved in the study.
Data Availability Statement
The supply and revenue data of this study were obtained based on z-Tree software.
Conflicts of Interest
The authors declare no conflict of interest.
Appendix A

Figure A1.
The calculation rules of revenue.
Figure A1.
The calculation rules of revenue.

References
- Zhang, L.Y.; Wu, C.L.; Hao, Y. How to improve the supply of quasi-public forest infrastructure when government is the leader: Evidence from experimental economics. Forests 2023, 14, 275. [Google Scholar] [CrossRef]
- Goodman, J.; Marshall, J.P. Problems of methodology and method in climate and energy research: Socializing climate change. Energy. Res. Soc. Sci. 2018, 45, 1–11. [Google Scholar] [CrossRef]
- Bhardwaj, A.; Joshi, M.; Khosla, R.; Dubash, N.K. More priorities, more problems? Decision-making with multiple energy, development and climate objectives. Energy Res. Soc. Sci. 2019, 49, 143–157. [Google Scholar] [CrossRef]
- Barber, J. Solar-driven water-splitting provides a solution to the energy problem underpinning climate change. Biochem. Soc. Trans. 2020, 48, 2865–2874. [Google Scholar] [CrossRef]
- Nguyen, T.; Yu, X.X.; Zhang, Z.M.; Liu, M.M.; Liu, X.H. Relationship between types of urban forest and PM 2.5 capture at three growth stages of leaves. J. Environ. Sci. 2015, 27, 33–41. [Google Scholar] [CrossRef] [PubMed]
- Sanesi, G.; Chiarello, F. Residents and urban green spaces: The case of Bari. Urban For. Urban Green. 2006, 4, 125–134. [Google Scholar] [CrossRef]
- Cheng, N.Y. Study on the Development of Forest Leisure Tourism Industry Based on Resource Constraint. Ph.D. Thesis, Nanjing Forestry University, Nanjing, China, 2012. (In Chinese). [Google Scholar]
- Han, N. Analysis of Forest Tourism Competitiveness in Heilongjiang Province. Master’s Thesis, Northeast Agricultural University, Harbin, China, 2017. (In Chinese). [Google Scholar]
- Yoshimura, T.; Acar, H.H. Occupational safety and health conditions of forestry workers in turkey. J. Forestry Res. 2004, 9, 225–232. [Google Scholar] [CrossRef]
- Schirmer, J.; Kanowski, P.; Race, D. Factors affecting adoption of plantation forestry on farms: Implications for farm forestry development in Australia. Aust. For. 2000, 63, 44–51. [Google Scholar] [CrossRef]
- Oliver, C.D. Sustainable forestry. What is it? How do we achieve it? J. Forestry 2003, 101, 8–14. [Google Scholar]
- Pinkard, E.; Battaglia, M.; Bruce, J.; Matthews, S.; Callister, A.N.; Hetherington, S.; Last, I.; Mathieson, S.; Mitchell, C.; Mohammed, C.; et al. A history of forestry management responses to climatic variability and their current relevance for developing climate change adaptation strategies. Forestry 2015, 88, 155–171. [Google Scholar] [CrossRef]
- Sekot, W. Forest accountancy data networks as a means for investigating small-scale forestry: A European perspective. Small-Scale For. 2017, 16, 435–449. [Google Scholar] [CrossRef]
- Kovyazin, V.F.; Romanchikov, A.Y. The problem of cadastral appraisal of forest lands taking into account the infrastructure of the forestry fund. J. Min. Inst. 2018, 229, 98–104. [Google Scholar]
- Zhou, Y.A.; Huang, G.B.; He, H.R.; Liu, M.W. Do leaders really lead by example? A study based on public goods game experiment. Manag. World 2014, 30, 75–90. (In Chinese) [Google Scholar]
- Xiong, L.C.; Wang, F.T.; Cheng, B.D.; Yu, C. Identifying factors influencing the forestry production efficiency in Northwest China. Resour. Conserv. Recycl. 2018, 130, 12–19. [Google Scholar] [CrossRef]
- Koliouska, C.; Andreopoulou, Z. Exploring the use of smart services in forestry. J. Environ. Prot. Ecol. 2019, 20, 1434–1439. [Google Scholar]
- Akay, A.E.; Sessions, J. Roading and transport operations. In Encyclopedia of Forest Sciences; Burley, J., Evans, J., Youngquist, J., Eds.; Elsevier: Amsterdam, The Netherlands; Academic Press: Amsterdam, The Netherlands, 2004; pp. 259–269. [Google Scholar]
- Enache, A.; Pentek, T.; Ciobanu, V.D.; Stampfer, K. GIS based methods for computing the mean extraction distance and its correction factors in Romanian mountain forests. Šumar. List 2015, 139, 35–46. [Google Scholar]
- Naka, K.; Hammett, A.L.; Stuart, W.B. Institutional Reform in Albania: Making Forest-Based Policies Work. J. Forestry 2000, 98, 38–42. [Google Scholar]
- Laschi, A.; Neri, F.; Montorselli, N.B.; Marchi, E.A. A methodological approach exploiting modern techniques for forest road network planning. Croat. J. For. Eng. 2016, 37, 319–331. [Google Scholar]
- Mostafa, M.; Parsakhoo, A. Road network analysis for timber transportation from a harvesting site to mills (Case study: Gorgan County–Iran). J. For. Sci. 2015, 61, 520–525. [Google Scholar]
- Picchio, R.; Spina, R.; Calienno, L.; Venanzi, R.; Lo Monaco, A. Forest operations for implementing silvicultural treatments for multiple purposes. Ital. J. Agron. 2016, 11, 156–161. [Google Scholar]
- Zhang, L.Y.; Wu, C.L.; Zhang, Y. Experimental study based on game theory on the private, voluntary supply mechanisms of goods for forestry infrastructure from the perspective of quasi-public goods. Sustainability 2020, 12, 2808. [Google Scholar] [CrossRef]
- Reeson, A.F.; Tisdell, J.G. Institutions, motivations and public goods: An experimental test of motivational crowding. J. Econ. Behav. Organ. 2008, 68, 273–281. [Google Scholar] [CrossRef]
- Coricelli, G.; Fehr, D.; Fellner, G. Partner selection in public goods experiments. J. Conflict Resolut. 2004, 48, 356–378. [Google Scholar] [CrossRef]
- Nowell, C.; Tinkler, S. The influence of gender on the provision of a public good. J. Econ. Behav. Organ. 1994, 25, 25–36. [Google Scholar] [CrossRef]
- Lotito, G.; Matteo, M.; Ortona, G. An experimental inquiry into the nature of relational goods, and their impact on cooperation. Group Decis. Negot. 2015, 24, 699–722. [Google Scholar] [CrossRef]
- Peters, H.E.; Uenuer, A.S.; Clark, J.; Schulze, W.D. Free-riding and the provision of public goods in the family: A laboratory Experiment. Int. Econ. Rev. 2004, 45, 283–299. [Google Scholar] [CrossRef]
- Fischbacher, U.; Stefani, U. Strategic errors and audit quality: An experimental investigation. Account. Rev. 2007, 82, 9–704. [Google Scholar] [CrossRef]
- Adomavicius, G.; Curley, S.P.; Gupta, A.; Sanyal, P. Impact of information feedback in continuous combinatorial auctions: An experimental study of economic performance. MIS Quart. 2013, 37, 55–76. [Google Scholar] [CrossRef]
- Dragicevic, A.Z. Option fund market dynamics for threshold public goods. Dyn. Games Appl. 2017, 7, 21–33. [Google Scholar] [CrossRef]


Disclaimer/Publisher’s Note: The statements, opinions and data contained in all publications are solely those of the individual author(s) and contributor(s) and not of MDPI and/or the editor(s). MDPI and/or the editor(s) disclaim responsibility for any injury to people or property resulting from any ideas, methods, instructions or products referred to in the content. |
© 2023 by the authors. Licensee MDPI, Basel, Switzerland. This article is an open access article distributed under the terms and conditions of the Creative Commons Attribution (CC BY) license (https://creativecommons.org/licenses/by/4.0/).