Article

Infrared Thermal Profiles in Silvopastoral and Full-Sun Pastures in the Eastern Amazon, Brazil

by
Aureane Cristina Teixeira Ferreira Cândido
1,*,
Lucieta Guerreiro Martorano
2,
Bruno Uéslei Ferreira Cândido
3,
Werlleson Nascimento
4,
Carlos Tadeu dos Santos Dias
5,
Leila Sheila Silva Lisboa
6,
Paulo Campos Christo Fernandes
7,
Arystides Resende Silva
8,
Moacyr Bernardino Dias-Filho
8 and
Troy Patrick Beldini
1
1
Programa de Pós-Graduação em Sociedade, Natureza e Desenvolvimento, Universidade Federal do Oeste do Pará, Rua Vera Paz—Salé, Santarém 68000-000, Brazil
2
Embrapa Amazônia Oriental, Programa de Pós-Graduação em Sociedade, Natureza e Desenvolvimento e Programa de Pós-Graduação Rede Bionorte, Travessa NS Um A, 98, Santarém 68000-000, Brazil
3
Departamento de Direito, Centro Universitário da Amazônia, Rua Rosa Vermelha, 335, Santarém 68000-000, Brazil
4
Programa de Pós-Graduação em Estatística e Experimentação Agronômica, Escola Superior de Agricultura Luiz de Queiros, Avenida Pádua Dias, 235, Piracicaba 13400-000, Brazil
5
Departamento de Ciências Exatas, Escola Superior de Agricultura Luiz de Queiros, Avenida Pádua Dias, 235, Piracicaba 13400-000, Brazil
6
Municipal Secretary of Belém SEMEC, Belém 66000-000, Brazil
7
Embrapa Cerrados, Brasília 73310-970, Brazil
8
Embrapa Amazônia Oriental, Belém 66000-000, Brazil
*
Author to whom correspondence should be addressed.
Forests 2023, 14(7), 1463; https://doi.org/10.3390/f14071463
Submission received: 17 June 2023 / Revised: 13 July 2023 / Accepted: 14 July 2023 / Published: 17 July 2023
(This article belongs to the Section Forest Ecology and Management)

Abstract

:
There is a great need to identify interactions among silvopastoral systems and microclimatic indicators that describe the effect of trees compared to conventional pasture systems without trees. The objective of this study was to evaluate thermal conditions in a silvopastoral system and a pasture area exposed to full sunlight in the eastern Amazon, Brazil. The silvopastoral system was composed of the forest tree species Bertholletia excelsa H.B.K., Dipteryx odorata (Aubl.) Willd, and Khaya grandifoliola C.DC.. During the monitoring period, a forest inventory was carried out that included 30 trees from each species for which thermal profiles were created using a high-precision thermographic camera. Near-infrared thermography showed a positive and direct correlation with dendrometric variables. Silvopastoral systems with K. grandifoliola reduced the heat profile the most compared to conditions in a pasture fully exposed to sunlight, which demonstrates the ecosystem service provided by trees for thermal regulation in these systems. The microclimatic conditions explain the greater presence of bovines in the silvopastoral system as they were most likely in search of the thermal comfort provided by the trees during the period of the highest daytime temperatures. The silvopastoral system benefits the caloric balance and thermal comfort of pasture animals.

1. Introduction

Food production systems that incorporate trees can generate indicators that can be used to evaluate the benefits of these systems. These indicators can range from economic, due to the low cost associated with soil recuperation, to ecological, due to an ample offering of environmental goods and services and the mitigation of greenhouse gas emissions that affect the dynamics of the global climate [1].
The adoption of agroforest systems includes the combination of tree species with grasses, providing environmental goods and services which are clearly perceivable and easily measured and expressing dynamic processes that are integrated and correlated in space and time [2,3]. During the establishment of the agroforest, the trees in these systems possess different capacities for the transport of mass and energy, thus creating varied microclimates through soil–plant–atmosphere interactions [4,5].
In this context, the adoption of sustainable strategies such as silvopastoral systems in pastures undergoing degradation is an example of animal production systems that satisfy the Sustainable Development Objectives suggested by the United Nations [6].
By directly intercepting solar radiation, trees disperse it and reduce the amount of radiation that reaches other plants in the immediate environment, thus cooling the area through evapotranspiration and shade [2,7,8]. In typical tropical and subtropical environments, micrometeorological measurements using sensors can help to explain the effects of the measured variables on animal production and development in pastures based on thermal indicators such as temperature amplitudes, averages, and extremes, for example [2,3,9,10,11].
Measurements of tree crown temperatures in the canopies of trees planted in pastures can help explain animal behavior at different times during the day. Thermal variations can promote physical and biological interactions that are functions of foliar anatomy, stomatal response, albedo, tree position, solar radiation, wind speed, rainfall regime, and soil water content, and these are conditioned by the local and regional climate [4,12,13,14].
Among the technologies used for monitoring micrometeorological variables is near-infrared thermography (NIT), which has been used to analyze thermal patterns of surfaces in a wide variety of scientific fields. The high resolution of thermographic equipment, the simplicity of operation, and the improvements in computational capacity and data storage explain the increase in the use of this technology [5,10,11,15].
The application of this technology to the fields of plant physiology and agrometeorology can demonstrate the effects of temperature on stomatal conduction and exchanges of water vapor and carbon dioxide and can help to explain relationships in the soil–plant–atmosphere continuum [4,12,13,14]. Infrared thermography enables a detailed description of the patterns of thermal variation in leaves and their relationships with microclimatic variables resulting from different arrangements of agroforest systems [16].
In a study carried out in Eucalyptus plantations (Eucalyptus grandis e E. urophylla) and native trees in the Brazilian savanna, Karvatte Jr et al. [16] concluded that near-infrared thermography can identify temporal thermal variations in agroforest systems and recommended it as a tool for studies of microclimatic variation. Thermographic patterns are positively and directly correlated with variables such as radiation, temperature, and thermal comfort indices, thus allowing for non-invasive, rapid, and easy prediction and monitoring in different rural environments [17].
Analyses of animal well-being and thermal comfort in cattle production systems become more important when considering the relationships between sustainable production and practices that cause climate change as a result of global warming. This is especially true in tropical and subtropical environments in which cattle production occurs in pastures [18] where there is a high incidence of solar radiation and intense heating of the surroundings, which has a strong influence on animal thermal stress [2,19].
Since bovines are homeothermic animals, their internal body temperatures are maintained at relatively constant levels, independent of climatic variations, due to physiological, behavioral, and metabolic adjustments [20]. Therefore, the energy spent to maintain thermal equilibrium can cause productivity losses [10].
The high incidence of solar radiation that occurs where bovines are raised in full-sun pastures can cause thermal discomfort, leading to physiological and behavioral alterations [21]. The megathermic environment reduces the efficiency of caloric dissipation, which is dependent on a thermal gradient between the body surface of the animal and the surrounding environment [10].
According to Karvatte at al. [2], integrated production systems that include trees promote beneficial microclimatic changes for pasture animals in the Brazilian Central-West region, and tropical tree species that can be used in silvopastoral systems need to be identified and studied.
Among native species, the Brazil nut tree (Bertholletia excelsa H.B.K) of the Lecythidaceae family is a large, emergent tree that stands out due to its circular crown format and occurs across the Amazon basin [22]. This species produces edible seeds that obtain high values in national and international markets and is a source of income for many agro-extractivists from communities in the lower Amazon mesoregion [23]. The high quality of its wood makes it highly sought after for use in the construction of boats, houses, and pillars. Adult specimens can reach 60 m in height and 4 m in diameter [24], meaning that this species is highly impacted by the illegal harvesting of timber in the region. B. excelsa is protected by law and is recommended for multiple uses such as on plantations, since only trees harvested from reforestation programs can be legally harvested according to the law no. ° 12.651 of 2012 [25].
The species Dipteryx odorata (Aubl.) Willd., popularly known as cumaru, is a large tree with a wide distribution across the Amazon [26]. The wood has a very high density and the seeds are rich in coumarin [27], which is widely used in the production of pharmaceutical products, cosmetics, herbicides, fungicides, and drinks, among other applications, which justifies the high demand for this species in national and international markets [28].
Another important species is African mahogany, belonging to the family Meliaceae [29,30,31], which is frequently used to create products of high commercial value such as luxury furniture, naval construction, and interior finishing, among other uses [32,33,34]. In Brazil, this species was erroneously called Khaya ivorensis [35]; however, recognizing this error, researchers corrected it to reflect the proper name, Khaya grandifoliola [36]. Very commonly, however, its seeds and seedlings are still marketed as K. ivorensis, but with the continual development of research and scientific publications, it is expected that soon the correct nomenclature will be exclusively employed [37].
Species of the genus Khaya, such as Khaya grandifoliola, Khaya anthotheca, Khaya and Khaya senegalensis, are the most frequently used species in the production of sawn wood due to the high quality of their wood [38]. The aforementioned species occur in the tropical region of Africa, where large volumes of wood have been extracted from native forests since the 18th century [39,40]. The production of Khaya spp., together with other annual or perennial species in agroforest systems, can generate short-, medium-, and long-term returns [41,42].
It is important to identify the interactions that occur in silvopastoral systems associated with microclimatic conditions in the understory, especially the influence of tree species in integrated systems on temperature. The measurement of dendrometric variables will aid in the estimation of forest production and the comparison of production between different localities, in addition to defining norms for management of timber harvest goals [43].
The questions that guided this study were (1) whether there are correlations between dendrometric variables and thermographic patterns, (2) if African mahogany is the species that provides the highest degree of shading due to its rapid growth compared to the two native Amazonian species, and (3) if these aspects are able to reduce the temperatures of thermographic targets. The objective of this study was to evaluate the thermal conditions in pastures with trees and without trees in full-sun conditions in the western region of the state of Pará, in the eastern Amazon, Brazil.

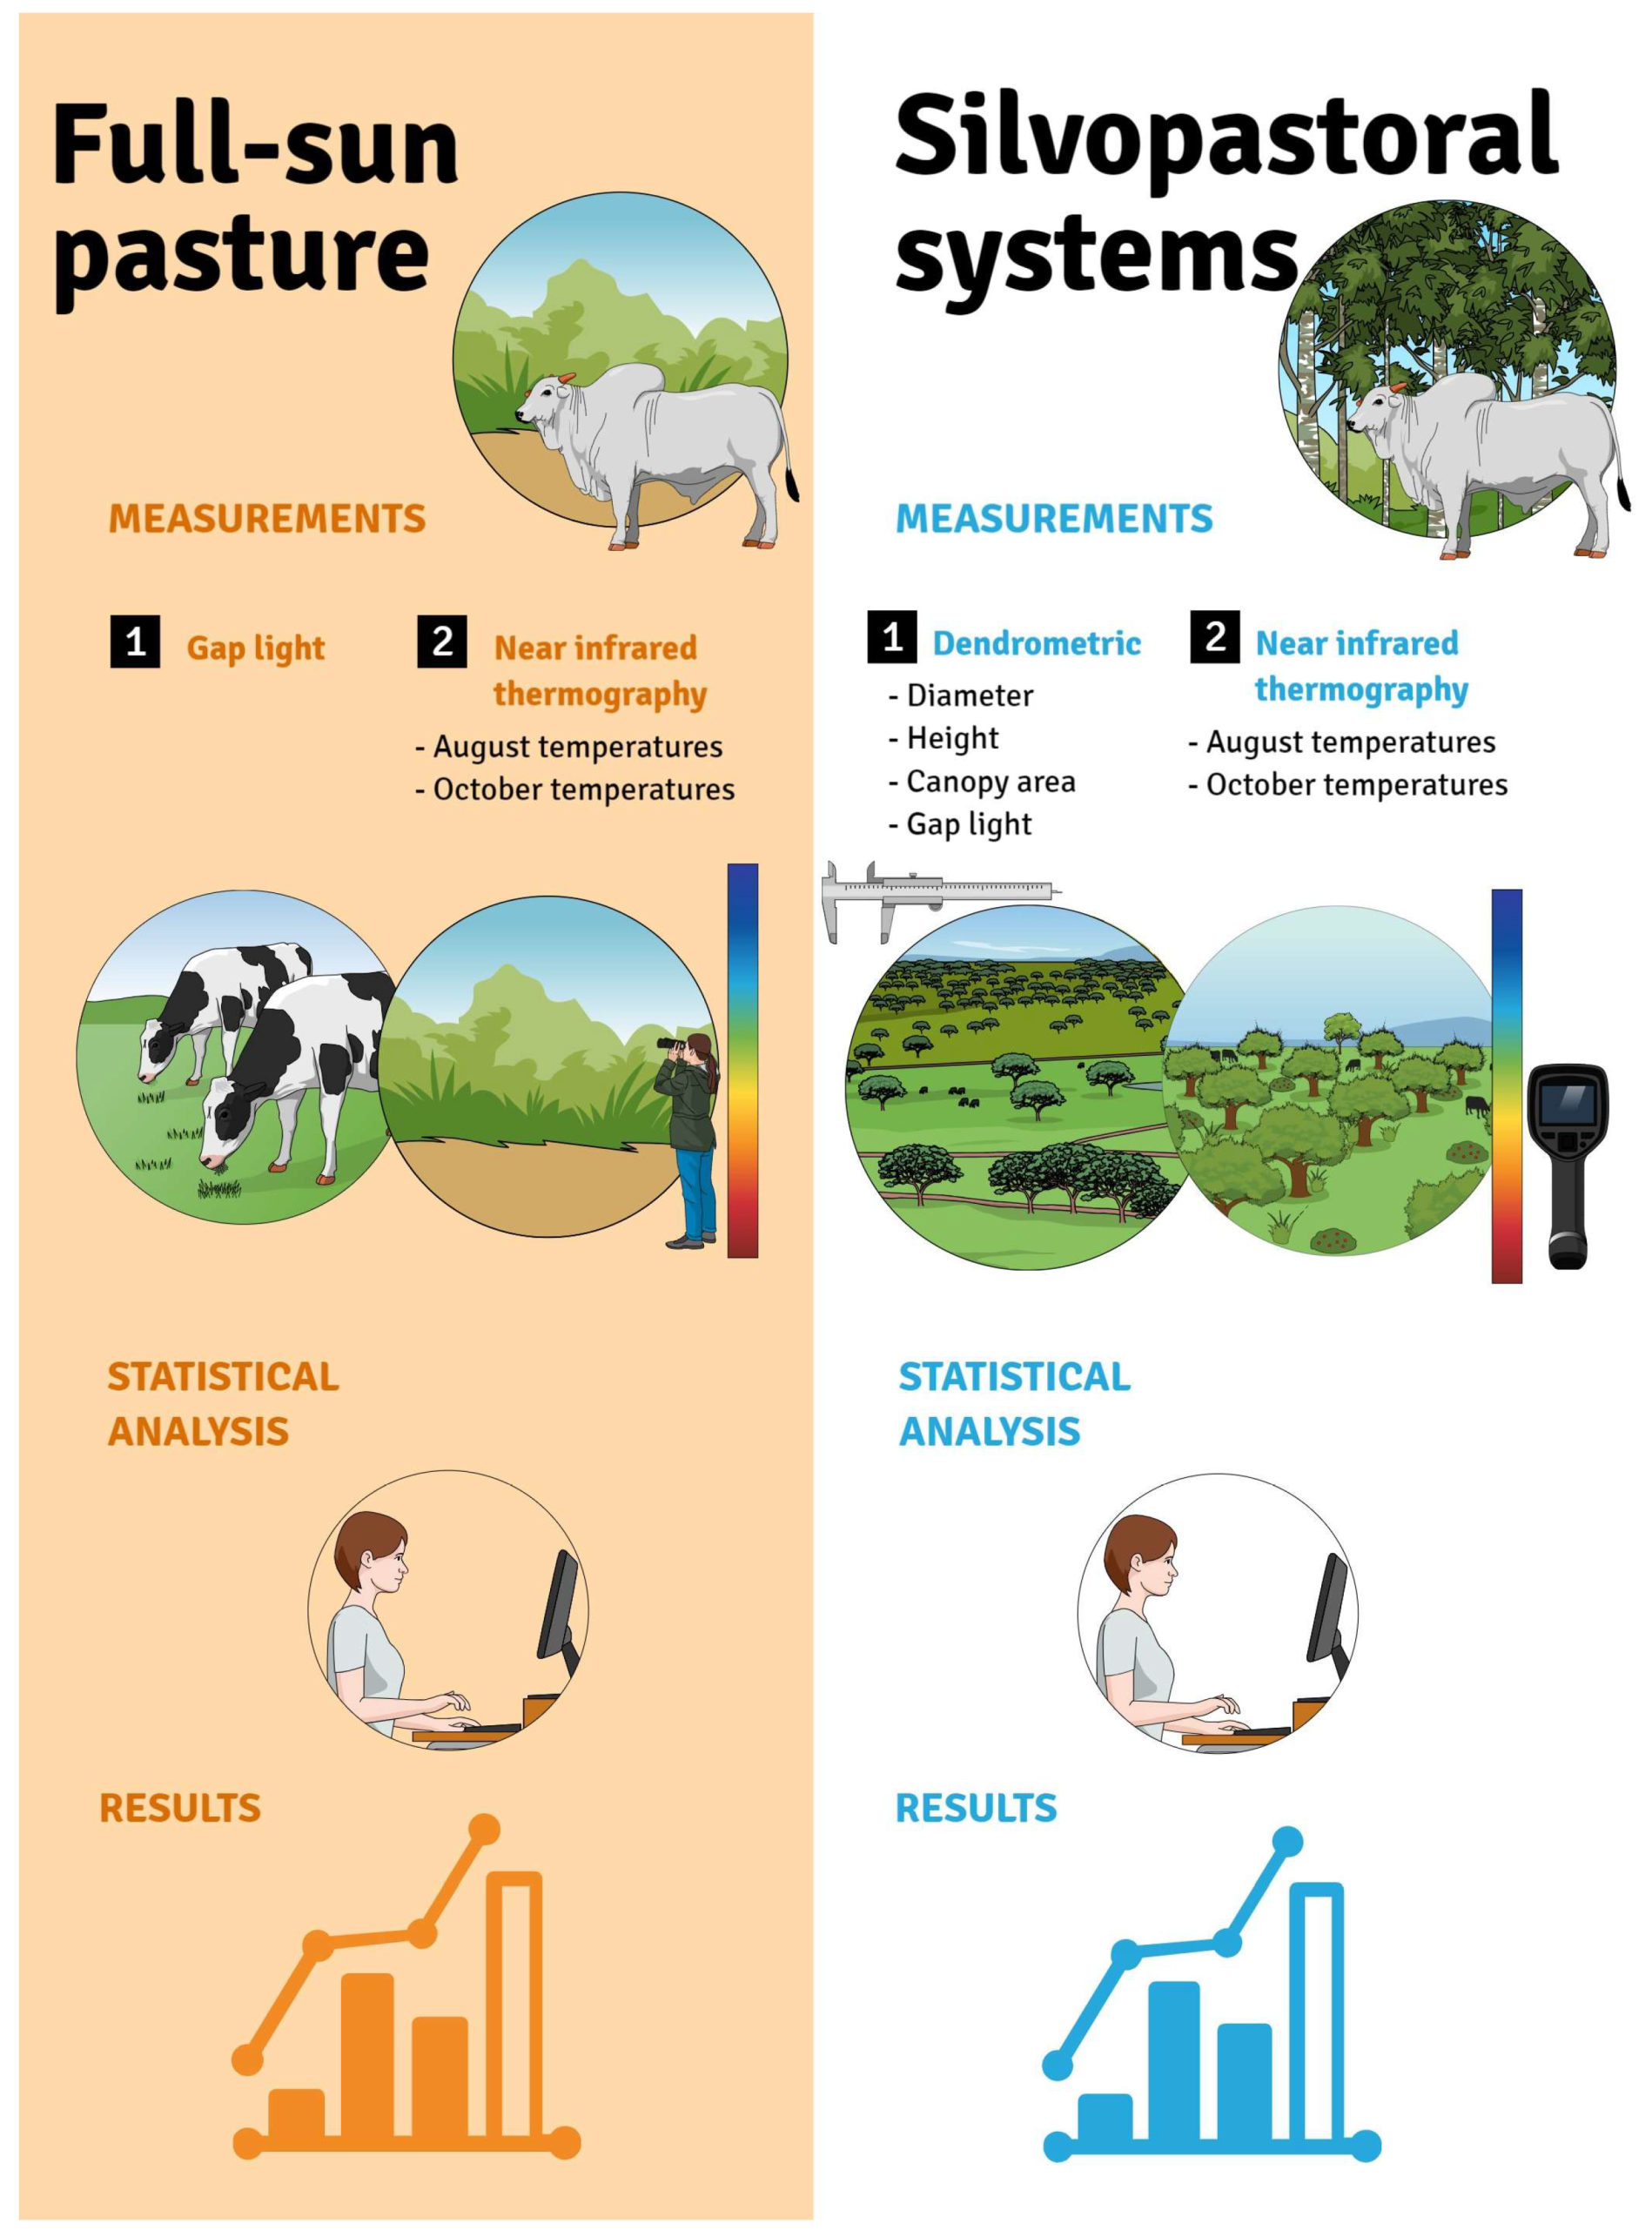
2. Materials and Methods
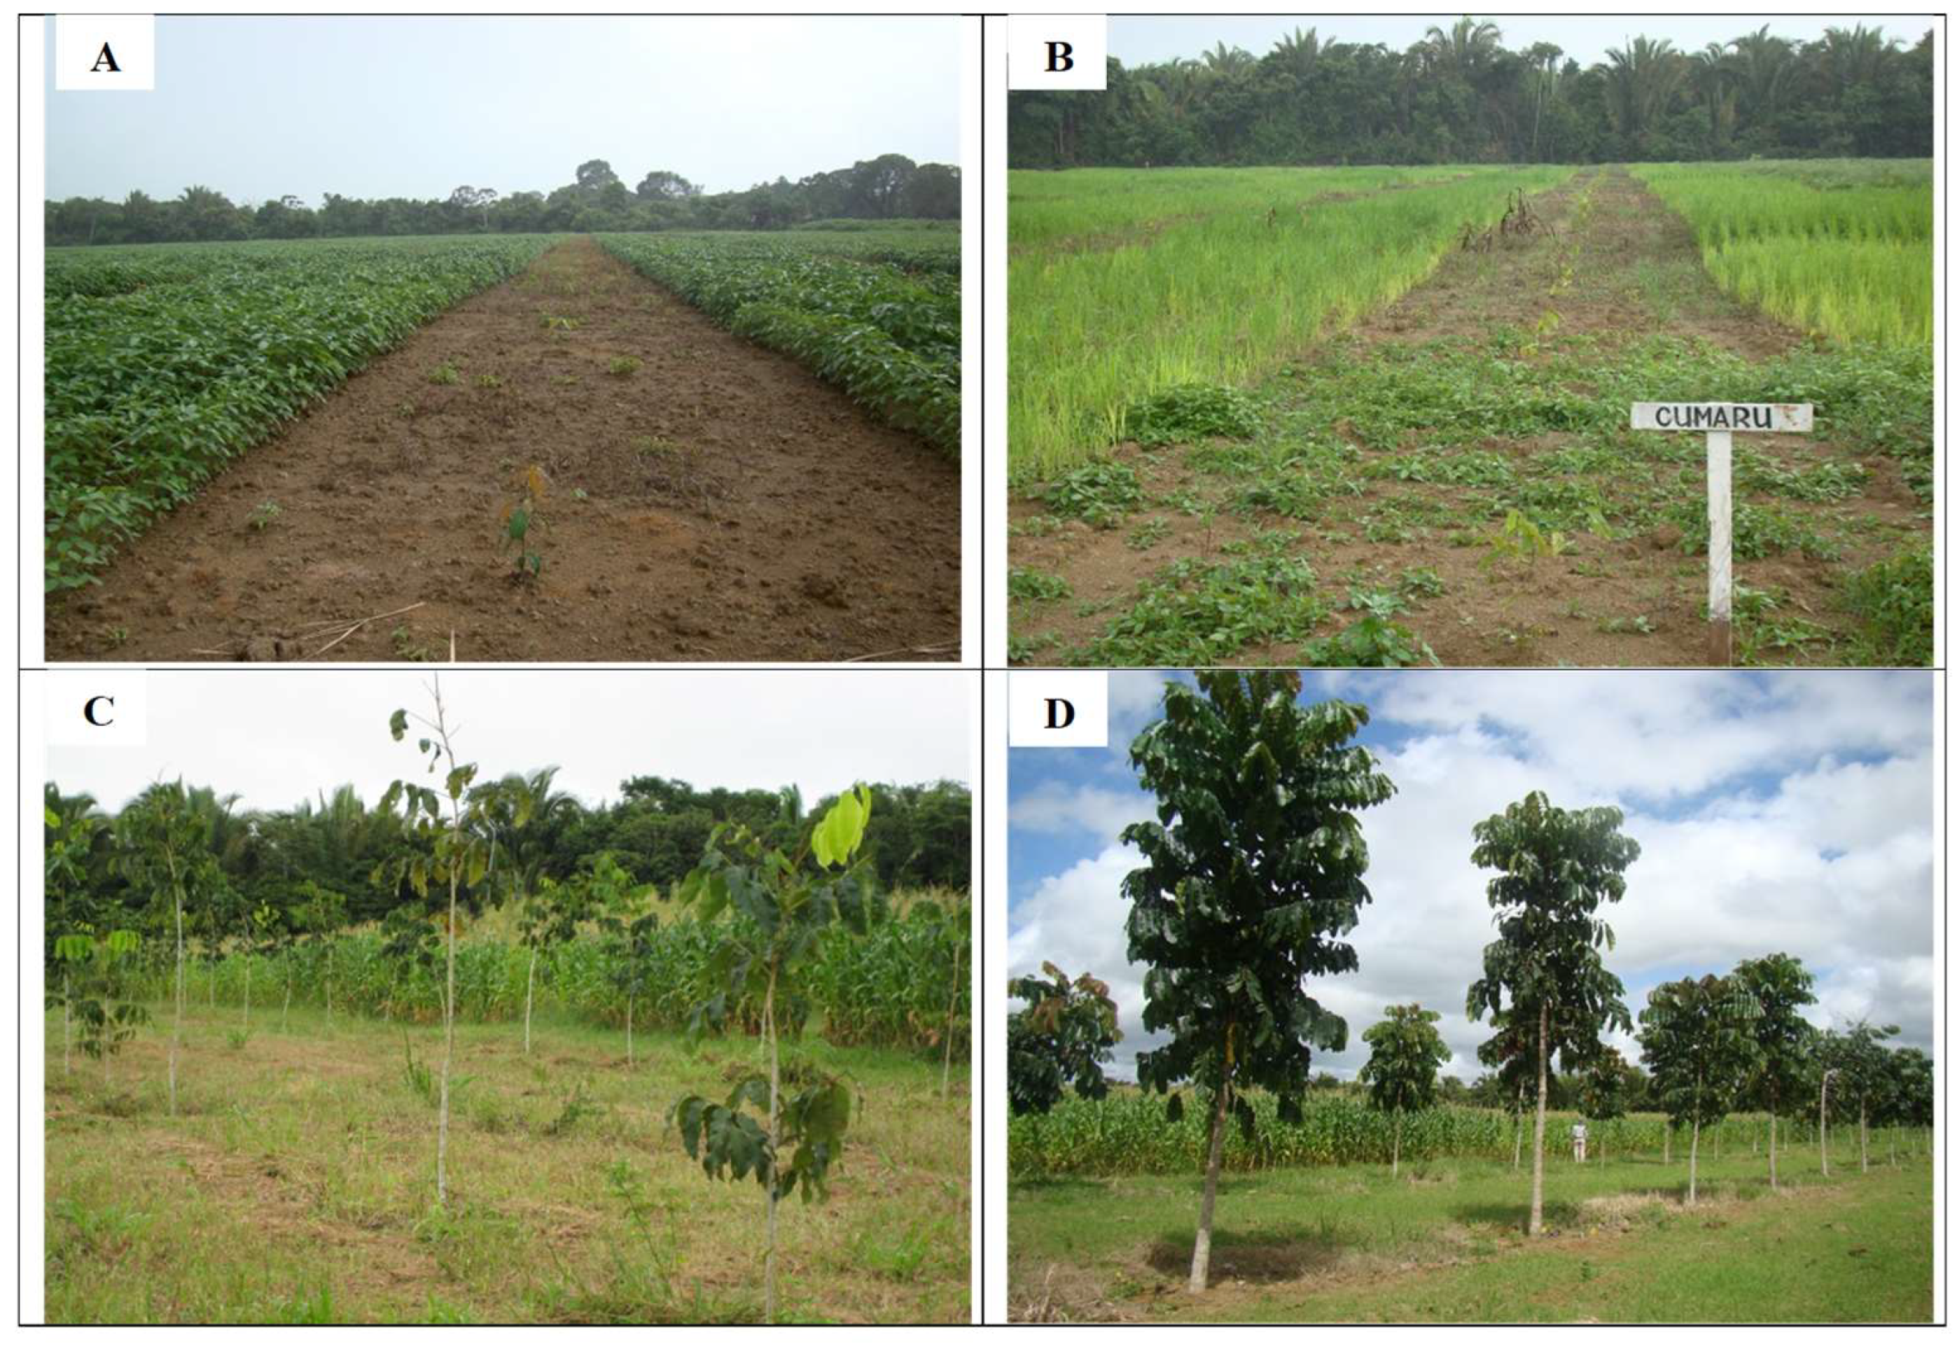
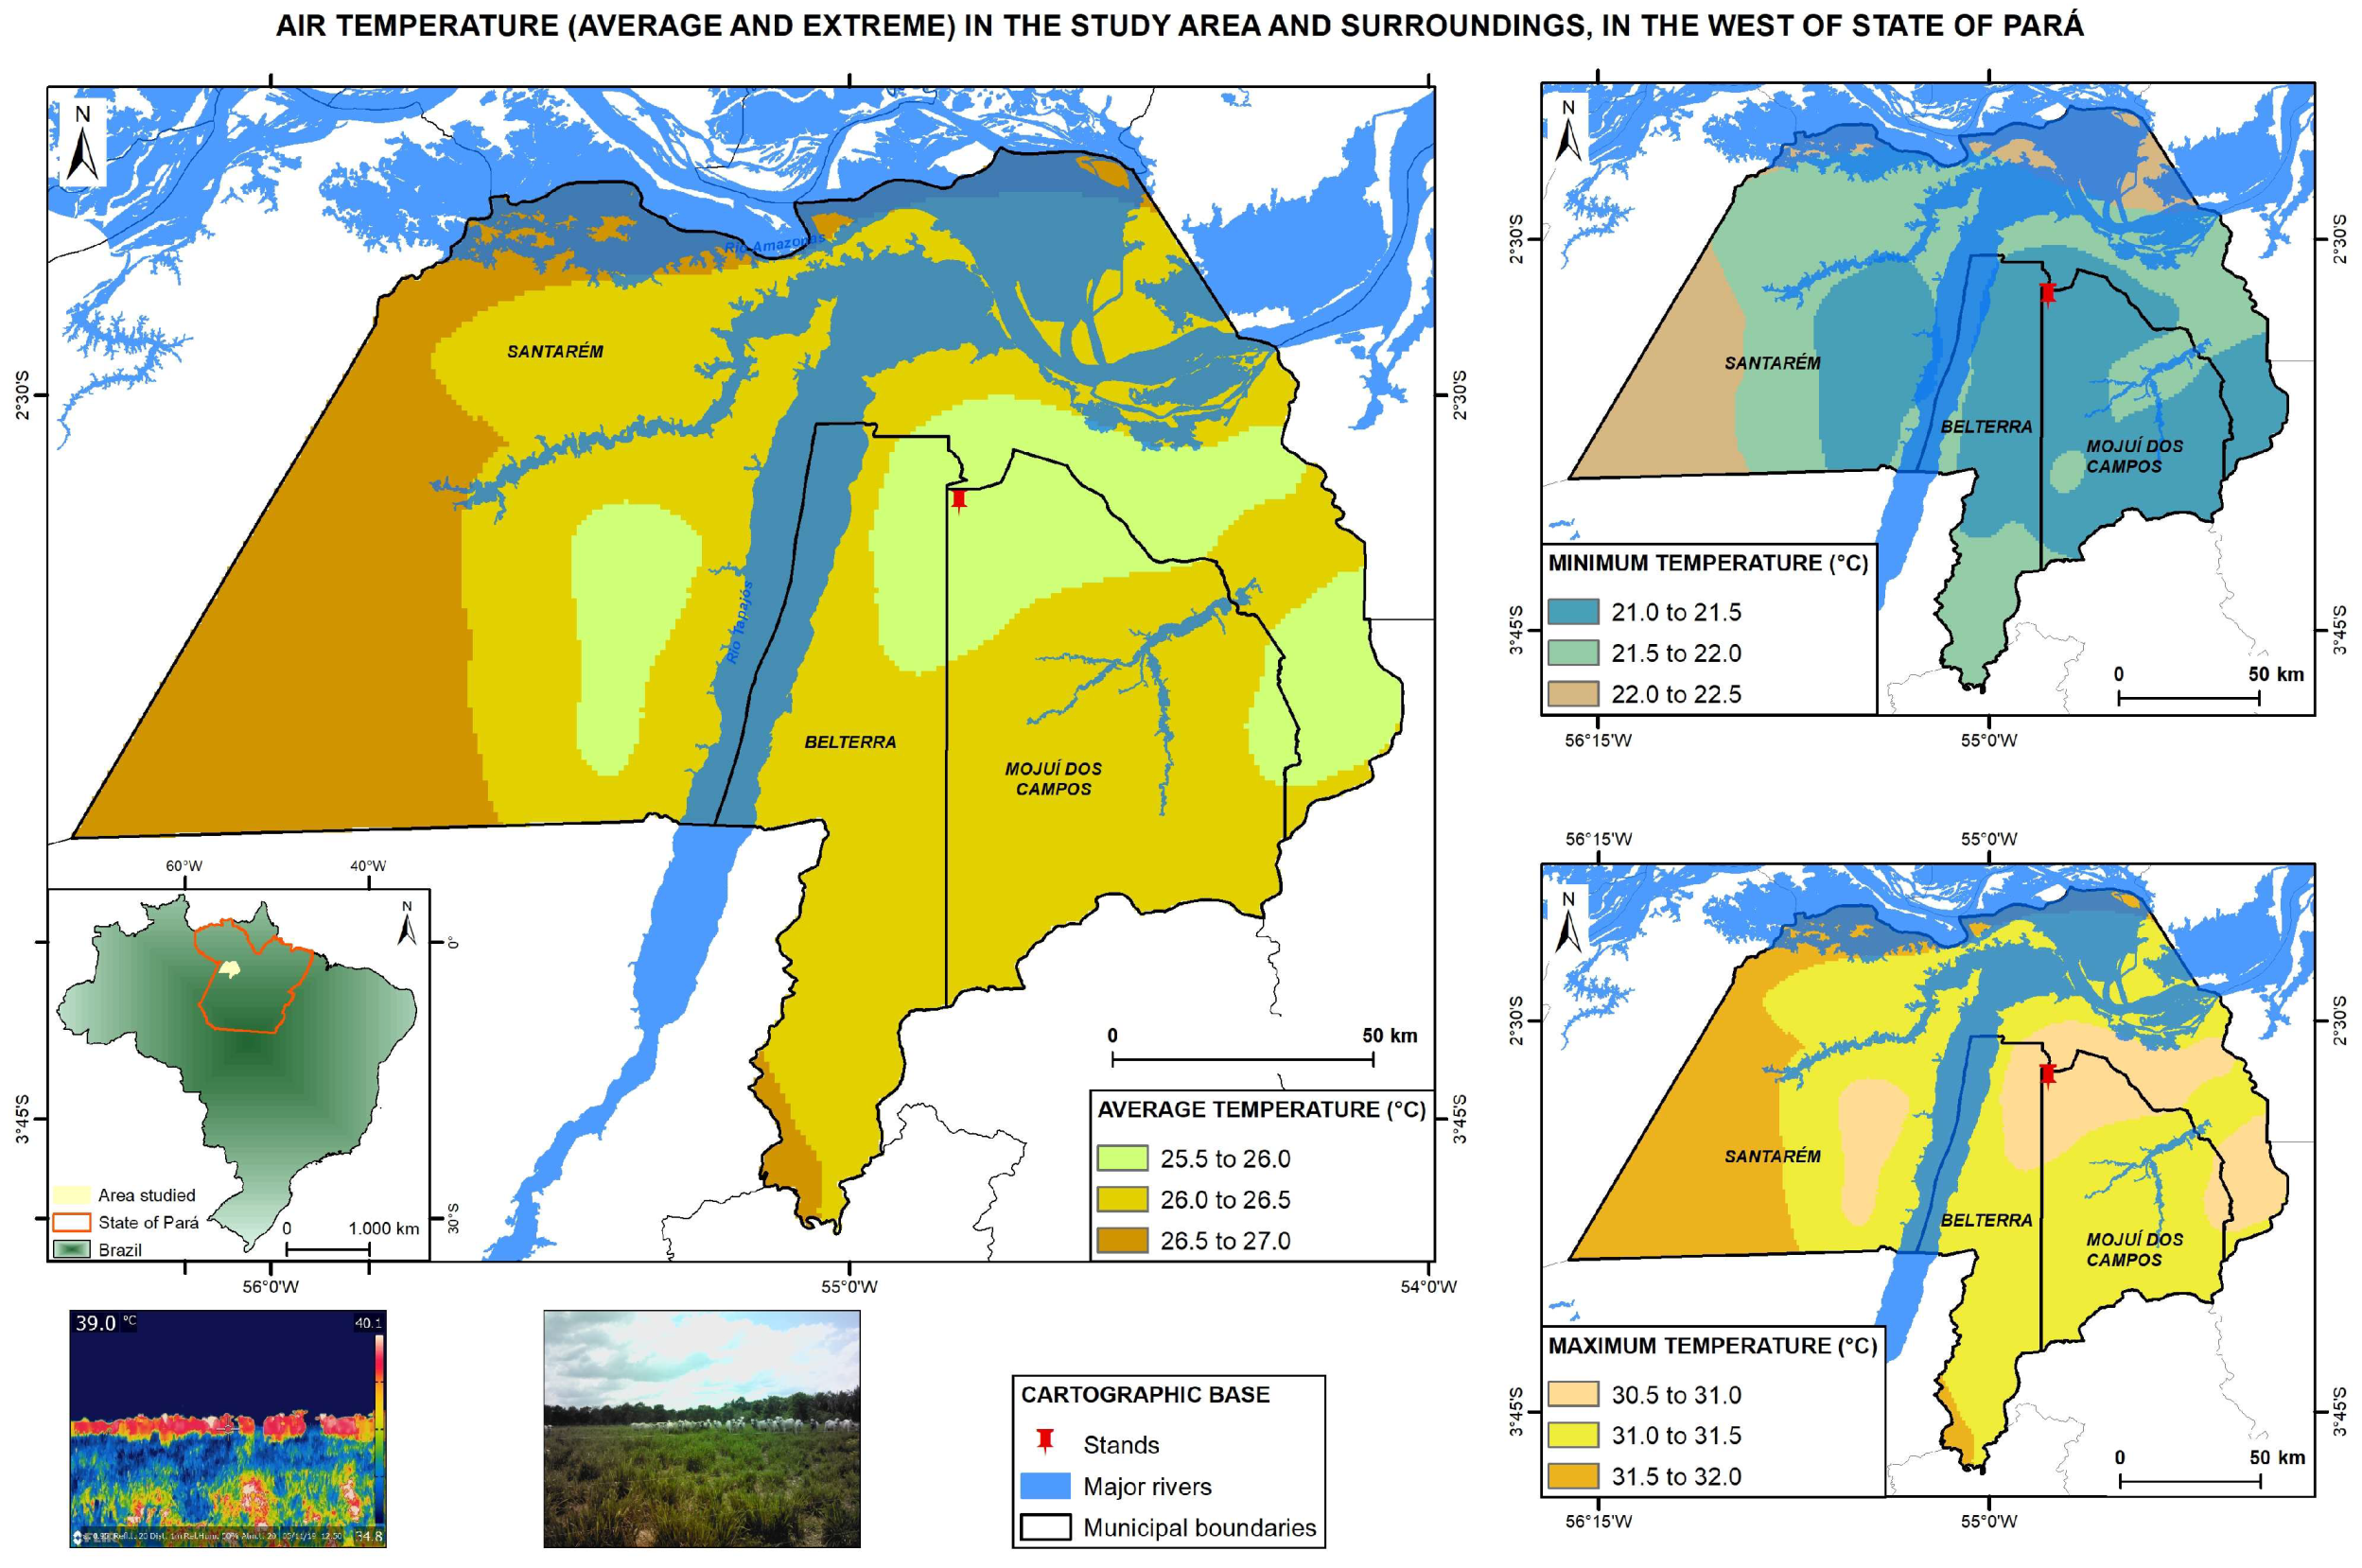
2.1. Field Site

This study was carried out on the Nossa Senhora Aparecida farm, Mojuí dos Campos, State of Pará, Brazil. The technological reference unit (TRU) is in the west of Pará, at an altitude of 152 m at the geographic coordinates 2°38′11″ S latitude and 54°56′13″ W longitude (Figure 1). The study area is in climate typology Am4 according to the methodology adapted by Martorano et al. [44], with less than 60 mm of rainfall in the driest month and an annual rainfall varying between 1500 and 2000 mm.
Figure 1 shows that the mean air temperature at the TRU is between 25.5 and 26.0 °C, and average temperatures in the surrounding area can vary between 25.5 and 27.0 °C. The minimum temperatures, which occur during the first hours of the day, oscillate between 21.0 and 22.5 °C, and maximum temperatures vary between 30.5 and 32.0 °C, indicating that during the hottest parts of the day, livestock can be under thermal stress, principally in pastures under full sun. The climate variables air temperature and humidity and animal temperature aid in evaluating animal thermal comfort conditions at this site. According to [45], on average, the air humidity at this site varies between 84 and 86%.
Pedological conditions, as reported by the Brazilian Agricultural Research Corporation (EMBRAPA) [46], are dominated by a yellow Oxisol with a heavy clay texture, and prior to the installation of the silvopasture, the site was occupied by vegetation typical of the Amazon biome.
EMBRAPA installed this TRU in an integrated crop–forest-livestock (ICFL) system in 2010. The forest tree species were planted in three separate plots, and these included the Brazil nut tree (Bertholletia excelsa H.B.K), Cumaru (Dipteryx odorata (Aubl.) Willd.), and African mahogany (Khaya grandifoliola C. DC). The areas without trees between the plots were used to plant grains and Brachiaria ruzizienses forage as a cover crop over four successive years. Subsequently, a pasture with Panicum maximum Jacq. cv. Mombaça was planted after the trees had already developed, with the goal of reducing damage to the trees from the cattle. The areas with trees serve to provide shade to the cattle after grazing in areas exposed to full sunlight.

2.2. Field Site History

The native vegetation was removed from the study site in 1996, and the cattle pasture was implanted immediately afterward [47] and maintained as such until 2009 [48].
The silvopastoral system was implanted in 2010. A soil analysis carried out before the installation of this system yielded a pH of 5.26, 30.66 g kg−1 for organic matter, aluminum 0.43 cmolc dm−3, calcium 2.96 cmolc dm−3, magnesium 0.93 cmolc dm−3, potassium 0.13 cmolc dm−3, phosphorus 2.17 mg dm−3, exchangeable bases 4.08, cation exchange capacity 4.51 mmolc dm−3, and base saturation 37%, according to Silva et al. [49]. At the moment of installation of the silvopastoral system, the pH was corrected with the use of dolomitic calcium, fertilizer was applied, and the soil was subsoiled, plowed, and harrowed.
The areas with grains planted between the tree rows were rotated with soybeans, corn, and rice. The forage Brachiaria ruzizienses was used as a cover crop and seeded at 20 kg ha−1 in succession after the grains (Figure 2).
Seedlings were replanted to replace seedling mortality, and crowning and branch pruning were conducted during the first four years [50]. Grain cultivation occurred using a no-till method, and crop rotation occurred until 2015, followed by pasture planting with Panicum maximum cv. Mombaça, which has been planted in all subsequent years.

2.3. Experimental Design

The trees were planted in three plots, and each plot is composed of eight rows of one of the species (B. excelsa, K. grandifoliola, or D. odorata), with a spacing of 7 × 5 m and a total of 280 plants in 0.92 hectares. The plots are approximately 166 m distant from a Nellore cattle pasture planted with P. maximum.

2.4. Sampling of the Study Sites

Field campaigns were carried out to conduct a forest inventory and take thermographic images (Figure 3).
A total of 30 (thirty) trees from each species were used for data collection. The two final rows and area between rows at each end of the plot were not sampled to eliminate edge effects. The trees were randomly chosen for measurements of dendrometric variables.
The thermograms were captured between the rows of the sampled trees, with the thermographic camera positioned in the middle of the area between rows at 3.5 m from the row to the right and 3.5 m from the left row. Figure 2 shows how the plots were planned and planted in this experimental area.
Six (6) images were taken in each area, and five surface temperature points were chosen in each thermogram for a total of 30 (thirty) readings in each plot.

2.5. Dendrometric Measurements

Stem with bark circumference measurements were obtained at 1.30 m above the soil using a metric measuring tape, and subsequently, the diameter was calculated (DHC). Additionally, measurements were obtained for the total height (m) between the soil surface and the highest branch using a telescopic ruler and for the canopy area (m) via two measurements, one in the north-to-south direction and one in the east-to-west direction, as in Harder et al. [51]. The canopy area was calculated according to Silva et al. [52], using the equation:
C a n o p y   a r e a = π L 1 + L 2 2 ² 4
where Canopy area (m2); L1 represents the length in the north-to-south direction (m); and L2 represents the length in the east-to-west direction (m).
The canopies of the tree plots were photographed to evaluate their interception of light. The gap light model was then used to evaluate the light levels in the forest. These measurements serve to characterize the growth and morphology of the trees [53], which affects the temperature of the canopy. The degree of canopy closure was measured using the program Gap Light Analyzer, according to Kim et al. [54] (Version 2.0, Copyright, Canada, and USA) (Figure 4). A total of 30 images were taken of the canopies at the same points where the thermographic images were taken in the central rows of each area, excluding the rows and the areas between the rows of the two lateral margins to eliminate edge effects.

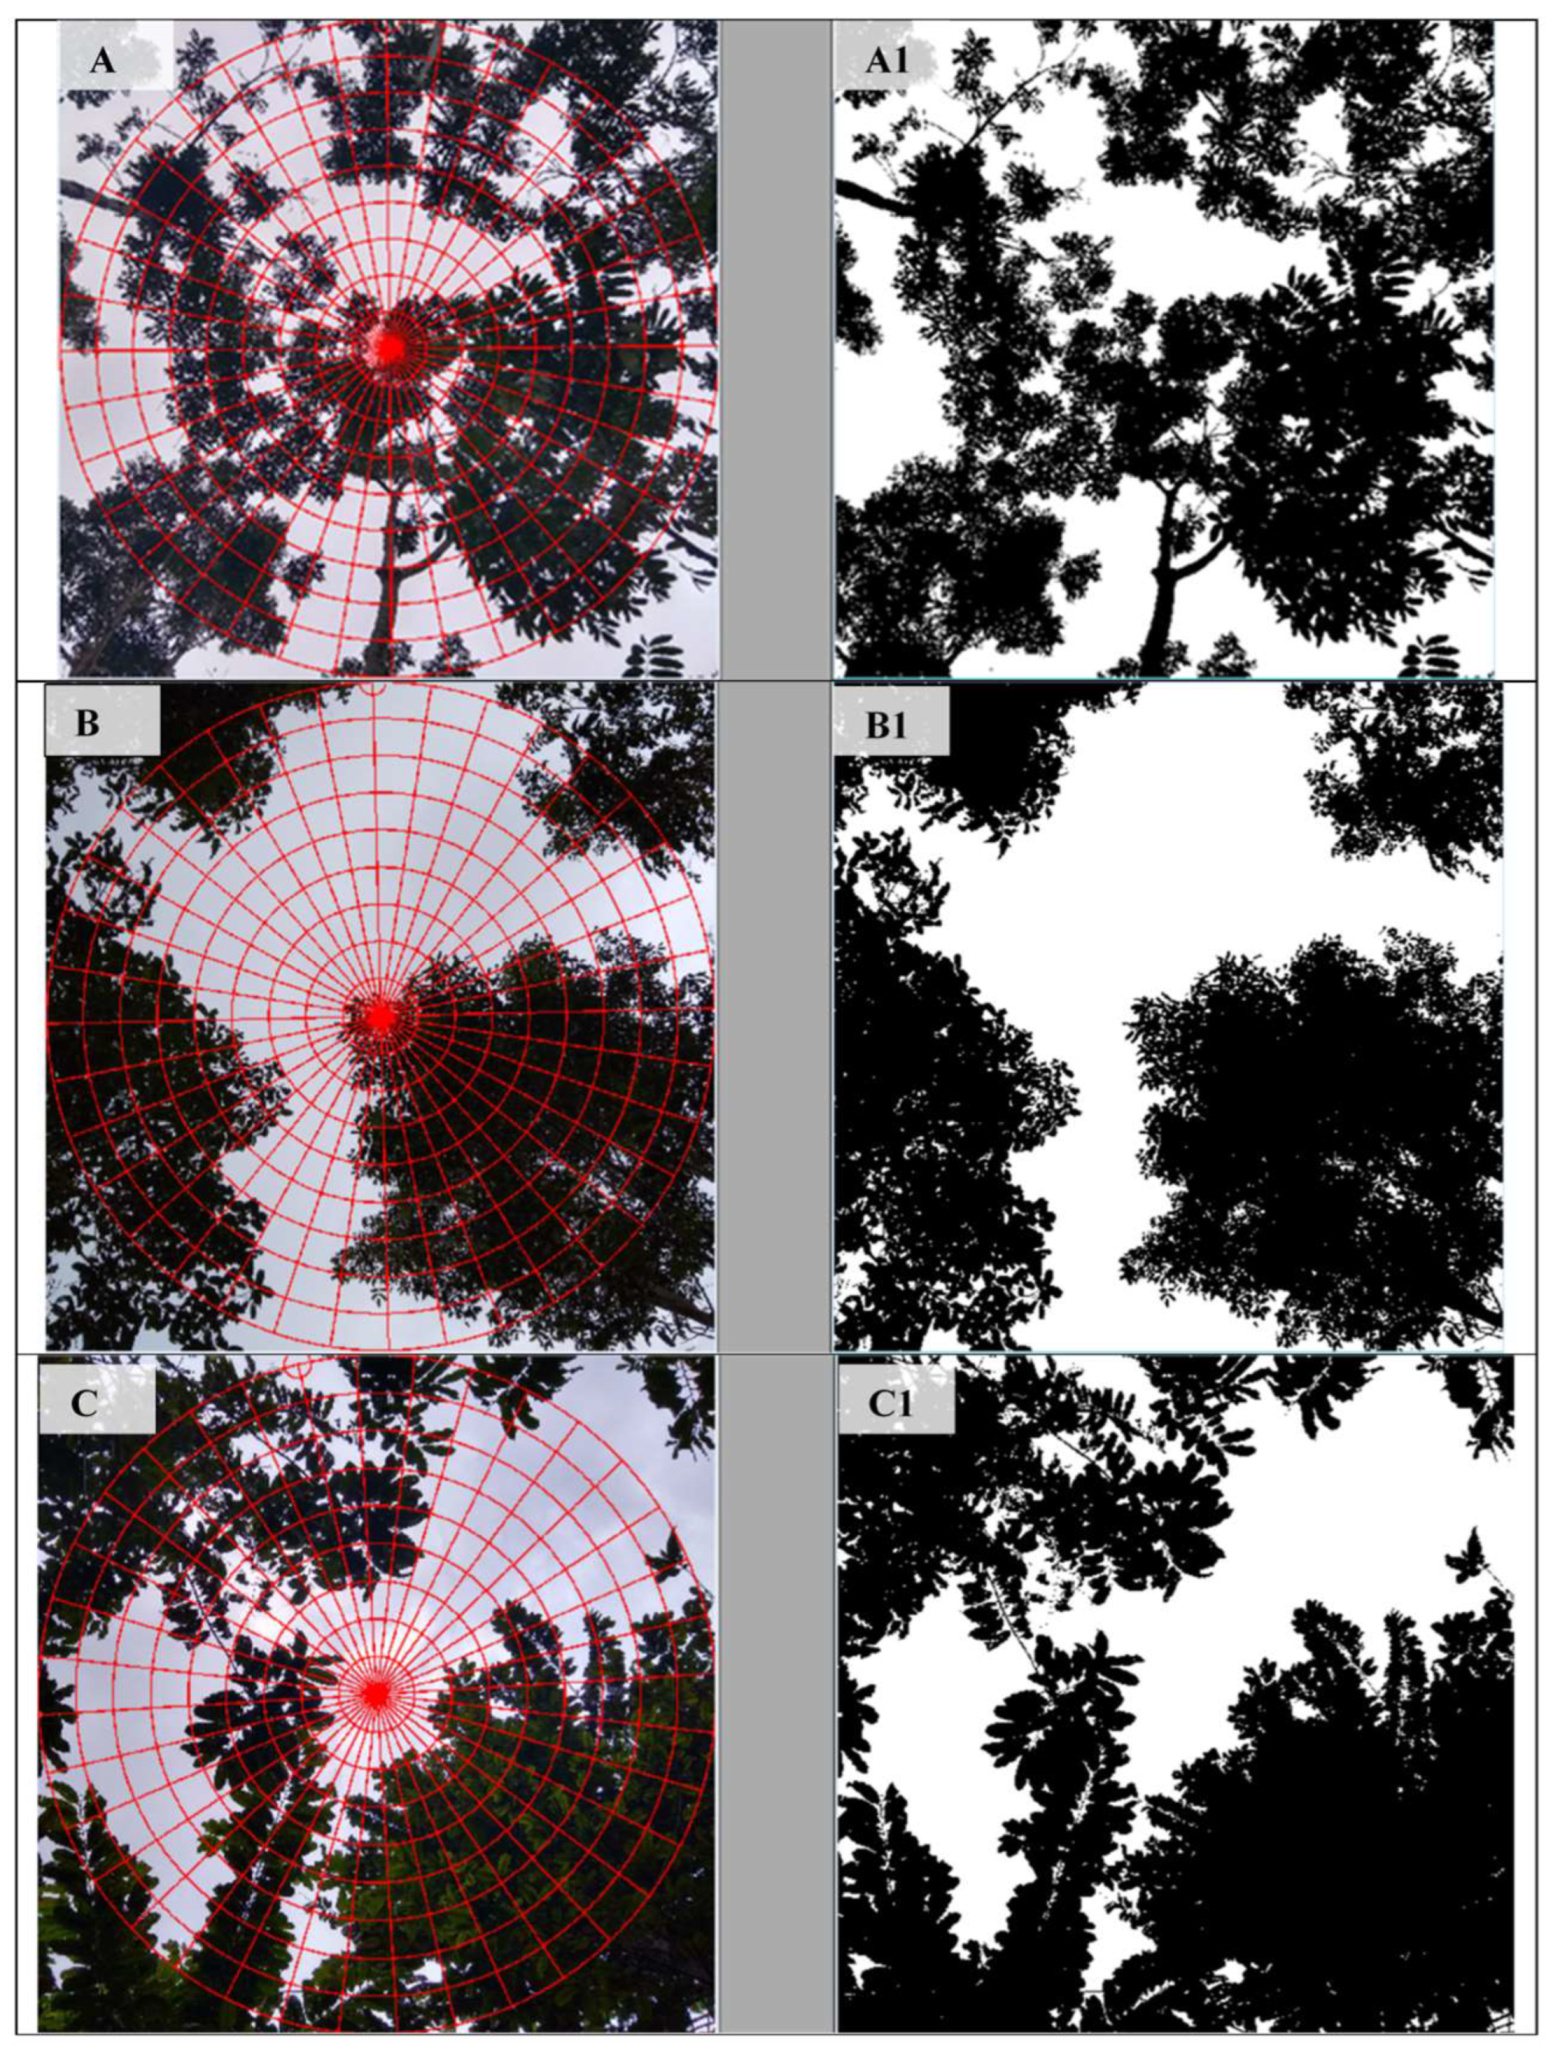
2.6. Near-Infrared Thermography

Data were collected using an infrared thermographic camera (FLIR T650sc, Wilsonville, OR, USA, 2015) with emissivity set at 0.95. The thermograms were analyzed using the program Flir Tools, 6.3v (FLIR Systems, Inc., Wilsonville, OR, USA, 2015), as shown in Figure 5. The camera was always used by the same operator and was used at eye height without aid of a tripod, perpendicularly focused on the target, according to the methodological recommendations in Barreto et al. [17].
For each evaluated area, six thermograms were analyzed for the temperatures of the soil, tree species, and exposed pasture, and the images were taken between 11 h 00 min and 13 h 00 min. These images are denominated the surface temperature (TS) images of the targets.
The images were taken in the months of August (Aug_temp) and October (Oct_temp) 2018, which is the dry season in the region. August is the month in which soil water deficits begin to appear. According to Martorano et al. [45], even in area with greater rainfall (climate typology Af2) such as Belém, August is the month in which soil water deficits begin, and this period extends through November, with October being the month with the highest soil water deficits. For this reason, thermographic images taken in October were used to monitor thermal responses in dry soil.

2.7. Statistical Analysis

The data were tested for the homogeneity of variance of residuals using the Bartlett test and for the normality of residuals using the Shapiro–Wilk test. The data were analyzed using the Kruskal–Wallis test via the RSTATIX package to test whether the samples came from the same distribution. The Wilcoxon test, adjusted using the Bonferroni test, was used to compare samples using the GGPUBR package.
With the objective of evaluating the surface temperatures of the targets for each tree variable in the silvopastoral system, a principal components analysis (PCA) was carried out. The PCA is a multivariate analysis technique that allows for the study of simultaneous relationships between several variables. The objective of this analysis is to analyze p variables X 1 , X 2 , , X p to find new variables resulting from the linear combinations Z 1 , Z 2 , , Z p , labelled indicator variables or principal components, which are not correlated and retain most of the variance of the dataset. This means that these variables can express most of the variance in the data while eliminating the noise:
Z 1 = a 11 X 1 + a 12 X 2 + + a 1 p X p Z 2 = a 21 X 1 + a 22 X 2 + + a 2 p X p Z p = a p 1 X 1 + a p 2 X 2 + + a p p X p
where a i j represents the elements corresponding to the respective autovector related to the component Z i . The autovalues ( λ i ) are the variances of the principal components of the matrix of the variances and covariances of the original data, where λ 1 λ 2 λ p 0 .
The autovectors and autovalues are obtained through a singular value decomposition (SVD) from the matrix of the variances and covariances generated by the original data. The first components are those that capture the most variation in the data ( V a r ( Z 1 ) V a r ( Z 2 ) V a r ( Z p ) , retaining, therefore, most of the variation. Success is achieved in this analysis when the existing variation in the final components is so small that it can be ignored [55,56].
All tests were performed using R software [57]. The packages used were FactoMineR [58] for the PCA and factoextra [59] for the graphical representations (Biplot). The following variables were used in this analysis: (1) arboreal, the diameter at breast height (DBH), total height (Ht), canopy area, and light gaps; and (2) thermography, the temperatures in August (Aug_temp) and October (Oct_temp). The analysis was performed using standardized data to maintain a standard variance in order to avoid the magnitude of one variable dominating the remainder.
First, a PCA was performed for the gap light and thermography data for the three tree plots in the silvopastoral system and for the full-sunlight pasture, which provided an overview of the relationship between the solar radiation and microclimate in each system. Then, a PCA was performed for the thermography and dendrometric data for the three tree plots in the silvopastoral system to observe the relationship between the morphometric characteristics of each species and the microclimate, as modified by each of them.

3. Results

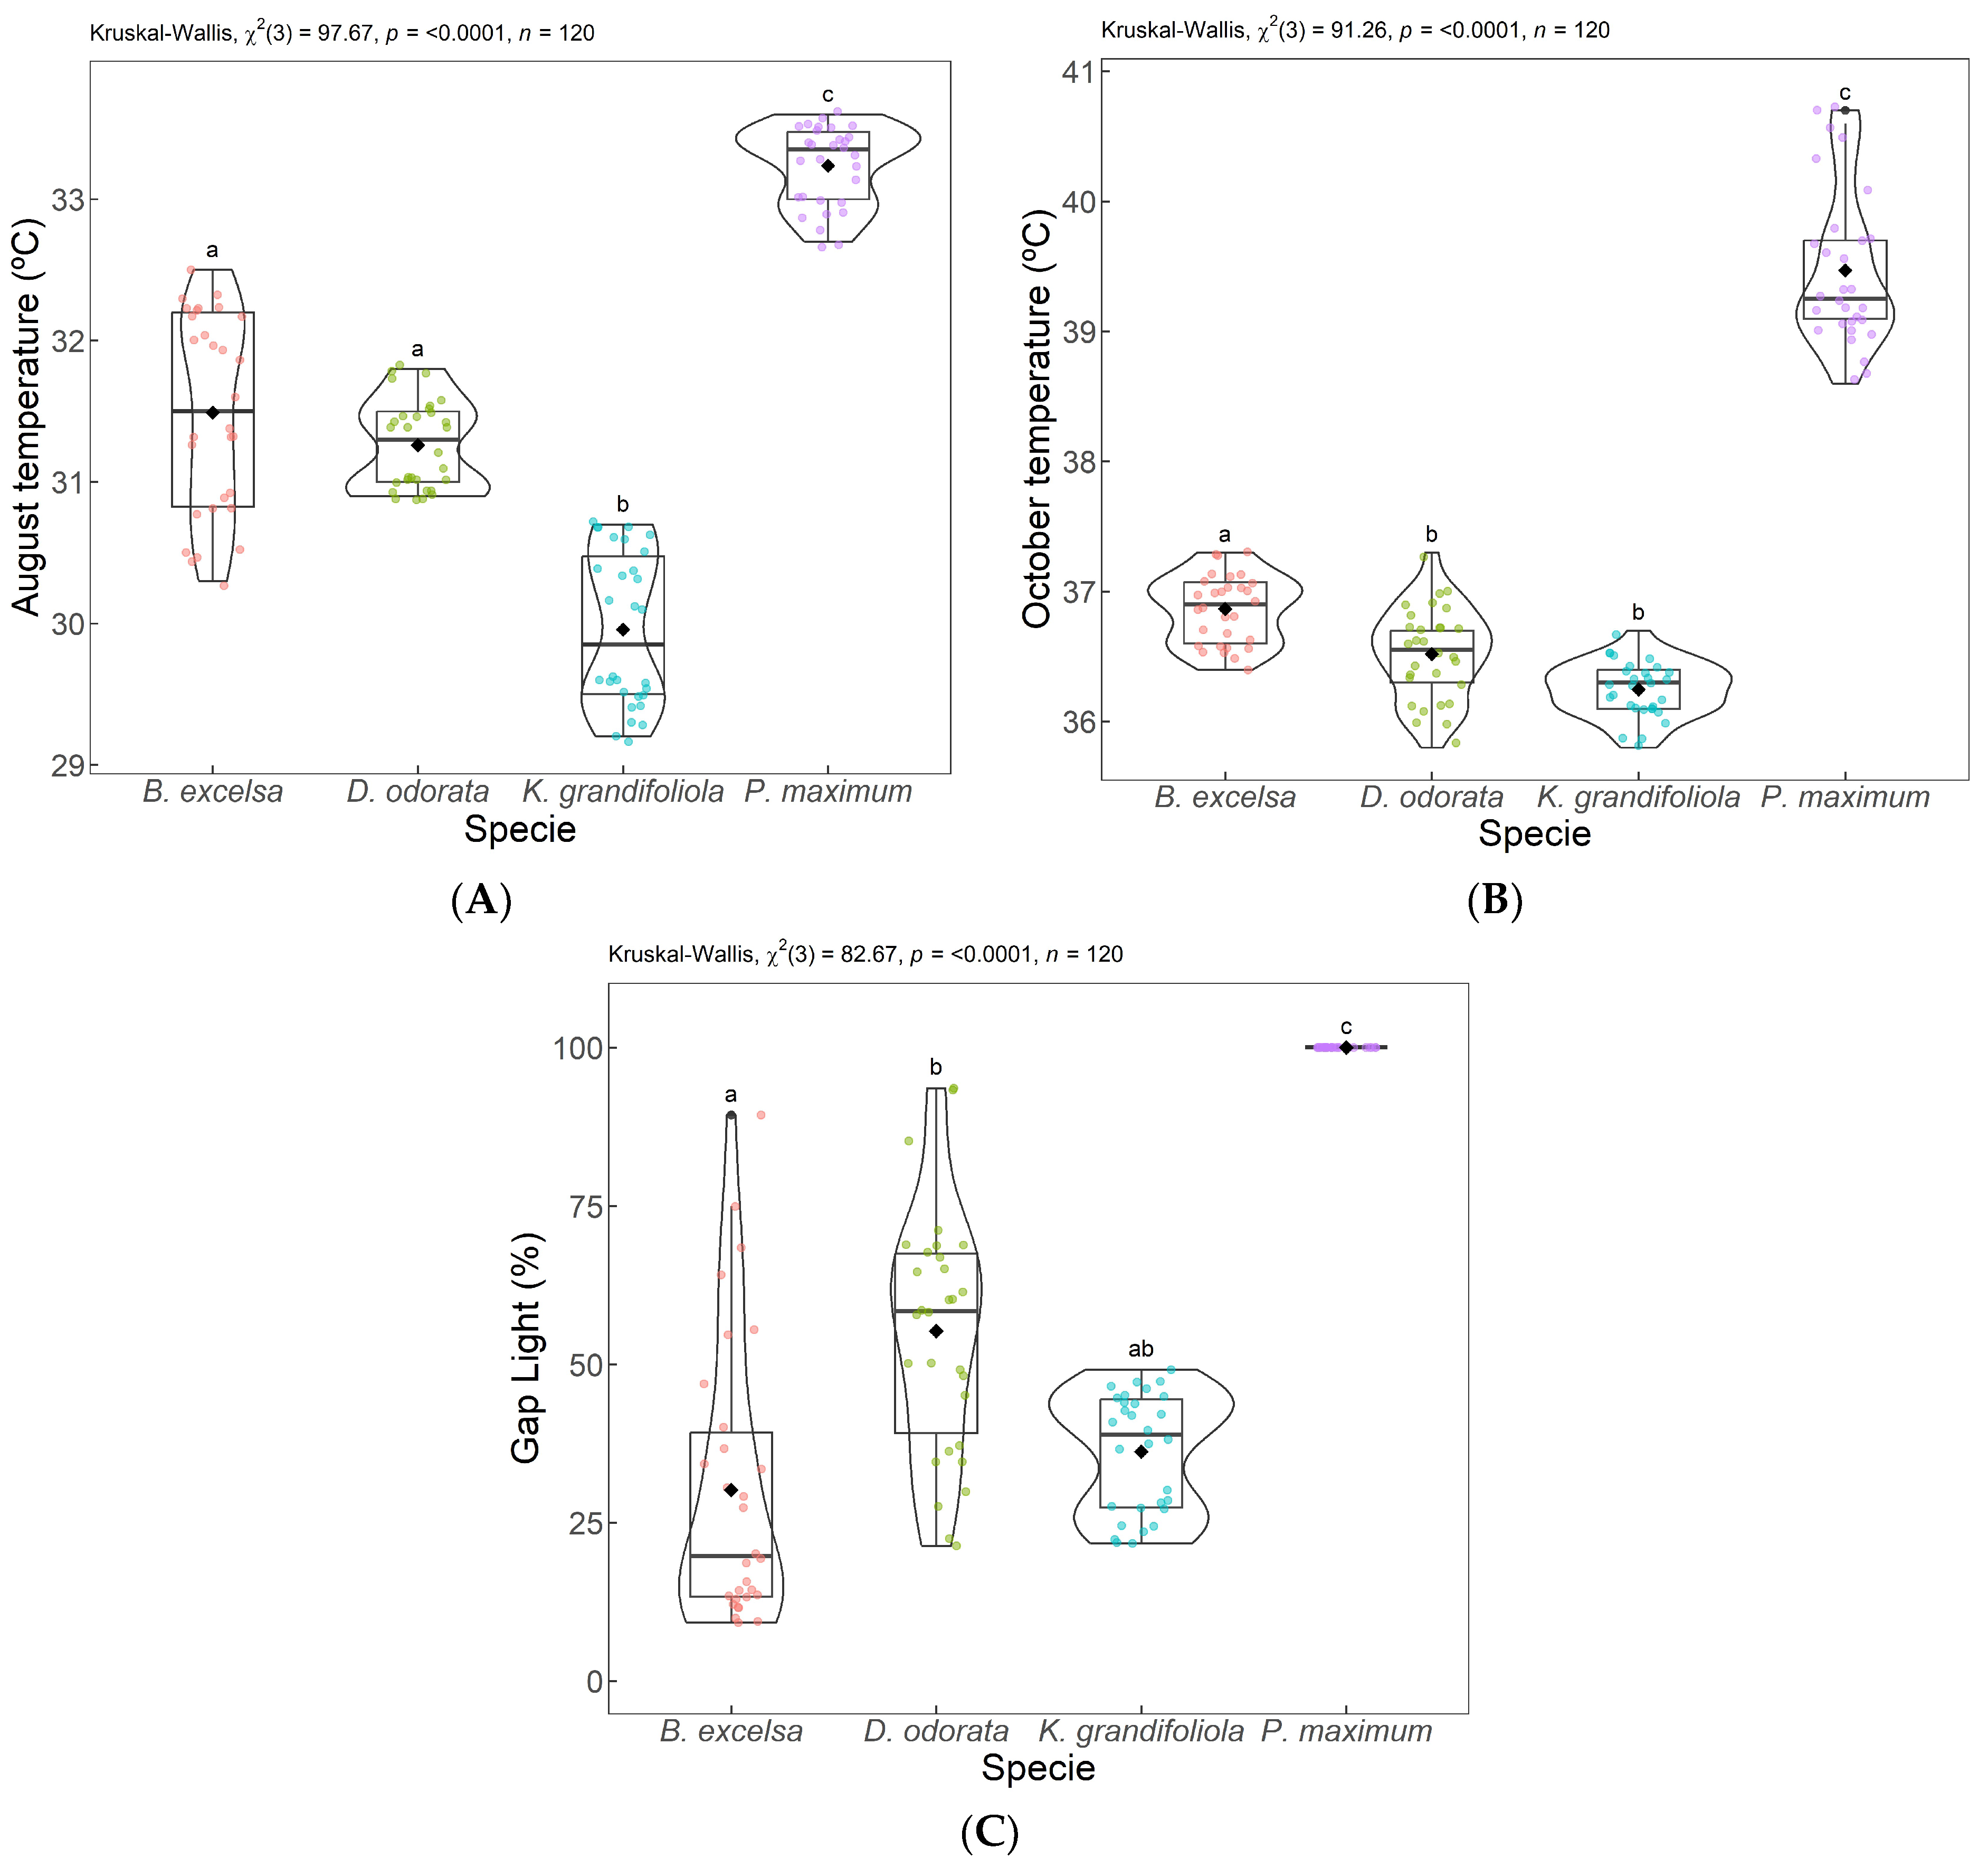
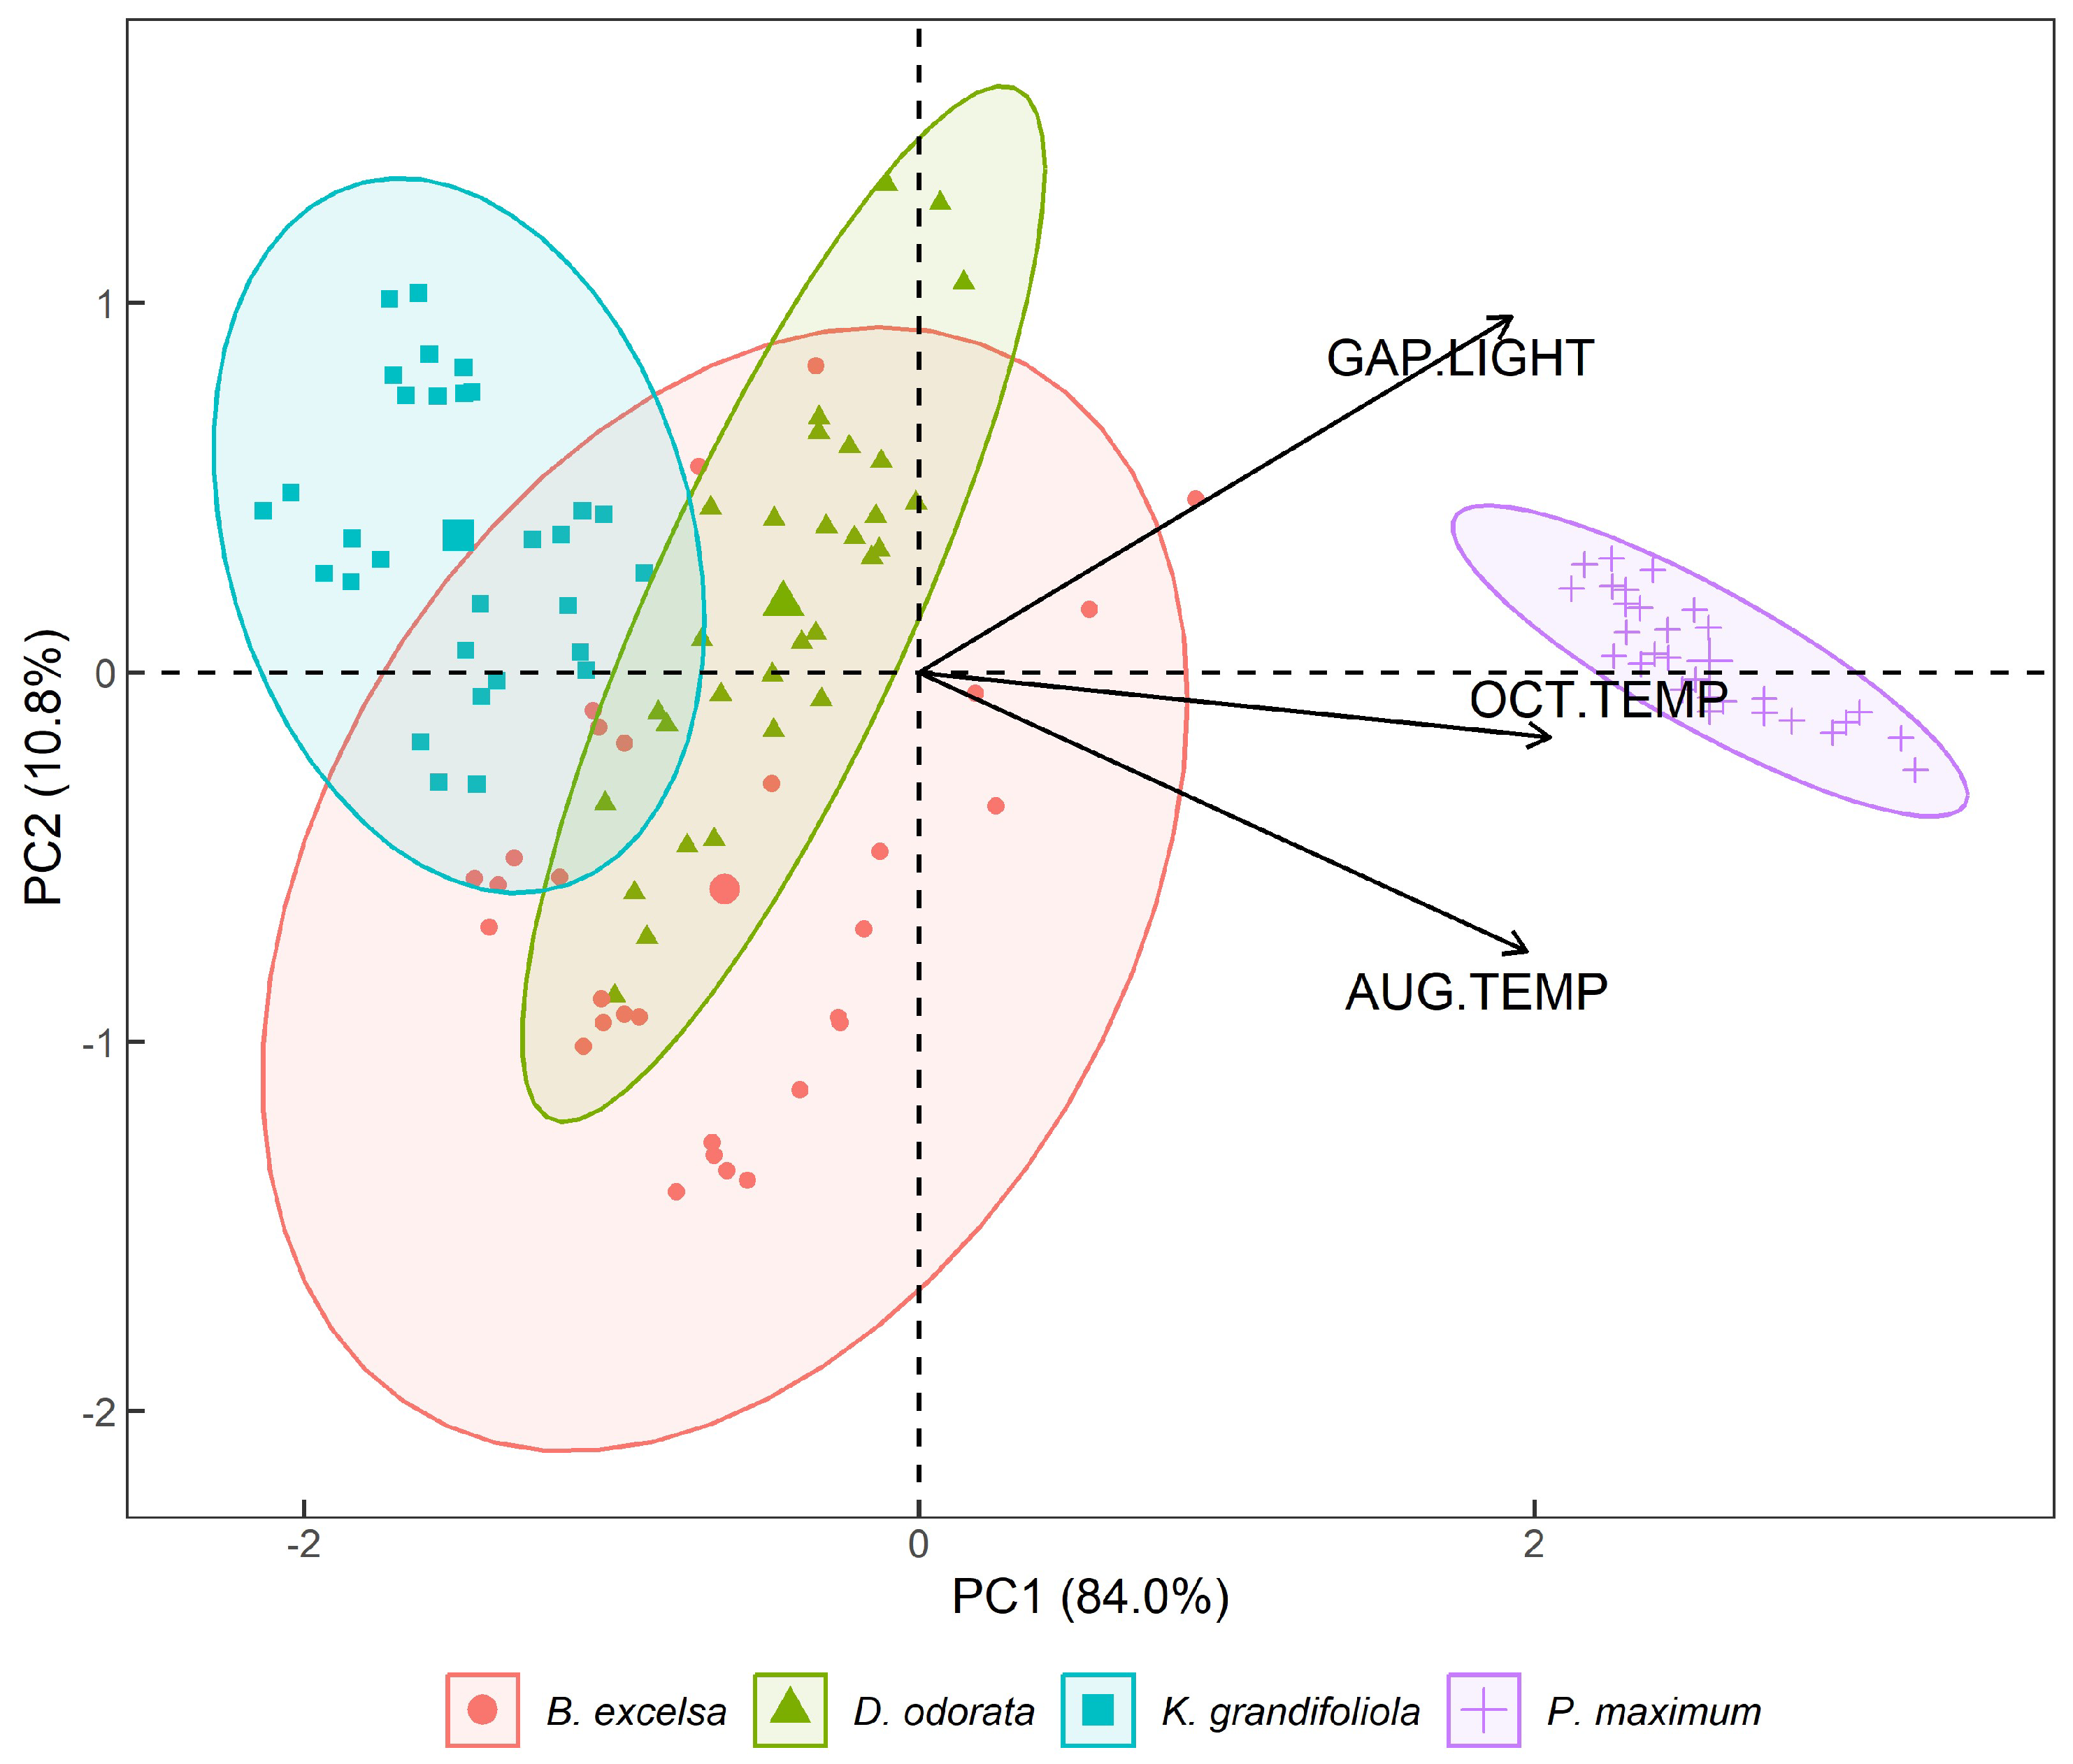
3.1. Results from PCA 1—Gap Light and Thermographic Data

The extreme thermal values (minimum and maximum), mean temperature, and the amplitude of TS in each plot are presented in Table 1. The averages for the highest temperatures were found in the full-sun pasture (P. maximum cv. Mombaça) in August and October 2018. The lowest average temperatures were found in the K. grandifoliola plot. The greatest amplitudes were found in the B. excelsa plot in August and in the pasture in October.
The mean for gap light in the canopy (n = 30) was 30.19% for B. excelsa, with a standard deviation (SD) of 22.23. For D. odorata, the mean was 55.27%, with SD = 19.14. For K. grandifoliola, the mean was 36.21%, with SD = 9.38 and 100% of the mean for gap light in full-sun pasture (P. maximum cv. Mombaça) explained by the absence of trees.
During the data collection period, the cattle were observed heading toward the area shaded by the trees, principally during the hottest hours of the day, although these data were not quantified.
In Figure 6, the box plots show significant differences between the evaluated plots. For August (Figure 6A) and October (Figure 6B), the TS was superior in the full-sun pasture (P. maximum cv. Mombaça) compared to the silvopastoral plots (B. excelsa, D. odorata, and K. grandifoliola). The lowest TS was observed in the silvopastoral plot with K. grandifoliola, which was significantly different than the other plots in August 2018 and lower than in the K. grandifoliola and D. odorata plots in October 2018.
Figure 6C shows that among the silvopastoral areas, D. odorata and K. grandifoliola allow for greater light penetration. D. odorata is smaller than the other two species and has small leaves which allow for more light to pass through the canopy. K. grandifoliola grew very quickly during the first years and was therefore much taller than the other two species, but the size and format of its leaves is the same as that of D. odorata (Figure 4).
The first PCA values regarding the gap light and thermal responses in the tree plots and full-sun pasture are expressed in PCA1 (Figure 7).
For the determination of the number of principal components, the first two PCs for analyses should have variations greater than 70%, and according to Rencher [60], 70% of the total variance should be explained by the first and second principal components.
Using the PCA, associations between the variables were observed which established common factors between them. The first two PCs were responsible for 94.8% of the total variation compared to gap light and temperature in the silvopastoral and full-sun treatments, wherein PC1 was responsible for 84.0% and PC2 for 10.8% of the variation in the data (Figure 7). Therefore, the first two principal components effectively account for the total variance and can be used to study the entire dataset.
The variables that are positively correlated are grouped in the same quadrant, while the negatively correlated variables are grouped in opposing quadrants, and an angle of 90° between variables indicates that there is no correlation.
In the Biplot CP1 × CP2 (Figure 7), the gap light in the plots and the average temperatures, as measured by thermography, show that the pasture had higher temperatures, principally in October. In the silvopastoral plots, K. grandifoliola was the species that had the lowest values for gap light and temperature during both months.
The species B. excelsa had values that were between the other two species for gap light and temperature in August and October, while D. odorata had the lowest values for temperature and gap light. The full-sun pasture (P. maximum) had values that were distant from those of the other treatments, and gap light and temperature in August and October were positively correlated.

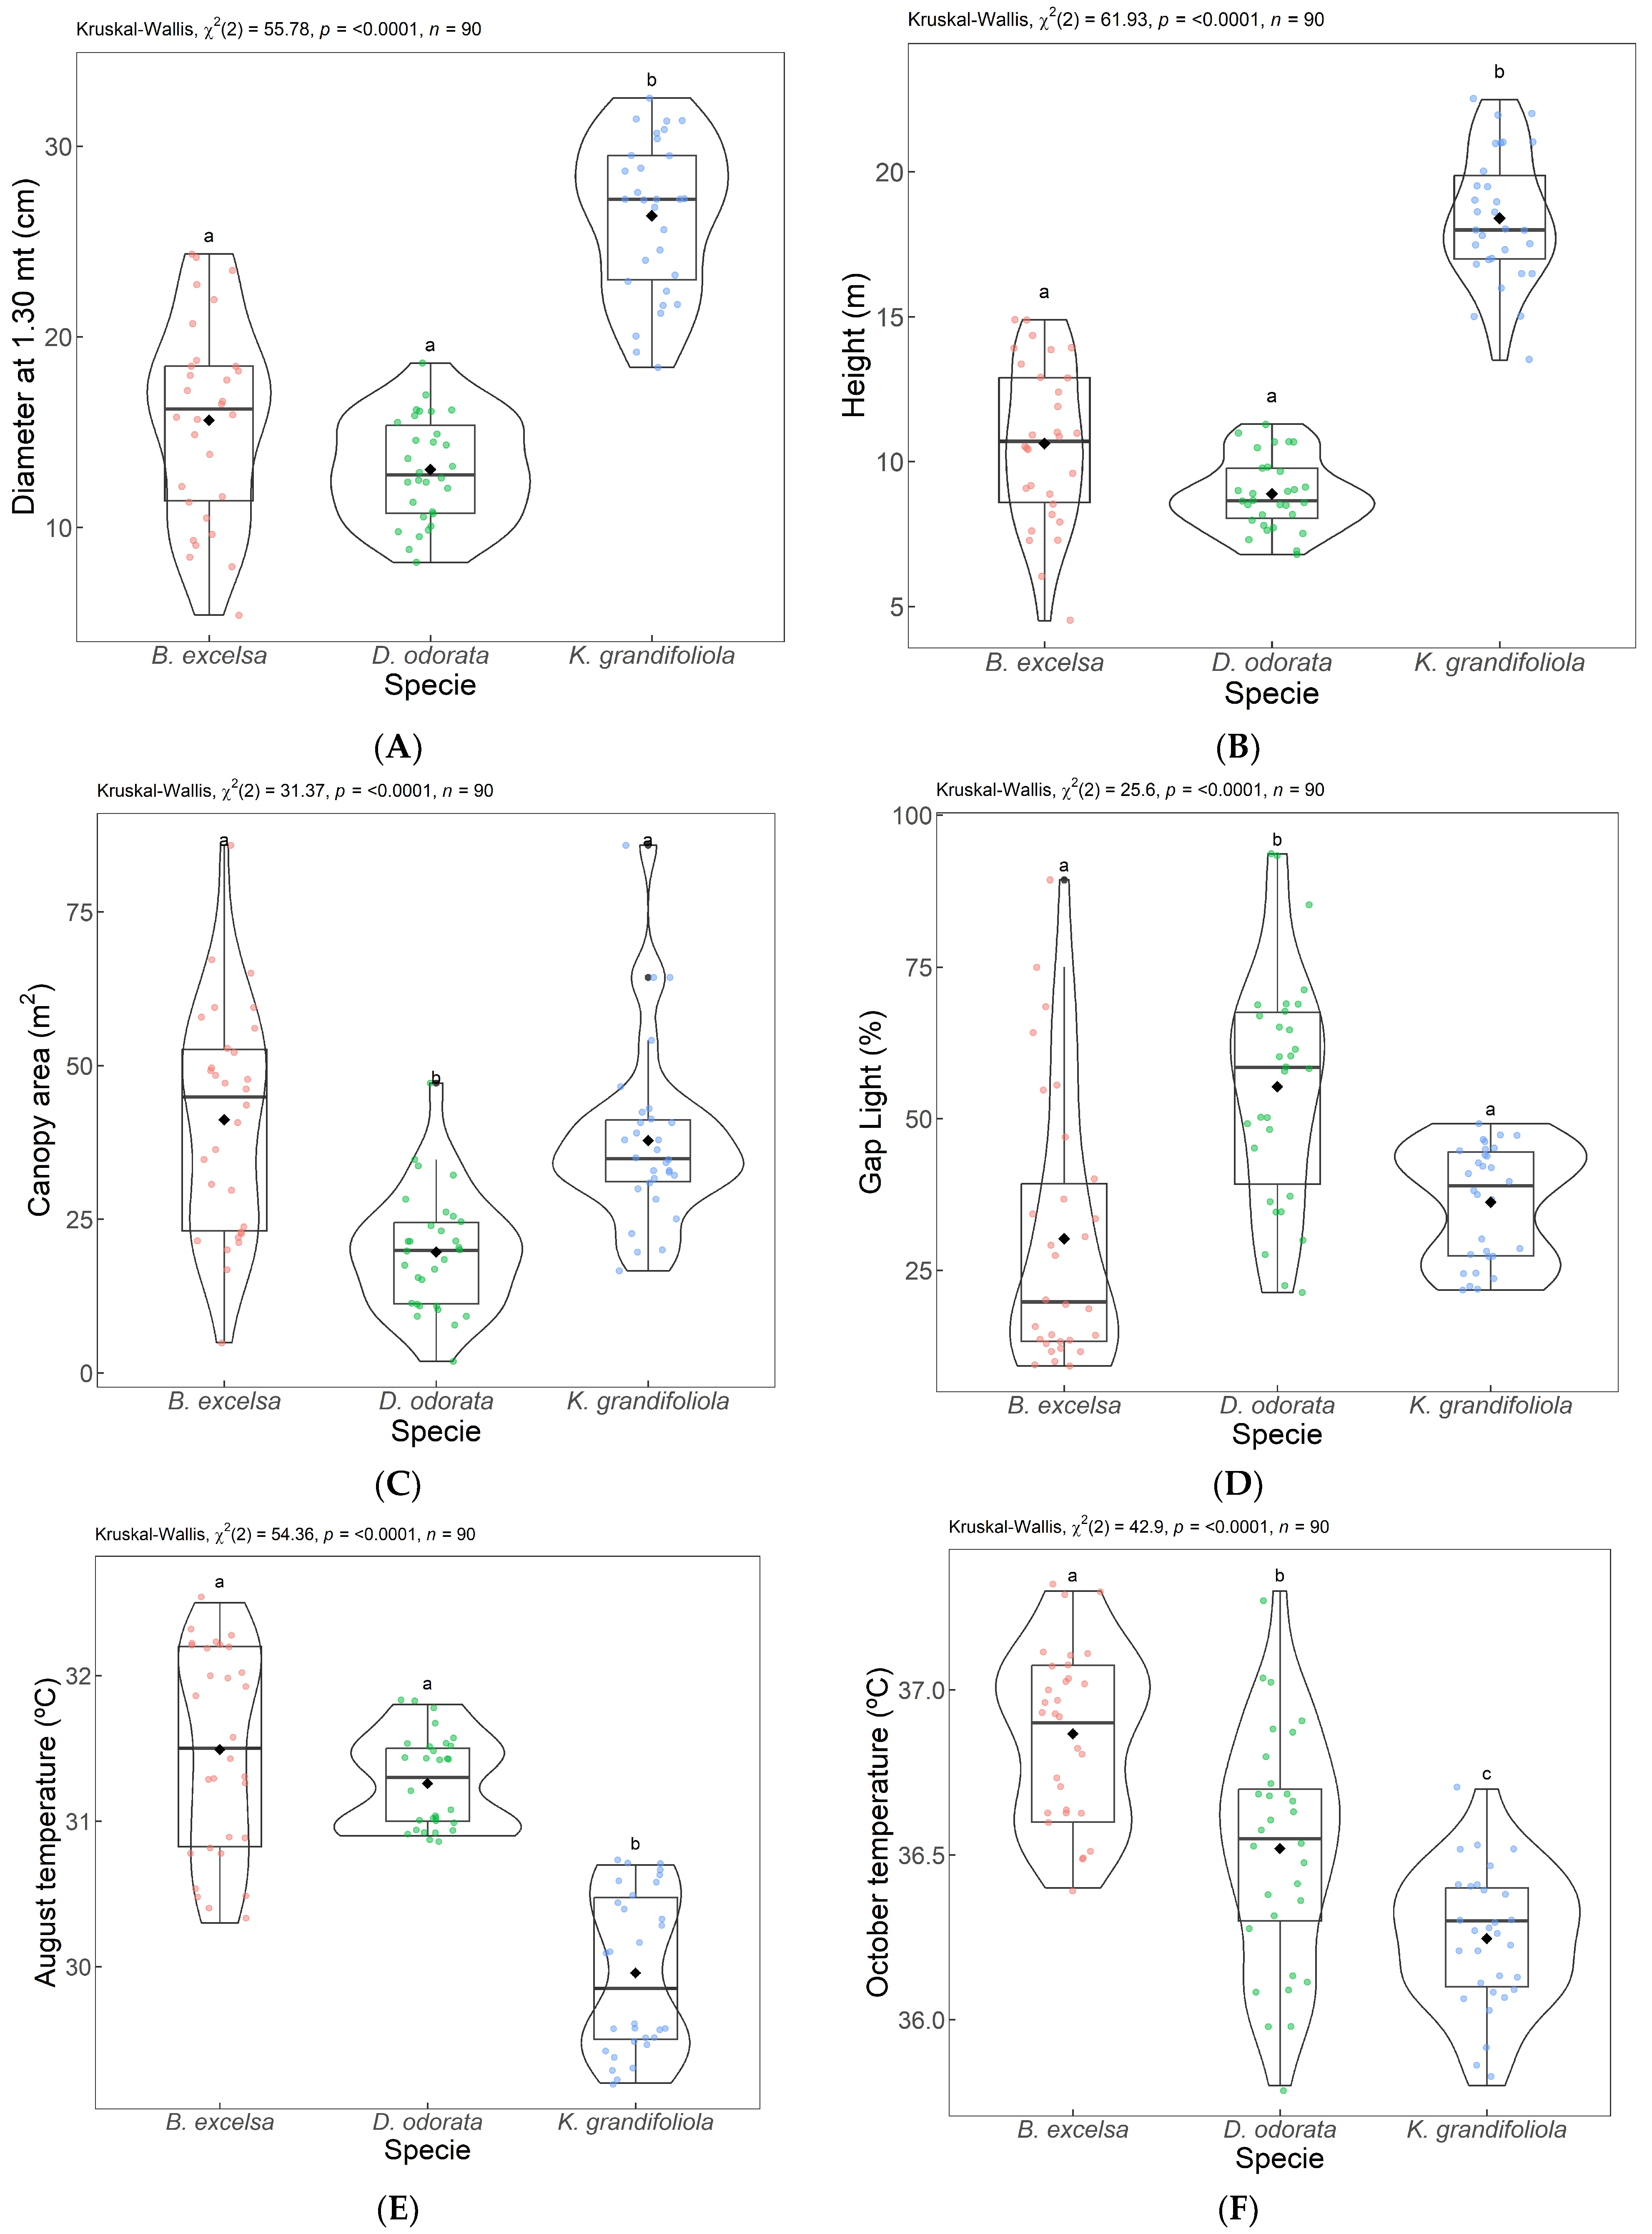
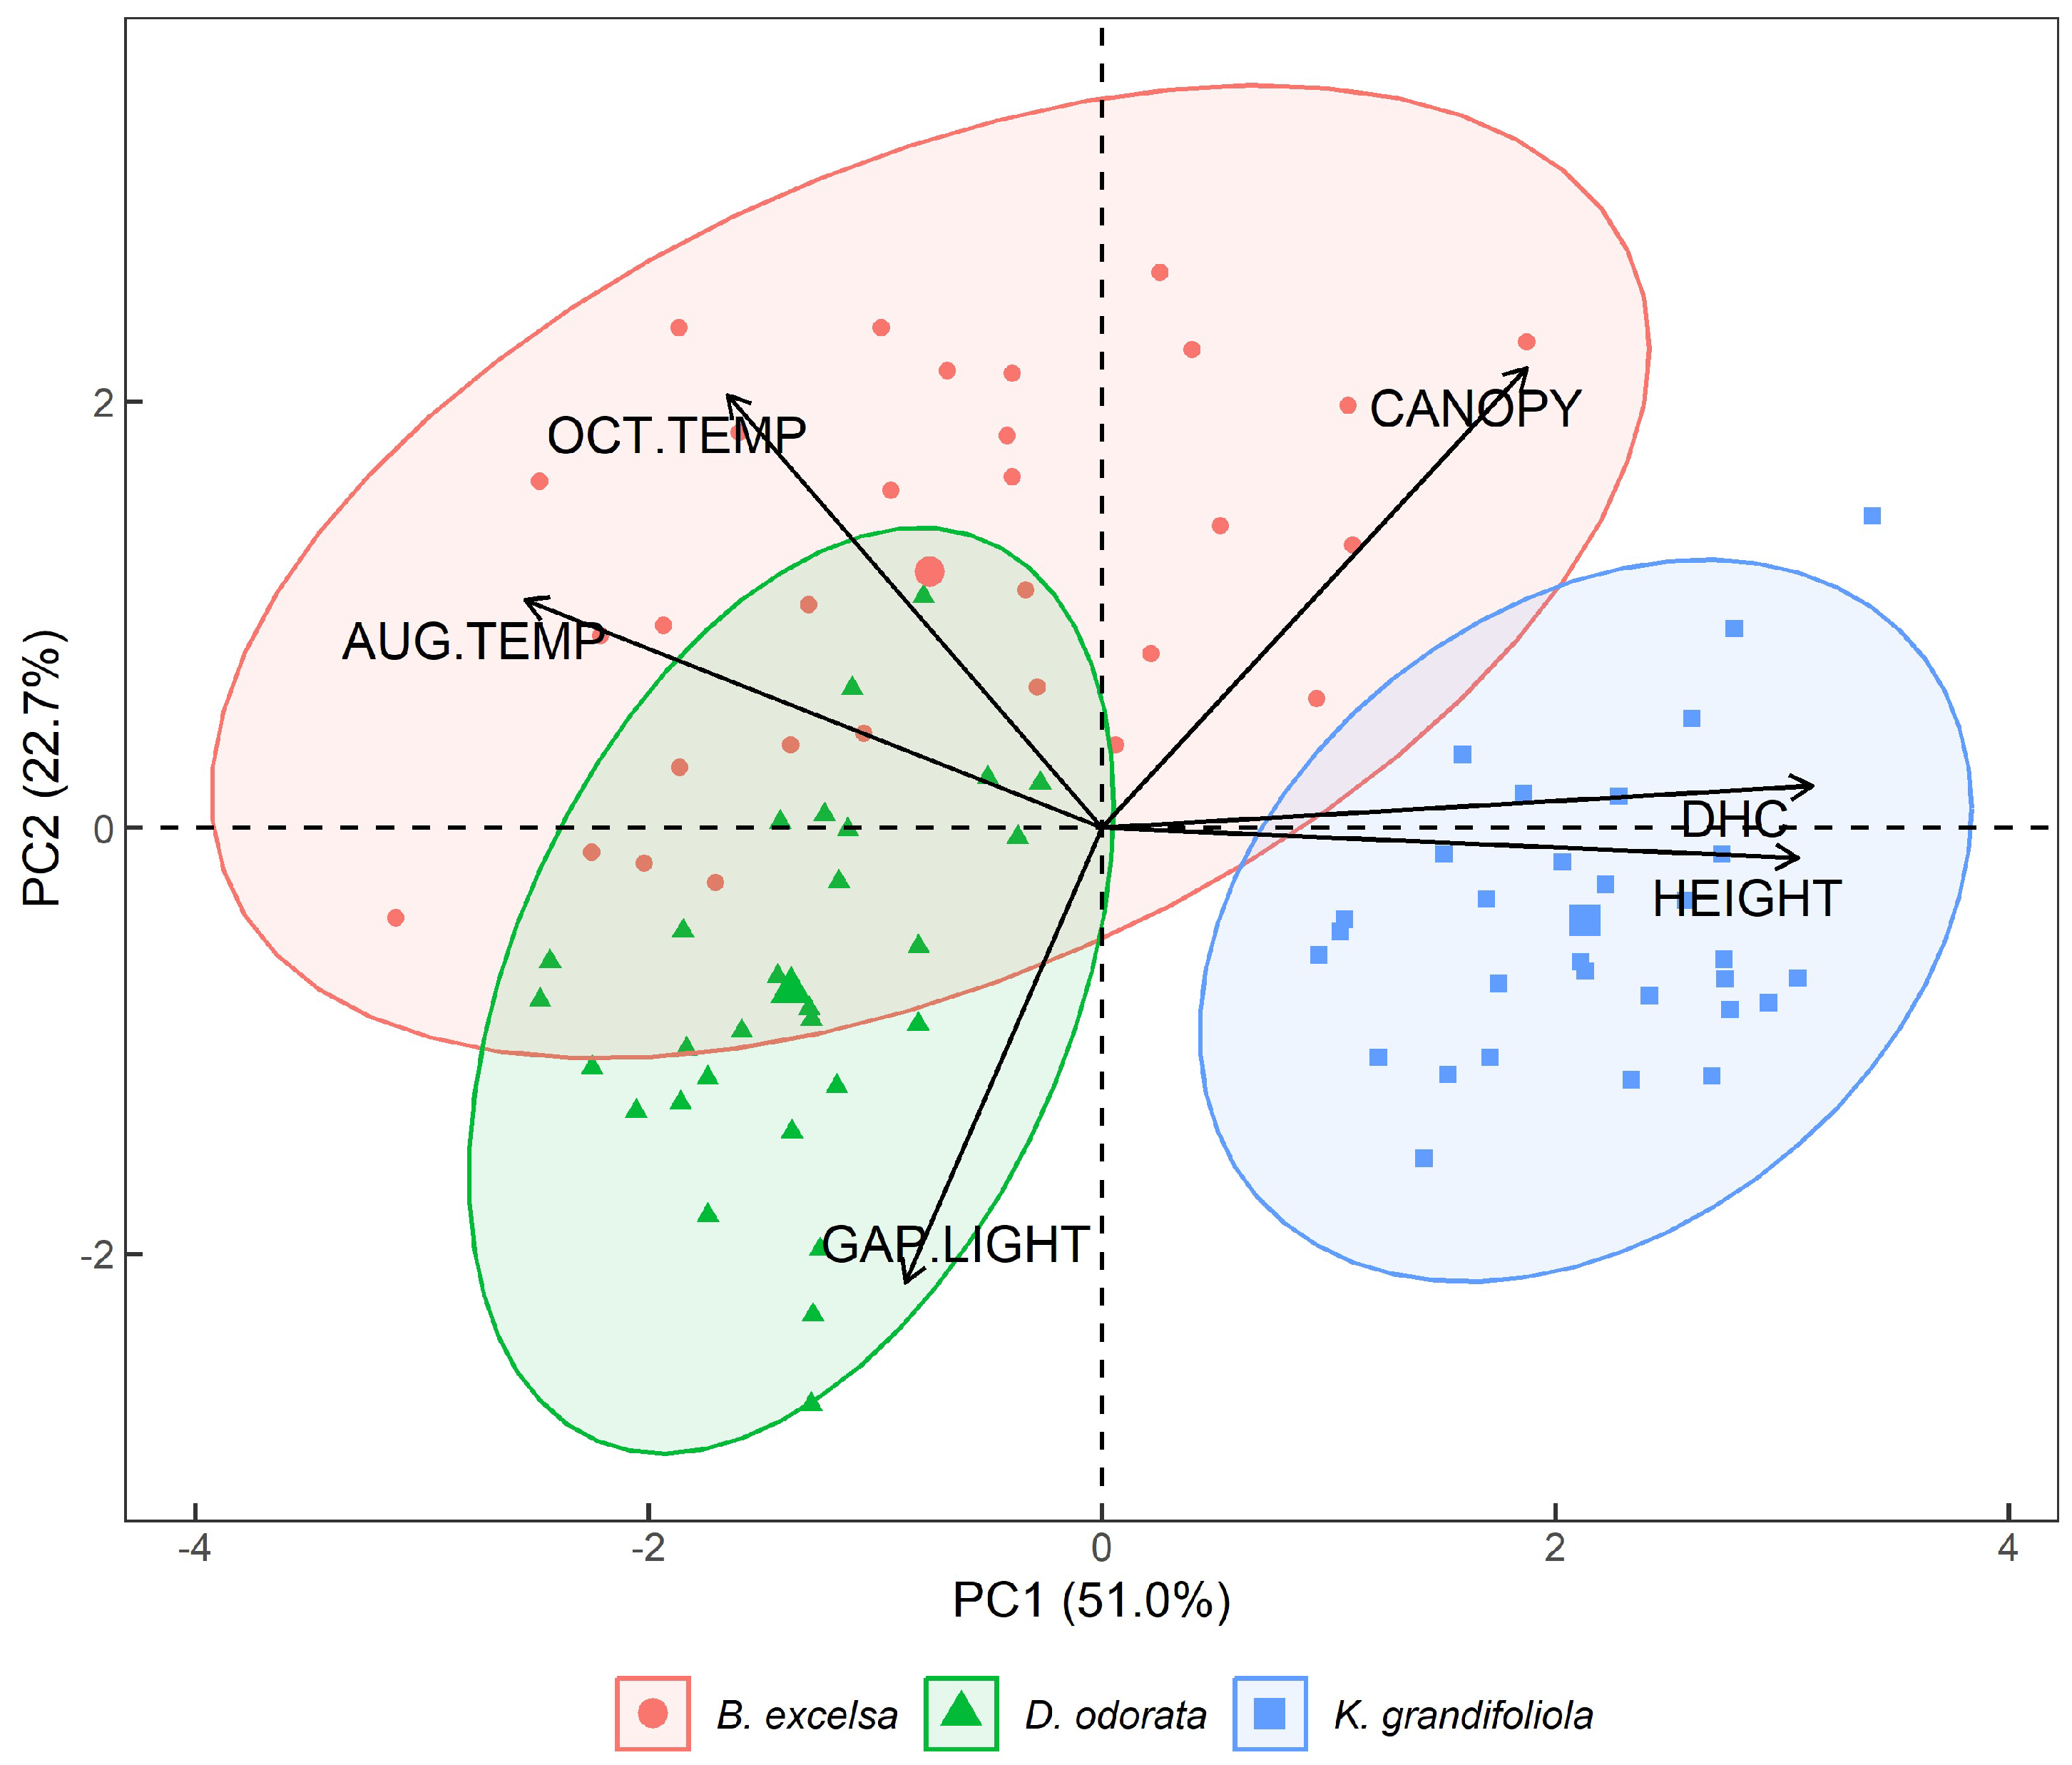
3.2. Results from ACP 2—Dendrometric Variables and Temperature

The means for the dendrometric variables for the 9-year-old trees in the silvopastoral treatment are shown in Table 2.
The species that had the best performance with respect to DBH and height was K. grandifoliola. After 9 years in the system, K. grandifoliola had mean height of 18.40 m and 26.35 cm of DBH. Consequently, the largest mean annual increments (MAIs) for DBH and height were observed for K. grandifoliola (Table 2).
The species with the greatest mean canopy area was B. excelsa (41.20 m2), followed by K. grandifoliola (37.80 m2). Variables such as canopy area and gap light are inherent to each species as a function of canopy openness and format, branch dimensions, and the superposition of leaves and branches, among others.
The box plot shows that for the species K. grandifoliola, the DBH and height were the greatest and were significantly different than the values for B. excelsa and D. odorata (Figure 8A,B). With respect to canopy area, B. excelsa and K. grandifoliola were significantly different than D. odorata, which had the smallest canopy area (Figure 8C). With a smaller canopy, D. odorata allows more light to enter into the system, as measured by gap light, which is different from the other two species (Figure 8D).
With respect to temperature, for August (Figure 8E) and October (Figure 8F), the plot with K. grandifoliola had significantly lower TS values than the other two plots so that the plot with B. excelsa and the plot with D. odorata were not different for August, and D. odorata had a lower temperature in October 2018 compared to B. excelsa.
The results for the second PCA compare the thermographic and dendrometric data for the three plots in the silvopastoral system, labelled ACP2 (Figure 9). The first two PCs for PCA2 were responsible for 73.68% of the total variation, of which PC1 was responsible for 51.0% and the second, PC2, was responsible for 22.68% of the total variation in the data.
The Biplot CP1 × CP2 in Figure 8, with the variables diameter, total height, gap light in the plot, canopy area and thermographic temperatures, shows that K. grandifoliola had the greatest heights and DBH values, and that this plot had the lowest temperatures in August and October. Among these silvopastoral systems, the highest temperatures were found in the plot with B. excelsa, followed by the plot with D. odorata. B. excelsa had the lowest values for DBH and total height.
The plot that had the greatest penetration of light was D. odorata, while the plot with the most shade was B. excelsa, followed by the plot with K. grandifoliola.

4. Discussion

4.1. ACP 1—Gap Light and Temperature of the Analyzed Targets

The temperatures registered in this study are not within the range considered by Baeta and Souza [61] as being among the most favorable climate conditions for cattle, which are temperatures between 10 and 27 °C, due to the intense heat in this tropical region.
The results from this study add to an increasing body of knowledge about silvopastoral systems, and the thermographic analyses reinforce the importance of shading with trees as a mechanism to attenuate the effects of heat and improve animal thermal comfort during the hottest periods of the day. This study also included, for the first time in a silvopastoral system in the western region of the state of Pará, the use of near-infrared thermography. This study reinforces the necessity of adopting integrated agricultural systems, such as silvopasture and/or crop–livestock–forest systems, as part of a general migration from full-sun pastures. These types of integrated production systems will provide better conditions that promote animal thermal comfort by providing shaded areas under trees.
The correlations in this study demonstrate the existence of positive relationships between surface temperature and the penetration of light in silvopastoral systems. In the month of August, there was an increase of 10.67% in the temperature in the P. maximum pasture compared to the silvopastoral treatment K. grandifoliola, and increases of 6.07% and 5.40% in temperature compared to the B. excelsa and D. odorata treatments, respectively.
However, there are other relationships that should be analyzed because despite the minimal thermal increase between B. excelsa and D. odorata (0.67%), in the D. odorata treatment, there was a greater penetration of solar radiation of 25.08%. This can be explained by the fact that the effect of shade on the microclimate of the shaded area does not depend only on the shade but also on the quantity of it, which will vary as a function of the density and color of leaves and the number of branches, among other characteristics that are inherent to tree species [17].
Several studies have demonstrated relationships between microclimatic variables and the thermal states of canopies in forests and pastures [8,15,62,63]. If these interactions are not taken into account, then substantial error could be introduced into microclimate measurements due to temperature differences established between the soil surface and air masses that are positioned above the tree canopy [13].
In the month of October, there was also an increase of 10.67% in the temperature in the P. maximum pasture compared to the silvopastoral K. grandifoliola treatment, and increases of 8.23% and 7.05% compared to the B. excelsa and D. odorata treatments, respectively. The relationship between surface temperature and gap light was expected, since infrared temperature is a measurement related to the long wave radiation emitted by the surfaces of tree canopies [4] or any other surface. The higher the temperature, the greater the thermal load imposed upon the environment, and therefore the greater the intensity of the infrared radiation emitted [16].
The temperature reductions found in the present study were greater compared to those from Barreto et al. [17], in which the maximum reduction was 3.7% in the treatment with trees in a pasture.
According to Silva [64], the presence of trees in pastures directly affects the energy balance of a system as they can intercept up to 80% of the incident solar radiation, which corresponds to a 30% reduction in the radiative thermal load. Barreto et al. [17], studying in Campo Grande, Mato Grosso do Sul, Brazil, in a stand of native trees, related that the trees reduced the thermal load by 24.0% in July, 16.3% in August, and 29.6% in September, and these authors also reported reductions of 15.2% in July, 5.3% in August, and 8.5% in September in a Eucalyptus stand with a low stand density compared to a system with no shade. In the same study, in an integrated system planted with Eucalyptus, the trees reduced the thermal load by 17.0% in July, 4.6% in August, and 7.5% in September. In the state of Paraná, Brazil, Baliscei et al. [65] reported that at 12h00 there was a reduction of 17.8% in the thermal load in a silvopastoral system compared to a treatment with no shade.
The two dimensions in which the variance was explained summarize the significance of the set of variables they are associated with, and they establish linear associations between them and the original variables [66]. The shaded areas were efficient at reducing solar radiation, as also reported by Lopes et al. [9] and Oliveira et al. [3], who related that thermal comfort indices improved in ICLF systems due to reductions in solar radiation that were caused by the trees. The density and spatial arrangement of the trees used in integrated pasture production systems create microclimatic modifications that are significant even at 50 m away from the trees [2,3,67,68].
It is important to emphasize that the three tree species in this study created a microclimate near to what has been suggested as ideal for animal thermal comfort, with the pasture with no trees offering an example of the highest thermographic thermal values.
The effect of shade on the behavior of bovines has been related by several authors [9,10,69,70,71]. In general, these animals search for shade during the hours when they are most susceptible to thermal stress and during seasons with more intense solar radiation. The incorporation of trees into pastures could be a sustainable alternative [72] that promotes greater thermal comfort for cattle in tropical regions [73].
In addition to providing shade to the animals, silvopastoral systems can contribute to the mitigation of greenhouse gas emissions by removing carbon from the atmosphere and storing biomass in the soil [74], and the trees can also provide a landowner with an additional source of income [75]. In a study of buffaloes [76], the authors related that the incorporation of trees in tropical pastures provided greater thermal comfort to the animals.
In this context, the trees incorporated in cattle ranching systems provide greater thermal comfort due to microclimate changes provided by shading. However, integrated systems ave strong interdependence between their components (soil, trees, forage, and animals), and therefore, other factors should be considered, principally the shade tolerance of the forage plants used. The challenge is to create adequate shade intensity in order to favor the development of each component as much as possible.
Although the temperatures are still high for cattle, possibly demonstrating thermal discomfort for animals raised in tropical silvopastoral systems, the results show that the presence of trees is fundamental to the improvement of this production system.

4.2. ACP 2—Dendrometric Variables and Thermography Data

K. grandifoliola demonstrated faster development than the native tree species in this study (B. excelsa and D. odorata), with MAIs of 2.93 cm year−1 for DBH and 2.04 m year−1 para for total height. In Paragominas, also in the north region of Brazil (annual precipitation of 1743 mm year−1), Silva et al. [77] evaluated the growth of K. grandifoliola in monocultures (spacing 5 m × 5 m) and in silvopastoral systems (spacing 5 m × 5 m, with 20 m between the tree plots where corn and Congo grass (Brachiaria ruziziensis) were planted together) on a heavy clay yellow Oxisol. The increments in DBH and total height were equivalent at 2.0 cm year−1 and 1.5 m year−1, respectively, for K. grandifoliola in the silvopastoral system. In the monoculture system, K. grandifoliola had increments in DBH and total height of 1.7 cm year−1 and 1.3 m year−1, respectively. These results demonstrate the potential of this species to be used in integrated production systems. In the present study, the increments in DBH and the total height of K. grandifoliola were greater than those in the silvopastoral system in the Paragominas study [77].
The average canopy area provided by B. excelsa (41.20 m2), which is circular in shape, did not differ from that of D. odorata, which had a globular-shaped canopy. It is important to emphasize that the planting format and spacing between trees and between rows will affect heat exchange in a forested plot. According to Oliveira et al. [78], the differences and respective efficiencies of tree species in altering a microclimate are due to canopy structure and format. When the canopy is denser and larger, there will be less thermal load from solar radiation in these systems. However, in the current study, it was observed that even though the species B. excelsa had a larger canopy area, the rapid growth of K. grandifoliola was more effective at attenuating heat.
B. excelsa and D. odorata, despite showing lower capacities for attenuating heat compared to K. grandifoliola, are still excellent options to incorporate into integrated systems in the region because they are native species and therefore have adequate development in this environment, and there is demand for their fruits. B. excelsa, for example, is physiologically adapted to grow across 2.3 million km2 of the Amazon [79]. Additionally, it is important to mention that other species have potential to be incorporated in integrated silvopastoral systems. Martínez et al. [80] and Tonini et al. [81], suggested the native species Schizolobium amazonicum and exotic ones such as Eucalyptus grandis and Eucalyptus urophylla as solid options for integrated production systems. In a study by Tonini et al. [82] in a silvopastoral system in the Center-West region of Brazil, E. grandis and E. urophylla at 3 years of age had an average DBH of 10.4 cm and total height of 10.5 m at a spacing of 3.5 × 3 m. Maneschy et al. [80], evaluating the growth of S. amazonicum spaced at 5 × 3 m in a silvopastoral system in the Amazon, reported average results of 17.81 and 19.25 m for total height and DBH values of 16.83 and 19.72 cm, which were measured in different years.
In livestock behavioral studies, shade availability and tree density were also associated with differences in reductions in body temperature in pasture animals under heat stress [68,83,84,85,86]. According to studies by Giro et al. [10], Oliveira et. al. [78], and Domiciano et al. [87], bovines prefer to use shade for rumination, although they can be observed resting under full sunlight in the morning. This period of rest is principally associated with an endogenous reduction in heat [10,88] as well as animal body position, which promotes a greater thermal exchange with the environment [9,86].
The PCA showed that DBH and total height are highly correlated with K. grandifoliola and are inversely correlated with temperature in August and October, meaning that this species is capable of efficiently reducing the temperature in the tree plot due to its rapid development. The near-infrared thermography results were positively and directly correlated with the dendrometric variables. These results suggest that near-infrared thermography should be utilized for rapid thermal evaluations in rural environments.
It is a well-known fact that it is difficult to maintain long-term ecological experiments that can establish indicators in low carbon-emission production systems in the Brazilian Amazon, a region where livestock raising operations are currently seeking to become more efficient in order to avoid advancing into areas of native forest. This study area went through a time lapse without investigation; however, from the 10 years of planting, many research studies have been carried out and in the near future, new results for other sustainability bioindicators will be disseminated.

5. Conclusions

Integrated silvopastoral systems, principally those formed using K. grandifoliola in the eastern Amazon, reduce pasture temperatures and create a microclimate that is more favorable for the thermal comfort of livestock due to shading by trees, which benefits caloric exchange and the maintenance of the thermal comfort of the animals.
This study demonstrated the benefits of the use of infrared thermography to rapidly and efficiently diagnose thermal conditions in integrated systems in western Pará. The presence of trees in the silvopastoral system can contribute to the improvement of the environment of livestock as well as provide an important ecosystem service by helping to mitigate the negative effects of cattle production systems on the global climate. This study also contributes by improving the understanding of how trees modify the environment and provide other goods and services, depending on the species used in an integrated system.
This dendroclimatic study presents novel results that describe thermal patterns wherein the arrangement of trees can explain a diversity of factors that affect microclimatic conditions, in this case, in an integrated system.

Author Contributions

Conceptualization, A.C.T.F.C. and L.G.M.; methodology, A.C.T.F.C. and L.G.M.; formal analysis, A.C.T.F.C. and W.N.; investigation, A.C.T.F.C., L.G.M., B.U.F.C. and L.S.S.L.; data curation, A.C.T.F.C., B.U.F.C. and L.S.S.L.; writing—original draft preparation, A.C.T.F.C.; writing—review and editing, L.G.M., C.T.d.S.D., P.C.C.F., A.R.S., M.B.D.-F. and T.P.B.; visualization, A.C.T.F.C., L.G.M., C.T.d.S.D., P.C.C.F., A.R.S., M.B.D.-F. and T.P.B.; supervision, L.G.M.; project administration, A.C.T.F.C. and L.G.M. All authors have read and agreed to the published version of the manuscript.

Funding

This research received no external funding.

Data Availability Statement

Data are contained within the article and are also available from the corresponding author.

Acknowledgments

We thank the Brazilian Coordination for the Improvement of Higher Education Personnel (CAPES) for the scholarship granted to the first author. We extend our gratitude to the Nossa Senhora Aparecida farm for use of the experimental area, and the Brazilian Agricultural Research Company (EMBRAPA) Eastern Amazon—Santarém, Pará, for technical and scientific support.

Conflicts of Interest

The authors declare no conflict of interest.

References

  1. Manaye, A.; Tesfamariam, B.; Tesfaye, M.; Worku, A.; Gufi, Y. Tree diversity and carbon stocks in agroforestry systems in northern Ethiopia. Carbon Balance Manag. 2021, 16, 14. [Google Scholar] [CrossRef] [PubMed]
  2. Karvatte, N.; Klosowski, E.S.; de Almeida, R.G.; Mesquita, E.E.; Oliveira, C.C.; Alves, F.V. Shading effect on microclimate and thermal comfort indexes in integrated crop-livestock-forest systems in the Brazilian Midwest. Int. J. Biometeorol. 2016, 60, 1933–1941. [Google Scholar] [CrossRef] [PubMed] [Green Version]
  3. Oliveira, C.C.; Alves, F.V.; de Almeida, R.G.; Gamarra, É.L.; Villela, S.D.J.; de Almeida Martins, P.G.M. Thermal comfort indices assessed in integrated production systems in the Brazilian savannah. Agrofor. Syst. 2017, 92, 1659–1672. [Google Scholar] [CrossRef]
  4. Kim, Y.; Still, C.J.; Hanson, C.V.; Kwon, H.; Greer, B.T.; Law, B.E. Canopy skin temperature variations in relation to climate, soil temperature, and carbon flux at a ponderosa pine forest in central Oregon. Agric. For. Meteorol. 2016, 226–227, 161–173. [Google Scholar] [CrossRef]
  5. Kovács, B.; Tinya, F.; Ódor, P. Stand structural drivers of microclimate in mature temperate mixed forests. Agric. For. Meteorol. 2017, 234–235, 11–21. [Google Scholar] [CrossRef] [Green Version]
  6. Organização das Nações Unidas. Transformando o Nosso Mundo: A Agenda 2030 Para o Desenvolvimento Sustentável. Resolução A/RES/70/1. Nova Iorque: UN. 2015. Available online: https://nacoesunidas.org/wp-content/uploads/2015/10/agenda2030-pt-br.pdf (accessed on 30 March 2023).
  7. Renaud, V.; Innes, J.L.; Dobbertin, M.; Rebetez, M. Comparison between open-site and below-canopy climatic conditions in Switzerland for different types of forests over 10 years (1998–2007). Theor. Appl. Climatol. 2011, 105, 119–127. [Google Scholar] [CrossRef] [Green Version]
  8. Maes, W.H.; Baert, A.; Huete, A.R.; Minchin, P.E.H.; Snelgar, W.P.; Steppe, K. A new wet reference target method for continuous infrared thermography of vegetations. Agric. For. Meteorol. 2016, 226–227, 119–131. [Google Scholar] [CrossRef]
  9. Lopes, L.B.; Eckstein, C.; Pina, D.S.; Carnevalli, R.A. The influence of trees on the thermal environment and behaviour of grazing heifers in Brazilian Midwest. Trop. Anim. Health Prod. 2016, 48, 755–761. [Google Scholar] [CrossRef] [Green Version]
  10. Giro, A.; Pezzopane, J.R.M.; Barioni, W., Jr.; Pedroso, A.d.F.; Lemes, A.P.; Botta, D.; Romanello, N.; Barreto, A.d.N.; Garcia, A.R. Behavior and body surface temperature of beef cattle in integrated crop-livestock systems with or without tree shading. Sci. Total Environ. 2019, 684, 587–596. [Google Scholar] [CrossRef]
  11. Pezzopane, J.R.M.; Bernardi, A.C.C.; Bosi, C.; Oliveira, P.P.A.; Marconato, M.H.; Pedroso, A.F.; Esteves, S.N. Forage productivity and nutritive value during pasture renovation in integrated systems. Agrofor. Syst. 2019, 93, 39–49. [Google Scholar] [CrossRef]
  12. Gersony, J.T.; Prager, C.M.; Boelman, N.T.; Eitel, J.U.H.; Gough, L.; Greaves, H.E.; Griffin, K.L.; Magney, T.S.; Sweet, S.K.; Vierling, L.A.; et al. Scaling thermal properties from the leaf to the canopy in the Alaskan Arctic tundra. Arctic. Antarct. Alp. Res. 2016, 48, 739–754. [Google Scholar] [CrossRef] [Green Version]
  13. Hammerle, A.; Meier, F.; Heinl, M.; Egger, A.; Leitinger, G. Implications of atmospheric conditions for analysis of surface temperature variability derived from landscape-scale thermography. Int. J. Biometeorol. 2017, 61, 575–588. [Google Scholar] [CrossRef] [PubMed] [Green Version]
  14. Ngao, J.; Adam, B.; Saudreau, M. Intra-crown spatial variability of leaf temperature and stomatal conductance enhanced by drought in apple tree as assessed by the RATP model. Agric. For. Meteorol. 2017, 237–238, 340–354. [Google Scholar] [CrossRef]
  15. Abreu-Harbich, L.V.; Labaki, L.C.; Matzarakis, A. Effect of tree planting design and tree species on human thermal comfort in the tropics. Landscape. Urban. Plan. 2015, 138, 99–109. [Google Scholar] [CrossRef]
  16. Karvatte, N., Jr.; Miyagi, E.S.; de Oliveira, C.C.; Barreto, C.D.; Mastelaro, A.P.; Bungenstab, D.J.; Alves, F.V. Infrared thermography for microclimate assessment in agroforestry systems. Sci. Total Environ. 2020, 731, 1–10. [Google Scholar] [CrossRef]
  17. Barreto, C.D.; Alves, F.V.; de Oliveira Ramos, C.E.C.; de Paula Leite, M.C.; Leite, L.C.; Junior, N.K. Infrared thermography for evaluation of the environmental thermal comfort for livestock. Int. J. Biometeorol. 2020, 64, 881–888. [Google Scholar] [CrossRef]
  18. Alves, F.V.; Karvatte, N., Jr.; Miyagi, E.S.; de Oliveira, C.C. Aplicações da Termografia por Infravermelho (TIV) na bovinocultura de corte. Série Doc. Embrapa. 2020, 276, 20–36. Available online: www.embrapa.br/fale-conosco/sac (accessed on 16 April 2023).
  19. De Oliveira, C.C.; Alves, F.V.; Martins, P.G.M.d.A.; Karvatte, N., Jr.; Alves, G.F.; de Almeida, R.G.; Mastelaro, A.P.; Costa e Silva, E. Vaginal temperature as indicative of thermoregulatory response in Nellore heifers under different microclimatic conditions. PloS ONE 2019, 14, 190–205. [Google Scholar] [CrossRef] [Green Version]
  20. Silanikove, N. Effects of heat stress on the welfare of extensively managed domestic ruminants. Liv. Prod. Sci. 2000, 67, 1–18. [Google Scholar] [CrossRef]
  21. Schütz, K.E.; Rogers, A.R.; Poulouin, Y.A.; Cox, N.R.; Tucker, C.B. The amount of shade influences the behavior and physiology of dairy cattle. J. Dairy Sci. 2010, 93, 125–133. [Google Scholar] [CrossRef] [Green Version]
  22. Neves, E.S.; Guedes, M.C.; Rodrigues, E.G. Relação da produção de frutos de castanha-da-amazônia (Bertholletia excelsa bonpl.) com variáveis das próprias castanheiras, em capoeira e floresta da Resex Cajari. Biota Amaz. 2015, 5, 31–37. [Google Scholar] [CrossRef]
  23. Silva, A.A.; Santos, M.K.V.; Gama, J.R.V.; Noce, R.; Leão, S. Potencial do extrativismo da castanha-do-pará na geração de renda em comunidades da mesorregião baixo Amazonas, Pará. Floresta E Ambiente 2013, 20, 500–509. [Google Scholar] [CrossRef] [Green Version]
  24. Scoles, R. Ecologia e Extrativismo da Castanheira (Bertholletia excelsa, Lecythidaceae) em duas regiões da Amazônia Brasileira. In Tese de Doutorado em Biologia (Ecologia); Instituto Nacional de Pesquisas da Amazônia: Manaus, Brazil, 2010; p. 193. [Google Scholar]
  25. Lopes, C.L.; Nardi, J.; Chiavari, J. Reposição florestal:Panorama da regulamentação nos EstadosDiário da Justiça do Brasil, Decreto nº 23.296 de 06 de agosto de 2007. Available online: https://www.climatepolicyinitiative.org/wp-content/uploads/2021/08/Relatorio-Reposicao-Florestal.pdf (accessed on 18 April 2023).
  26. Fábio, F.G.; Câncio, I.A.P. Manejo florestal do cumaru: Um experimento rentável e sustentável em Óbidos, Estado do Pará. In Ensaios nas Ciências Agrárias e Ambientais, 8; Atena Editora: Ponta Grossa, Brazil, 2019; pp. 38–50. [Google Scholar]
  27. Sousa, B.C.M.; Barata, L.E.S.; Macêdo, C.G.; Fraga, S.S.; Kasper, A.A.M.; Lourido, K.A.; Paulino, G.S.; Almeida, E.C.; Sartoratto, A.; Lustosa, D.C. Avaliação do teor de Cumarina e atividade antifúngica de frações de Óleo de Cumaru. Rev. Ibero-Am. De Ciências Ambient. 2018, 9, 63–69. [Google Scholar] [CrossRef] [Green Version]
  28. Silva, T.M.; Jardim, F.C.S.; Silva, M.S.; Shanley, P. O mercado das amêndoas de Dipteryx odorada (cumaru) no estado do Pará. Floresta 2010, 40, 603–614. [Google Scholar] [CrossRef] [Green Version]
  29. Hall, J.S. Seed and seedling survival of African mahogany (Entandrophragma spp.) in the Central African Republic: Implications for forest management. Ecol. Manag. 2008, 255, 292–299. [Google Scholar] [CrossRef]
  30. Kasongo Yakusu, E.; Monthe, F.S.; Bourland, N.; Hardy, O.J.; Louppe, D.; Bola Mbele Lokanda, F.; Hubau, W.; Kahindo Muhongya, J.-M.; van den Bulcke, J.; van Acker, J.; et al. Entandrophragma: Taxonomy and ecology of a genus of African tree species with economic importance. A review. Biotechnol. Agron. Soc. Environ. 2021, 25, 140–153. [Google Scholar] [CrossRef]
  31. Bouka, U.G.D.; Doumenge, C.; Loumeto, J.J.; Florence, J.; Gonmadje, C.; Mckey, D. Des confusions entre espèces prèjudicables à la gestion durable des essences forestières: L’exemple des acajous d’Afrique (Khaya, Meliaceae). Bois Forêts Des Trop. 2019, 339, 17–32. [Google Scholar] [CrossRef]
  32. Poorter, L.; Bongers, F.; Kouamé, F.N.; Hawthorne, W.D. Biodiversity of West African Forests: An Ecological Atlas of Woody Plant Species; CABI Publishing: Oxford, UK, 2004; p. 528. [Google Scholar]
  33. Armstrong, M.; Reilly, D.F.; Lelievre, T.; Hopewell, A.; Redman, L.; Francis, R.M.R. African Mahogany Grown in Australia-Wood Quality and Potential Uses; Rural Industries Research and Development Corporation: Kingston, Australia, 2007.
  34. Pinheiro, L.P.; Couto, L.; Pinheiro, D.T.; Brunetta, J.M.F.C. Ecologia, Silvicultura e Tecnologia de Utilização dos Mognos Africanos (Khaya spp.); Sociedade Brasileira de Agrossilvicultura (SBAG): Viçosa, Brazil, 2011; p. 102. [Google Scholar]
  35. de Azevedo, M.L.; Titon, M.; Machado, E.L.M.; de Assis Júnior, S.L.; de Freitas, E.C.S. Influence of indolbutiric acid on rooting of stem and leaf minicuttings of african mahogany (Khaya grandifoliola c. dc.). Cienc. Florest. 2021, 31, 898–919. [Google Scholar] [CrossRef]
  36. Pennington, T.D.; Cheek, M. Khaya Grandifoliola C. DC. Pará. 2015. Available online: http://floradobrasil.jbrj.gov.br/reflora/herbarioVirtual/ConsultaPublicoHVUC/ConsultaPublicoHVUC.do?idTestemunho=4658185 (accessed on 17 April 2023).
  37. Silva MG, d.a.; Zaidan, Ú.R.; Borges, C.T.; da Silva, J.A.; Resende, R.T.; Venturoli, F.; Pires, P.P. Indolbutyric Acid (IBA) in the African Mahogany (Khaya grandifoliola C. DC.) cuttings and mini-cuttings development. Adv. For. Sci. 2020, 7, 1009–1016. [Google Scholar] [CrossRef]
  38. Lemmens, R.H.M.J.; Louppe, D.; Oteng-Amoako, A.A. Plant Resources of Tropical Africa 7. In Timbers 2, 2nd ed.; PROTA Foundation: Wageningen, The Netherlands, 2012. [Google Scholar]
  39. Hall, J.S.; Harris, D.J.; Medjibe, V.; Ashton, P.M.S. The efects of selective logging on forest structure and tree species composition in a Central African forest: Implications for management of conservation areas. Ecol. Manag. 2003, 183, 249–264. [Google Scholar] [CrossRef]
  40. Danquah, J.A.; Sarpong, D.B.; Pappinen, A. Causal relationships between African mahoganies exports and deforestation in Ghana: Policy implications. Environ. Dev. Sustain. 2013, 15, 51–66. [Google Scholar] [CrossRef]
  41. Altieri, M. Agroecologia: Bases Científicas Para uma Agricultura Sustentável, 3rd ed.; Expressão Popular: Rio de Janeiro, Brazil, 2012. [Google Scholar]
  42. Montagnini, F.; Metzel, R. Integrando Paisagens: Agroflorestas para Conservação da Biodiversidade e Soberania Alimentar; Springer: Cham, Switzerland, 2017; Available online: https://scholar.google.com/scholar_lookup?title=Integrating+Landscapes:+Agroforestry+for+Biodiversity+Conservation+and+Food+Sovereignty&author=Montagnini,+F.&author=Metzel,+R.&publication_year=2017 (accessed on 26 March 2023).
  43. Pinto, J.; Encinas, I.; Silva, G. Age and growth of trees. Technol. For. Commun. 2005, 7, 43. Available online: http://repositorio.unb.br/handle/10482/10018 (accessed on 2 March 2023).
  44. Martorano, L.G.; Nechet, D.; Pereira, L.C. Tipologia climática do Estado do Pará: Adaptação do método de Köppen. Bol. De Geogr. Teorética 1993, 23, 45–46. [Google Scholar]
  45. Martorano, L.G.; Vitorino, M.I.; da Silva, B.P.P.C.; de Moraes, J.R.S.C.; Lisboa, L.S.; Sotta, E.D.; Reichardt, K. Climate conditions in the eastern amazon: Rainfall variability in Belem and indicative of soil water deficit. Afr. J. Agric. Res. 2017, 12, 1801–1810. [Google Scholar]
  46. Empresa Brasileira de Pesquisa Agropecuária–EMBRAPA; Centro Nacional de Pesquisa de Solos. Sistema Brasileiro de Classificação de Solos; Embrapa Solos: Rio de Janeiro, Brazil, 2006; p. 306. [Google Scholar]
  47. Silva, J.C.N.; Silva, A.R.; Veloso, C.A.C.; Dantas, E.F.; do Sacramento, J.A.A.S. Aggregation, carbon, and total soil nitrogen in crop-livestock-forest integration in the Eastern Amazon. Rev. Bras. Eng. Agric. E Ambient. 2018, 22, 837–842. [Google Scholar] [CrossRef]
  48. Silva, A.R.; Sales, A.; Alberto, C.; Veloso, C.; Jorge, E.; Carvalho, M.; Pinheiro, E.; Marco, B. Propriedades físicas e teor de matéria orgânica de um latossolo amarelo sob sistemas integração lavoura-pecuária-floresta. J. Agron. Sci. 2015, 4, 144–157. Available online: https://ainfo.cnptia.embrapa.br/digital/bitstream/item/125909/1/13.pdf (accessed on 15 March 2023).
  49. EMBRAPA-Empresa Brasileira de Pesquisa Agropecuária. Manual de Métodos de Análise de Solo; Embrapa Solos: Rio de Janeiro, Brazil, 2011; p. 212. [Google Scholar]
  50. Lameira, M.K.S.; Silva, H.K.M.; Gomes, K.M.A.; Ferreira, A.C.T.; Martorano, L.G.; Ribeiro, R.B.S.; Silva, A.R.; Gama, J.R.V. Capacidade produtiva de Dipteryx odorata (Aubl.) Willd. em sistema de produção de pecuária integrada no Baixo Amazonas. Rev. For. Mesoam. Kuru-Rfmk 2022, 19, 56–65. Available online: https://revistas.tec.ac.cr/index.php/kuru/article/view/6102 (accessed on 15 March 2023).
  51. Harder, I.C.F.; Ribeiro, R.C.S.; Tavares, A.R. Índices de área verde e cobertura vegetal para as praças do município de Vinhedo, SP. Rev. Árvore 2006, 30, 277–282. [Google Scholar] [CrossRef] [Green Version]
  52. Silva, E.C.; Gama, J.R.V.; Rode, R.; Coelho, A.L.; Coelho, M. Tree species growth in a silvopastoral system in Amazon. Afr. J. Agric. Res. 2018, 13, 95–103. Available online: https://academicjournals.org/journal/AJAR/article-full-text-pdf/D8BA09155677 (accessed on 14 March 2023).
  53. Hu, L.; Zhu, J. Improving gap light index (GLI) to quickly calculate gap coordinates. Can. J. For. Res. 2008, 38, 2337–2347. [Google Scholar] [CrossRef]
  54. Kim, J.; Song, I.; Kim, C.; Gho, H.; An, S.; Song, D.; Joung, D.; Kang, S.; Yi, Y.; Park, B.J.; et al. Thermal Comfort and Human Responses according to Tree Density in Forest Environments during and after Physical Activities in the Summer. Forests 2023, 14, 120. [Google Scholar] [CrossRef]
  55. Manly, B.F.J.; Alberto, J.A.N. Métodos Estatísticos Multivariados: Uma Introdução, 4th ed.; Bookman: Porto Alegre, Brazil, 2019; p. 254. [Google Scholar]
  56. Johnson, R.A.; Wichern, D.W. Applied Multivariate Statistical Analysis, 4th ed.; Prentice Hall: Hoboken, NJ, USA, 1998. [Google Scholar]
  57. R Core Team. R: A Language and Environment for Statistical Computing; R Foundation for Statistical Computing: Vienna, Austria, 2021; Available online: https://www.R-project.org/ (accessed on 20 February 2023).
  58. Le, S.; Josse, J.; Husson, F. FactoMineR: An R Package for Multivariate Analysis. J. Stat. Softw. 2008, 25, 1–18. Available online: https://core.ac.uk/download/pdf/6303121.pdf (accessed on 21 February 2023). [CrossRef] [Green Version]
  59. Kassambara, A.; Mundt, F. Factoextra: Extract and Visualize the Results of Multivariate Data Analyses, R package version 1.0.7; DataCamp: Vienna, Austria, 2020; Available online: https://CRAN.R-project.org/package=factoextra (accessed on 21 February 2023).
  60. Rencher, A.C. Methods of Multivariate Analysis, 2nd ed.; A John Wiley & Sons, Inc. Publication: Hoboken, NJ, USA, 2002; p. 727. [Google Scholar]
  61. Baêta, F.C.; Souza, C.F. Ambiência em Edificações Rurais: Conforto Animal; Editora UFV: Viçosa, Brazil, 2010. [Google Scholar]
  62. Baluja, J.; Diago, M.P.; Balda, P.; Zorer, R.; Meggio, F.; Morales, F.; Tardaguila, J. Assessment of vineyard water status variability by thermal and multispectral imagery using an unmanned aerial vehicle (UAV). Irrig. Sci. 2012, 30, 511–522. [Google Scholar] [CrossRef]
  63. Meier, F.; Scherer, D. Spatial and temporal variability of urban tree canopy temperature during summer 2010 in Berlin, Germany. Theor. Appl. Climatol. 2012, 110, 373–384. [Google Scholar] [CrossRef]
  64. Silva, R.G. Predição da configuração de sombras de árvores em pastagens para bovinos. Eng. Agric. 2006, 26, 36–281. Available online: https://repositorio.unesp.br/bitstream/handle/11449/27779/S0100-69162006000100029.pdf?sequence=1&isAllowed=y (accessed on 30 March 2023). [CrossRef] [Green Version]
  65. Baliscei, M.A.; Barbosa, O.R.; Souza, W.; Costa, M.A.T.; Krutzmann, A.; Queiroz, E.O. Microclimate without shade and silvopastoral system during summer and winter. Acta Scientiarum. Anim. Sci. 2013, 35, 49–56. [Google Scholar] [CrossRef] [Green Version]
  66. Lebart, L.; Piron, M.; Morineau, A. Statistique Exploratoire Multidimensionnelle; Dunod: Paris, France, 2000; p. 439. [Google Scholar]
  67. Pereira, L.M.R.; Fischer, V.; Moreno, C.B.; Pardo, M.P.; Gomes, J.F.; Monks, P.L. Diurnal ingestive behavior of Jersey heifers fed diferente supplements. Rev. Bras. Agrocienc. 2005, 11, 453–459. [Google Scholar] [CrossRef]
  68. Abreu, L.V.; Labaki, L.C. Conforto térmico propiciado por algumas espécies: Avaliação do raio de influência através de diferentes índices de conforto. Ambiente Constr. 2010, 10, 103–117. [Google Scholar] [CrossRef]
  69. Baliscei, M.A.; Souza, W.; Barbosa, O.R.; Cecato, U.; Krutzmann, A.; Edicarlos, O.Q. Behaviour of beef cattle and the microclimate with and without shade. Acta Sci. Anim. Sci. 2012, 34, 409–415. [Google Scholar] [CrossRef]
  70. Lees, A.M.; Lees, J.C.; Sejian, V.; Sullivan, M.L.; Gaughan, J.B. Influence of shade on panting score and behavioural responses of Bos taurus and Bos indicus feedlot cattle to heat load. Anim. Prod. Sci. 2020, 60, 305–315. [Google Scholar] [CrossRef]
  71. de Souza, E.C.; Salman, A.K.D.; da Cruz, P.G.; Veit, H.M.; de Carvalho, G.A.; da Silva, F.R.F.; Schmitt, E. Thermal comfort and grazing behaviour of Girolando heifers in integrated crop-livestock (ICL) and crop-livestock-forest (ICLF) systems. Acta Sci. Anim. Sci. 2019, 41, 1–10. [Google Scholar] [CrossRef]
  72. Lemaire, G.; Franzluebbers, A.; Carvalho, P.C.d.F.; Dedieu, B. Integrated crop-livestock systems: Strategies to achieve synergy between agricultural production and environmental quality. Agric. Ecosyst. Environ. 2014, 190, 4–8. [Google Scholar] [CrossRef]
  73. Garcia, A. Thermal comfort on reproductive processes of water buffaloes raised under tropical conditions. Rev. Bras. Reprod. Anim. 2013, 37, 121–130. [Google Scholar]
  74. Figueiredo, E.B.; Jayasundara, S.; Bordonal, R.O.; Reis, R.A.; Wagner-Riddle, C.; La Scala, N. Greenhouse gas balance and carbon footprint of beef cattle in three contrasting pasture-management systems in Brazil. J. Clean. Prod. 2017, 142, 420–431. [Google Scholar] [CrossRef] [Green Version]
  75. Dube, F.; Couto, L.; Silva, M.L.; Leite, H.G.; García, R.; Araújo, G.A.A. A simulation model for evaluating technical and economic aspects of an industrial eucalyptusbased agroforestry system in Minas Gerais, Brazil. Agrofor. Syst. 2002, 55, 73–80. [Google Scholar] [CrossRef]
  76. Garcia, A.R.; Silva, L.K.X.; Barros, D.V.; Lourenço Junior, J.B.; Martorano, L.G.; Lisboa, L.S.S.; Silva, J.A.R.; Sousa, J.S.; Silva, A.O.A. Key points for the thermal comfort of water buffaloes in Eastern Amazon. Ciência Rural 2023, 53, 1–18. [Google Scholar] [CrossRef]
  77. Silva, A.R.; Veloso, C.A.C.; Carvalho, E.J.M.; Alves, L.W.R.; Azevedo, C.M.B.C.; Fernandes, P.C.C. Comportamento da espécie mogno africano (Khaya ivorensis) em sistema de integração lavoura-pecuária-floresta no município de Paragominas-PA. In Proceedings of the Congresso Brasileiro de Sistemas Agroflorestais. SBSAF, Embrapa Amazônia Oriental, Belém, Brasil, 25–30 May 2011. [Google Scholar]
  78. Oliveira, C.C.; Almeida, R.G.; Karvatte Junior, N.; Villela, S.D.J.; Bungenstab, D.J.; Alves, F.V. Daytime ingestive behaviour of grazing heifers under tropical silvopastoral systems: Responses to shade and grazing management. Appl. Anim. Behav. Sci. 2021, 240, 1–7. [Google Scholar] [CrossRef]
  79. Tourne, D.C.M.; Ballester, M.V.R.; James, P.M.A.; Martorano, L.G.; Guedes, M.C.; Thomas, E. Strategies to optimize modeling habitat suitability of Bertholletia excelsa in the Pan-Amazonia. Ecol. Evol. 2019, 9, 12623–12638. [Google Scholar] [CrossRef] [Green Version]
  80. Martínez, G.B.; Mourão Junior, M.; Brienza Junior, S. Selection of multipurpose forest species ideotypes of the floodplains in the Low Amazon Basin, Pará. Acta Amazôn. 2010, 40, 65–74. Available online: www.researchgate.net/publication/262514205 (accessed on 21 March 2023). [CrossRef] [Green Version]
  81. Tonini, H.; Sartori, W.; Anjos, A.; Morales, M.; da Silva, V. Performance and quality of wood in a clone of Eucalyptus in monoculture and silvopastoral system. Nativa 2016, 4, 77–81. [Google Scholar]
  82. Maneschy, R.; da Veiga, J.; de Santana, A. Evaluation of growth of parica (Schizolobium amazonicum Huber) and teca (Tectona grandis l.f.) in silvopastoral systems in northeastern Pará. Luziânia, Brasil. In Dialogue and Integration of Knowledge in Agroforestry Systems for Sustainable Societies; SBSAF: Manaus, Brazil, 2009. [Google Scholar]
  83. Tucker, C.B.; Rogers, A.R.; Schütz, K.E. Effect of solar radiation on dairy cattle behaviour, use of shade and body temperature in a pasture-based system. Appl. Anim. Behav. Sci. 2008, 109, 141–154. [Google Scholar] [CrossRef]
  84. Nadin, L.; Chopa, F.S.; Agnelli, M.L.; da Trindade, J.K.; Gonda, H. Effect of sward height on short-term intake by steers grazing winter oat pastures. Livest. Sci. 2019, 225, 8–14. [Google Scholar] [CrossRef]
  85. de Souza, W.; Barbosa, O.R.; Marques, J.d.A.; Gasparino, E.; Cecato, U.; Barbero, L.M. Behaviour of beef cattle in silvopastoral systems with eucalyptus. R. Bras. Zootec. 2010, 39, 677–684. [Google Scholar] [CrossRef] [Green Version]
  86. Van Iear, E.; Moons, C.P.H.; Ampe, B.; Sonck, B.; Vandaele, L.; de Campeneere, S.; Tuyttens, F.A.M. Effect of summer conditions and shade on behavioural indicators of thermal discomfort in Holstein dairy and Belgian Blue beef cattle on pasture. Animal 2015, 9, 1536–1546. [Google Scholar] [CrossRef] [Green Version]
  87. Domiciano, L.F.; Mombach, M.A.; Carvalho, P.; Silva, N.M.F.; Pereira, D.H.; Cabral, L.S.; Lopes, L.B.; Pedreira, B.C. Performance and behaviour of Nellore steers on integrated systems. Anim. Prod. Sci. 2016, 58, 920–929. [Google Scholar] [CrossRef]
  88. Vizzotto, E.F.; Fischer, V.; Thaler Neto, A.; Abreu, A.S.; Stumpf, M.T.; Werncke, D.; Schmidt, F.A.; McManus, C.M. Access to shade changes behavioural and physiological attributes of dairy cows during the hot season in the subtropics. Animal 2015, 9, 1559–1566. [Google Scholar] [CrossRef] [Green Version]
Figure 1. Location of the study area indicating the three plots with three tree species in a silvopastoral system and a full-sun pasture on the Fazenda Nossa Senhora Aparecida farm, Mojuí dos Campos, State of Pará, Brazil. Photo credits: the authors.
Forests 14 01463 g001
Figure 2. B. excelsa plantation in 2010 (A); plantation of D. odorata in 2010 (B); B. excelsa plot in 2012 (C) K. grandifoliola plot in 2012 (D).
Forests 14 01463 g002
Figure 3. Sampling of the study sites.
Forests 14 01463 g003
Figure 4. Image in visible light and the treated image in the program Gap Light Analyzer. Species: K. grandifoliola ((A,A1)), D. odorata ((B,B1)), and B. excelsa ((C,C1)).
Forests 14 01463 g004
Figure 5. Image in the plot with K. grandifoliola (A) and its respective thermographic image of the crown (B) and the soil surface (C), processed in the Flir Tools program.
Forests 14 01463 g005
Figure 6. Temperature comparison for August 2018 (A) and October 2018 (B) and gap light (October 2018) (C) in the silvopastoral integrated systems (B. excelsa, D. odorata, and K. grandifoliola) and in the full-sun pasture (P. maximum). Equal letters are not indicated to be different by the Dunn test at a 0.05% significance level. Each dot color represents a species as already described in the figures (B. excelsa, D. odorata, K. grandifoliola and P. maximum).
Forests 14 01463 g006
Figure 7. Biplot (CP1 and CP2) with the variables temperatures in August (AUG.TEMP) and October (OCT.TEMP) 2018, and the gap light in the silvopastoral plots (B. excelsa, D. odorata, and K. grandifoliola) and full-sun pasture (P. maximum cv. Mombaça). Confidence ellipses are 95%.
Forests 14 01463 g007
Figure 8. Comparison of dendrometric measurements: diameter (1.3 m above the soil) (A), total height (B), canopy area (C), gap light (D) temperature in August (E) temperature in October (F) in the plots with silvopastoral integration (B. excelsa, D. odorata, and K. grandifoliola). Equal letters are not indicated to be different by the Dunn test at a 0.05% significance level. Each dot color represents a species as already described in the figures (B. excelsa, D. odorata and K. grandifoliola).
Forests 14 01463 g008
Figure 9. Biplot (CP1 and CP2) with the variables temperatures in August (AUG.TEMP) and October (OCT.TEMP) 2018, canopy area (CANOPY), diameter at 1.3 m above the soil (DBH), and total height (HEIGHT) in the silvopastoral plots (B. excelsa, D. odorata, and K. grandifoliola). Confidence ellipses are 95%.
Forests 14 01463 g009
Table 1. Minimum, maximum, and mean surface temperatures with standard deviations and variations in temperature, Mojuí dos Campos, 2018.
Surface Temperature (°C)
SpeciesAugust 2018October 2018
MinMeanMax SDΔTMinMeanMaxSDΔT
B. excelsa30.331.532.50.72.236.436.937.30.20.9
D. odorata30.931.331.80.30.935.836.537.30.31.5
K. grandifoliola29.230.030.70.51.535.836.336.70.20.9
P. Maximum32.733.233.60.20.938.639.540.70.62.1
Min: minimum, Max: maximum, SD: standard deviation, ΔT: temperature variation.
Table 2. Means for dendrometric variables by species after nine years of development in Mojuí dos Campos, 2018.
SpeciesDBHSD DHCHtSD HtACSD ACMAI DHCMAI Ht
(cm)(cm)(m)(m)(m2)(m2)(cm year−1)(m year−1)
B. excelsa15.635.210.622.7741.2018,341.741.18
D. odorata13.042.728.891.2419.689.581.450.99
K. grandifoliola26.354.0518.402.4237.8014.372.932.04
DBH: diameter measured at 1.30 m above the soil, SD: standard deviation, Ht: total height, AC: canopy area and MAI: mean annual increment.
Disclaimer/Publisher’s Note: The statements, opinions and data contained in all publications are solely those of the individual author(s) and contributor(s) and not of MDPI and/or the editor(s). MDPI and/or the editor(s) disclaim responsibility for any injury to people or property resulting from any ideas, methods, instructions or products referred to in the content.

