Article

Vegetation Change and Conservation Evaluation of the Cangshan Erhai National Nature Reserve (Cangshan Mountain Part) in Southwest China

1
College of Agriculture and Biological Science, Dali University, Dali 671003, China
2
Co-Innovation Center for Cangshan Mountain and Erhai Lake Integrated Protection and Green Development of Yunnan Province, Dali University, Dali 671003, China
3
Cangshan Forest Ecosystem Observation and Research Station of Yunnan Province, Dali University, Dali 671003, China
*
Author to whom correspondence should be addressed.
Forests 2023, 14(7), 1485; https://doi.org/10.3390/f14071485
Submission received: 23 June 2023 / Revised: 16 July 2023 / Accepted: 18 July 2023 / Published: 20 July 2023
(This article belongs to the Section Forest Ecology and Management)

Abstract

:
Vegetation and its spatiotemporal variations play a crucial role in regional ecological security and sustainable development. Examining vegetation dynamics in natural reserves provides valuable insights for optimizing vegetation patterns and management strategies. This study utilizes Landsat remote sensing imagery to investigate changes in vegetation pattern and coverage in the Cangshan mountain of the Cangshan Erhai National Nature Reserve, as well as assesses the effectiveness of conservation efforts. The results indicate the following: (1) The primary vegetation types in the Cangshan mountain include warm-temperate coniferous forests, deciduous broad-leaved forests, bamboo forests, and alpine meadows, exhibiting distinct vertical zonation patterns. The vegetated area expanded by 1146 hectares during the study period. (2) The average fractional of vegetation coverage (FVC) in the Cangshan mountain demonstrated an upward trend (0.82 in 1987 to 0.93 in 2017), with the proportion of highly FVC areas increasing from 59.67% in 1987 to 97.89% in 2017. (3) The vegetation landscape fragmentation in Cangshan mountain and various functional areas shows an increasing trend, while connectivity decreases, and is accompanied by a more intricate shape of the vegetation landscape. While conservation and management efforts have yielded certain results in safeguarding the vegetation in the Cangshan mountain, the degree of vegetation landscape fragmentation has intensified due to climate change and human activities. Thus, it is imperative for management authorities to promptly adjust protective measures within the Cangshan mountain. This study contributes to our understanding of vegetation changes within the Cangshan mountain and provides essential baseline information for optimizing and enhancing vegetation conservation management strategies within the reserve.

1. Introduction

Vegetation constitutes a critical component of terrestrial ecosystems, playing a significant role in material cycling, energy flow, and information exchange [1,2]. As an integral part of the ecosystem, vegetation provides numerous services essential for human survival [2,3,4]. Influenced by factors such as topography, soil, climate, and human activities, vegetation change serves as a key indicator of regional or global environmental transformations [5,6,7]. Monitoring vegetation changes is crucial for understanding regional climate change characteristics and the extent of human interference [8,9,10,11,12].
National nature reserves play a vital role in establishing ecological security barriers at the national level [13,14,15,16]. Vegetation, as a key protected element within these reserves, is crucial for maintaining ecological security and habitat quality. Analyzing vegetation dynamics provides valuable long-term information for reserve management and environmental changes [17]. This information is essential for understanding reserve ecosystem structure and function, evaluating conservation effectiveness, and formulating and adjusting conservation policies [5,18,19,20,21].
Located on the southeastern edge of the Hengduan Mountains, the Cangshan Erhai National Nature Reserve features complex and diverse terrain. Influenced by both the Pacific and Indian Ocean monsoons, the reserve exhibits distinct and varied climatic conditions, making it a natural repository of biological resources. Its biodiversity holds national and global importance, encompassing the Cangshan mountain and Erhai lake. Cangshan Mountain is the naming place of the ‘Tali glaciation’ of the last glacial period of the Quaternary period (approximately 15,000 years ago) [22], and the core of Cangshan UNESCO Global Geopark is located in the Cangshan mountain [23]. Nearly all vegetation in the nature reserve concentrated within the Cangshan mountain. The vegetation in the Cangshan mountain plays a crucial role in sustaining the Cangshan mountainous ecosystem and the Erhai lake ecosystem. Changes in vegetation significantly impact environmental elements such as climate, water resources, ecosystem services, and human habitation within the reserve. Therefore, a comprehensive understanding of the vegetation condition in the Cangshan mountain and monitoring its evolution are of vital significance for vegetation conservation, soil and water resource conservation, and the sustainable development of the ecological environment within the reserve.
Since the establishment of the Cangshan Erhai Nature Reserve at the provincial level in Yunnan Province in 1981, the Cangshan mountain has been subject to organized and regulated management. Following its upgrade to a national-level nature reserve in 1994, additional efforts have been made to strengthen the protection and management of the Cangshan mountain. Over the span of more than 40 years of conservation management, a range of regulations and protective measures have been developed, including restrictions on cultivation, strict control of fires, prohibition of logging and grazing, among others. However, empirical evidence regarding the actual impact of these regulations and measures on the vegetation status of the Cangshan mountain has been lacking, and the effectiveness of conservation efforts remains unclear. Therefore, it is necessary to conduct vegetation monitoring in the Cangshan mountain to understand the changes in vegetation over time, assess the effectiveness of human intervention in conservation, and evaluate the achievements of the protective regulations and measures.
To accomplish this, this study employs remote sensing data and geographic information system techniques to analyze the evolution of vegetation in the Cangshan mountain from two perspectives: changes in vegetation patterns and vegetation coverage. The research aims to comprehensively understand the distribution and change patterns of vegetation in the Cangshan mountain and evaluate the effectiveness of conservation efforts since the 1980s. The findings of this study can provide scientific data and decision support for ecological regulation, protection planning, and the formulation and revision of management regulations for the Cangshan Erhai National Nature Reserve.

2. Materials and Methods

2.1. Study Area

The Cangshan mountain is situated at the intersection of the western part of the Dian Central Plateau and the southeastern end of the Hengduan Mountains. It belongs to the eastern branch of the Yunling Mountains in the Hengduan Mountains and is adjacent to the Yungui Plateau to the east. Located within the Dali Bai Autonomous Prefecture in western Yunnan Province, its geographic coordinates range from approximately 99°55′ E to 100°12′ E and 25°34′ N to 26°00′ N (Figure 1). It encompasses two counties and one city, with an area of approximately 576.65 km2. The north–south length is about 50 km, while the east–west width is around 19 km. The highest peak, Malong Peak, rises to an elevation of approximately 4122 m [24]. The Cangshan mountain features a mountain range that stretches from north to south, located between Erhai Lake and Yangbi River. The tops of Cangshan mountain retain pristine glacial landforms, and the area boasts a wide range of vegetation types, ranging from subtropical regions of South Asia to alpine permafrost zones. It stands as one of the most botanically diverse regions globally, playing significant roles in climate regulation, water resource conservation, soil preservation, and air purification as well as contributing to human health and local economic development.
To enhance the management of the nature reserve, the overall plan for the Dali Cangshan Erhai National Nature Reserve (1996–2010) was issued in 2002. This plan divided the Cangshan mountain into three functional zones: core zone, buffer zone, and experimental zone (Figure 1). In the core zone, aside from essential positional monitoring, scientific investigations, and research activities, no facilities or activities that could impact or disturb the ecological environment are permitted. The buffer zone is designated for organized scientific research, experimental observations, necessary monitoring projects, field patrols, and the construction of protective facilities. The experimental zone serves as areas for protected development and can be moderately used for scientific experiments, educational visits, community co-management, and eco-tourism projects.

2.2. Data Sources

Since the early 1970s, the ongoing missions of the Landsat satellites have captured surface landscape information for over half a century [25], providing lots of remote sensing imagery with high spatial and spectral resolutions [1,3,26]. The Landsat series satellite images are among the most powerful data sources for studying large-scale and long-term spatiotemporal changes in vegetation [27].
For this study, we utilized the EarthExplorer data distribution platform (https://earthexplorer.usgs.gov (accessed on 5 March 2019)) to retrieve all Landsat satellite images (p131r42) from 1986 to 2017 within the study area, and the maximum cloud cover was set to 80% [28]. A total of 605 scenes of imagery were retrieved. Using the EROS Science Processing Architecture (ESPA) platform (https://espa.cr.usgs.gov (accessed on 1 July 2019)), we processed and downloaded the surface reflectance (SR) data, top of atmosphere reflectance (TOA) data, and brightness temperature (BT) data for each scene of imagery.
The main auxiliary data is Digital Elevation Model (DEM) from the Advanced Spaceborne Thermal Emission and Reflection Radiometer.

2.3. Methods

2.3.1. Vegetation Extraction and Pattern Analysis

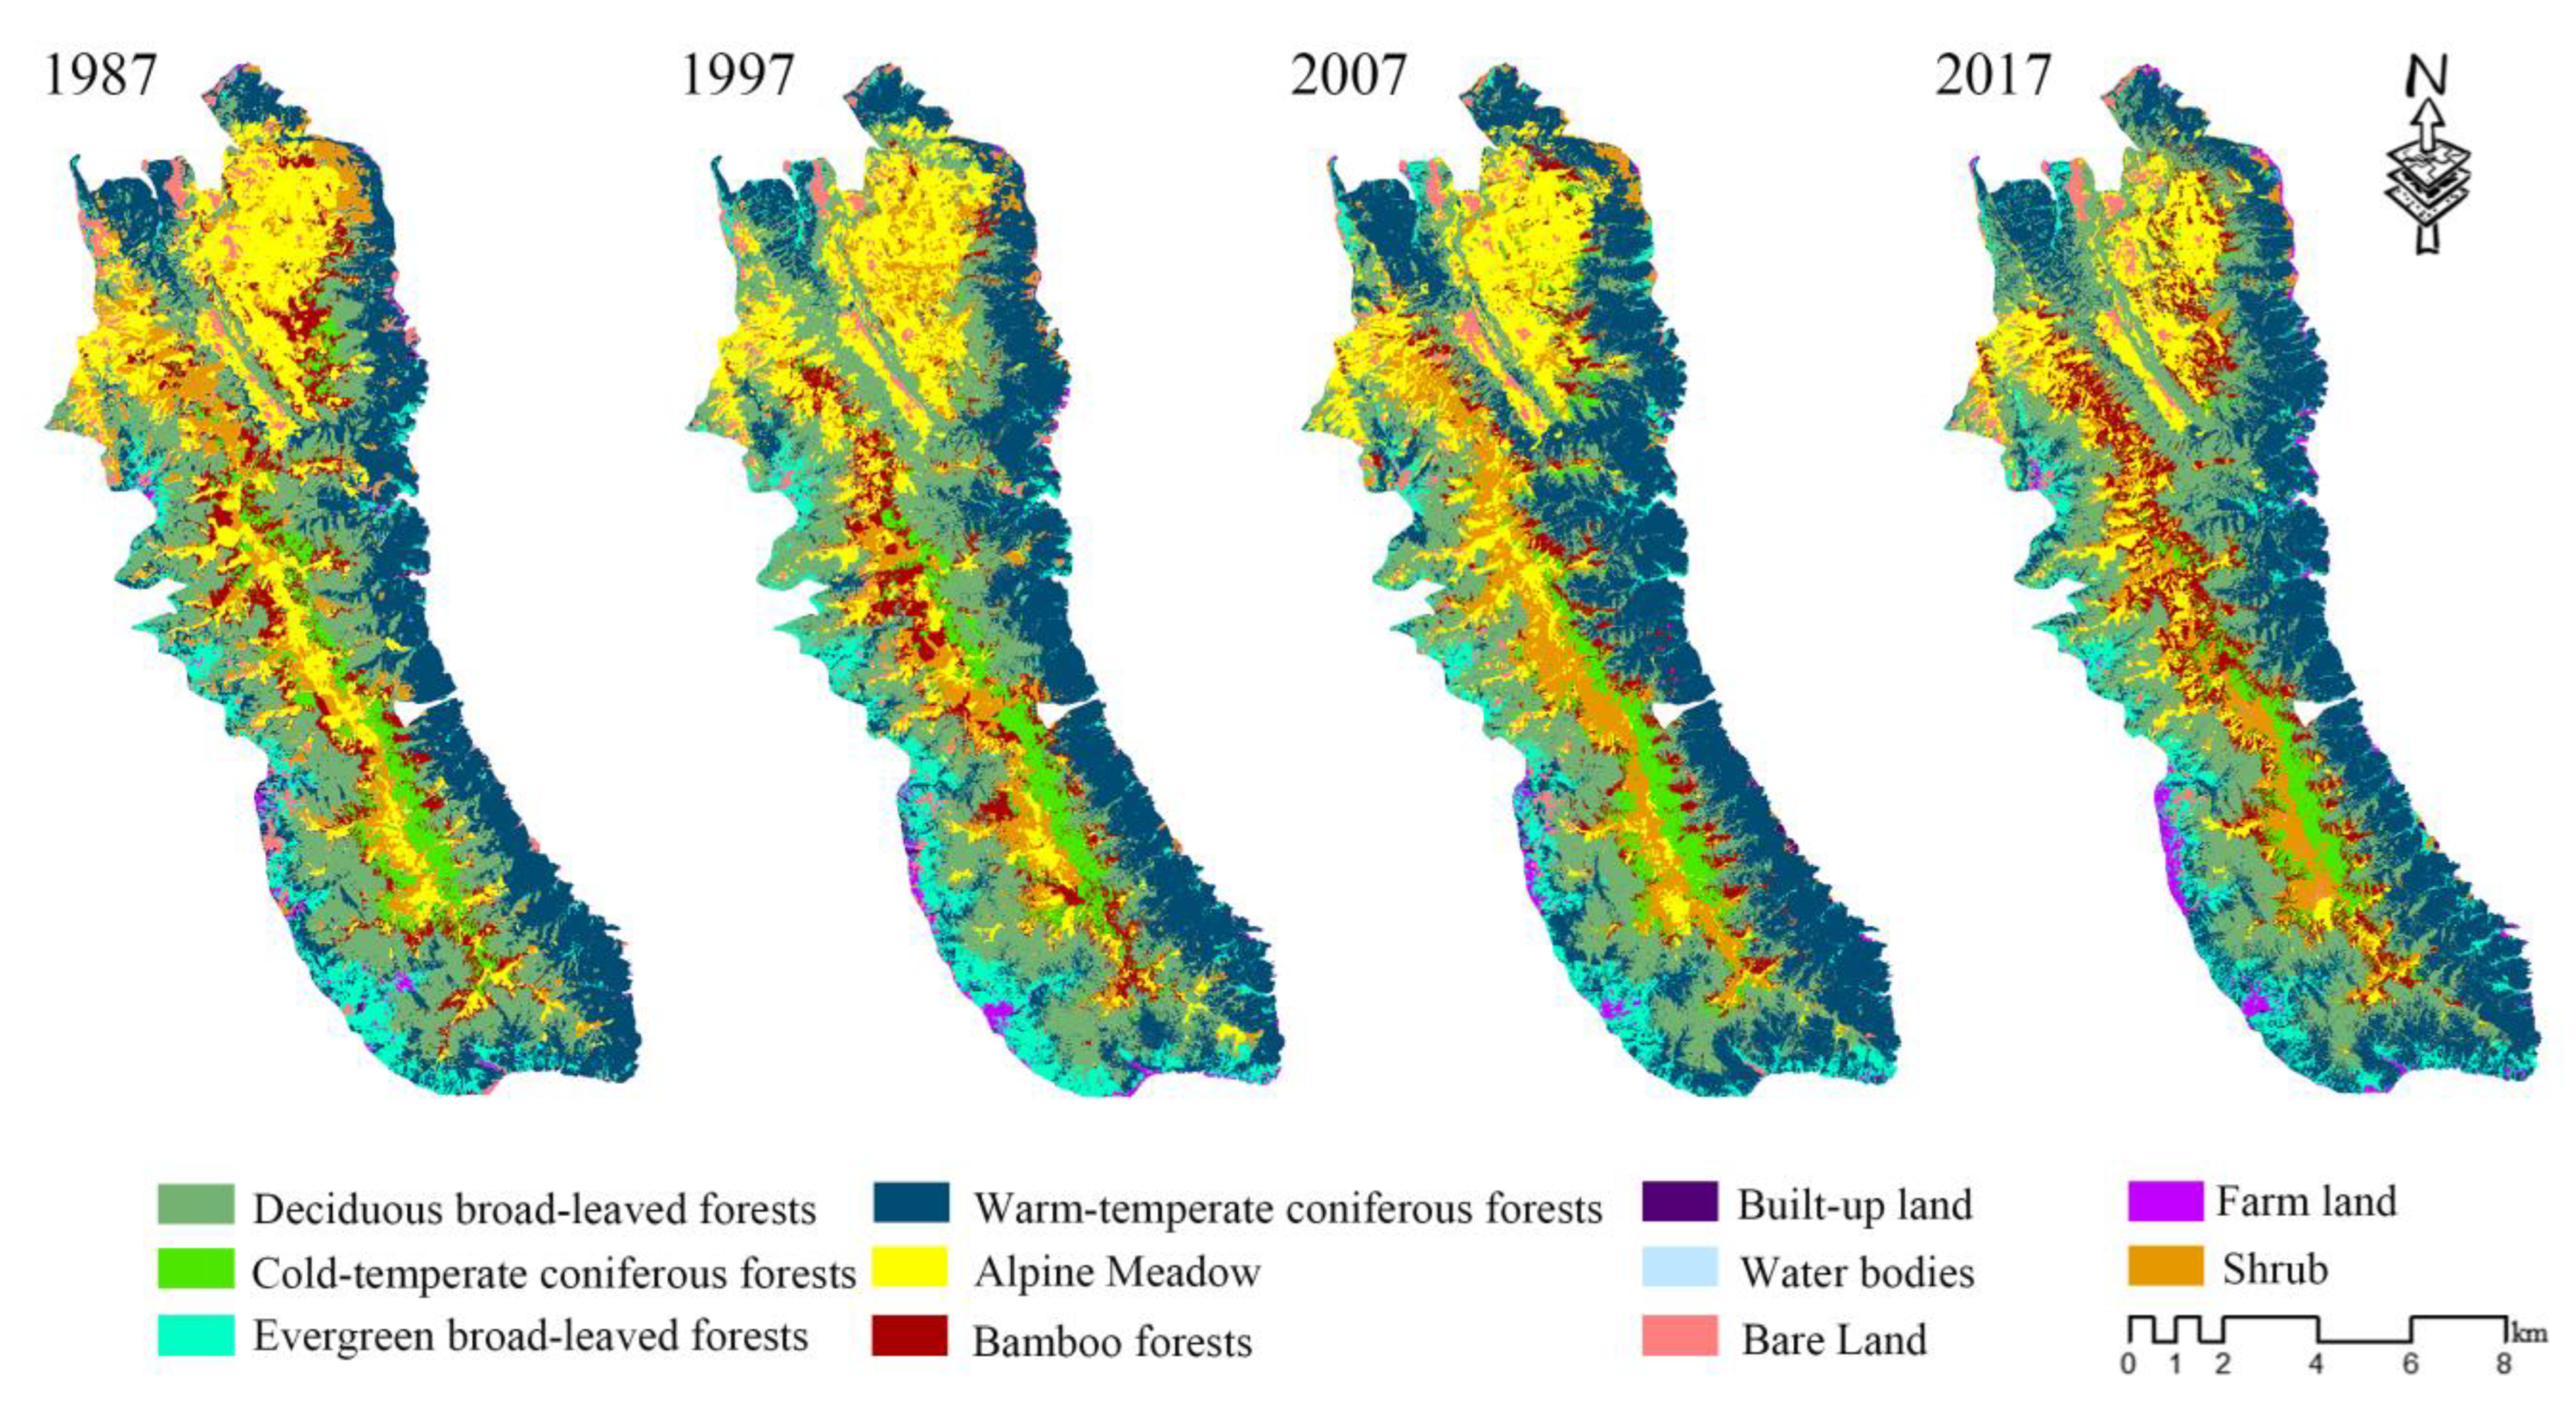
Seasonal variations often introduce errors in landscape extraction and change detection [29]. To mitigate this, we used cloud-free images collected exclusively during the autumn seasons of four selected years (1987, 1997, 2007, and 2017) for vegetation extraction, thereby avoiding uncertainties caused by seasonal changes [3,30]. In this study, we established an interpretive sign information database and selected training samples by combining field survey data and historical imagery from Google Earth. We employed Support Vector Machine (SVM) to categorize the landscape in the study area into eleven types (Figure 2): alpine meadow (AM), shrub (SH), deciduous broad-leaved forest (DBLF), cold-temperate coniferous forest (CTCF), evergreen broad-leaved forest (EBLF), warm-temperate coniferous forest (WTCF), bamboo forest (BF), built-up land (BUL), farm land (FL), bare land (BL), and water bodies (WB). The accuracy of interpretation exceeded 82%, meeting the precision requirements of the study.
Based on the interpreted vegetation distribution data, we conducted an analysis of the composition and configuration of vegetation in the Cangshan mountain using spatial pattern indices. We selected the key spatial pattern indices to quantify the composition and configuration of vegetation in the Cangshan mountain, including two class metrices and three landscape metrices (Table 1). All indices were calculated by using FRAGSTATS v4.2.

2.3.2. Fractional of Vegetation Coverage and Change Analysis

Based on the Normalized Difference Vegetation Index (NDVI) data, this study employed a dimidiate pixel model to calculate the Fractional Vegetation Coverage (FVC) [32] in the Cangshan mountain (Equation (1)). Due to the influence of the Pacific monsoon and Indian Ocean monsoon in the study area, cloud cover is prevalent throughout the year, making it challenging to acquire Landsat images with minimal or no cloud cover, particularly during the growing season from June to September [33]. The following procedure was implemented to obtain the NDVI data.
Firstly, the MFmask algorithm was applied to create a cloud and cloud shadow mask [34]. TOA, BT, and DEM data were used as the MFmask algorithm inputs. The cloud and cloud shadow masks were then used to exclude regions with cloud cover from each SR image from 1986 to 2017, and the NDVI was calculated for all the SR images without cloud cover. The maximum value composite (MVC) method was employed to generate the NDVI images. However, due to the large number of images with cloud coverage and the large area covered by clouds, there are still many gaps in the intra-year NDVI images using the MVC method. For this reason, the study uses two years of NDVI data (1986/1987, 1988/1989, …, 2014/2015, 2016/2017) for MVC to fill the gaps. Finally, the FVC in the Cangshan mountain was calculated using the MVC NDVI image.
FVC = (NDVINDVIsoil)/(NDVIvegNDVIsoil)
where NDVIsoil represents the NDVI value in areas with bare soil or no vegetation coverage, while NDVIveg represents the NDVI value in pure vegetation pixels.
To gain further insights into the changes in FVC in the Cangshan mountain, the study categorized the FVC into five levels: extremely low FVC (FVC ≤ 0.2), low FVC (0.2 < FVC ≤ 0.4), moderate FVC (0.4 < FVC ≤ 0.6), moderate-high FVC (0.6 < FVC ≤ 0.8), and high FVC (FVC > 0.8). Additionally, the least squares method was employed to calculate the trend of FVC changes, using the following formula:
S l o p e F V C = n i = 1 n i × F V C i i = 1 n i × i = 1 n F V C i n i = 1 n i 2 i = 1 n i 2
where SlopeFVC represents the trend of FVC changes, n is the number of periods involved (totaling 16 periods: 1986/1987, 1988/1989, …, 2014/2015, 2016/2017), i is the time variable ranging from 1 to 16 as an integer, and FVCi represents the FVC in the i-th periods.

3. Results and Discussion

3.1. Vegetation Composition and Changes in the Cangshan Mountain

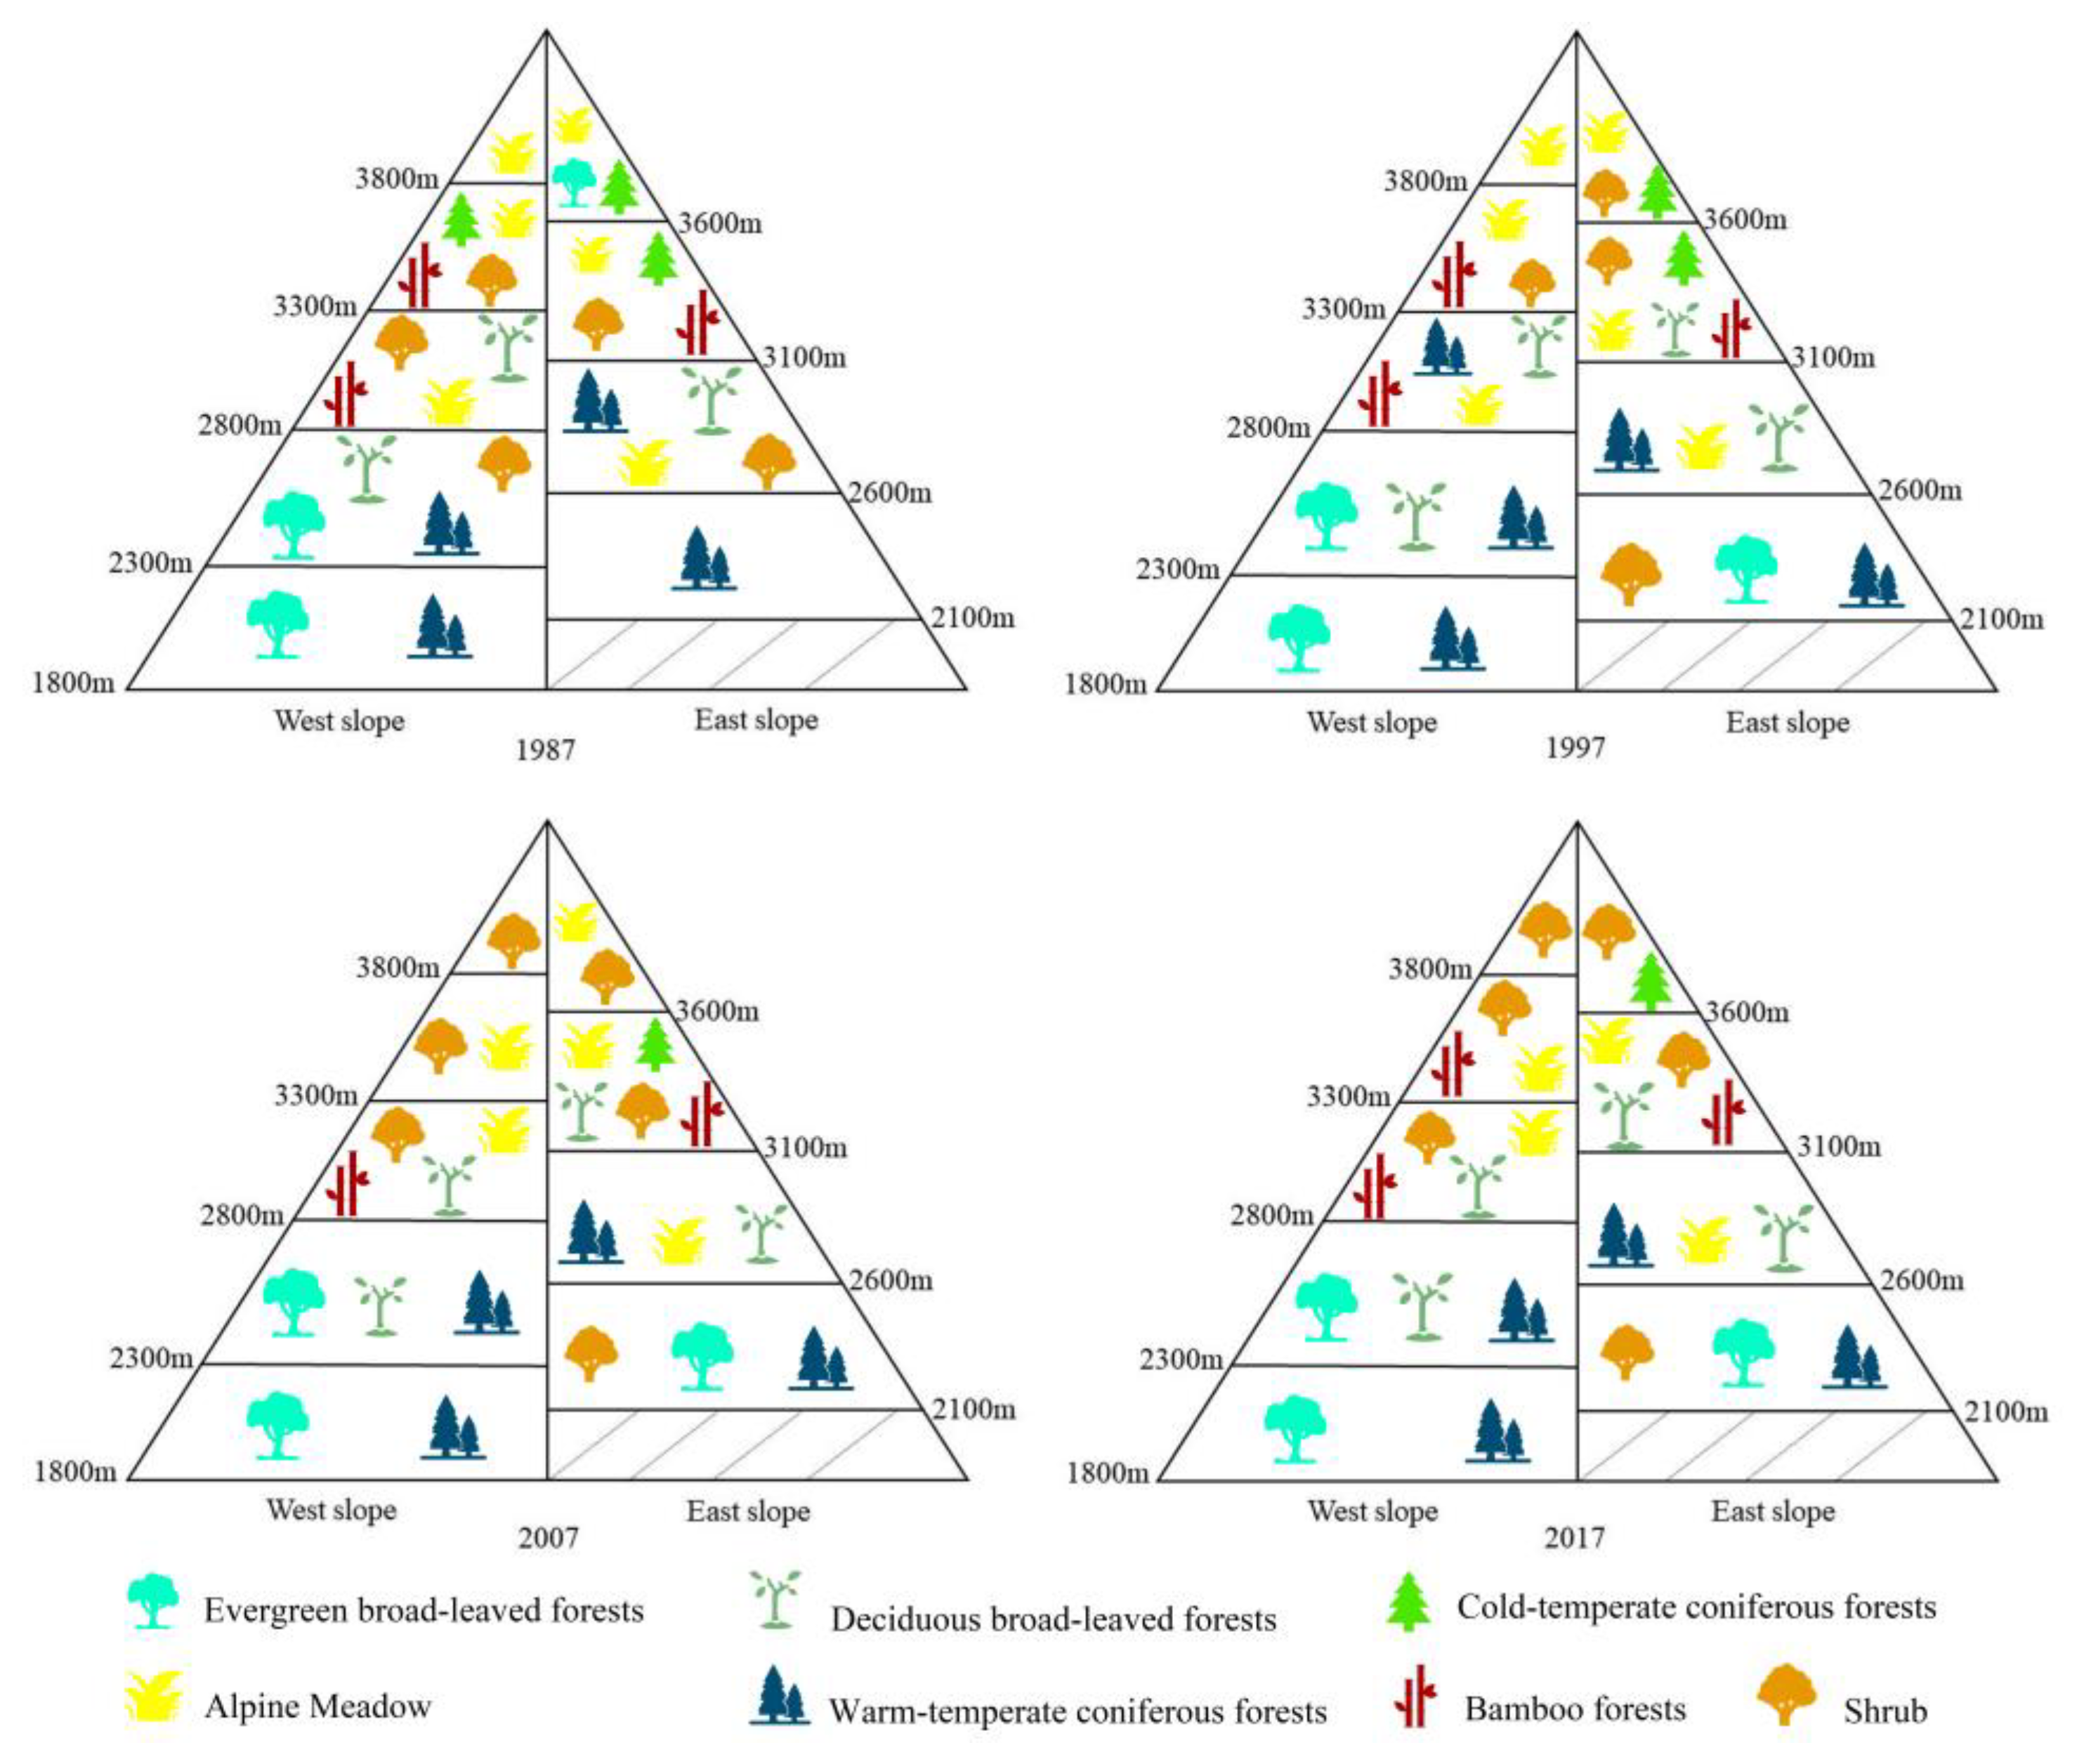
The landscape distribution of the Cangshan mountain in 1987, 1997, 2007, and 2017 is shown in Figure 2. Among the four analyzed years, the Cangshan mountain had less than 4% coverage of BUL, FL, BL, and WB, with over 96% covered by vegetation. The dominant vegetation types were WTCFs, DBLFs, BFs, and AM (Figure 2). Figure 3 reveals the typical vertical zonation pattern of vegetation in the Cangshan mountain. EBLFs were distributed between 1800–2800 m on the western slope and 2100–2600 m on the eastern slope. DBLFs were found between 2300–3300 m on the western slope and 2600–3600 m on the eastern slope. BFs were distributed between 2800–3800 m on the western slope and 3100–3600 m on the eastern slope. CTCFs were observed between 3300 m and the mountain top on the western slope, as well as between 3100 m and the mountain top on the eastern slope. AMs were present between 2800 m and the mountain top on the western slope, and between 2600 m and the mountain top on the eastern slope. SHs were distributed between 2300 m and the mountain top on the western slope, and between 2100 m and the mountain top on the eastern slope. WTCFs were found between 1800–2300 m on the western slope and 2100–3100 m on the eastern slope.
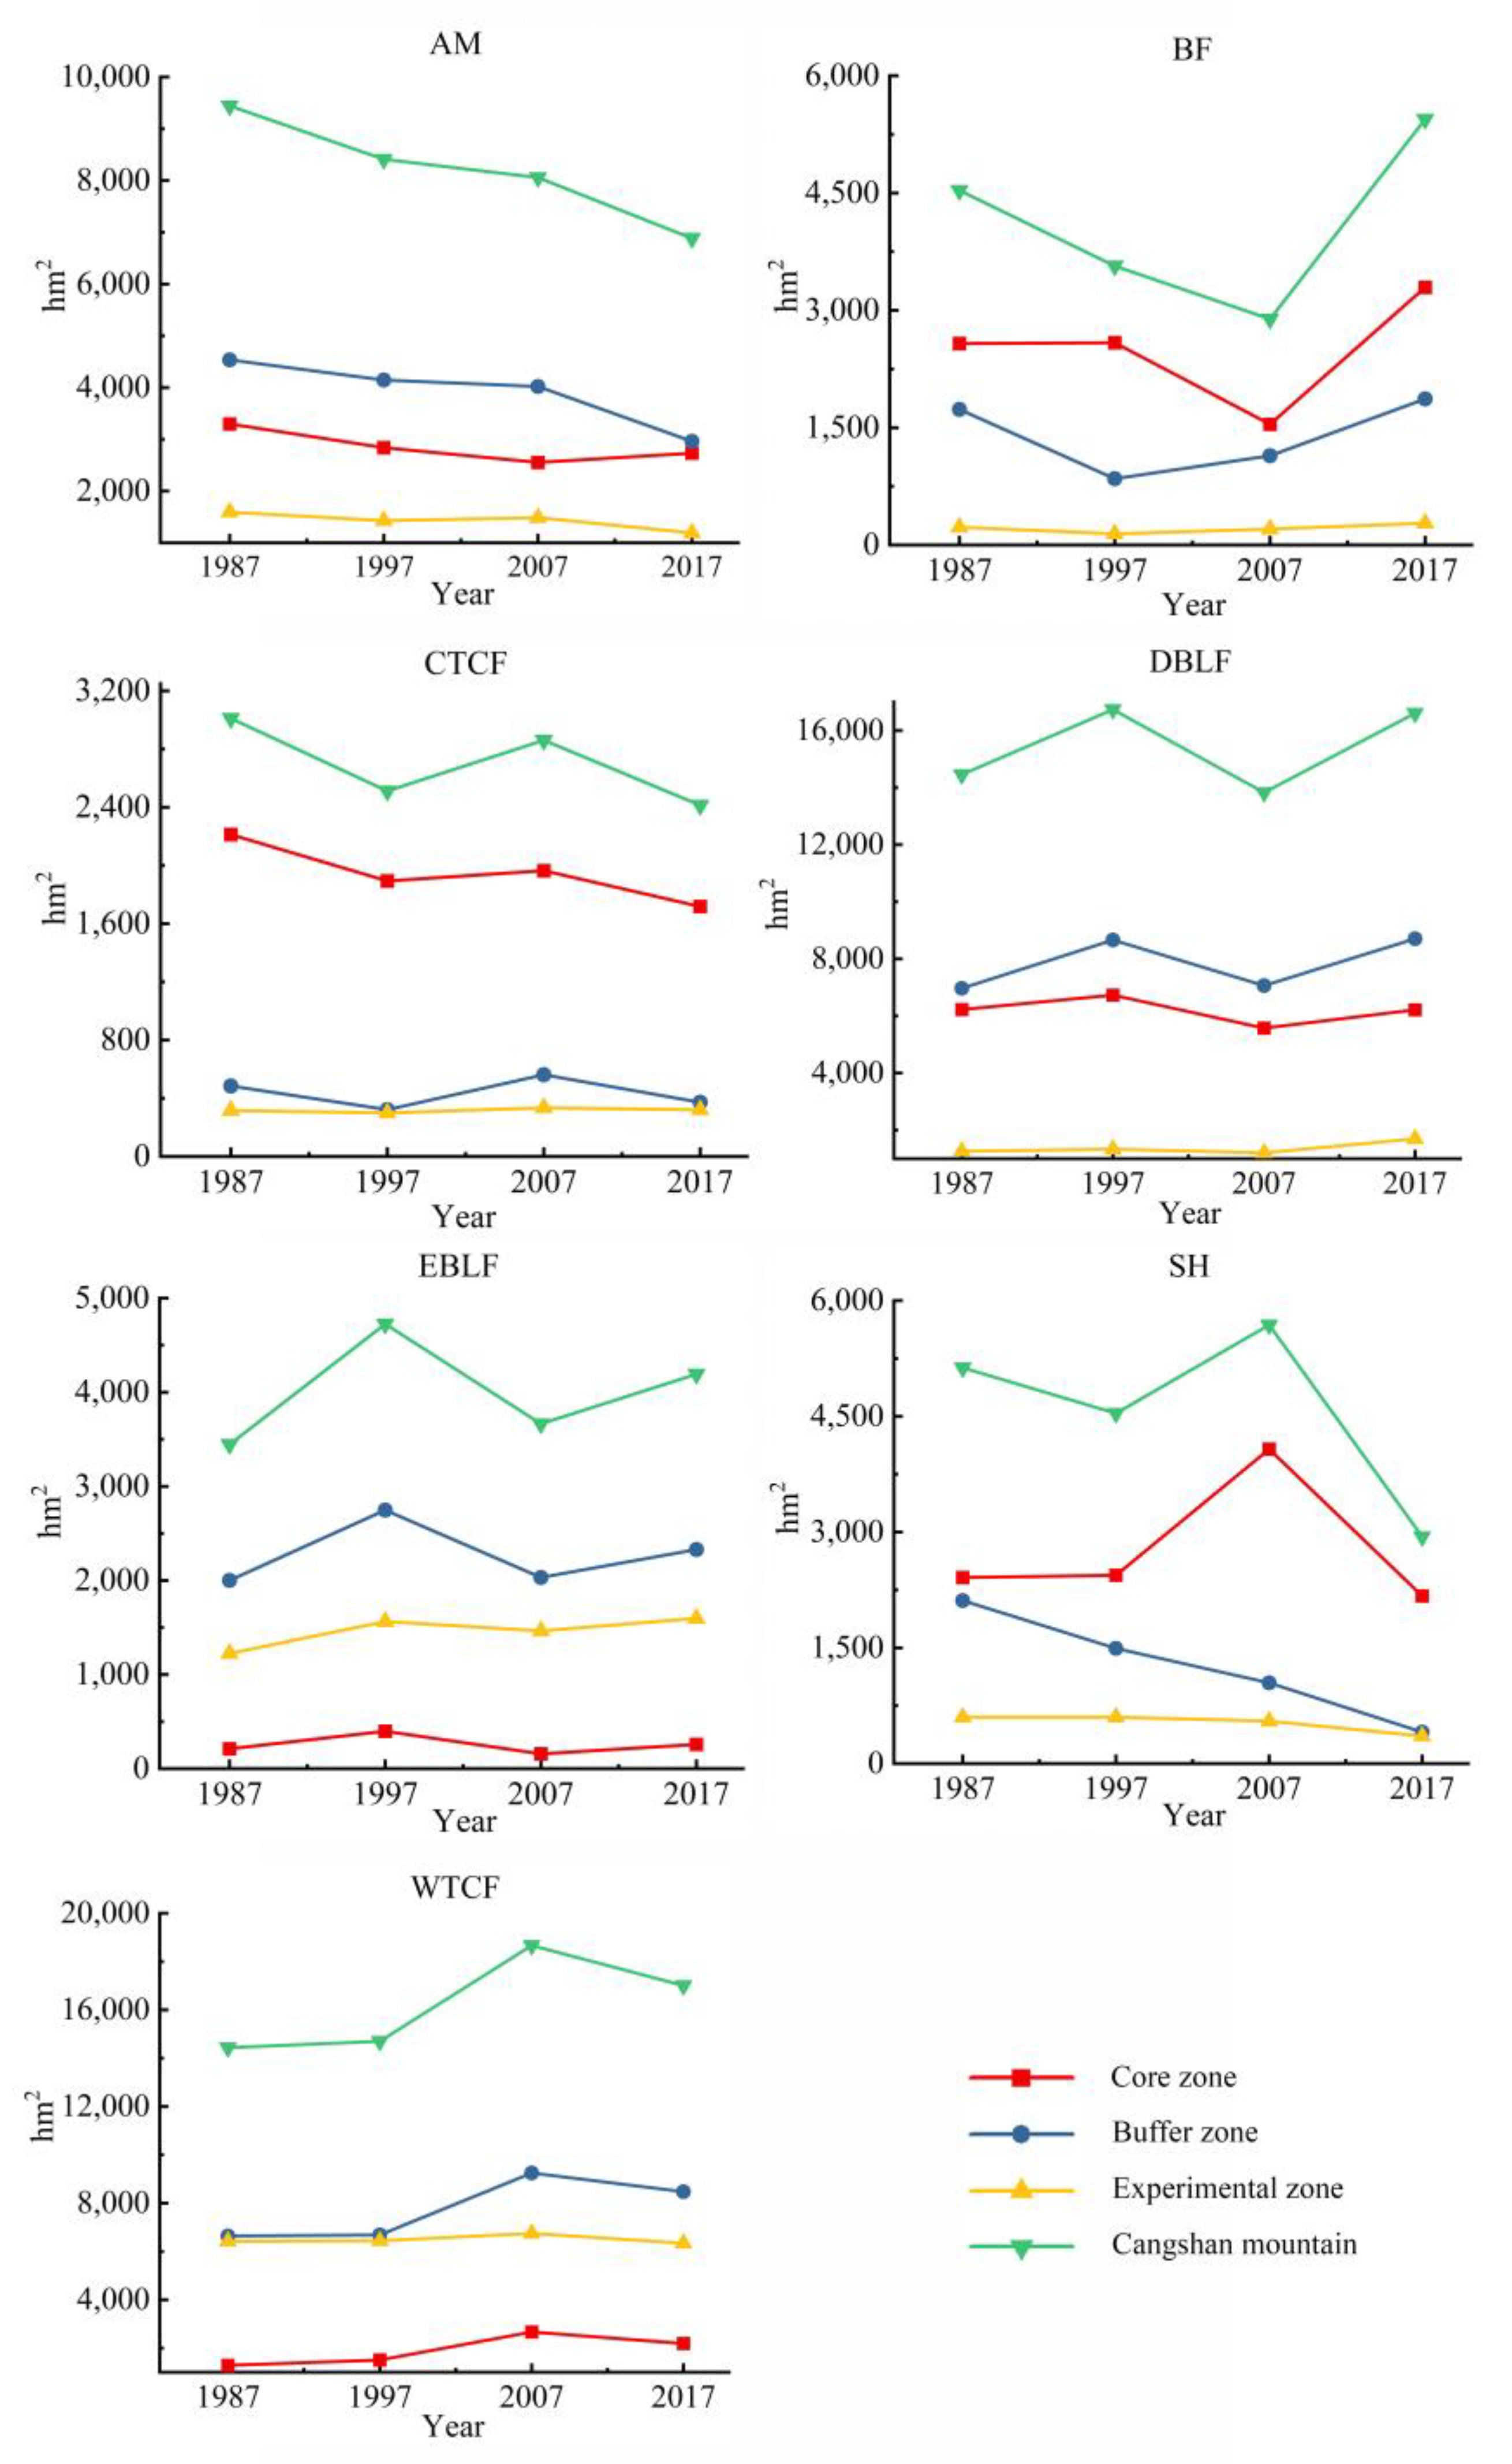
The areas of different vegetation types in the Cangshan mountain underwent changes between 1987 and 2017 (Figure 4). In the Cangshan mountain, over the 30-year period, there was a decrease in the coverage areas of CTCFs, AMs, and SHs, with reductions of 19.82%, 27.11%, and 42.67%, respectively. Conversely, there was an increase in the distribution areas of DBLFs, WTCFs, BFs, and EBLFs, with increases of 14.89%, 17.82%, 20.10%, and 21.69%, respectively. Figure 4 also illustrates the changing distribution areas of vegetation types within different functional zones from 1987 to 2017. Examining the trends from 1987 to 2017, the core zone exhibited an increase in the distribution areas of EBLFs, WTCFs, and BFs, while the distribution areas of AMs, SHs, and CTCFs decreased, with BFs displaying the largest increase. In the buffer zone, there was an increase in the distribution areas of EBLFs, DBLFs, WTCFs, and BFs, while the distribution areas of AMs, SHs, and CTCFs decreased. WTCFs and DBLFs exhibited the largest increases in this zone. In the experimental zone, there was an increase in the distribution areas of EBLFs, CTCFs, DBLFs, and BFs, while the distribution areas of AMs, SHs, and WTCFs decreased. EBLFs showed the greatest increase in this zone.
From the perspective of vegetation transition in the Cangshan mountain (Figure 5), significant changes in the transfer of DBLFs, WTCFs, EBLFs, and AMs were observed from 1987 to 2017. The main transition for DBLFs was to WTCFs, with the majority of replacement coming from the latter. AMs primarily converted to SHs and BFs. EBLFs mainly transitioned to WTCFs.
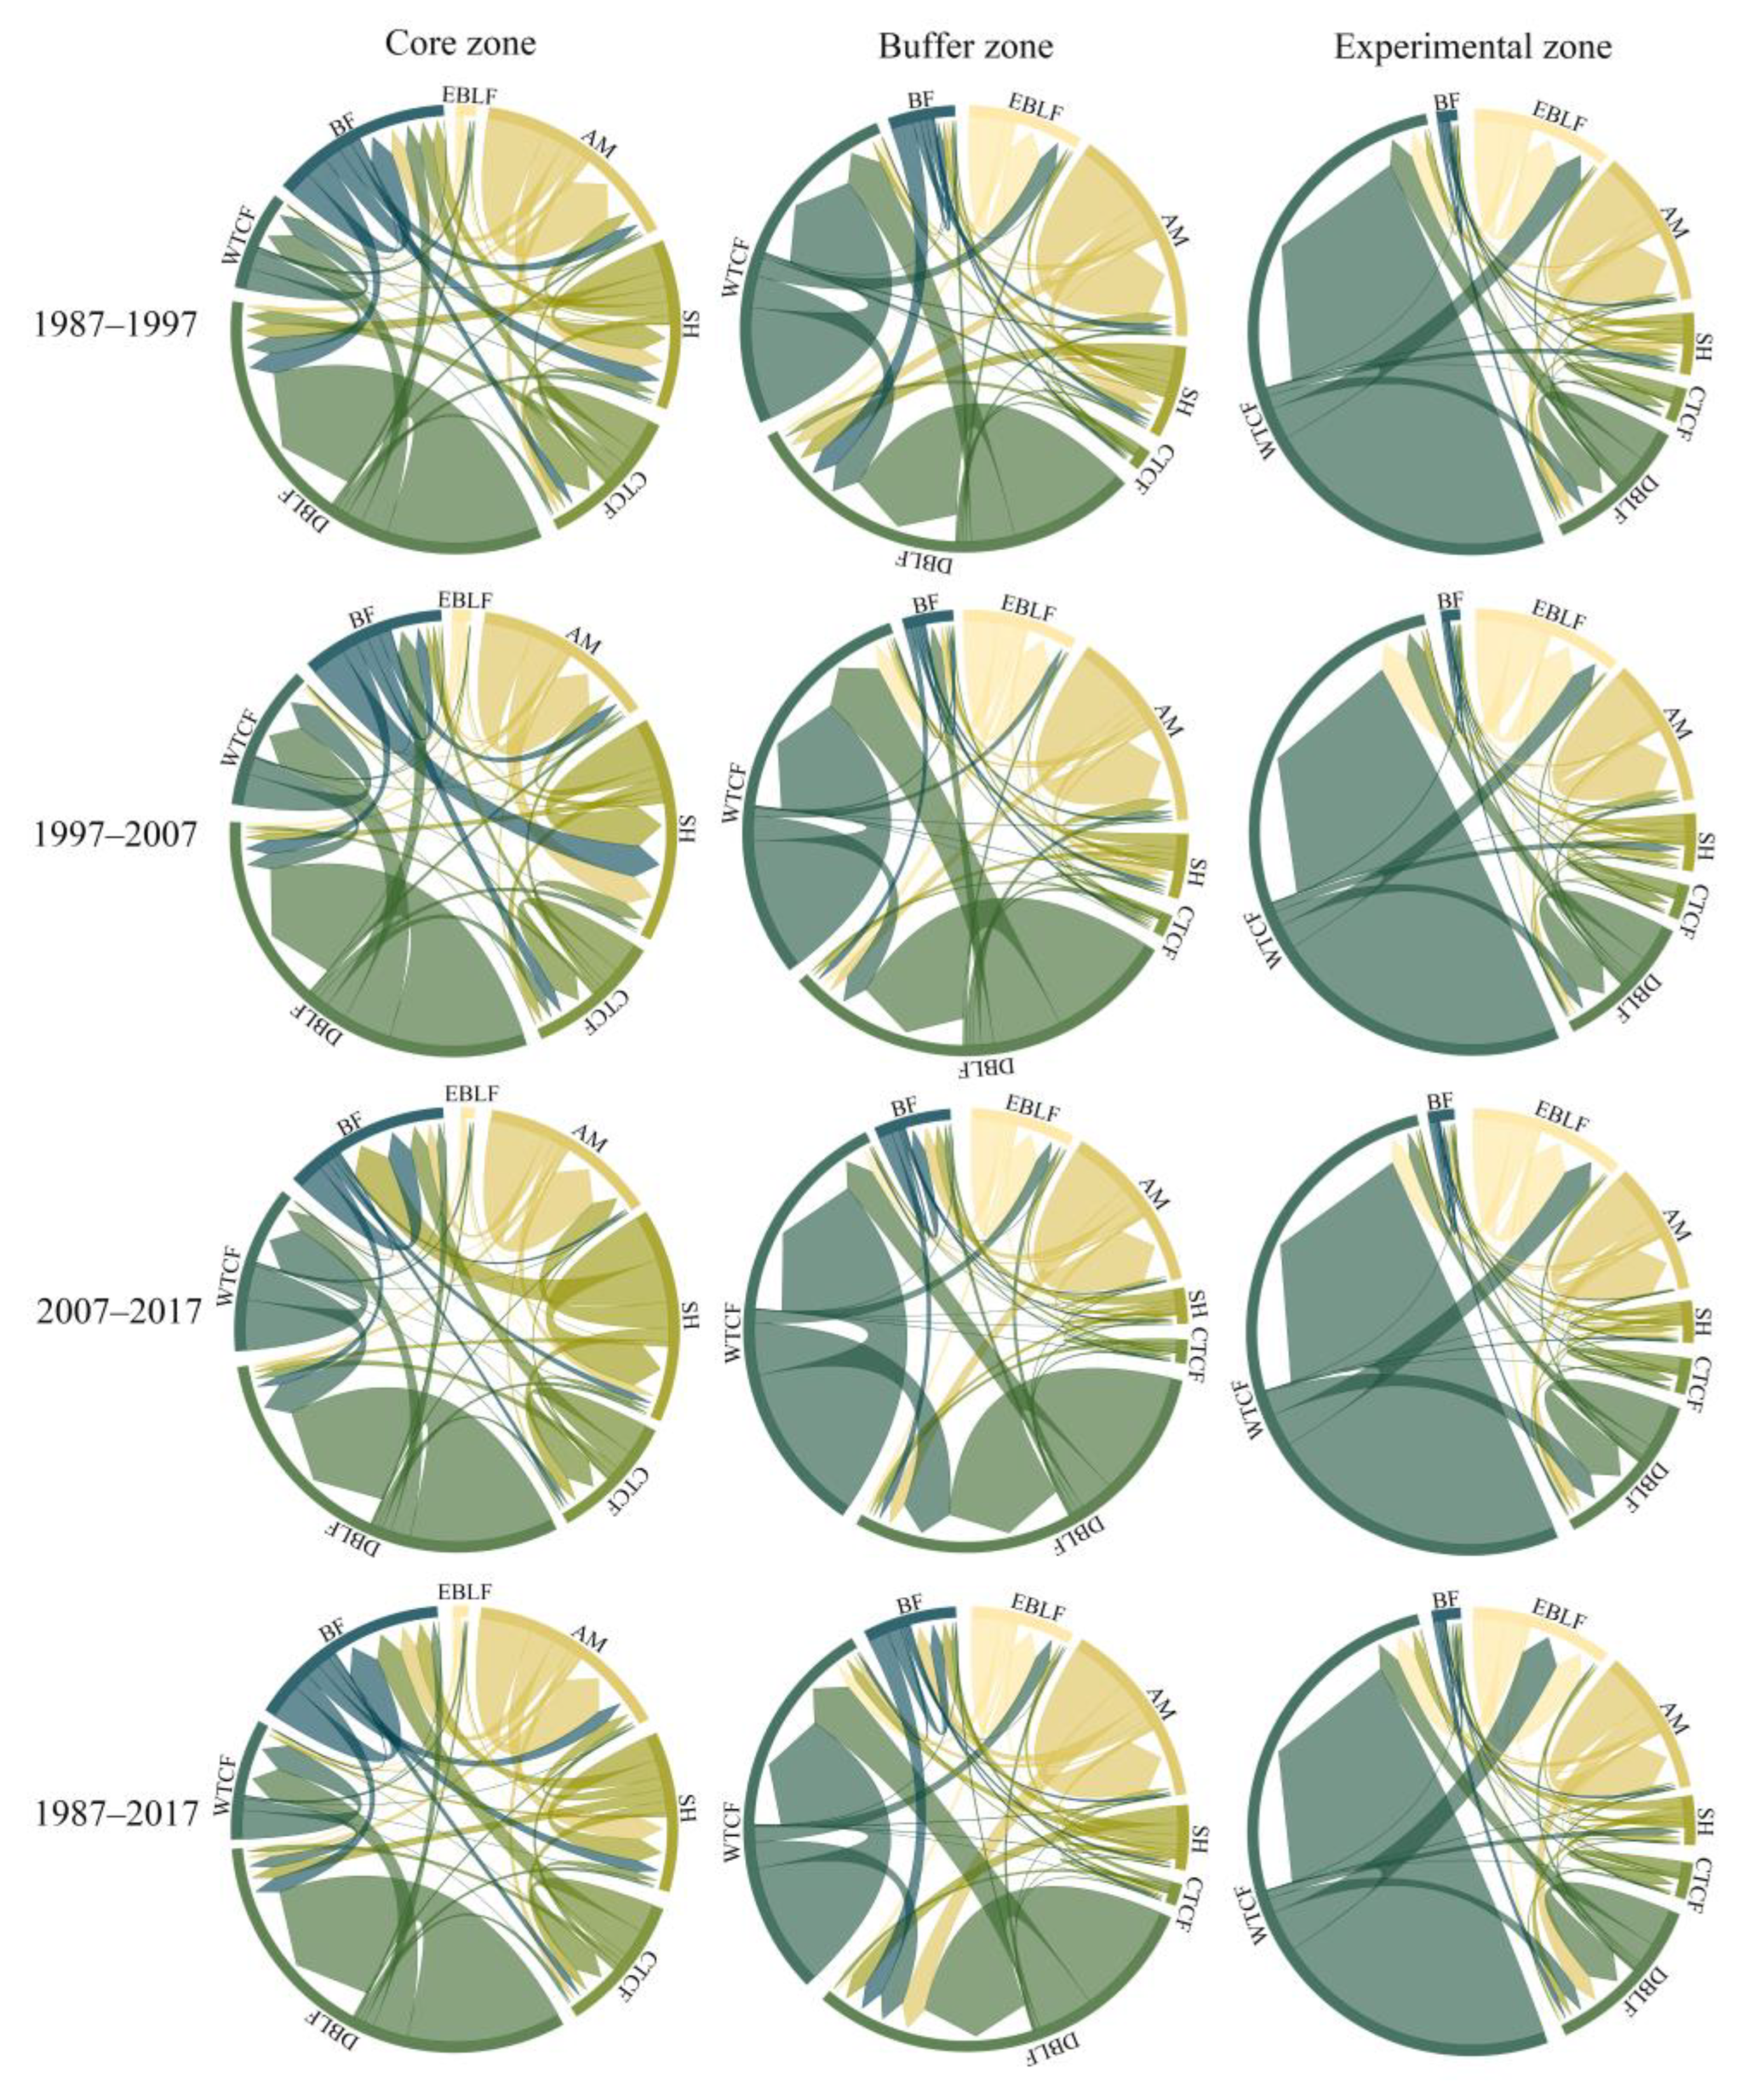
The vegetation conversion within each functional zone is illustrated in Figure 6. The different vegetation types in each functional area are transformed into each other, and some of the vegetation types are transformed into each other more obviously. For example, during 1987–2017, in the core zone, 8.42% of DBLF was converted to WTCF, and 21.23% of CTCF was converted to BF; in the buffer zone, 14.26% of DBLF became WTCF, and 22.47% of BF was converted to DBLF between 1987 to 2017; and in the experimental zone, during 1987–2017, 13.60% of DBLF was converted to WTCF, and 6.0% of WTCF was converted to EBLF.

3.2. Vegetation Configuration and Changes in the Cangshan Mountain

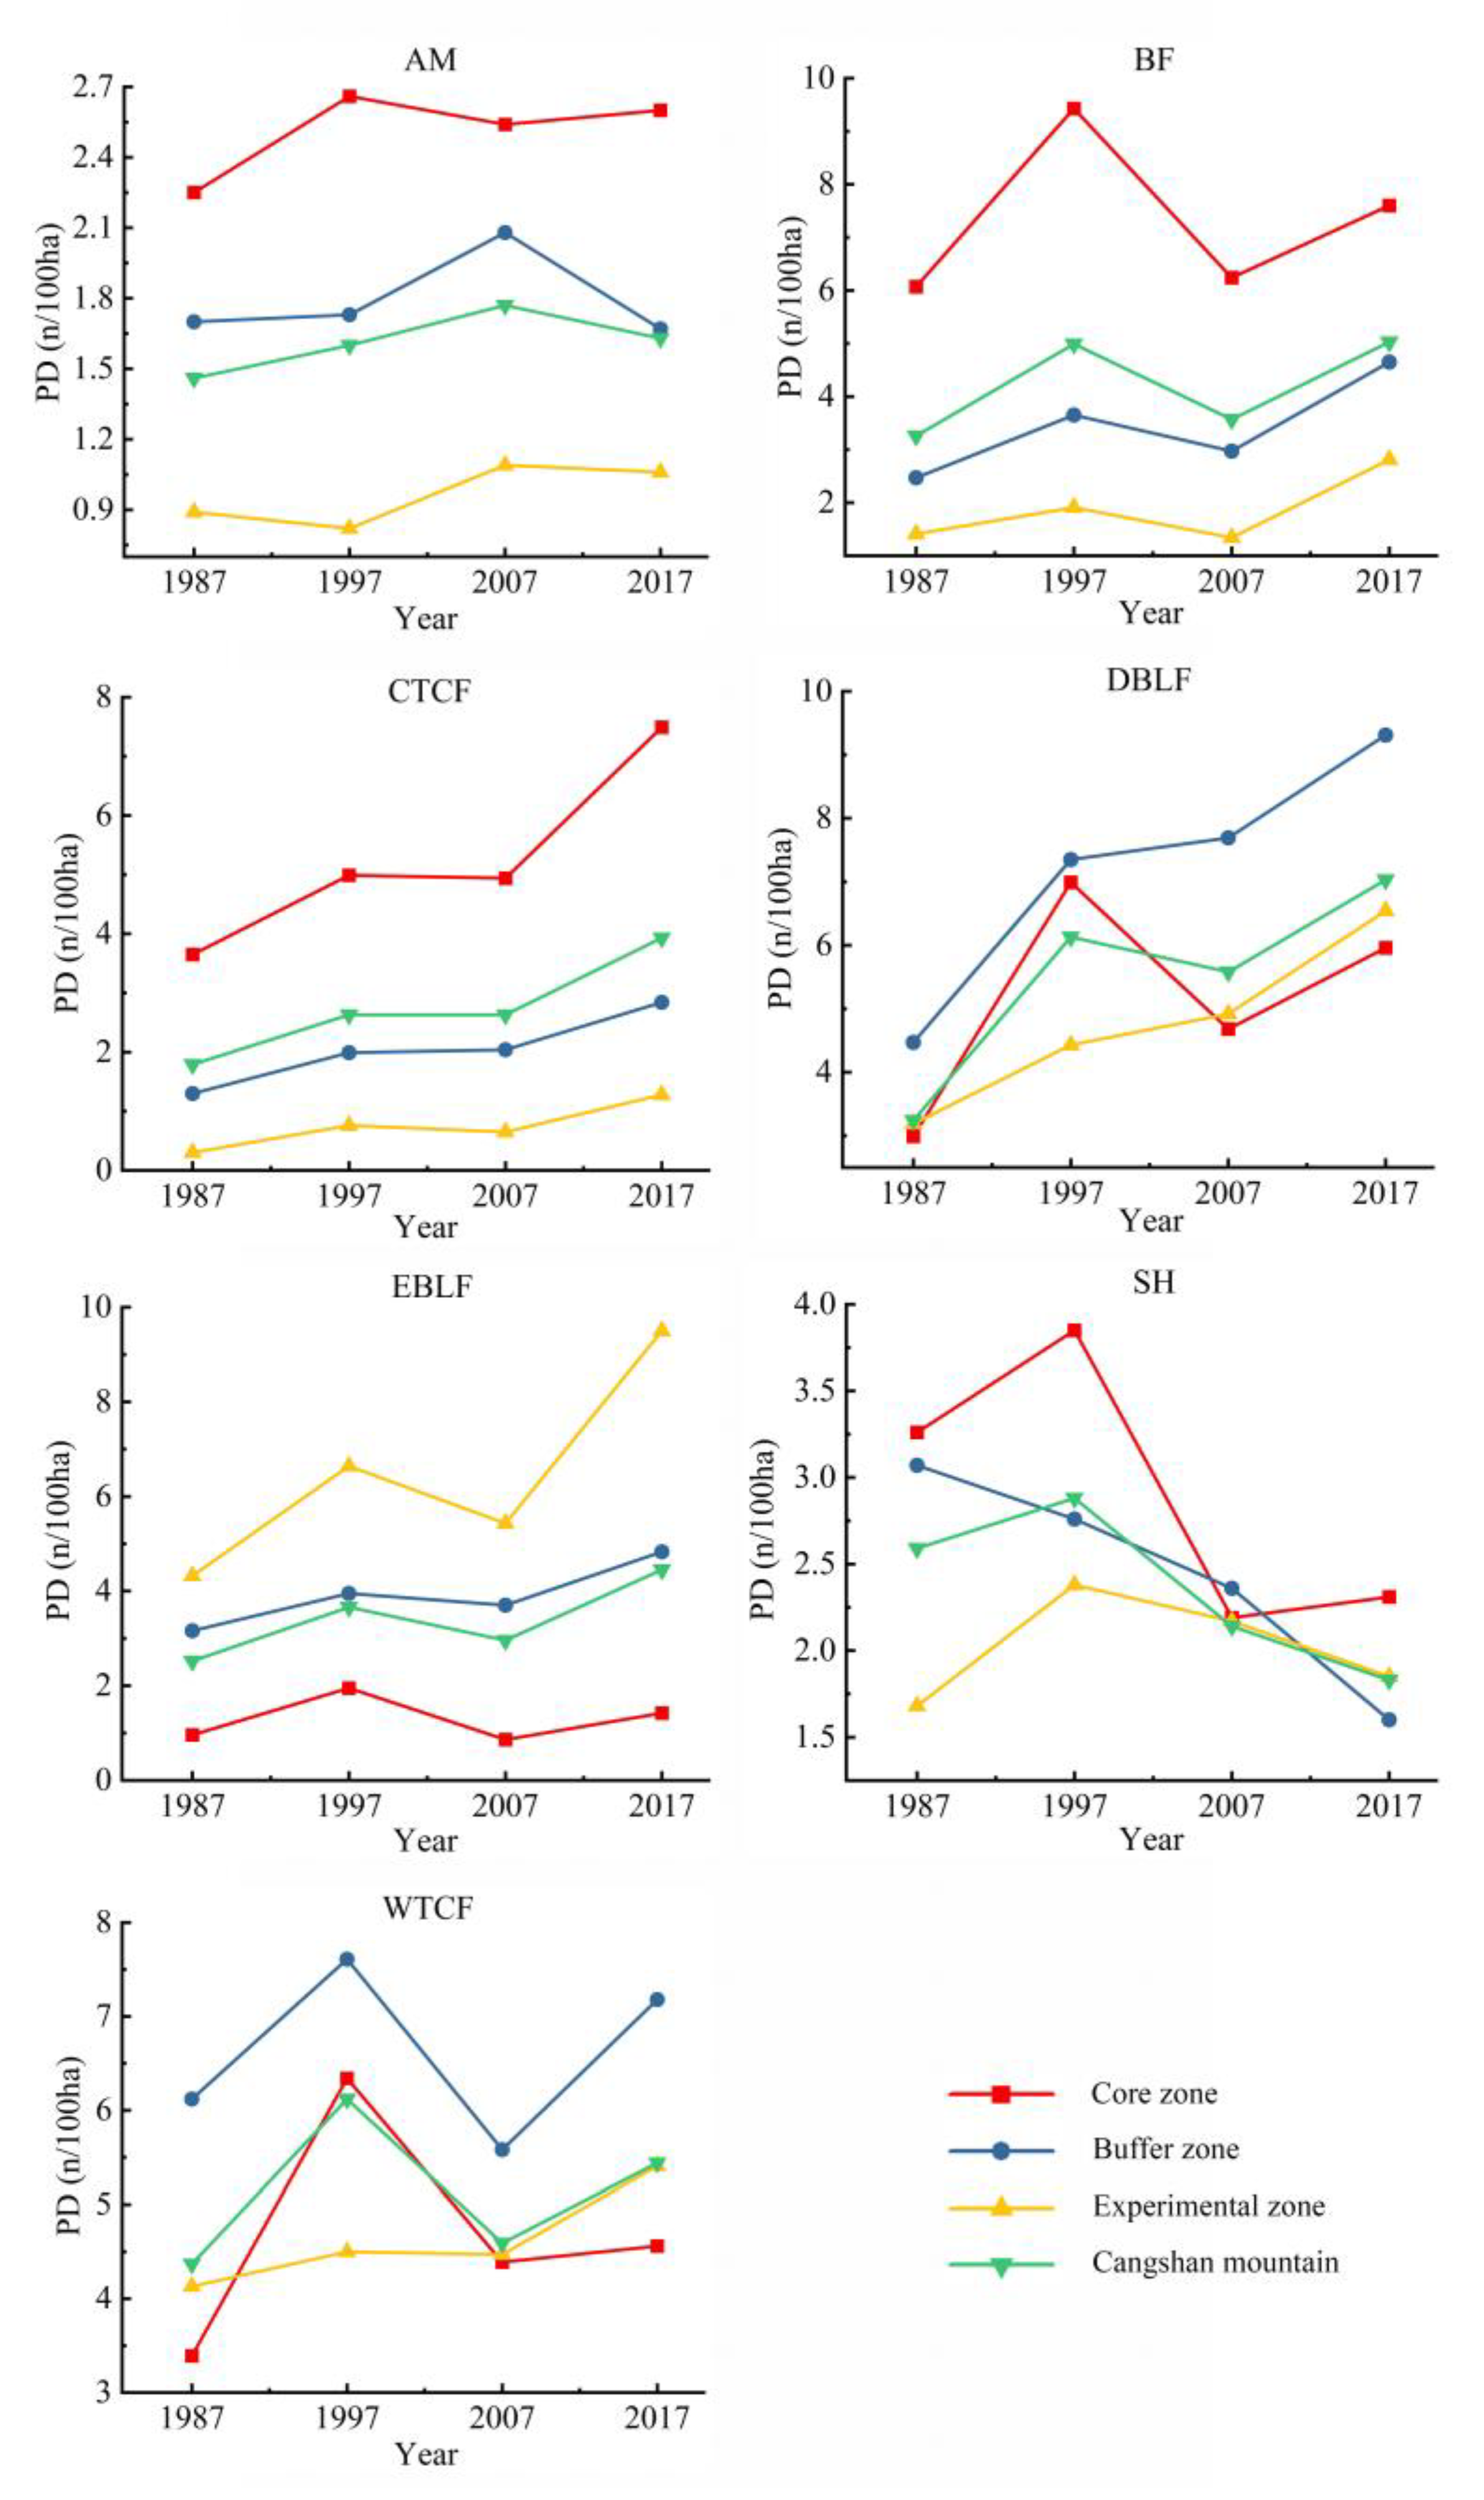
At the class level (Figure 7), the vegetation types with higher PD in the Cangshan mountain are BFs, DBLFs, and WTCFs. During the study period, there was an overall increasing trend in PD for AMs, BFs, CTCFs, DBLFs, EBLFs, and WTCFs, indicating an increasing number of vegetation patches and a tendency towards landscape fragmentation for these vegetation types. In the core zone, there was an increase in the PD values for EBLFs, AMs, CTCFs, DBLFs, WTCFs, and BFs. CTCFs and DBLFs showed significant increases in PD, while SHs exhibited a decrease. This indicates enhanced landscape fragmentation for vegetation types other than SHs in the core zone. In the buffer zone, there was an increase in PD values for EBLFs, CTCFs, DBLFs, WTCFs, and BFs, with the largest increase observed for DBLFs. On the other hand, there was a decrease in PD values for AMs and SHs, suggesting improved landscape connectivity for AMs and SHs, while other vegetation types experienced increased landscape fragmentation in the buffer zone. In the experimental zone, all vegetation landscapes showed an increasing trend in PD during the study period.
At the landscape level (Figure 8), the CONTAG value in the Cangshan mountain decreased, indicating a reduction in patch connectivity and an overall trend towards landscape fragmentation. The LSI showed an increasing trend, suggesting that the shape of landscape patches has become more complex. The SHDI exhibited a slight downward trend, indicating a slight decrease in landscape diversity. In the core zone, the LSI and SHDI showed an overall increasing trend, indicating an increased complexity of landscape patch shapes and enhanced landscape heterogeneity. The decrease in the CONTAG value suggests the emergence of more small patches in recent years, while the number of large patches has decreased, leading to a fragmented overall spatial distribution. In the buffer zone, the LSI exhibited an increasing trend, indicating a growing complexity of landscape patch shapes. The LSI value in the buffer zone was higher than that in the core zone and experimental zone, indicating that the landscape patch shapes in the buffer zone are more complex. The SHDI in the buffer zone showed a downward trend, indicating a decrease in landscape diversity. The CONTAG value in the buffer zone increased year by year, indicating enhanced landscape connectivity and reduced heterogeneity. In the experimental zone, the LSI and SHDI showed an overall increasing trend, indicating an increasing complexity of landscape patch shapes and enhanced landscape heterogeneity. The decrease in the CONTAG value suggests the emergence of more small patches, while the number of large patches has decreased.

3.3. FVC and Changes in the Cangshan Mountain

The overall area with high FVC in the Cangshan mountain showed an increasing trend from 1987 to 2017 (Table 2). The area of high FVC (0.8 ≤ FVC < 1.0) and moderate-high FVC (0.6 < FVC ≤ 0.8) had relatively high proportions in the Cangshan mountain and its three functional zones during different study periods.
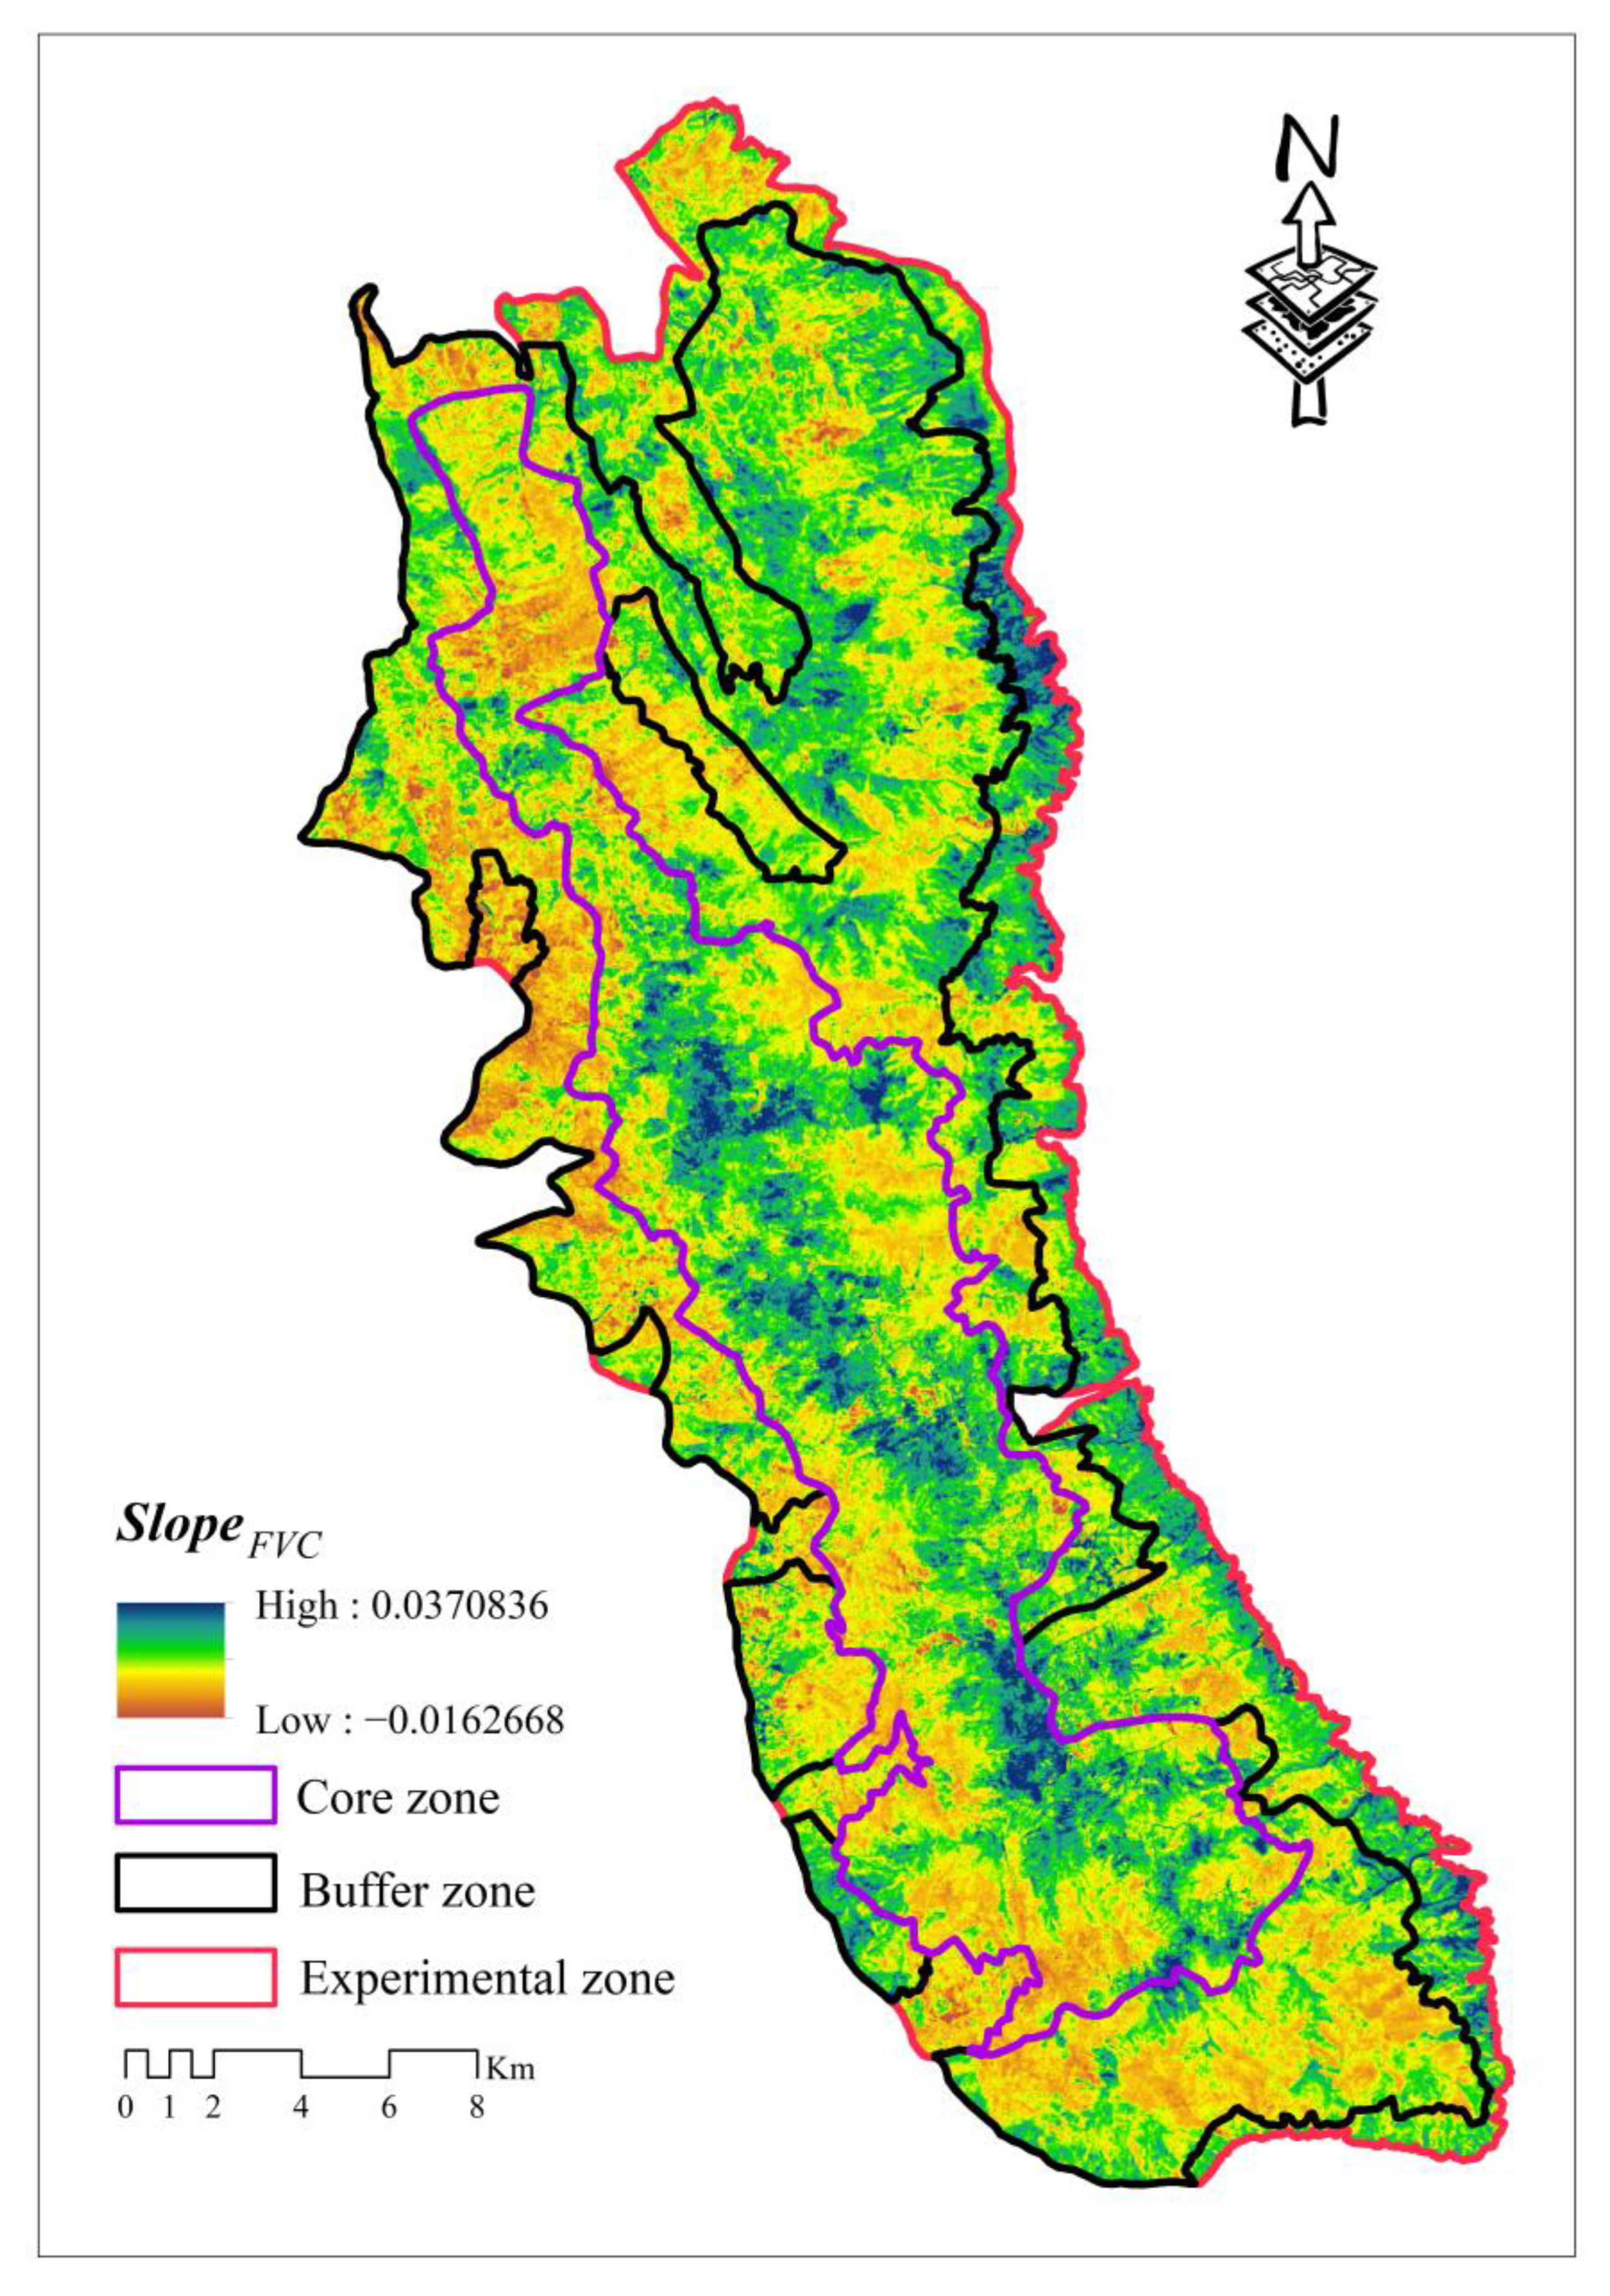
Figure 9 illustrates the trend of FVC changes, where a positive SlopeFVC value indicates an increasing trend in vegetation coverage, while a negative SlopeFVC value indicates a decreasing trend. Overall, the majority of the Cangshan mountain exhibits an increasing trend in vegetation coverage, with some areas in the western and southern parts showing a decreasing trend.

3.4. Impacts of Conservation Management on Vegetation Changes in the Cangshan Mountain

Since the establishment of the Cangshan Erhai Nature Reserve at the provincial level in 1981, the Cangshan mountain has undergone systematic and organized management. In 1994, it was upgraded to a national-level nature reserve, and dedicated institutions were established to oversee the development planning and management of the reserve, aiming to strengthen the protection and management of the Cangshan mountain. The results mentioned above indicate that, after nearly 40 years of conservation management, various measures such as planning and regulations have been successively implemented within the area, leading to significant changes in the vegetation pattern and coverage.
(1) With the implementation of various conservation management measures, such as cultivation restrictions, strict control of wildfires, logging bans, and grazing prohibitions, significant changes have occurred in the human activity areas within the reserve since its establishment as a nature reserve. Artificial landscapes, such as buildings, have gradually been removed from the Cangshan mountain (Figure 10), and the amount of land used for construction has been decreasing year by year. During the study period, the vegetation area increased by 1146 hectares (370 hectares in the core zone, 643 hectares in the buffer zone, and 133 hectares in the experimental zone), indicating significant effects in terms of vegetation protection and restoration. This also demonstrates the effectiveness of the nature reserve in protecting regional ecology and minimizing anthropogenic influences [12].
It is worth noting that, throughout the study area, there is a trend of increasing FL. However, the area of FL in the core zone has gradually decreased, while it has increased mainly in the buffer zone and the experimental zone, with the largest increase observed in the experimental zone. Additionally, the increased FL is primarily concentrated in the foothills of the eastern experimental zone and the western buffer zone, which are adjacent to the peripheral boundaries of the reserve where agricultural production and tourism activities occur. These areas are characterized by relatively flat terrain, making them highly vulnerable to human disturbances. The increase in FL in the eastern experimental zone and the western buffer zone reflects the conflicts between conservation efforts in the Cangshan mountain and community development.
(2) Between 1987 and 2017, there was an increasing trend in average FVC in the Cangshan mountain and its three functional zones. The proportion of areas with high FVC (0.8 ≤ FVC < 1.0) in the Cangshan mountain increased from 59.67% in 1987 to 97.89% in 2017. The three functional zones also showed an increasing trend in the ratio of high FVC (Table 2), with the experimental zone exhibiting the largest increase (49.32%). This indicates effective protection and restoration of vegetation in the Cangshan mountain.
Examining the annual trend of FVC (Figure 10), we can observe that FVC has continued to increase in most areas of the Cangshan mountain during the study period, with the core zone showing a particularly significant improvement. However, certain regions of the buffer zone to the west and south have experienced a decrease in FVC. This change in pattern reflects the influence of climate change on FVC in the Cangshan mountain. For example, during the years 2009 to 2012, the study area faced moderate to severe drought, characterized by prolonged dry periods and consecutive years of drought [35,36], which had a negative impact on FVC [37]. It also demonstrates the effectiveness of macro-level ecological protection measures and management in the Cangshan mountain. The establishment of the nature reserve and the implementation of various protection measures and projects have positively impacted the vegetation in the Cangshan mountain.
During the entire study period, we found that the areas where vegetation types have changed are also the areas where there is a significant increase in FVC, specifically in the central part of the core zone and the northern part of the buffer zone. In the central part of the core zone, the main vegetation changes include the conversion from CTCFs to BFs, from SHs to CTCFs and BFs, and from AMs to BFs and CTCFs. In the northern part of the buffer zone, transitions involve the conversion from BFs to DBLFs and WTCFs, from AMs to DBLFs and WTCFs, and from SHs to WTCFs. Additionally, we also found conversions from SHs to AMs and BFs and from BFs to AMs, which resulted in a decrease in SlopeFVC. These findings may provide us some inspiration for vegetation management in the nature reserve, and we can control the trend of FVC change by regulating the mutual conversion between vegetation types.
(3) Analysis of vegetation configuration reveals an increasing trend in vegetation landscape fragmentation and connectivity in the Cangshan mountain and its three functional zones, with the shape of the vegetation landscape becoming increasingly complex. However, there are variations in fragmentation characteristics among the functional zones. In the core zone, vegetation landscapes, excluding SHs, have experienced increased fragmentation. In the buffer zone, the connectivity of Ams and SHs has improved, while other vegetation types have become more fragmented. In the experimental zone, all vegetation types have exhibited a trend of fragmentation.
We believe that two main factors contribute to the fragmentation of vegetation landscapes and the increase in scattered vegetation islands in the Cangshan mountain: (1) The surrounding area of the nature reserve is densely populated with villages and has a significant proportion of agricultural land. In addition, being a scenic area [38] and the main body of the Cangshan UNESCO Global Geopark, the Cangshan mountain faces high and frequent disturbances. Particularly, the buffer zone and experimental zone are heavily influenced by human activities, resulting in the formation of numerous fragmented patches that exacerbate vegetation fragmentation in the nature reserve. Landscape fragmentation caused by anthropogenic interference is an issue that many nature reserves face and need to be solved [39,40]. (2) Strong protection and management measures, such as restrictions on cultivation, strict control of fires, and prohibition of logging and grazing, have led to the continuous increase in the total area and vegetation coverage of the Cangshan mountain. Simultaneously, human disturbances in the area have gradually decreased, especially in the core zone where human interference is strictly limited to scientific research purposes. In areas with minimal human interference, such as the core area, vegetation structure characteristics are primarily influenced by climate factors [41]. On one hand, climate change hinders or amplifies the natural succession process of different plant species, resulting in the extinction of certain plants in specific locations or the rapid expansion of climate-adaptive plant species. Many small islands of vegetation thus are formed, intensifying the fragmentation of the vegetated landscape. On the other hand, climate change has provided refuge for some invasive species, further contributing to the fragmentation of vegetation landscapes [42].

4. Conclusions

This study utilized Landsat satellite images and remote sensing and GIS technologies to analyze the landscape pattern and coverage changes of vegetation in the Cangshan Erhai National Nature Reserve (Cangshan mountain part) and evaluate the effectiveness of the nature reserve.
Thanks to the long-term and high spatial resolution observation of the Landsat mission, we can conduct a comprehensive and detailed assessment of vegetation information in Cangshan mountain for a long time. Therefore, this study highlights the critical role of Landsat mission in long-term sustained Earth’s surface observations.
During the study period, the Cangshan Erhai National Nature Reserve (Cangshan mountain part) demonstrated significant conservation outcomes, including a substantial increase in vegetation area and notable improvement in FVC. Among the different functional zones, the core zone exhibited the highest conservation effectiveness, followed by the buffer zone, while the experimental zone showed relatively weaker results. However, the fragmentation of vegetation landscapes in the Cangshan mountain has intensified due to the influence of climate change and human activities. It is crucial for the relevant management authorities to address this issue promptly and adjust conservation management measures to reduce fragmentation, improve connectivity, and increase the number of large patches in the vegetation landscape.
The study quickly and visually identifies the vegetation pattern and FVC in the Cangshan mountain. The results of this study offer decision-making support and data for relevant management agencies, which is conducive to optimizing the conservation and management measures and improving the quality and stability of the forest ecosystem in the Cangshan mountain.

Author Contributions

Methodology, Y.C. and X.H.; software, C.N.; validation, X.H. and J.F.; formal analysis, C.N.; resources, X.H.; writing—original draft, C.N.; writing—review & editing, Y.C. and J.F.; supervision, C.N.; project administration, Y.C.; funding acquisition, Y.C. All authors have read and agreed to the published version of the manuscript.

Funding

This research was funded by the Yunnan Provincial Basic Research Joint Special Fund Project (2019FH001(-052)), the National Natural Science Foundation of China (41963007), and Cangshan Mountain Synthetic Scientific Expeditions Fund.

Data Availability Statement

Landsat imagery and DEM are openly available via the USGS.

Acknowledgments

We are grateful to the anonymous reviewers whose constructive suggestions have improved the quality of this study. We thank the Innovative Team of Plant Ecology and Climate Change in Hengduan Mountains and the Plant Ecology Innovation Team of Dali University for their helps. We are also grateful for the data support from the ESPA (https://espa.cr.usgs.gov (accessed on 1 July 2019)).

Conflicts of Interest

The authors declare no conflict of interest.

References

  1. Hussain, S.; Qin, S.; Nasim, W.; Bukhari, M.A.; Mubeen, M.; Fahad, S.; Raza, A.; Abdo, H.G.; Tariq, A.; Mousa, B.J.A. Monitoring the dynamic changes in vegetation cover using spatio-temporal remote sensing data from 1984 to 2020. Atmosphere 2022, 13, 1609. [Google Scholar] [CrossRef]
  2. Chen, T.; Guo, R.; Yan, Q.; Chen, X.; Zhou, S.; Liang, C.; Wei, X.; Dolman, H.J.B. Land management contributes significantly to observed vegetation browning in Syria during 2001–2018. Biogeosciences 2022, 19, 1515–1525. [Google Scholar] [CrossRef]
  3. Aly, A.A.; Al-Omran, A.M.; Sallam, A.S.; Al-Wabel, M.I.; Al-Shayaa, M.S.J.S.E. Vegetation cover change detection and assessment in arid environment using multi-temporal remote sensing images and ecosystem management approach. Solid Earth 2016, 7, 713–725. [Google Scholar] [CrossRef] [Green Version]
  4. Peng, L.; Deng, W.; Ying, L. Understanding the Role of Urbanization on Vegetation Dynamics in Mountainous Areas of Southwest China: Mechanism, Spatiotemporal Pattern, and Policy Implications. ISPRS Int. J. Geo-Inf. 2021, 10, 590. [Google Scholar] [CrossRef]
  5. Bai, Y.; Li, S.; Liu, M.; Guo, Q. Assessment of vegetation change on the Mongolian Plateau over three decades using different remote sensing products. J. Environ. Manag. 2022, 317, 115509. [Google Scholar] [CrossRef]
  6. Piedallu, C.; Cheret, V.; Denux, J.-P.; Perez, V.; Azcona, J.S.; Seynave, I.; Gégout, J. Soil and climate differently impact NDVI patterns according to the season and the stand type. Sci. Total Environ. 2019, 651, 2874–2885. [Google Scholar] [CrossRef] [PubMed]
  7. Piao, S.; Wang, X.; Park, T.; Chen, C.; Lian, X.; He, Y.; Bjerke, J.W.; Chen, A.; Ciais, P.; Tømmervik, H.; et al. Characteristics, drivers and feedbacks of global greening. Nat. Rev. Earth Environ. 2020, 1, 14–27. [Google Scholar] [CrossRef] [Green Version]
  8. Geldmann, J.; Manica, A.; Burgess, N.D.; Coad, L.; Balmford, A. A global-level assessment of the effectiveness of protected areas at resisting anthropogenic pressures. Proc. Natl. Acad. Sci. USA 2019, 116, 23209–23215. [Google Scholar] [CrossRef]
  9. Huang, S.; Zheng, X.; Ma, L.; Wang, H.; Huang, Q.; Leng, G.; Meng, E.; Guo, Y. Quantitative contribution of climate change and human activities to vegetation cover variations based on GA-SVM model. J. Hydrol. 2020, 584, 124687. [Google Scholar] [CrossRef]
  10. Gao, X.; Huang, X.; Lo, K.; Dang, Q.; Wen, R. Vegetation responses to climate change in the Qilian Mountain Nature Reserve, Northwest China. Glob. Ecol. Conserv. 2021, 28, e01698. [Google Scholar] [CrossRef]
  11. Strubelt, I.; Diekmann, M.; Peppler-Lisbach, C.; Gerken, A.; Zacharias, D. Vegetation changes in the Hasbruch forest nature reserve (NW Germany) depend on management and habitat type. For. Ecol. Manag. 2019, 444, 78–88. [Google Scholar] [CrossRef]
  12. Zhang, Y.-X.; Wang, Y.-K.; Fu, B.; Dixit, A.M.; Chaudhary, S.; Wang, S. Impact of climatic factors on vegetation dynamics in the upper Yangtze River basin in China. J. Mt. Sci. 2020, 17, 1235–1250. [Google Scholar] [CrossRef]
  13. Haight, J.; Hammill, E. Protected areas as potential refugia for biodiversity under climatic change. Biol. Conserv. 2020, 241, 108258. [Google Scholar] [CrossRef]
  14. Sun, S.; Sang, W.; Axmacher, J.C. China’s national nature reserve network shows great imbalances in conserving the country’s mega-diverse vegetation. Sci. Total Environ. 2020, 717, 137159. [Google Scholar] [CrossRef]
  15. Qian, D.; Cao, G.; Du, Y.; Li, Q.; Guo, X. Impacts of climate change and human factors on land cover change in inland mountain protected areas: A case study of the Qilian Mountain National Nature Reserve in China. Environ. Monit. Assess. 2019, 191, 486. [Google Scholar] [CrossRef] [PubMed]
  16. Liu, Y.; Wang, C.; Wang, H.; Chang, Y.; Yang, X.; Zang, F.; Liu, X.; Zhao, C. An integrated ecological security early-warning framework in the national nature reserve based on the gray model. J. Nat. Conserv. 2023, 73, 126394. [Google Scholar] [CrossRef]
  17. Becker, T.; Spanka, J.; Schröder, L.; Leuschner, C. Forty years of vegetation change in former coppice-with-standards woodlands as a result of management change and N deposition. Appl. Veg. Sci. 2017, 20, 304–313. [Google Scholar] [CrossRef]
  18. Piao, S.; Yin, G.; Tan, J.; Cheng, L.; Huang, M.; Li, Y.; Liu, R.; Mao, J.; Myneni, R.B.; Peng, S. Detection and attribution of vegetation greening trend in China over the last 30 years. Glob. Chang. Biol. 2015, 21, 1601–1609. [Google Scholar] [CrossRef]
  19. Pan, N.; Feng, X.; Fu, B.; Wang, S.; Ji, F.; Pan, S. Increasing global vegetation browning hidden in overall vegetation greening: Insights from time-varying trends. Remote Sens. Environ. 2018, 214, 59–72. [Google Scholar] [CrossRef]
  20. Huang, L.; Shao, Q.; Liu, J. Assessing the conservation effects of nature reserve networks under climate variability over the northeastern Tibetan plateau. Ecol. Indic. 2019, 96, 163–173. [Google Scholar] [CrossRef]
  21. Tang, J.; Lu, H.; Xue, Y.; Li, J.; Li, G.; Mao, Y.; Deng, C.; Li, D. Data-driven planning adjustments of the functional zoning of Houhe National Nature Reserve. Glob. Ecol. Conserv. 2021, 29, e01708. [Google Scholar] [CrossRef]
  22. Yang, J.; Cui, Z.; Yi, C.; Sun, J.; Yang, L. “Tali Glaciation” on Massif Diancang. Sci. China Ser. D Earth Sci. 2007, 50, 1685–1692. [Google Scholar] [CrossRef]
  23. Li, Z.; Duan, X. Comparative Evaluation of Geological Heritage Landscapes in Dali-Cangshan Global Geopark. Chin. J. Urban Environ. Stud. 2022, 10, 2250021. [Google Scholar] [CrossRef]
  24. He, F.; Wu, N.; Dong, X.; Tang, T.; Domisch, S.; Cai, Q.; Jähnig, S.C. Elevation, aspect, and local environment jointly determine diatom and macroinvertebrate diversity in the Cangshan Mountain, Southwest China. Ecol. Indic. 2020, 108, 105618. [Google Scholar] [CrossRef]
  25. Zeng, Y.; Hao, D.; Huete, A.; Dechant, B.; Berry, J.; Chen, J.M.; Joiner, J.; Frankenberg, C.; Bond-Lamberty, B.; Ryu, Y.; et al. Optical vegetation indices for monitoring terrestrial ecosystems globally. Nat. Rev. Earth Environ. 2022, 3, 477–493. [Google Scholar] [CrossRef]
  26. De Simone, L.; Navarro, D.; Gennari, P.; Pekkarinen, A.; de Lamo, J. Using standardized time series land cover maps to monitor the sdg indicator “mountain green cover index” and assess its sensitivity to vegetation dynamics. ISPRS Int. J. Geo-Inf. 2021, 10, 427. [Google Scholar] [CrossRef]
  27. Xie, Z.; Phinn, S.R.; Game, E.T.; Pannell, D.J.; Hobbs, R.J.; Briggs, P.R.; McDonald-Madden, E. Using Landsat observations (1988–2017) and Google Earth Engine to detect vegetation cover changes in rangelands—A first step towards identifying degraded lands for conservation. Remote Sens. Environ. 2019, 232, 111317. [Google Scholar] [CrossRef]
  28. Nitze, I.; Grosse, G. Detection of landscape dynamics in the Arctic Lena Delta with temporally dense Landsat time-series stacks. Remote Sens. Environ. 2016, 181, 27–41. [Google Scholar] [CrossRef]
  29. Yang, H.; Yang, X.; Heskel, M.; Sun, S.; Tang, J. Seasonal variations of leaf and canopy properties tracked by ground-based NDVI imagery in a temperate forest. Sci. Rep. 2017, 7, 1267. [Google Scholar] [CrossRef] [Green Version]
  30. Fichera, C.R.; Modica, G.; Pollino, M. Land Cover classification and change-detection analysis using multi-temporal remote sensed imagery and landscape metrics. Eur. J. Remote Sens. 2012, 45, 1–18. [Google Scholar] [CrossRef]
  31. McGarigal, K. FRAGSTATS: Spatial Pattern Analysis Program for Quantifying Landscape Structure; US Department of Agriculture, Forest Service, Pacific Northwest Research Station: Portland, OR, USA, 1995; Volume 351.
  32. Zhang, S.; Chen, H.; Fu, Y.; Niu, H.; Yang, Y.; Zhang, B. Fractional Vegetation Cover Estimation of Different Vegetation Types in the Qaidam Basin. Sustainability 2019, 11, 864. [Google Scholar] [CrossRef] [Green Version]
  33. Chen, Y.; Hu, X.; Zhang, Y.; Feng, J. Characterizing the Long-Term Landscape Dynamics of a Typical Cloudy Mountainous Area in Northwest Yunnan, China. Sustainability 2022, 14, 13488. [Google Scholar] [CrossRef]
  34. Qiu, S.; He, B.; Zhu, Z.; Liao, Z.; Quan, X. Improving Fmask cloud and cloud shadow detection in mountainous area for Landsats 4–8 images. Remote Sens. Environ. 2017, 199, 107–119. [Google Scholar] [CrossRef]
  35. Tao, Y.; Zhang, W.; Duan, C.; Chen, Y.; Ren, J.; Xing, D.; He, Q. Climatic causes of continuous drought over Yunnan Province from 2009 to 2012. J. Yunnan Univ. Nat. Sci. Ed. 2014, 36, 866–874. [Google Scholar] [CrossRef]
  36. Jin, Y.; Kuang, X.; Yan, H.; Wan, Y.; Wang, P. Studies on Distribution Characteristics and Variation Trend of the Regional Drought Events over Yunnan in Recent 55 Years. Meteorol. Mon. 2018, 44, 1169–1178. [Google Scholar] [CrossRef]
  37. Wang, P.; Cheng, Q.; Jin, H. Divergent vegetation variation and the response to extreme climate events in the National Nature Reserves in Southwest China, 1961–2019. Ecol. Indic. 2023, 150, 110247. [Google Scholar] [CrossRef]
  38. Xia, J.; Cao, M.; Xiao, W.; Li, Y.; Fu, G.; Wang, W.; Li, J. Integrating Spatial Valuation of Ecosystem Services into Protected Area Management: A Case Study of the Cangshan Nature Reserve in Dali, China. Sustainability 2020, 12, 9395. [Google Scholar] [CrossRef]
  39. Tang, M.; Qiu, S.; Liu, L.; Li, T.; Li, S.; Yu, T. Landscape influences and management countermeasures of ginseng planting near Changbai mountain nature reserve. J. For. Res. 2022, 33, 1939–1948. [Google Scholar] [CrossRef]
  40. Zhang, Y.; Yin, H.; Zhu, L.; Miao, C. Landscape Fragmentation in Qinling–Daba Mountains Nature Reserves and Its Influencing Factors. Land 2021, 10, 1124. [Google Scholar] [CrossRef]
  41. Sun, Q.; Liu, W.; Gao, Y.; Li, J.; Yang, C. Spatiotemporal variation and climate influence factors of vegetation ecological quality in the sanjiangyuan national park. Sustainability 2020, 12, 6634. [Google Scholar] [CrossRef]
  42. Gallardo, B.; Aldridge, D.C.; González-Moreno, P.; Pergl, J.; Pizarro, M.; Pyšek, P.; Thuiller, W.; Yesson, C.; Vilà, M. Protected areas offer refuge from invasive species spreading under climate change. Glob. Chang. Biol. 2017, 23, 5331–5343. [Google Scholar] [CrossRef] [PubMed] [Green Version]
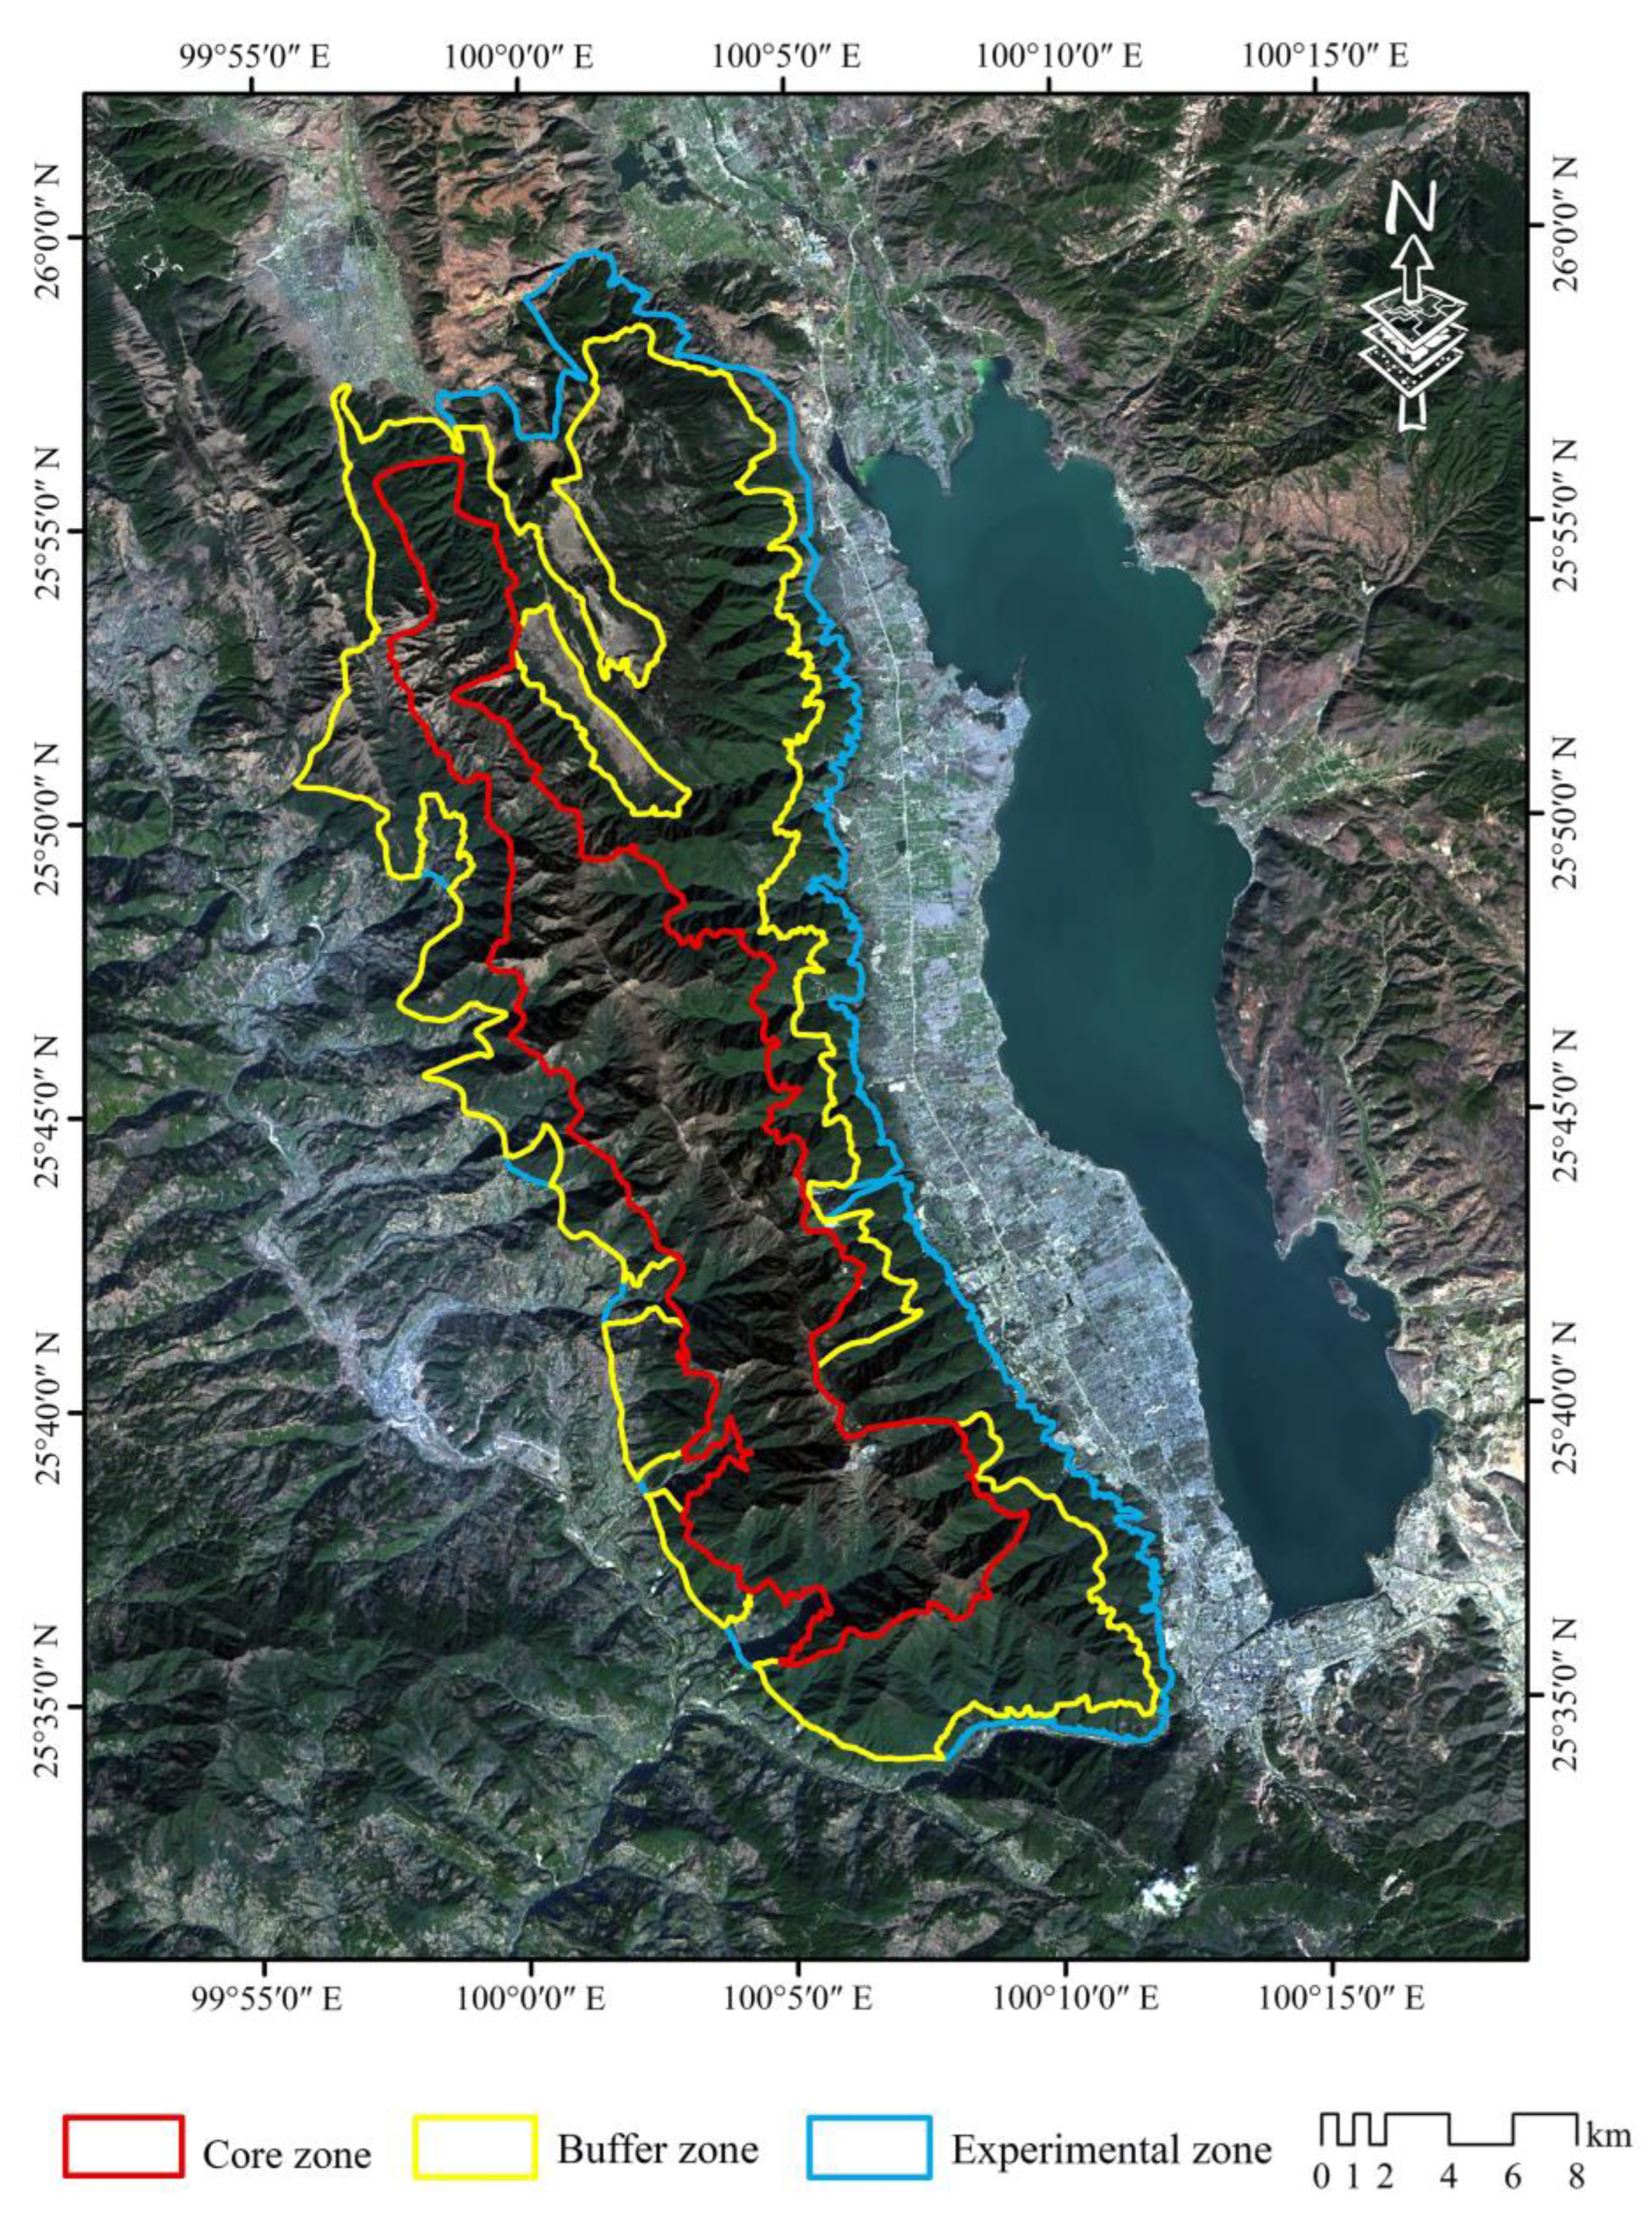
Figure 1. Location and functional zoning of the study area. The boundaries of the core zone, buffer zone, and experimental zone are, respectively, marked in red, yellow, and blue.
Forests 14 01485 g001
Figure 2. Vegetation distribution in the Cangshan mountain from 1987 to 2017.
Forests 14 01485 g002
Figure 3. Vegetation composition at different elevations (in 500 m intervals) on the eastern and western slopes of the Cangshan mountain from 1987 to 2017.
Forests 14 01485 g003
Figure 4. Changes in the distribution areas of different vegetation types from 1987 to 2017.
Forests 14 01485 g004
Figure 5. Landscape transition diagram of the Cangshan mountain from 1987 to 2017.
Forests 14 01485 g005
Figure 6. Vegetation transition diagram within different functional zones from 1987 to 2017.
Forests 14 01485 g006
Figure 7. Changes in patch density for different vegetation types from 1987 to 2017.
Forests 14 01485 g007
Figure 8. The changes of spatial pattern indices at the landscape-level from 1987 to 2017.
Forests 14 01485 g008
Figure 9. Trend of FVC changes. The area of color from green to blue indicates an increasing trend of FVC. Colors closer to blue indicate that the SlopeFVC value is larger and the trend of increasing FVC is more obvious. The area where the color is close to yellow indicates that there is almost no change in FVC. And colors closer to red indicate smaller SlopeFVC values and a more pronounced decreasing trend in FVC.
Forests 14 01485 g009
Figure 10. Changes in area of bare land, built-up land, and farm land between 1987 and 2017.
Forests 14 01485 g010
Table 1. Selected spatial pattern indices and their ecological implication.
IndicesTypeDescription
Class area (CA)Class metricsCA equals the sum of the areas of all patches of the corresponding patch type [31]. It is a measure of landscape composition; specifically, how much of the landscape is comprised of a particular patch type.
Patch density
(PD)
Class metricsPD equals the number of patches of the corresponding patch type divided by total landscape area [31]. An increase in the PD usually indicates an increase in fragmentation.
Landscape shape index
(LSI)
Landscape metricsLSI provides a standardized measure of total edge or edge density that adjusts for the size of the landscape [31].
Contagion index (CONTAG)Landscape metricsContagion is inversely related to edge density [31]. When edge density is very low, contagion is high, and vice versa.
Shannon’s diversity index (SHDI)Landscape metricsSHDI equals minus the sum, across all patch types, of the proportional abundance of each patch type multiplied by that proportion [31].
Table 2. Proportion of five levels of FVC (%).
Periods0 ≤ FVC < 0.20.2 ≤ FVC < 0.40.4 ≤ FVC < 0.60.6 ≤ FVC < 0.80.8 ≤ FVC < 1.0
Cangshan mountain19870.000.024.8735.4459.67
19970.020.563.9017.7977.73
20070.132.617.9324.1565.18
20170.000.000.201.9097.89
Core zone19870.000.076.1534.8358.95
19970.061.608.7020.9068.74
20070.335.3414.5232.2947.52
20170.000.020.493.4796.01
Buffer zone19870.000.013.0831.3865.54
19970.000.081.3815.4083.13
20070.021.244.4320.3074.00
20170.000.000.010.8799.11
Experimental zone19870.000.026.4444.7548.79
19970.000.032.1219.1678.69
20070.041.315.2419.2374.18
20170.000.000.161.7398.11
Disclaimer/Publisher’s Note: The statements, opinions and data contained in all publications are solely those of the individual author(s) and contributor(s) and not of MDPI and/or the editor(s). MDPI and/or the editor(s) disclaim responsibility for any injury to people or property resulting from any ideas, methods, instructions or products referred to in the content.