Article

Tree Skeletonization with DBSCAN Clustering Using Terrestrial Laser Scanning Data

1
School of Computer and Information Technology, Xinyang Normal University, Xinyang 464000, China
2
Henan Engineering Research Center of Internet of Things and Smart Security, Xinyang 464000, China
3
Henan Dabieshan National Field Observation and Research Station of Forest Ecosystem, Zhengzhou 450046, China
4
Xinyang Academy of Ecological Research, Xinyang 464000, China
5
College of Forestry, Beijing Forestry University, Beijing 100083, China
6
School of Mathematics and Statistics, Xinyang Normal University, Xinyang 464000, China
*
Author to whom correspondence should be addressed.
Forests 2023, 14(8), 1525; https://doi.org/10.3390/f14081525
Submission received: 13 June 2023 / Revised: 6 July 2023 / Accepted: 25 July 2023 / Published: 26 July 2023

Abstract

:
A tree skeleton reflects the geometric and structural characteristics of a tree. Terrestrial laser scanning (TLS) provides an effective means to construct tree skeletons that can capture the surface and topological features of trees. However, it is difficult to construct a tree skeleton located at the geometric centre of the tree with a detailed hierarchy of branches because of the natural intricate topology of the tree and the defects of the tree point cloud scanned by TLS. In this study, we presented a tree-skeletonization method based on density-based spatial clustering of applications with noise (DBSCAN) using TLS data. First, outliers were removed using DBSCAN, and the point-traversal order of each point was recorded. Next, a tree point cloud was divided into several tree slices using contour planes, and several tree segments were obtained by applying DBSCAN to each tree slice. Tree skeleton points were retrieved from each tree segment after the point-inversion transformation. Then, the adjacent relationship between skeleton points and the flow weight of each skeleton point was calculated based on the point-traversal order. After that, the skeleton points were classified into stems and different levels of branch points using the flow weights of the skeleton points, and the branch hierarchies were identified. Finally, the tree skeleton was optimized using the angle consistency. The positional deviation d p and directivity deviation d d were presented in this study to verify the validity of the constructed tree skeleton. From the visualization results, the constructed tree skeleton effectively reflected the geometrical structure and branch hierarchies of the tree. The averages of d p and d d were 0.418 cm and 8.474 degrees, respectively. The results demonstrated the validity of the presented method. It will help improve the visualization and accurate measurement of trees.

1. Introduction

1.1. Background

Trees are common and vital objects with complex geometric structures in the natural environment. Tree geometry modelling is beneficial to related fields, such as tree modelling for parameter retrieval in forest inventory [1,2], tree morphology representation in computer graphics, and digital urban planning management [3,4]. A tree skeleton is a kind of tree geometry model that is usually represented by points and line segments connecting the points. It represents the topology and geometry of a tree [5] and contains the essential data for three-dimensional (3D) tree model reconstruction with interconnected 3D geometries [6]. Tree skeletonization has attracted the attention of many researchers because of its simplicity and effectiveness. However, it is a challenge to construct a tree skeleton consistent with the actual geometry and composition of the tree, as the tree and its branches have naturally complex topologies [4,7].
In recent years, terrestrial laser scanning (TLS) can be used to obtain 3D geometric data of an object’s surface and can store the data as a point cloud. As a millimetre-level measurement tool, TLS can provide an accurate approach for nondestructively acquiring 3D tree structural attributes [8,9], which opens up the possibility of constructing detailed tree skeleton models. However, due to the complexity of the tree geometry structure and the defects of the tree point cloud scanned with TLS, most of the existing methods focus on the geometric topological structure of the tree and do not consider the composition characteristics of the tree. In this study, we focus on these two aspects and present a tree-skeletonization method that can construct an accurate tree skeleton with detailed composition information.

1.2. Related Work

Many studies have focused on the construction of tree skeletons using TLS data. Ref. [10] optimized a branch-structure graph similar to an input point cloud to represent a tree skeleton. Ref. [11] segmented the cylindrical components and ramified regions based on the variational k-means clustering algorithm and then extracted a skeleton based on an adjacency graph built from the neighbourhood information of the components. Finally, a B-spline surface representation was used to represent the tree. Ref. [12] reduced the tree graph extracted from an octree organization of a tree point cloud to the tree skeleton. Ref. [13] segmented the tree branches and estimated the tree skeleton vertices based on the estimated neighbour domain and normal vector and then used a single-source path to construct a skeleton graph of tree skeleton vertices. The smoothing tree curve skeleton was obtained by utilizing the cubic Hermite curves. Ref. [14] trained a neural network to generate a series of cylinders to represent the tree geometry under the assumption that the local shape of branches is cylindrical. Ref. [4] first contracted 3D tree-shaped point clouds to a graph as an initial skeleton by minimizing the sum of the graph geodesic distances of the k-nearest geodesic neighbours and a topology term for preventing point clouds from shrinking in the local principal direction. They then connected the skeleton points using the confidence of the distance and the included angle of the principal directions. Ref. [5] filtered noise and identified bifurcations using density-based spatial clustering of applications with noise (DBSCAN) and then extracted a tree skeleton using space colonization. Ref. [15] presented a fast tree skeleton extraction method that improved the skeleton connectivity and completeness with a breakpoint connection after extracting a raw tree skeleton using tree voxel thinning. The above studies achieved satisfactory results; however, there are some issues worthy of attention, such as the centre location of skeleton points, the category of skeleton points, and branch-level category determination.
The difficulty of tree skeletonization lies not only in the complexity of tree topology but also in the defects of the tree point clouds scanned with TLS. The mutual occlusion of branches and leaves makes the tree point cloud uneven, incomplete, and noisy. The complexity of the tree topology and the defects of the tree point cloud are exactly where the advantages of the DBSCAN algorithm can be exerted. In this study, we present a tree skeletonization method using DBSCAN to extract tree skeletons, which are represented by points and line segments with category labels. The specific objectives are (1) to accurately calculate tree skeleton points using the inner points of a tree, (2) to classify skeleton points and to identify the branch hierarchies of a tree, (3) to construct a tree skeleton located at the geometrical centre with detailed branch hierarchy information, and (4) to present the positional deviation and directivity deviation for evaluating a tree skeleton in the absence of ground truth.

2. Materials and Methods

2.1. Field Data Collection and Processing

Scanning was performed in a planted poplar plantation plot in Luoshan County, Henan Province, China. The trees were scanned from nine TLS stations (stand centre, four corners, and centre of each border) using FARO X330. The scan quality was 4× (a scanning parameter of the FARO TLS scanner), the scan speed was 122 kpts/s, the point spacing was 6.136 mm at 10 m, and reference spheres were used for registration. Point cloud registration was performed using FARO Scene software (Figure 1). Afterwards, the tree points were extracted according to the continuity of the stem in the vertical direction [16]. Ten trees were extracted from the scanned plot, and their average stem diameter at breast height was 19.29 cm.
The presented method was implemented using C++ with the Point Cloud Library [17], Qt and VTK. The experimental results were obtained on a computer with Intel i7-8700K, 3.70 GHz CPU, 32 GB memory, and a 64-bit Windows 10 operating system.

2.2. DBSCAN

The core idea of DBSCAN [18] is that a point belongs to a cluster if it is close to many points of that cluster. Two points are considered neighbours if the distance between them is less than or equal to e p s , and m i n P t s specifies the minimum number of points to define a cluster. A core point is a point that has at least m i n P t s points (including itself) in its neighbourhood based on e p s . A border point is a point reachable from a core point and that has fewer than m i n P t s points in its neighbourhood. A point is noise if it is not a core point and not reachable from any core points.
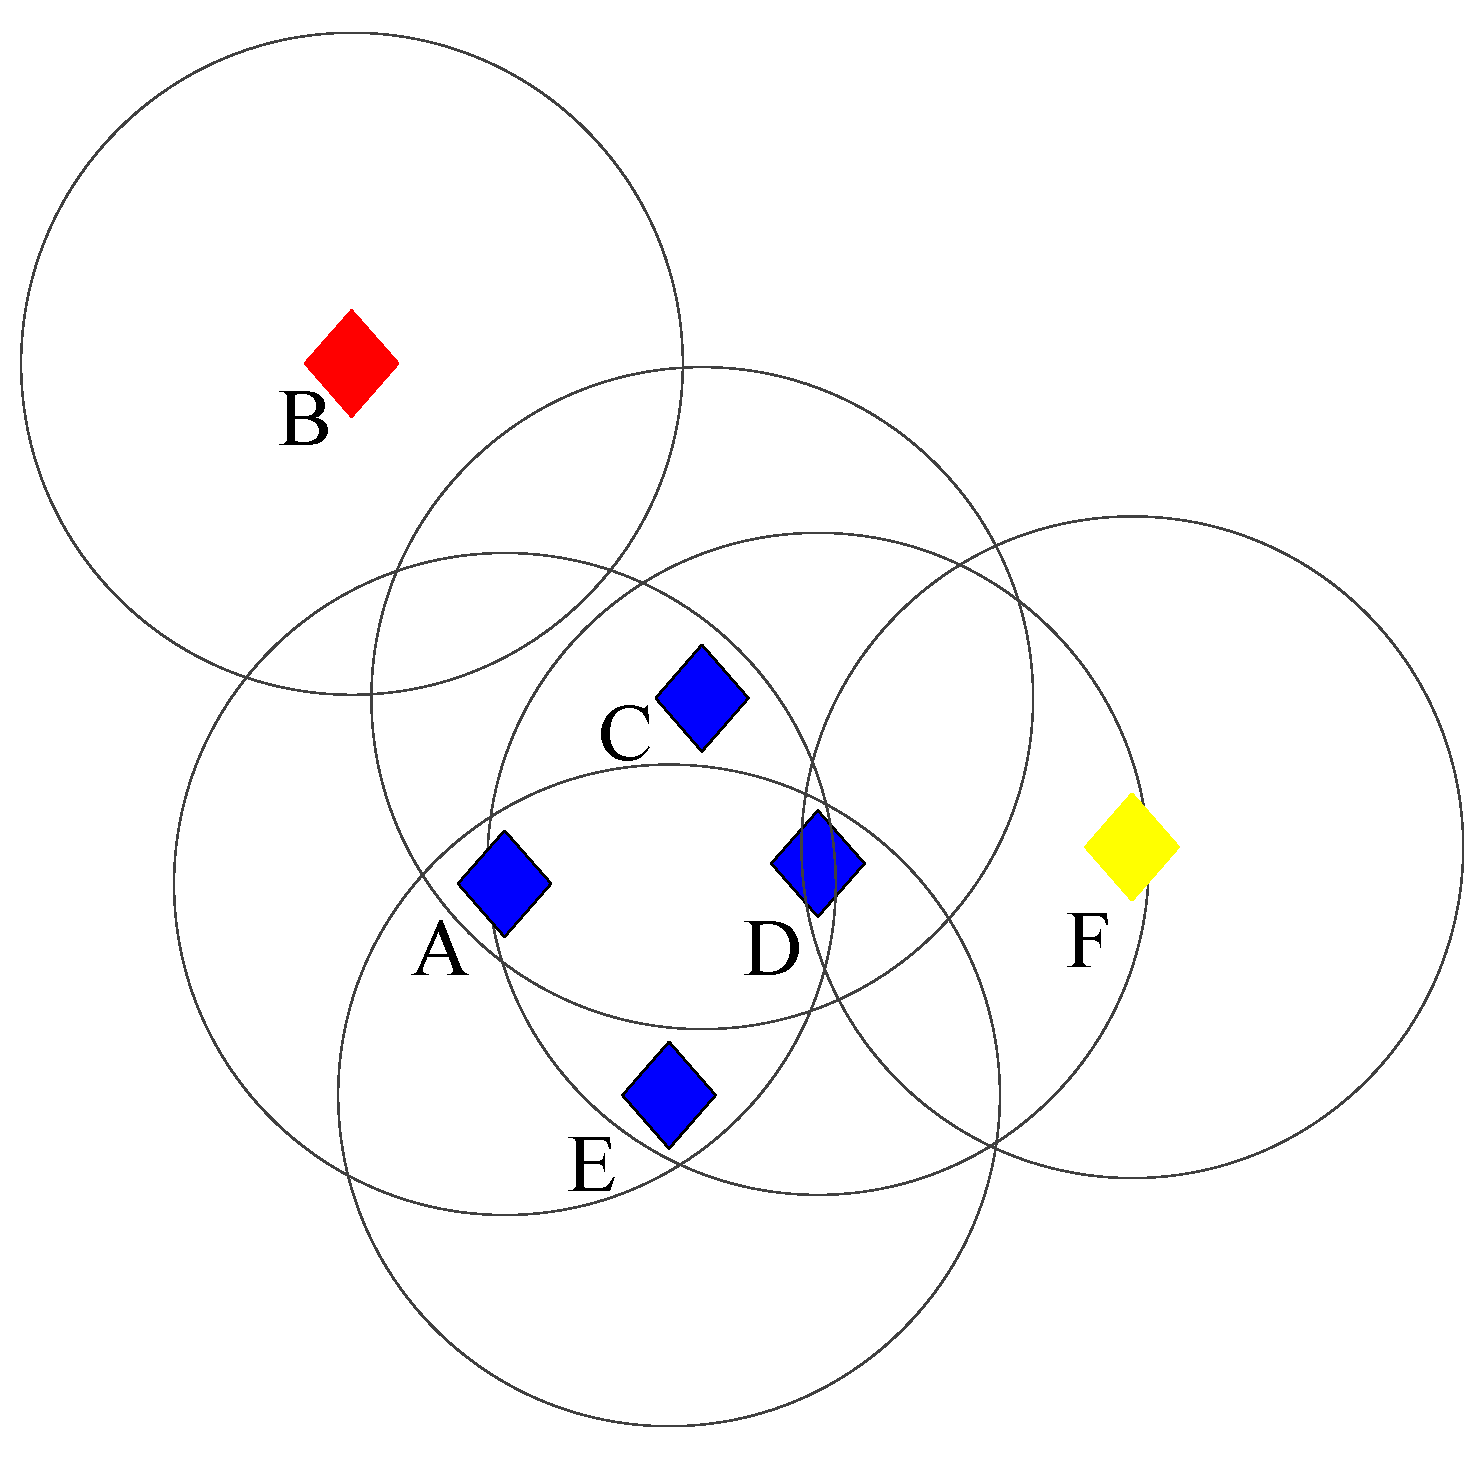
Each point needs to be traversed to calculate the number of neighbouring points in the process of clustering. After a point has been traversed, its neighbourhood points can be traversed to complete the discovery of a cluster. In this study, the point-traversal order is calculated as follows. Once a point is directly traversed, that is, not from the neighbours of other points, its predecessor is itself. Moreover, the predecessor of its neighbour point whose predecessor has not been set is the current point. For example, in Figure 2, if point A is first traversed, that is, directly traversed, the predecessor of A is A, and the predecessor of C, D, and E is A. When D is traversed, the predecessor of C, A, and E remains unchanged, and the predecessor of F is D.

2.3. Tree-Skeletonization Method

2.3.1. Outlier Removal and Recorded Traversal Order

Due to mutual occlusion and breeze disturbances, a tree point cloud scanned with TLS has the following defects: the density of the tree point cloud is very uneven, outliers are distributed throughout the tree point cloud, and some discontinuous points exist in the tree point cloud. To eliminate these effects, outliers and discontinuous points were first removed using DBSCAN.
The tree point cloud was clustered using DBSCAN with the parameters e p s and m i n P t s using a bottom-up approach. Clustering started from the lowest point of the Z axis and gradually expanded in ascending order of the Z axis. In the clustering process, the point-traversal order of each point was recorded. The cluster with the largest number of points was chosen as the major tree point cloud and the other clusters and noise were removed.

2.3.2. Tree Slice and Segment Generation

In this study, the tree skeleton points were mainly obtained from tree segments, which were the clustering result from tree slicing applied to the major tree point cloud.
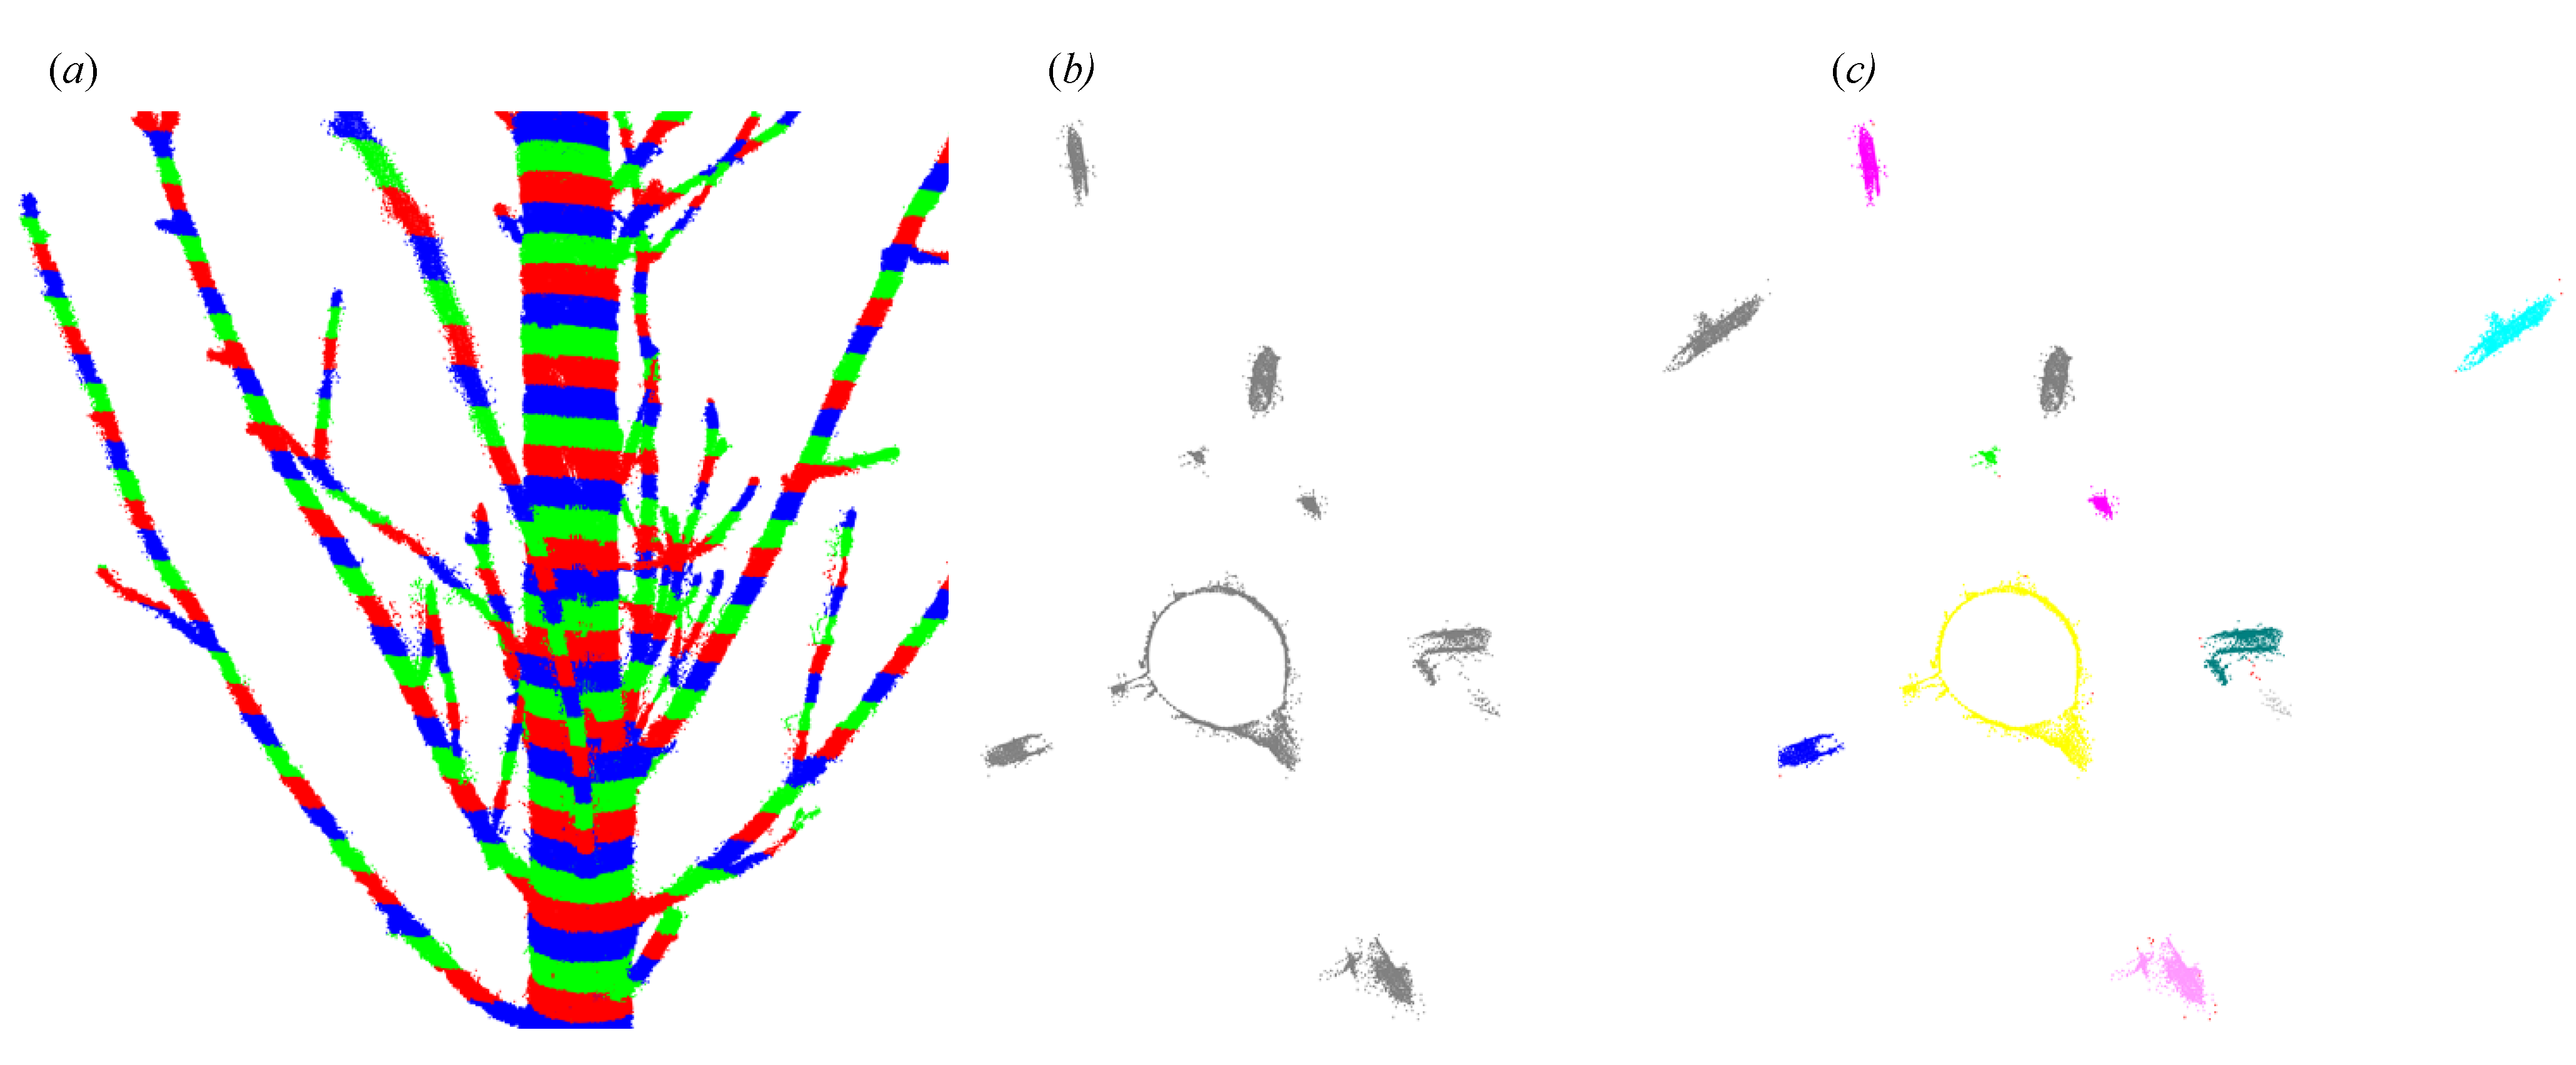
Tree slicing is similar to the stem slice partitioning in [19]. In this study, each tree slice is formed by two contour planes, and the distance between the two planes is h cm. Then, m (Formula (1)) tree slices are obtained (Figure 3a), and each tree slice contains one region or several unconnected regions (Figure 3b). Then, each tree slice is clustered using DBSCAN with parameters e p s and m i n P t s . In the clustering result, a slice consists of several clusters and noise, and a cluster is a tree segment (Figure 3c).
m = z m a x z m i n h
where z m a x and z m i n are the maximum and minimum values of the z-axis of the major tree point cloud, respectively.

2.3.3. Tree Skeleton Point Calculation with Point-Inversion Transformations

Each tree segment represents a component of the tree. Therefore, each tree segment is abstracted to a tree skeleton point. Similar to the geometric central point calculation in [20], a tree skeleton point of each tree segment is the centroid of the convex polygon that is formed from the planar projection point set, which is the resultant point set of the tree segment points projecting onto its lower contour plane. However, the irregular shape of the tree segment at the joint part of the stem and the branch causes a positional deviation of the centroid point of the polygon. The tree segment in Figure 4b is the segment coloured yellow in Figure 3c. The centroid of the stem segment in Figure 4b is not in the centre of the stem due to the influence of branch points.
Naturally, a point closer to the centre of the tree segment is preferred as a skeleton point. To ensure that a point close to the centre is used, the point-inversion transformation is used in this study. For a tree segment stem point set P, the centre of inversion o is the centroid of the convex polygon of the tree segment stem point set, and the radius of inversion r is the radius of the tree segment calculated by the closure Bézier curve fitting with global convexity [21]. The inverse of point p is the unique point p on the ray starting from o and passing through p and it satisfies Formula (2).
o p · o p = r 2
Then, the inverse point set P of P is obtained (denoted by red points in Figure 4c), and the convex hull points of the inverse point set P are calculated. According to the corresponding relationship between P and P , several points in P corresponding to the convex hull points of P are chosen and used to form a polygon (denoted by the blue polygon in Figure 4d). The centroid of the polygon is the tree skeleton point in this study (denoted by the blue diamond point in Figure 4d). It is obvious that the centroid after the point-inversion transformation is closer to the centre of the segment than the centroid before the point-inversion transformation.

2.3.4. Adjacent Relationship Construction

According to the point-traversal order of the major tree point set extracted in Section 2.3.1, the adjacent relationship between tree skeleton points can be easily extracted by voting. If the predecessor points of most points in tree segment S 2 are in tree segment S 1 , the parent of S 2 is S 1 , that is, the parent of the skeleton point of S 2 is the skeleton point of S 1 . Based on this, the adjacent relationships between tree skeleton points, that is, the parent–child relationships, are constructed. Obviously, a skeleton point has only one parent and at least one child. The bottom-up approach of major tree point set extraction ensures the integrity and correctness of the constructed adjacent relationship.

2.3.5. Skeleton Point Classification and Branch Hierarchy Identification

After adjacent relationship construction, the flow weights of the tree skeleton points are calculated as follows. The flow weight of a skeleton point is the sum of the number of its children and the sum of the flow weights of all its children. If a skeleton point has no child, the flow weight of the skeleton point is zero (as shown in Figure 5).
Obviously, the point with the largest flow weight must be the lowest tree skeleton point, i.e., the root point of the constructed tree skeleton. From the root, the point type of a point, i.e., a stem skeleton point or branch skeleton point, is classified as follows. If a point has only one child, the type of the child is equal to the type of the point. If a point has more than one child, the type of the child whose weight is closest to the weight of the point is equal to the type of the point, and the types of all the other children are equal to the point’s type plus one (the type of the stem skeleton point plus one is the type of the first-level branch point, the type of the first-level branch point plus one is the type of the secondary branch point, and so on). If the weights of the two children points are the same and both are closest to the parent’s weight, a child is selected so that the angle formed by the child’s growth direction and the parent’s growth direction is the smallest, the selected child’s point type is equal to its parent’s point type, and the point types of all the other children are equal to its parent’s point type plus one. The growth direction of a tree skeleton point here is a vector formed by its coordinate minus its parental coordinate.
Based on the point type of a point, the procedure of branch hierarchy identification is as follows. The skeleton lines connected with stem skeleton points are the stem skeleton, the skeleton lines connected with a stem skeleton point and a first-level branch point or connected with first-level branch points are the first-level branch, and so on (Figure 5).

2.3.6. Tree Skeleton Optimization

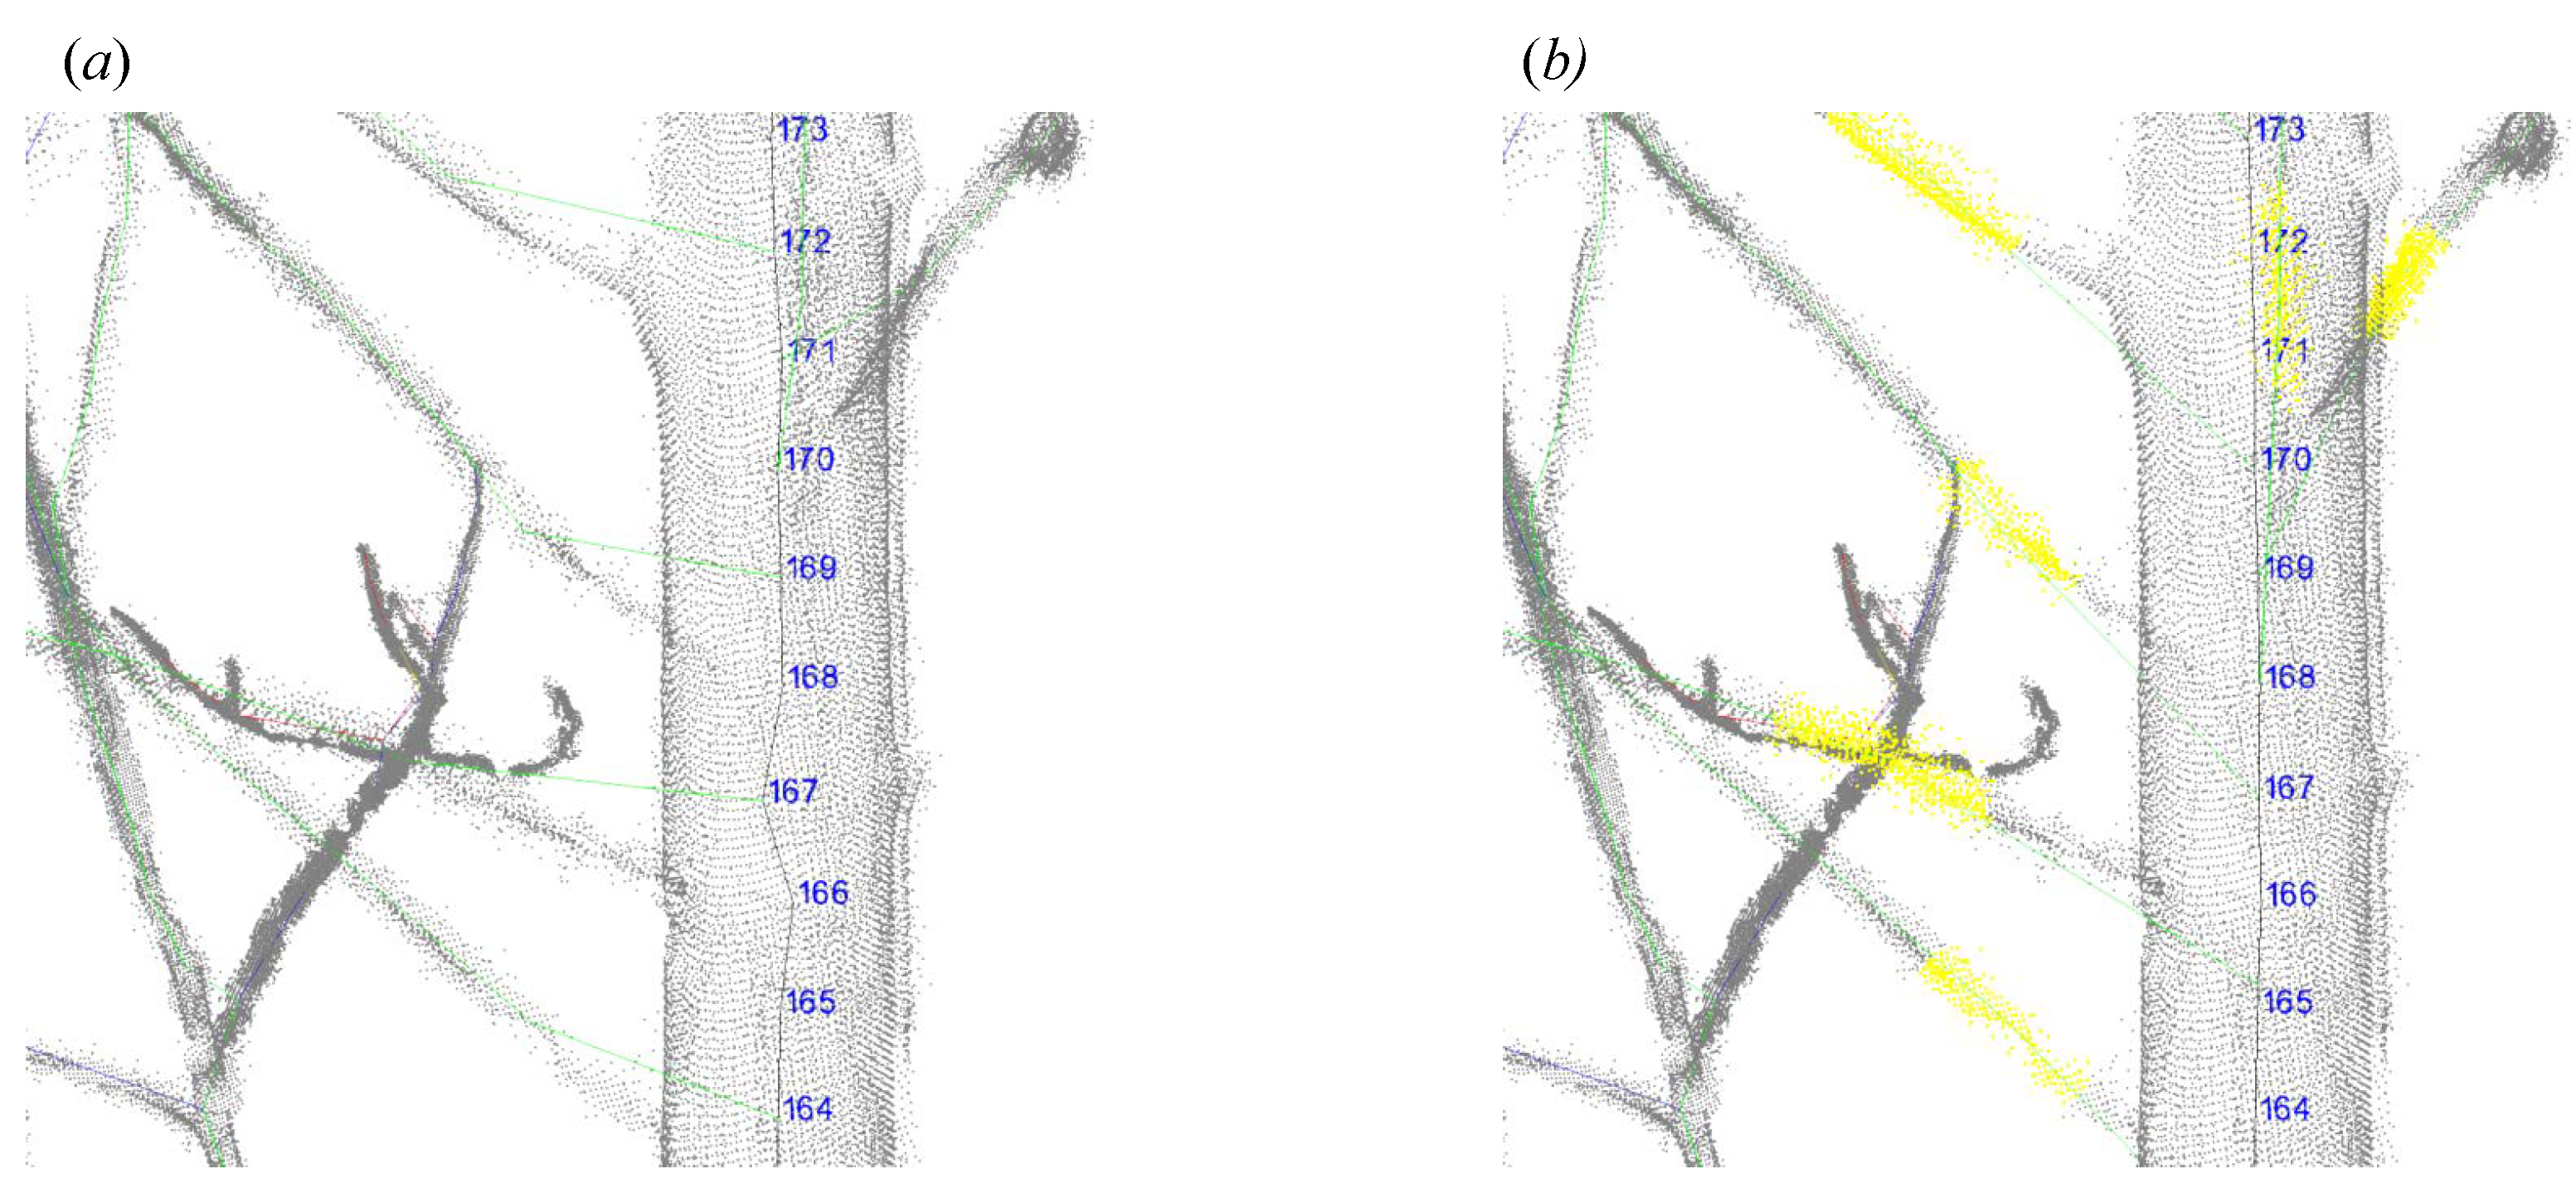
Affected by missing TLS data, especially in the middle and upper regions of the tree, the calculated skeleton point may deviate from the centre of the stem segment (as shown by the black skeleton lines of the tree-slice index of 166 and 167 in Figure 6a). Furthermore, the joints of the stem and first-level branches are usually in the same cluster. This causes the direction between the stem and first-level branches to be inaccurate (denoted by the yellow skeleton lines of the slice index of 164, 167, 169 and 172 in Figure 6a). Therefore, some tree skeleton points need to be optimized to ensure angle consistency. In this study, the optimization consists of three processes in turn: position optimization of the stem skeleton point, position optimization of the joint point between the stem and first-level branches, and position optimization of the branch skeleton point.
The aim of position optimization of the stem skeleton point is for the stem growth direction calculated by the constructed stem skeleton to be consistent with the actual stem growth direction. If the included angle at a stem skeleton point (the three points involved in the calculation are the stem skeleton points, as denoted by A B C in Figure 5) is smaller than 165 degrees, the stem skeleton point needs to be repositioned to match the actual growth direction. According to the relative stability of the growth direction of the stem for a small length (no larger than 30 cm in this study), the new position was along the local stem growth direction and at a distance h cm from its parent stem skeleton point. The local stem growth direction is calculated from the k consecutive ancestors of the repositioned stem skeleton point using principal component analysis (PCA) [19]. This optimization approach is a bottom-up approach, which can ensure the correctness of the stem growth direction.
The aim of position optimization of the joint point is to make the angle between the stem and a first-level branch from the constructed tree skeleton consistent with the actual angle between the stem points and points of the first-level branch. Based on the adjacent relationship construction in Section 2.3.4, the joint point between the stem and a first-level branch is a stem skeleton point. The growth direction of a first-level branch is the eigenvector corresponding to the largest eigenvalue using PCA for selected points with a distance of h cm from the first point of the first-level branch (represented by yellow points in Figure 6b). The new position of the joint point is in the stem skeleton for which the angle between the growth direction of the first-level branch and the vector (the first point of the first-level branch minus the repositioned joint point) is the smallest. This optimization approach is a bottom-up approach and is executed after position optimization of the stem skeleton point.
The aim of position optimization of the branch skeleton point is the same as that of stem skeleton point optimization. Branches have more complex geometries than stems, and branches may have relatively large bends in a short segment, especially in the last-level branches. For a branch skeleton point, if its included angle (denoted by D E F in Figure 5) is less than 120 degrees and the absolute value of the difference between its included angle and its parent’s included angle is larger than 60 degrees, the position of the branch skeleton point is optimized, and the optimization approach is the same as the position-optimization approach for the stem skeleton point.
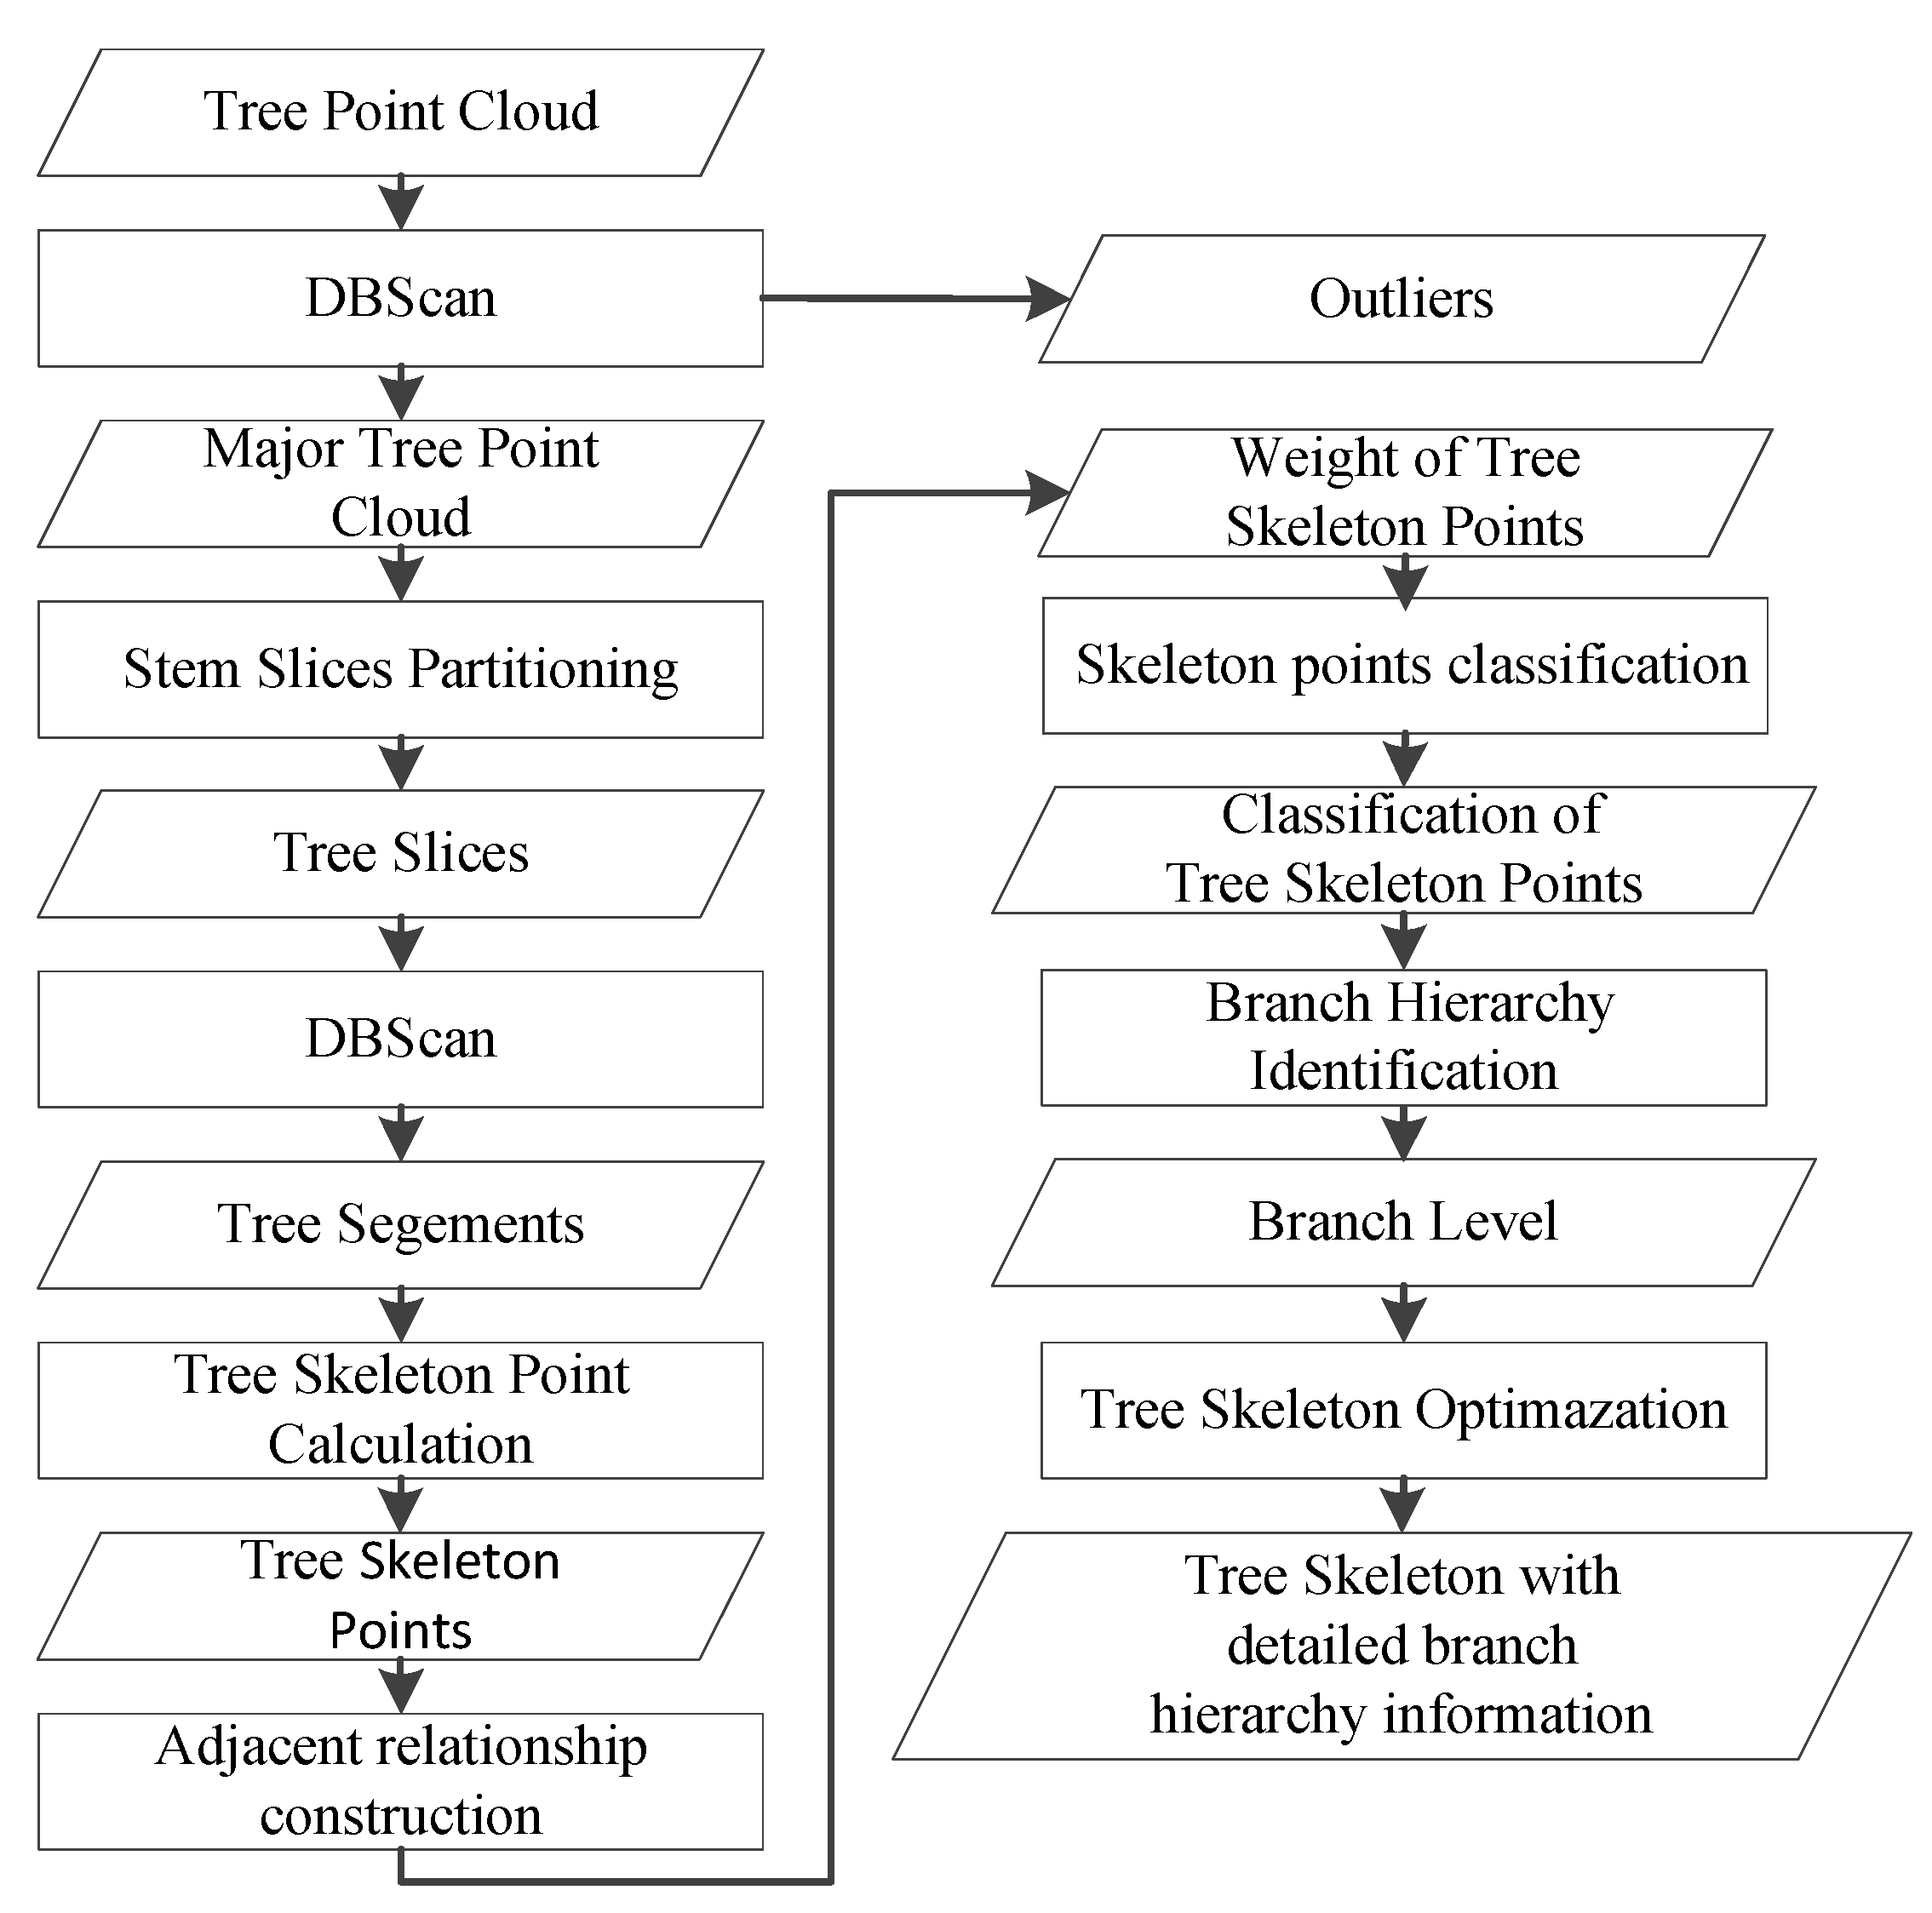
Based on the above, a flowchart of the presented tree-skeletonization method is shown in Figure 7.

2.4. Assessment Indices

For artificially synthetic tree point clouds with a ground-truth skeleton, the Hausdorff distance [22] and the Chamfer distance [23], which are calculated between the extracted tree skeleton and the ground-truth tree skeleton, can be used to perform quantitative assessments. However, the ground-truth tree skeleton is unknown, as the tree point cloud is scanned using TLS in this study. The root mean square error ( R M S E ) and R 2 of the branch angle, tree skeleton length, and branch length are used to quantitatively assess the accuracy of the skeleton [5]. However, the height of the branch is more than 10 m in this study, and it is difficult to measure the branch angle and branch length at this height for standing trees.
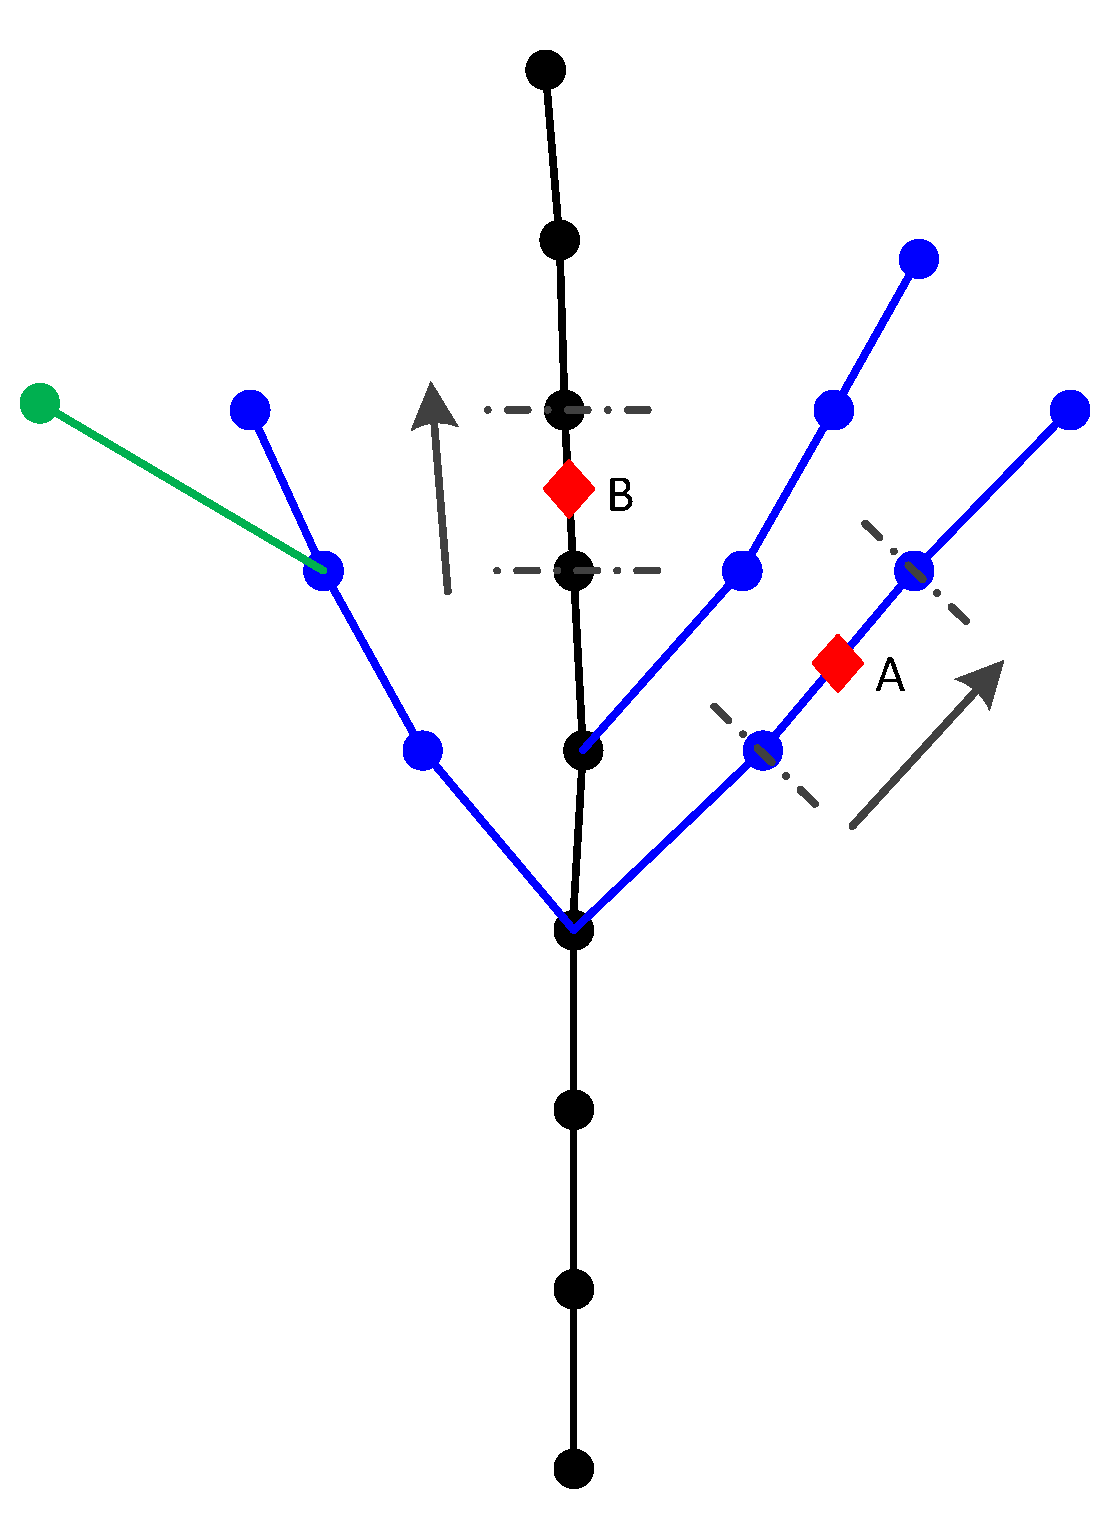
The extracted tree skeleton should be located at the centre of the tree point cloud, and the direction between two adjacent tree skeleton points should be consistent with the growth direction of the current tree part: stem or branch. Therefore, the two indices are presented to evaluate the accuracy of the extracted tree skeleton in this study. (a) The positional deviation d p of the tree skeleton (Formula (3)) is the distance between the median point of two adjacent tree skeleton points p i and p i + 1 and the centroid of the constructed tree segment p i , c , which is between the two planes formed by the two adjacent tree skeleton points with its direction (denoted by the zone between the two dotted lines in Figure 8). (b) The directivity deviation d d of the tree skeleton (Formula (4)) is the included angle p i + 1 p i between the direction of the two adjacent tree skeleton points p i and p i + 1 (denoted by the black arrows in Figure 8) and the growth direction of the constructed tree segment p i , g . It is obvious that the smaller the location deviation and the direction deviation are, the higher the accuracy of the extracted tree skeleton.
d p = p i + p i + 1 2 p i , c
d d = < p i + 1 p i , p i , g >
In this study, the difference d H between the tree skeleton height and the tree point cloud height and the maximum, minimum, and average of d p and d d are used as quantitative assessments for a constructed tree skeleton. Then, the maximum m a x d p , minimum m i n d p , and average a v g d p of d p and the maximum m a x d d , minimum m i n d d , and average a v g d d of d d for all constructed tree skeletons are used to evaluate the performance of the presented tree-skeletonization method in this study. The growth direction of the constructed tree segment is calculated using PCA, which is closely related to the point distribution. Therefore, the two indices d p and d d are calculated based on the tree skeleton points that have only one child skeleton point.

3. Results

3.1. Results of the Constructed Tree Skeleton with Four Groups of Parameter Values

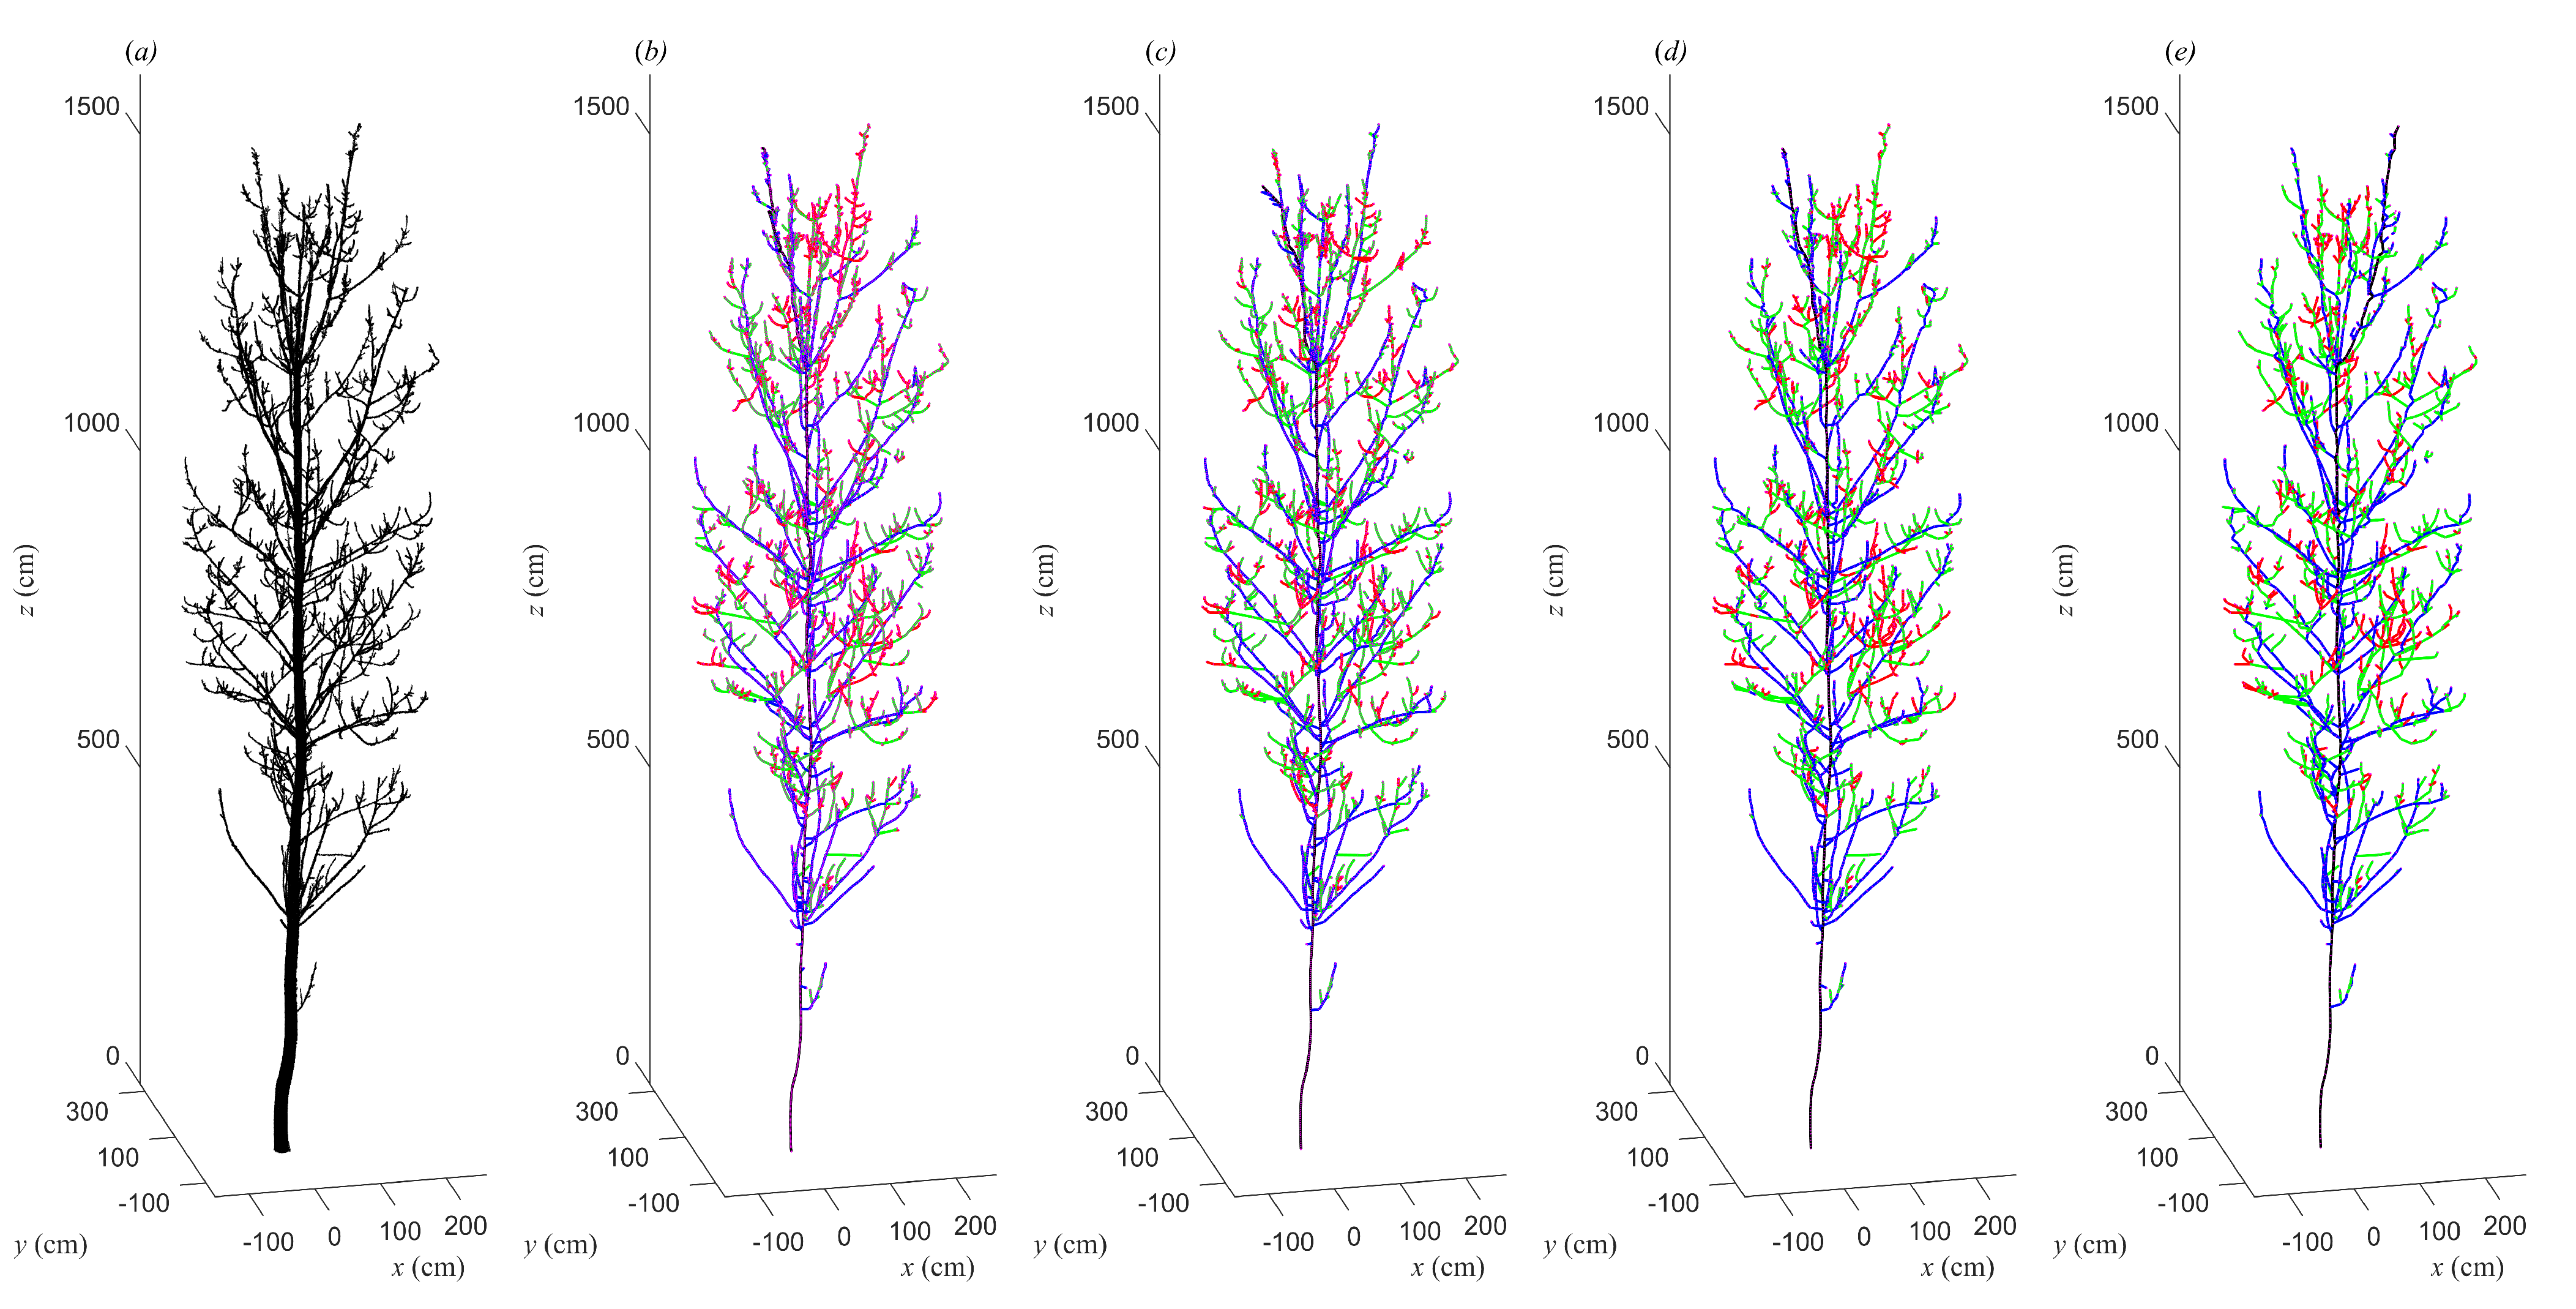
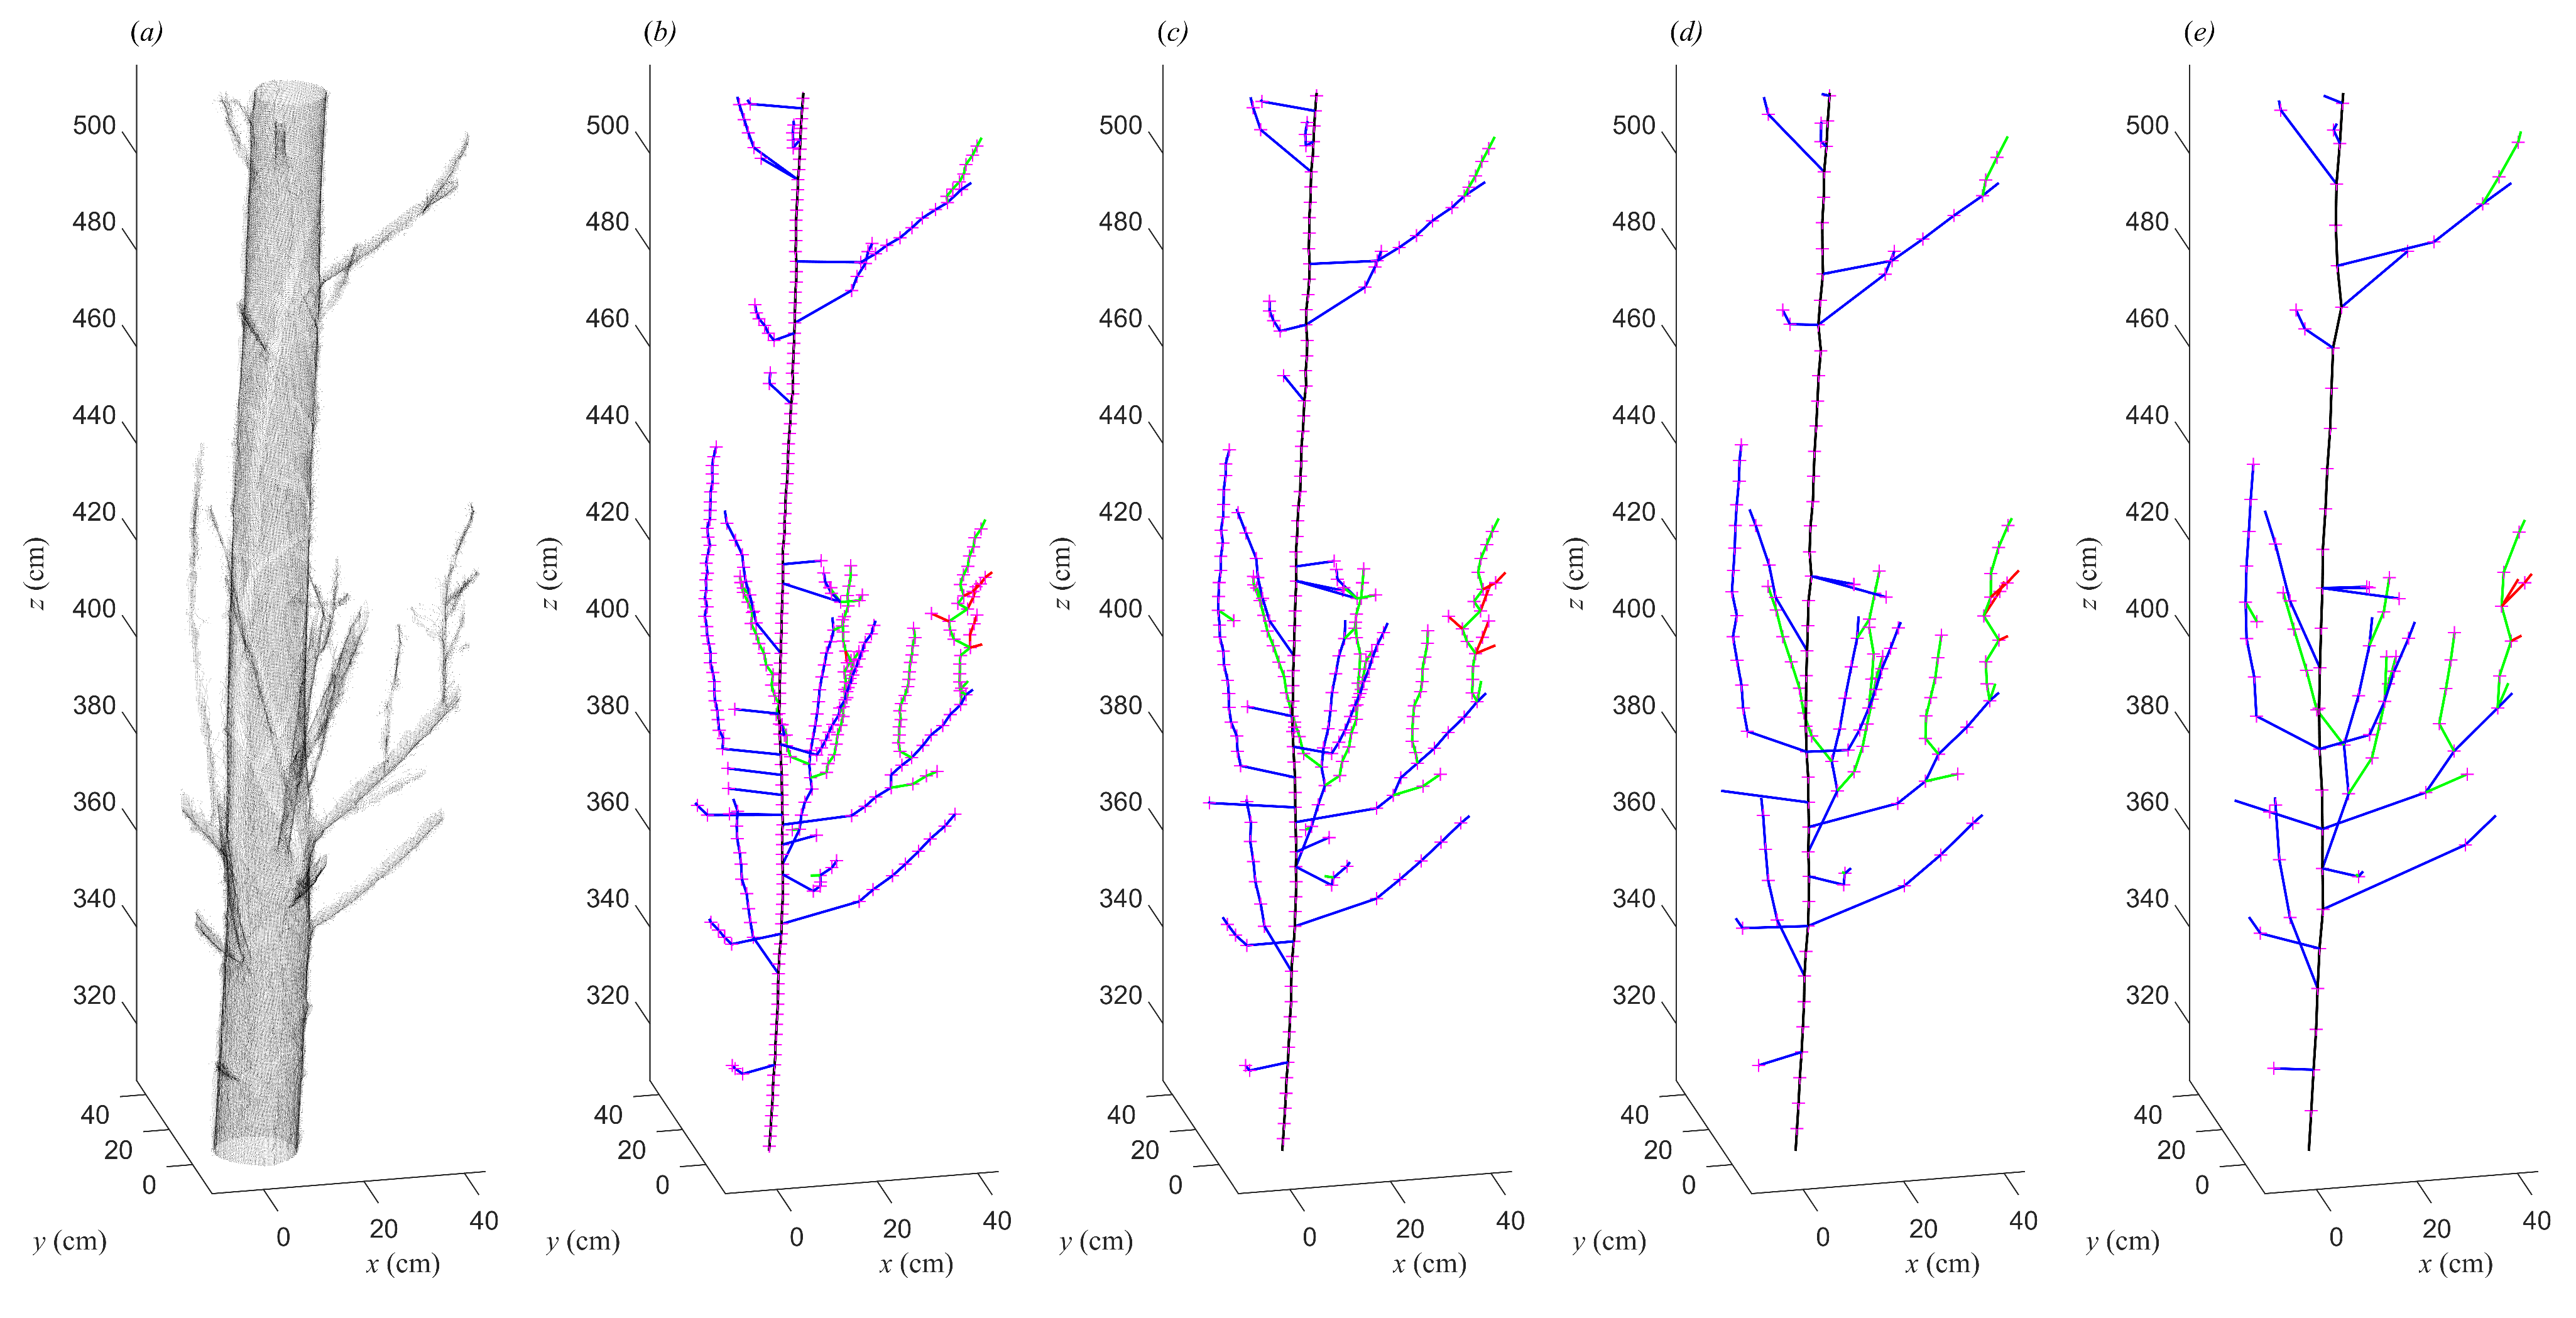
There are four parameters in the presented method: e p s and m i n P t s for the DBSCAN method, h for tree slicing, and k for local stem growth direction calculation. The more tree skeleton points there are, the finer the tree skeleton. In this study, a tree segment generates a skeleton point. In other words, the smaller the value of h is, the denser the skeleton points. Tree skeleton optimization is based on the local growth direction of the tree using PCA, which requires at least three skeleton points. Furthermore, the calculation of the local growth direction should be calculated on a tree segment whose length is not greater than 30 cm. This means that k 3 and the value of k × h should be less than 30 cm in this study. The purpose of the DBSCAN algorithm is to cluster and determine the order relationship between points. For a tree point cloud, the values of e p s and m i n P t s should maximize the number of major tree point clouds and should be constant. In this study, four group parameters of h and k were used for the experiments. The numerical results of the assessment indices are shown in Table 1. The average values of the assessment indices are shown in Table 2. The visualization effects of the four groups of parameters of a tree point cloud are shown in Figure 9 and Figure 10.
According to Table 1 and Table 2, the number of skeleton points increases as h decreases, i.e., the parameter h can control the fineness of the tree skeleton. The height error between the tree height and skeleton height decreases as h decreases. The maximum, minimum, and average values of the height error are 0.119, 0.016, and 0.053 metres, respectively. This demonstrates that the height of the constructed tree skeleton is close to the height of the tree point cloud. The assessment index values based on d d demonstrate that most of the tree skeleton points are very close to the centre points, there is indeed a certain degree of deviation between the skeleton point and the geometric centre point of the tree, and the deviation is not significantly affected by the parameters, which are related to the geometric topology of the tree. The assessment index values based on d p demonstrate that there is an angular deviation between the local growth direction calculated from the skeleton and the local growth direction calculated from the tree point cloud, and the angular deviation tends to increase as h decreases. The values of m a x d p are approximately 50 degrees, and most of the values of a v g d p are below 10 degrees, which means that there are few large angular deviations. The average height error and a v g d d increase as h increases, and there is no obvious relationship between the other indices and h. Based on the above, although the maximum values of d d and d p are slightly high, the average values of d d and d p are satisfactory.
From Figure 9, the constructed tree skeletons with different parameters are almost replicas of the tree point cloud and can effectively reflect the geometric structure characteristics of the tree point cloud. The difference is that the smaller h is, the denser the skeleton points and the richer the details.
From Figure 10, the partially enlarged views clearly show the effect of different parameters on skeleton construction. The rich details are reflected not only in the additional branch skeletons, but also in the more delicate shapes of the branches. The number of skeleton points decreases as h increases, and the complexity of the displayed tree structure is weakened. Notably, the more skeleton points there are, the less smooth the tree skeleton, and the larger the included angle. This is consistent with the numerical results that the angle deviation tends to increase as h decreases. Based on the above results, the presented tree-skeletonization method can control the density of skeleton points through parameters, thereby controlling the output quality of the skeleton. However, this does not mean that the more skeleton points there are, the better the tree skeleton quality.

3.2. Visualizations of Four Constructed Tree Skeletons with a Group of Parameter Values

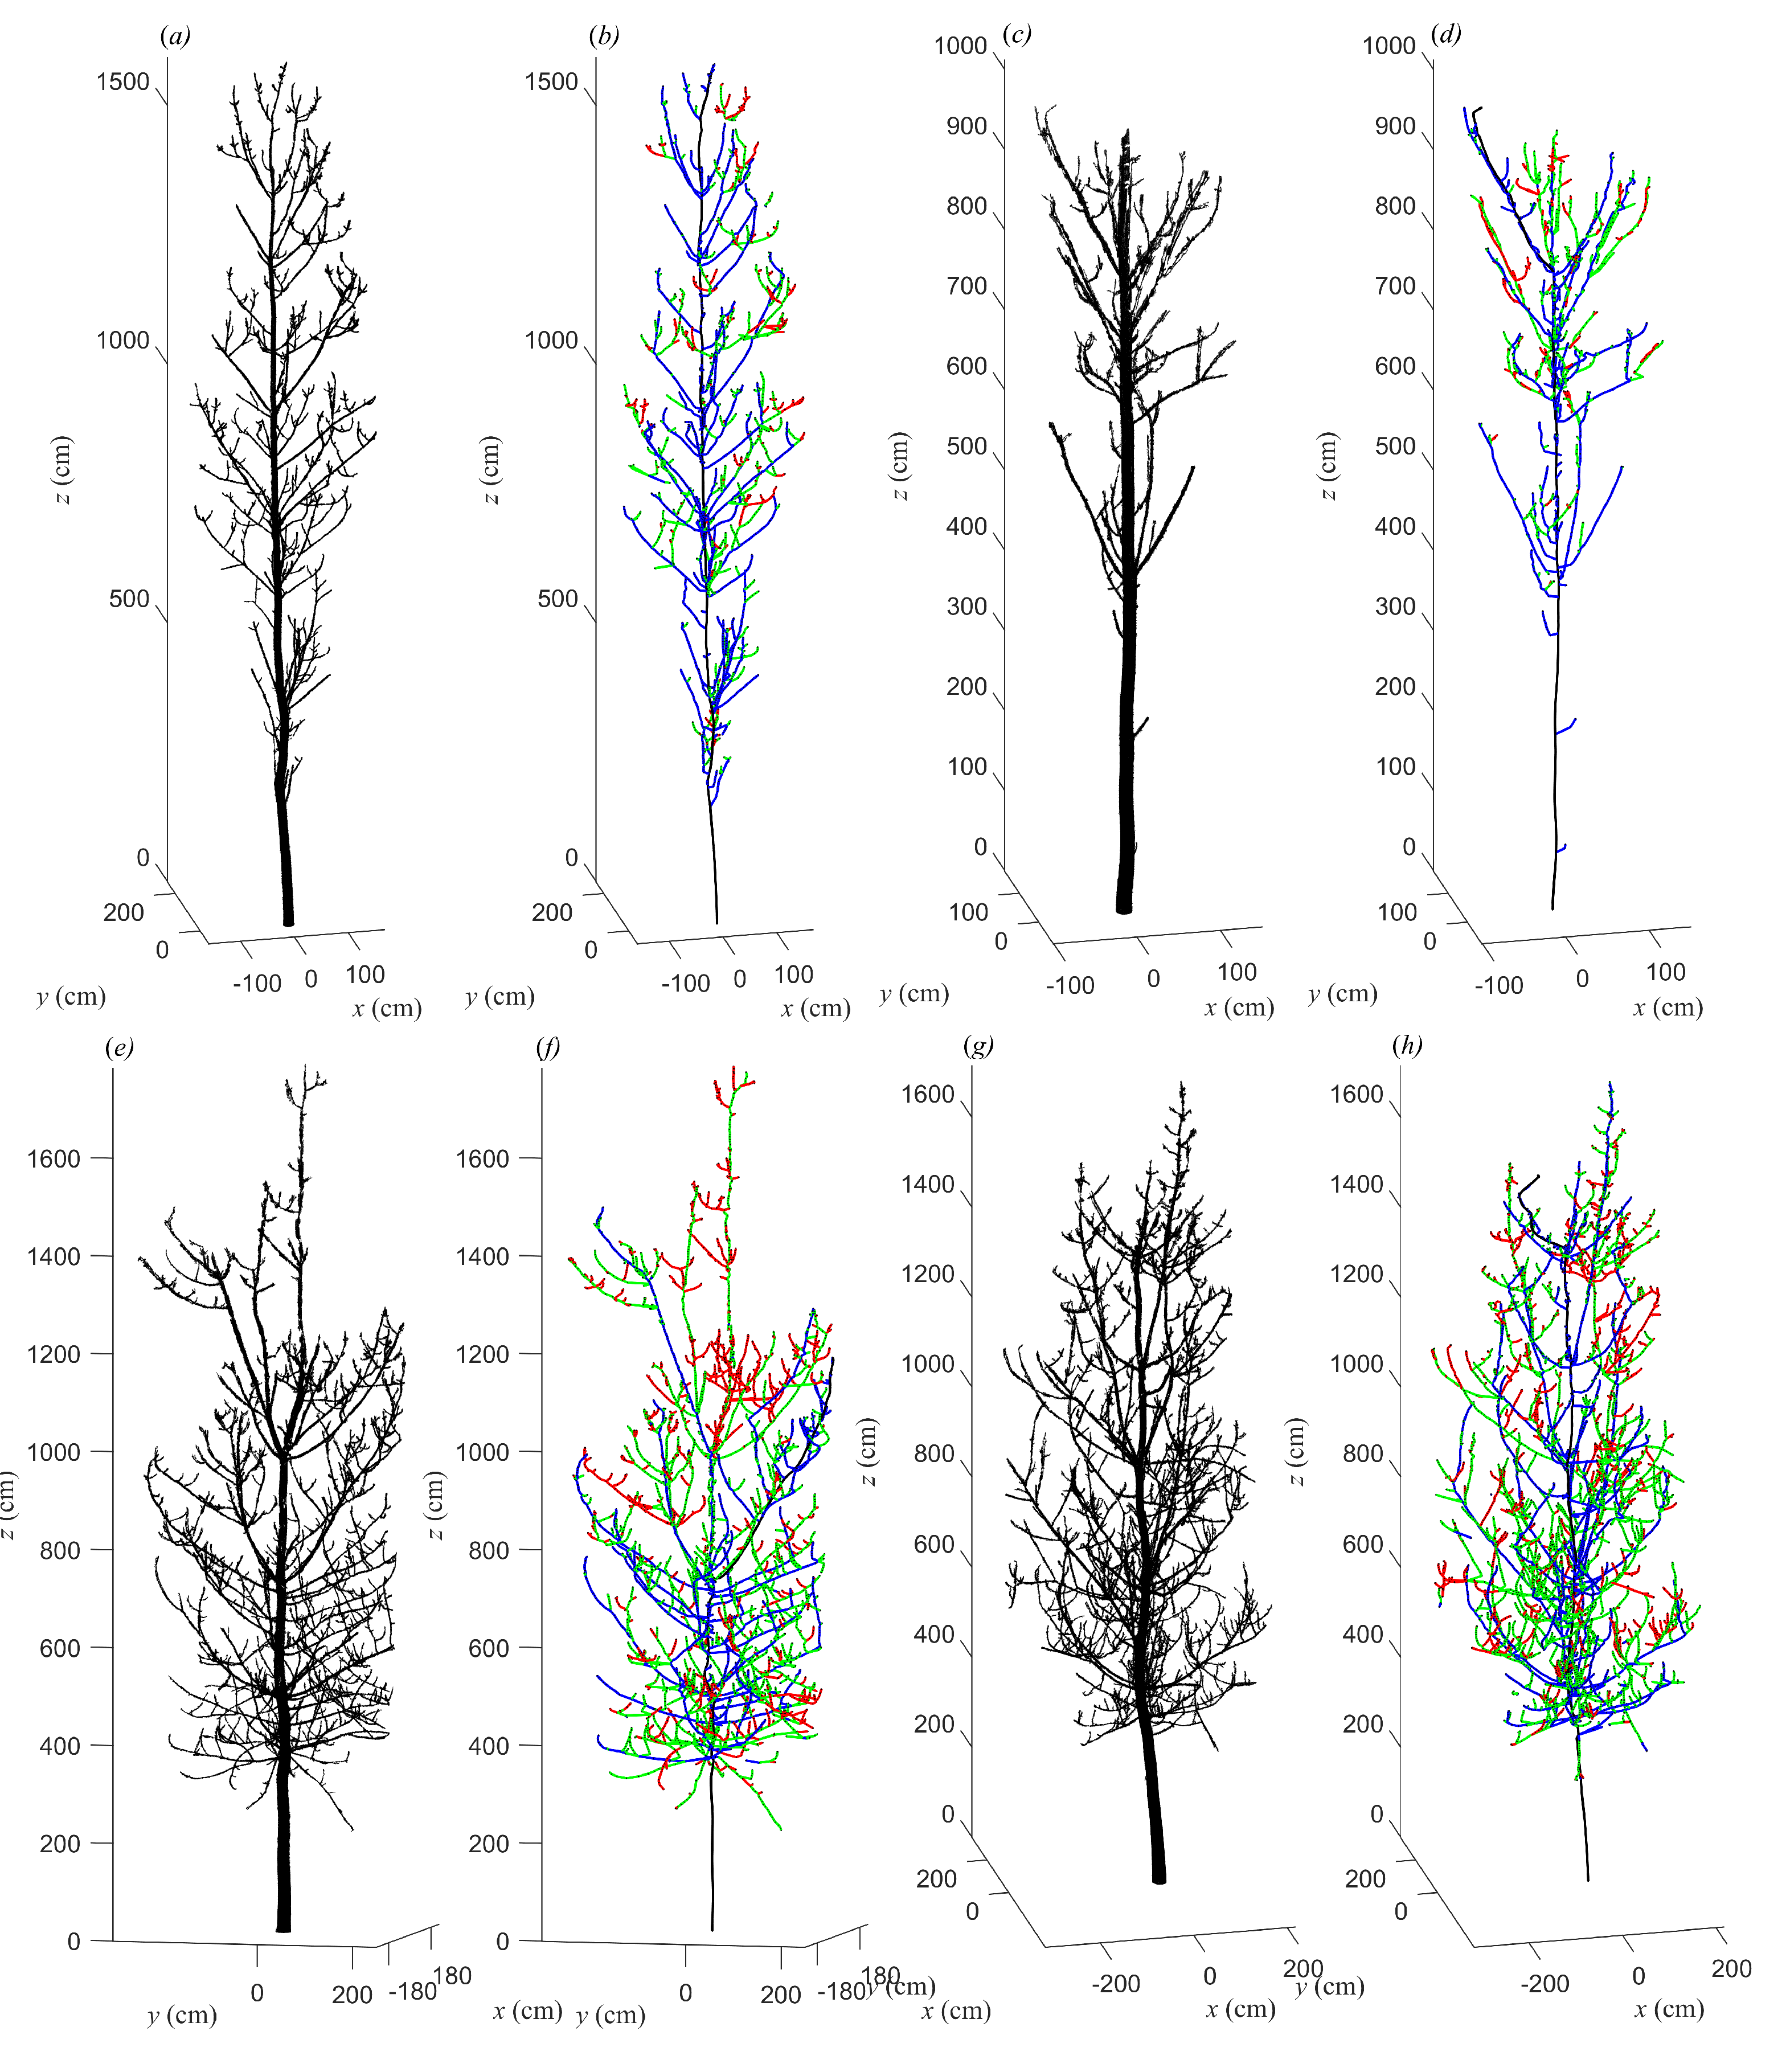
To further demonstrate the visualization effect of tree skeleton construction, four constructed tree skeletons from four trees with h = 5 cm and k = 5 are shown in Figure 11.
The four trees in Figure 11 have different morphological characteristics. The height of tree 0510 is the lowest; trees 0406 and 0305 are tall and have very complex geometries with many scattered branches. The structures of the four skeletons are all consistent with the structures of the four trees. According to the colours of the stems or branches, the vast majority of the stem or branch levels are identified correctly, and only the upper stem of tree 0406 is identified incorrectly.

4. Discussion

A tree skeleton is an efficient graphical tool to express the geometric structure of a tree. However, it is a challenge to construct a tree skeleton that is consistent with the tree geometry. In this study, we present tree skeletonization with DBSCAN using TLS data. The constructed stem skeleton can effectively reflect the geometrical structure of a tree, i.e., the stem and branch hierarchy information. The heights of the study materials in [5] were not more than 5 m (the height value is not explicitly given; it was reflected in figures), and the first-level branches were not more than eight. The study materials in [4] included artificially generated trees and raw-scan trees. It is difficult to create synthetic trees that have geometries similar to those of actual trees. For raw-scan trees, the level of branch complexity is based on the number of branching points, and the number of points for the most complex branches ranges from 71 to 85. The complex geometric structure of a tree does not appear in either of the above cases. In this study, the minimum number of tree point clouds is 833,913, which is much higher than that of [4]. Compared with the study in [4,5], the heights of our studied trees were much higher (Table 1) and the geometry structure was much more complex (Figure 11). Even so, our constructed tree skeleton can accurately output the tree geometry structure. Compared with the trees studied in [15], our constructed tree skeletons are continuous, and the stems and branches can be distinguished with detailed branch hierarchy information, which has not been achieved by the existing research. Therefore, the presented method has clear advantages over the recent existing methods.
DBSCAN is a density-based clustering algorithm that can discover clusters of any shape without interference from noise. Trees are diverse and have natural geometric topological complexity. Affected by wind disturbance and other factors, a tree point cloud has noise. These unfavourable factors of the tree point cloud are exactly the advantages of the DBSCAN algorithm. In this study, we make full use of the connectivity characteristics of the DBSCAN algorithm to perform outlier removal, determine the point-traversal order, create connections between skeleton points, and calculate the weight of skeleton points. This is one of the advantages of our algorithm.
Accurate calculation of the tree skeleton points is another advantage of our algorithm. For a tree section, there are some factors that prevent accurate calculation of the section’s centre point, such as adjacent branch points (Figure 4b) and points in the joint part between branches. In this study, a point-inversion transformation is used to calculate the tree skeleton points. Points on the inside of the tree section are used to calculate the skeleton position (Figure 4d) rather than points on the outside. Therefore, the aforementioned disadvantages are overcome and the skeleton points can be accurately calculated.
How can the effectiveness of a tree skeleton be quantitatively evaluated? This question is more challenging when the ground-truth skeleton is unknown. A tree skeleton point should locate the centre position of the tree, and the direction between adjacent and connected tree skeleton points should be consistent with the growth direction of the tree. It is obvious that a constructed tree skeleton should meet these conditions. Based on this, the positional deviation and directivity deviation are presented to quantitatively evaluate the effectiveness of a tree skeleton in this study. The experimental results preliminarily verify the effectiveness of these two parameters in this study; however, these two parameters still need to be further verified.
According to the numerical results, m a x d d is 53.885 degrees; according to the visualization results, there are few large angular deviations. This means that the method in this study can be further improved. In this study, k consecutive skeleton points are used to calculate the local stem growth direction with PCA in the tree-skeleton optimization. When the number of points is insufficient, optimization will fail. This is also one of the reasons for the large values of m a x d d . Based on the geometric structure characteristics of trees, improving the optimization method of skeleton points is one of the future research topics.
With the improvement in data accuracy, tree point clouds already have millimetre-level data accuracy. The constructed tree skeleton can not only be applied to the field of tree visualization, but also should be able to be applied to the precise retrieval of tree parameters. Skeleton visualization shows that the stem and branch hierarchies can be distinguished. Then, the included angle between branches, the height and the length of branches, and the crown width in multiple directions can be calculated based on the constructed tree skeleton. Accurately retrieving the above parameters using a constructed tree skeleton is one of the future research topics.
It is worth noting that the presented method is based on the tree point cloud from TLS, which does not mean that the method can only use TLS as the data source. Other data sources are also possible, such as the tree point cloud acquired by a backpack Lidar scanner, as long as the preprocessed tree point cloud can reflect the geometric structure of the tree.

5. Conclusions

We presented a tree-skeletonization method based on the advantages of the DBSCAN algorithm in this study. The visualization results showed that the constructed tree skeleton can accurately represent the stem, and the branch hierarchy of a tree and is consistent with the geometric characteristics of the tree. Experiments with ten trees showed that the a v g d p of d p was 0.01 cm and the a v g d d of d d was 7.07 degrees, and the numerical results demonstrated that most line segments of the constructed tree skeleton were in the centre of the tree.
The presented tree-skeletonization method achieved satisfactory results, and this method will facilitate the accurate extraction of tree parameters, tree modelling, and 3D tree canopy modelling and analysis. In addition, the positional deviation and directivity deviation were presented to evaluate the validity of the tree skeleton. This provides a feasible way to verify the validity of the tree skeleton in the absence of a ground-truth skeleton.

Author Contributions

Conceptualization, software, and writing—original draft preparation, L.Y.; data processing, software, validation, and investigation, Y.S., Y.L. and J.J.; investigation and data processing, X.C.; investigation and writing—review and editing, Y.F.; writing—review and editing, X.S. All authors have read and agreed to the published version of the manuscript.

Funding

This research was funded in part by the National Natural Science Foundation of China (No. 31872704), the Foundation for Distinguished Young Talents in Higher Education of Henan (No. 2020GGJS157), the Xinyang Academy of Ecological Research Open Foundation (No. 2023XYMS12), the Beijing Shisanling Forest Farm Coniferous Plantation Multifunctional Management Monitoring Project (No. 2022SSL110), and the Nanhu Scholars Program for Young Scholars of XYNU.

Data Availability Statement

The data presented in this study are available on request from the corresponding author.

Conflicts of Interest

The authors declare no conflict of interest.

References

  1. Raumonen, P.; Kaasalainen, M.; Åkerblom, M.; Kaasalainen, S.; Kaartinen, H.; Vastaranta, M.; Holopainen, M.; Disney, M.; Lewis, P. Fast Automatic Precision Tree Models from Terrestrial Laser Scanner Data. Remote Sens. 2013, 5, 491. [Google Scholar] [CrossRef] [Green Version]
  2. Abegg, M.; Bösch, R.; Kükenbrink, D.; Morsdorf, F. Tree volume estimation with terrestrial laser scanning-Testing for bias in a 3D virtual environment. Agric. For. Meteorol. 2023, 331, 109348. [Google Scholar] [CrossRef]
  3. Huang, H.; Wu, S.; Cohen-Or, D.; Gong, M.; Zhang, H.; Li, G.; Chen, B. L1-Medial Skeleton of Point Cloud. ACM Trans. Graph. 2013, 32, 1–8. [Google Scholar] [CrossRef] [Green Version]
  4. Jiang, A.; Liu, J.; Zhou, J.; Zhang, M. Skeleton Extraction from Point Clouds of Trees with Complex Branches via Graph Contraction. Vis. Comput. 2021, 27, 2235–2251. [Google Scholar]
  5. Xu, Y.; Hu, C.; Xie, Y. An improved space colonization algorithm with DBSCAN clustering for a single tree skeleton extraction. Int. J. Remote Sens. 2022, 43, 3692–3713. [Google Scholar] [CrossRef]
  6. Li, J.; Wu, H.; Xiao, Z.; Lu, H. 3D modeling of laser-scanned trees based on skeleton refined extraction. Int. J. Appl. Earth Obs. Geoinf. 2022, 112, 102943. [Google Scholar] [CrossRef]
  7. Su, Z.; Zhao, Y.; Zhao, C.; Guo, X.; Li, Z. Skeleton extraction for tree models. Math. Comput. Model. 2011, 54, 1115–1120. [Google Scholar] [CrossRef]
  8. Pueschel, P. The influence of scanner parameters on the extraction of tree metrics from FARO Photon 120 terrestrial laser scans. ISPRS J. Photogramm. Remote Sens. 2013, 78, 58–68. [Google Scholar] [CrossRef]
  9. Liang, X.; Hyyppä, J.; Kaartinen, H.; Lehtomäki, M.; Pyörälä, J.; Pfeifer, N.; Holopainen, M.; Brolly, G.; Francesco, P.; Hackenberg, J.; et al. International benchmarking of terrestrial laser scanning approaches for forest inventories. ISPRS J. Photogramm. Remote Sens. 2018, 144, 137–179. [Google Scholar] [CrossRef]
  10. Livny, Y.; Yan, F.; Olson, M.; Chen, B.; Zhang, H.; El-Sana, J. Automatic reconstruction of tree skeletal structures from point clouds. ACM Trans. Graph. (TOG) 2010, 29, 151. [Google Scholar] [CrossRef] [Green Version]
  11. Yan, D.M.; Wintz, J.; Mourrain, B.; Wang, W.; Boudon, F.; Godin, C. Efficient and robust reconstruction of botanical branching structure from laser scanned points. In Proceedings of the 2009 11th IEEE International Conference on Computer-Aided Design and Computer Graphics, Huangshan, China, 19–21 August 2009; pp. 572–575. [Google Scholar] [CrossRef] [Green Version]
  12. Bucksch, A.; Lindenbergh, R.; Menenti, M. SkelTre - Robust skeleton extraction from imperfect point clouds. Vis. Comput. 2010, 26, 1283–1300. [Google Scholar] [CrossRef] [Green Version]
  13. He, G.; Yang, J.; Behnke, S. Research on geometric features and point cloud properties for tree skeleton extraction. Pers. Ubiquitous Comput. 2018, 22, 903–910. [Google Scholar] [CrossRef]
  14. Liu, Y.; Guo, J.; Benes, B.; Deussen, O.; Zhang, X.; Huang, H. TreePartNet Neural Decomposition of Point Clouds for 3D Tree Reconstruction. ACM Trans. Graph. 2021, 40, 232:1–232:16. [Google Scholar] [CrossRef]
  15. Sun, J.; Wang, P.; Li, R.; Zhou, M.; Wu, Y. Fast Tree Skeleton Extraction Using Voxel Thinning Based on Tree Point Cloud. Remote Sens. 2022, 14, 2558. [Google Scholar] [CrossRef]
  16. Liu, L.; Pan, g.Y.; Li, Z. Individual Tree DBH and Height Estimation Using Terrestrial Laser Scanning (TLS) in A Subtropical Forest. Sci. Silvae Sin. 2016, 52, 26–37. [Google Scholar] [CrossRef]
  17. Rusu, R.B.; Cousins, S. 3d is here: Point cloud library (pcl). In Proceedings of the 2011 IEEE International Conference on Robotics and Automation, Shanghai, China, 9–13 May 2011; pp. 1–4. [Google Scholar]
  18. Ester, M.; Kriegel, H.P.; Sander, J.; Xiaowei, X. A Density-Based Algorithm for Discovering Clusters in Large Spatial Databases with Noise; AAAI Press: Washington, DC, USA, 1996; pp. 226–231. [Google Scholar]
  19. You, L.; Guo, J.; Pang, Y.; Tang, S.; Song, X.; Zhang, X. 3D stem model construction with geometry consistency using terrestrial laser scanning data. Int. J. Remote Sens. 2021, 42, 714–737. [Google Scholar] [CrossRef]
  20. You, L.; Tang, S.; Song, X.; Lei, Y.; Zang, H.; Lou, M.; Zhuang, C. Precise Measurement of Stem Diameter by Simulating the Path of Diameter Tape from Terrestrial Laser Scanning Data. Remote Sens. 2016, 8, 717. [Google Scholar] [CrossRef] [Green Version]
  21. You, L.; Wei, J.; Liang, X.; Lou, M.; Pang, Y.; Song, X. Comparison of Numerical Calculation Methods for Stem Diameter Retrieval Using Terrestrial Laser Data. Remote Sens. 2021, 13, 1780. [Google Scholar] [CrossRef]
  22. Qin, H.; Han, J.; Li, N.; Huang, H.; Chen, B. Mass-Driven Topology-Aware Curve Skeleton Extraction from Incomplete Point Clouds. IEEE Trans. Vis. Comput. Graph. 2020, 26, 2805–2817. [Google Scholar] [CrossRef] [PubMed]
  23. Yifan, W.; Wu, S.; Huang, H.; Cohen-Or, D.; Sorkine-Hornung, O. Patch-based progressive 3d point set upsampling. In Proceedings of the IEEE/CVF Conference on Computer Vision and Pattern Recognition, Long Beach, CA, USA, 15–20 June 2019; pp. 5958–5967. [Google Scholar]
Figure 1. 2D and 3D views in FARO Scene software of a scanning station using FARO X330. (a) 2D view. (b) 3D view.
Forests 14 01525 g001
Figure 2. The diagram of DBSCAN clustering. The blue points are the core points. The yellow point is a border point. The red point is noise. The black circles represent the neighbourhoods of points. Here, m i n P t s is 3.
Forests 14 01525 g002
Figure 3. Diagrams of the tree-slice partitioning and DBSCAN results for a tree slice. (a) Partial view of a major tree point after tree slice partitioning; adjacent slices are shown in different colours. (b) Top view of a tree slice. (c) Top view of the clustering result of the tree slice in (b) from DBSCAN; different clusters are shown in different colours, and noise is shown in red.
Forests 14 01525 g003
Figure 4. Diagrams of the point-inversion transformation and the centroid calculation before and after the point-inversion transformation. The black points represent tree segment points, the red points represent points found using the inversion transformation, the blue lines represent polygons, and the green and blue diamond points represent the centroid of the polygon before and after the point-inversion transformation, respectively. (a) Diagram of the point-inversion transformation. p is the inversion-transformed point of point p and the centre and radius of inversion are o and r, respectively. (b) Centroid calculation directly based on the convex polygon formed by tree segment points. (c) Tree segment points, corresponding inversion-transformed points, and their corresponding polygons. (d) Tree segment points and the polygon of tree segment points corresponding to the convex hull points of transformed points.
Forests 14 01525 g004
Figure 5. Diagram of skeleton-point classification, branch hierarchy recognition, and the included angle of the skeleton points. The numbers are the flow weights of the points. Black, blue, and green represent stem skeleton points and first-level and second-level branch points, respectively. The black, blue, and green lines represent the stem skeleton and first-level and second-level branches, respectively. The included angle at point B is the angle formed by points A, B, and C.
Forests 14 01525 g005
Figure 6. Diagrams of tree skeleton optimization. The lines represent the constructed tree skeleton; different branch hierarchies are represented by different colours. (a) The unoptimized tree skeleton. (b) The optimized tree skeleton. The yellow points represent the selected points for the position optimization of the joint point.
Forests 14 01525 g006
Figure 7. Flowchart of the presented tree-skeletonization method.
Forests 14 01525 g007
Figure 8. Diagrams of the accuracy evaluation. The round points represent tree skeleton points. The diamond points A and B represent the median points of two adjacent tree skeleton points. The zone between the two dotted lines around the diamond points represents the constructed tree segment. The black arrows represent the direction calculated by the two adjacent tree skeleton points.
Forests 14 01525 g008
Figure 9. Diagrams of a tree skeleton constructed from tree point cloud 0213 with e p s = 1 cm and m i n P t s = 6. (a) The tree point cloud. (b) The tree skeleton with h = 2 cm and k = 10. (c) The tree skeleton with h = 3 cm and k = 8. (d) The tree skeleton with h = 5 cm and k = 5. (e) The tree skeleton with h = 8 cm and k = 3. The magenta points represent stem skeleton points. The black, blue, green, and red lines represent the stem and first-, second-, and third-level branches, respectively.
Forests 14 01525 g009
Figure 10. Partial enlarged views of the constructed tree skeleton in Figure 9. (a) Partial enlarged tree point cloud. (b) Partial enlarged tree skeleton with h = 2 cm and k = 10. (c) Partial enlarged tree skeleton with h = 3 cm and k = 8. (d) Partial enlarged tree skeleton with h = 5 cm and k = 5. (e) Partial enlarged tree skeleton with h = 8 cm and k = 3. The magenta points represent stem skeleton points. The black, blue, green, and red lines represent the stem and first-, second-, and third-level branches, respectively.
Forests 14 01525 g010
Figure 11. Diagrams of four tree skeletons constructed from four tree point clouds. (a) Tree point cloud of 0111. (b) Tree skeleton of 0111. (c) Tree point cloud of 0510. (d) Tree skeleton of 0510. (e) Tree point cloud of 0406. (f) Tree skeleton of 0406. (g) Tree point cloud of 0305. (h) Tree skeleton of 0305. The black, blue, green, and red lines represent the stem and first-, second-, and third-level branches, respectively.
Forests 14 01525 g011
Table 1. Numerical result for ten trees with four group parameters.
Tree IDTree Height
(m)
Point Number e p s
(cm)
m i n P t s h
(cm)
kSkeleton Height (m)Skeleton Point NumberHeight Error
(m)
m a x d d
(cm)
m i n d d
(cm)
a v g d d
(cm)
m a x d p
(○)
m i n d p
(○)
a v g d p
(○)
021315.9272,289,8751.068315.82934730.0994.2110.0170.42950.3460.1214.548
5515.88055740.0487.7660.0060.32050.0890.0556.130
3815.89194670.0379.9830.0050.31050.2060.0127.831
21015.896144450.0316.4310.0080.28854.6090.01511.169
011115.9221,349,1791.068315.84019830.0838.1770.0090.42347.5060.0904.025
5515.88431830.0388.1770.0090.36548.9690.0685.479
3815.89454340.0288.1770.0070.33948.9690.0636.802
21015.89882900.0248.5380.0050.35454.2320.0458.860
051010.108833,9131.068310.0499920.0587.2260.0160.42449.1420.0416.817
5510.05016130.0587.2260.0160.40945.1460.0417.149
3810.07528380.03311.3670.0130.52550.5260.0228.763
21010.07944440.0296.7110.0080.43054.4150.01813.802
040617.8273,027,4951.568317.74639100.08115.2900.0090.54351.7340.0287.239
5517.75161860.07715.2900.0090.51251.7340.0337.551
3817.759105430.08115.2900.0080.47653.6790.0169.380
21017.778160350.04915.2900.0080.44453.6790.00712.311
030517.1283,378,3741.568317.03851070.09012.1680.0100.46451.9280.0336.954
5517.08582850.04312.1680.0100.44448.8580.0467.443
3817.095141070.03312.1680.0080.41552.2640.0229.324
21017.097215210.03017.2980.0060.40053.5960.01114.309
040714.3502,192,4391.568314.23129890.11913.3660.0060.42653.8060.01911.750
5514.30148300.0497.6720.0100.46951.3600.1317.564
3814.31081970.0409.5140.0060.41753.8060.01912.114
21014.320124460.0307.6720.0060.39853.8060.01913.061
051115.6741,218,0691.068315.59619290.0788.6050.0150.51253.2940.0816.632
5515.63331750.0418.6050.0150.51253.2940.1507.692
3815.89154060.0379.9830.0050.31050.2060.0127.831
21015.89684560.0319.9830.0050.29654.6090.0129.959
061715.5512,825,7891.068315.43742520.1148.7090.0070.40953.9840.0466.253
5515.49568590.0564.9900.0070.38352.1030.0466.549
3815.530118260.02113.2550.0050.36353.9840.0250.025
21015.535181090.01613.2550.0040.34354.1070.0099.957
051413.1931,203,2421.068313.10719130.08717.2980.0080.41750.5210.0406.876
5513.09831910.09517.2980.0080.40150.5210.0406.979
3813.13755910.05717.2980.0080.46554.4930.0269.050
21013.16086100.03317.2980.0080.46853.5140.01113.004
051914.1711,246,0861.068314.07414360.0969.4480.0060.44448.7380.0977.199
5514.135423940.0359.4480.0100.45148.7380.0977.947
3814.14941080.02112.6440.0050.50749.8500.0279.817
21014.15463750.0167.8600.0080.39752.2830.03112.820
Table 2. Average values of different groups’ parameters values.
h
(cm)
kAverage of Height Error
(m)
Average of m a x d d
(cm)
Average of m i n d d
(cm)
Average of a v g d d
(cm)
Average of m a x d p
(○)
Average of m i n d p
(○)
Average of a v g d p
(○)
2100.02911.0340.0070.38253.8850.01811.925
380.03911.9680.0070.41351.7980.0248.094
550.0549.8640.0100.42750.0810.0717.048
830.09010.4500.0100.44951.1000.0606.829
- a - a 0.05310.8290.0080.41851.7160.0438.474
a all the values of h and k.
Disclaimer/Publisher’s Note: The statements, opinions and data contained in all publications are solely those of the individual author(s) and contributor(s) and not of MDPI and/or the editor(s). MDPI and/or the editor(s) disclaim responsibility for any injury to people or property resulting from any ideas, methods, instructions or products referred to in the content.