Article

The SSR Genetic Diversity of Wild Red Fruit Lycium (Lycium barbarum) in Northwest China

1
Co-Innovation Center for Sustainable Forestry in Southern China, Nanjing Forestry University, Nanjing 210037, China
2
Jiangsu Yancheng Forest Farm, Yancheng 224057, China
*
Author to whom correspondence should be addressed.
Forests 2023, 14(8), 1598; https://doi.org/10.3390/f14081598
Submission received: 15 July 2023 / Revised: 3 August 2023 / Accepted: 5 August 2023 / Published: 8 August 2023
(This article belongs to the Section Genetics and Molecular Biology)

Abstract

:
Through a comprehensive regional systematic collection, we conducted a genetic diversity analysis of wild red-fruited Lycium resources across the entire northwest region of China. This study provides a valuable genetic basis for germplasm exploration and the selection of new Lycium varieties. Utilizing fluorescence capillary electrophoresis, we carefully screened 16 pairs of SSR primers exhibiting high polymorphism. Subsequently, we inferred the genetic diversity of Lycium germplasm through structure clustering, UPGMA analysis, and molecular AMOVA. The 113 Lycium barbarum samples collected from northwest China exhibited distinct subgroups, namely the Qinghai–Gansu–Ningxia subgroup and the Xinjiang subgroup. These subgroups were clearly distinguishable based on genetic clustering. The genetic diversity within the samples was remarkably rich, as indicated by a mean I value of 1.04, He value of 0.57, and PIC value of 0.73. Notably, the majority of genetic diversity (72.99%) was found within populations, signifying substantial intrapopulation variation. Furthermore, our findings revealed significant genetic differentiation among populations, with a substantial Fst value of 0.27 and gene flow Nm estimated at 0.68. This suggests that the genetic variation levels in northwest Lycium were notably high, primarily driven by pronounced genetic differentiation among populations. Nonetheless, it is important to note that genetic diversity predominantly persists within populations. The observed subpopulation structure of Qinghai–Gansu–Ningxia and Xinjiang regions in northwest China can be primarily attributed to geographical isolation. These geographical barriers have played a pivotal role in shaping the genetic differentiation and structure of Lycium populations in the region. Consequently, our study sheds light on the complex genetic landscape of Northwest Lycium and highlights the significance of considering both within-population diversity and population differentiation in conservation and breeding programs.

1. Introduction

Lycium barbarum, a perennial shrub, predominantly thrives in arid or semi-arid environments, with a limited distribution in coastal saline lands. This versatile plant holds significant value as a fruit, vegetable, tea, forage, and flavoring agent, among other applications. Consequently, the fruit of Lycium is rich in medicinal components and has been used as an important medicinal herb and functional food for more than 2000 years in Asian countries [1]. Given its wide-ranging benefits, Lycium cultivation has gained widespread popularity in China [2]. Lycium species can be classified into two main categories based on fruit color: red-fruited (predominantly L. barbarum in Northwest China) and black-fruited (mostly L. ruthenicum). Additionally, L. chinense is found in northern and eastern China, alongside several localized and closely related species.
Genetic diversity serves as the foundation for biodiversity and holds both scientific and productive significance in various aspects, including understanding species origin and evolution, protecting genetic resources, utilizing genetic materials, and exploring valuable germplasm. SSR (Simple Sequence Repeat) markers have emerged as a powerful tool for investigating genetic diversity and have been extensively employed in diverse studies, such as those conducted on rice [3], pepper [4], and torch ginger [5]. Researchers have utilized SSR markers to determine genetic diversity, establish germplasm fingerprints, analyze dominance patterns, trace germplasm migration, evaluate gene flow, construct genetic linkage maps, and conduct phylogenetic research [6]. Lycium, with its abundant resources in the wild and complex genetic background [7,8], represents an intriguing subject for genetic studies. However, there have been limited investigations focused on scattered wild Lycium resources in China, which significantly hampers the innovation and exploration of germplasm resources for red-fruited Lycium. Consequently, there is a crucial need for more comprehensive research initiatives to unlock the potential of genetic diversity and facilitate germplasm advancements in red-fruited Lycium. Although Zhao et al. [9] conducted an analysis of the genetic diversity of L. chinense using SSR techniques, the germplasm primarily originated from Korea. Chen et al. [10] developed EST-SSR primers for 11 different Lycium species. However, most of the studies on Chinese Lycium germplasm resources have been limited to specific local areas, such as Ningxia, resulting in a lack of comprehensive large-scale assessments of genetic diversity. Therefore, there is a pressing need to conduct extensive studies encompassing a broader range of Lycium germplasm resources throughout China. Such investigations would greatly contribute to our understanding of the genetic diversity and structure of Chinese Lycium populations, facilitating more informed conservation and breeding efforts.
At present, the genetic basis of the germplasm resources of Chinese wild Lycium is still unclear, and the genetic background has not been systematically researched, which brings troubles to the conservation and development of the germplasm resources of Lycium. By conducting an extensive and comprehensive collection of wild germplasm resources, we can significantly enhance the evaluation and utilization of these resources, thereby laying the foundation for breeding new and improved varieties. With this goal in mind, our team embarked on a systematic collection of wild Lycium from 2017 to 2019, covering a wide geographical area in Northwest China. This endeavor was aimed at genetic conservation and preservation. Using the SSR molecular marker approach, we have examined the genetic patterns and diversity of the collected Lycium germplasm. The scope of our study extends beyond mere genetic assessment; we seek to gain insights into the species formation of Lycium and elucidate its evolutionary pathways. Moreover, our efforts involve the identification and selection of promising varieties that hold potential for the development of the Lycium industry. Additionally, by developing and expanding our genetic resources, we aim to contribute to scientific and technological innovation in the field of Lycium research. Through our comprehensive and far-reaching study, we aspire to make significant contributions to the advancement of the Lycium industry, while fostering sustainable utilization of genetic resources and promoting scientific progress in this field. By harnessing the genetic diversity within Lycium germplasm, we strive to unlock new possibilities and create a solid foundation for future advancements in breeding and technological innovation.

2. Materials and Methods

2.1. Experimental Materials

The experimental materials include a total of 120 wild Lycium of red fruits (L. barbarum) germplasm resources from Ningxia, Gansu, Qinghai, Xinjiang, Jiangsu, and other sources (Table 1), bred and planted in 2020 with the academician workstation of Yancheng forest farm in Yancheng City, Jiangsu Province. All plant materials were identified by Prof. Cao Fuliang (E-mail: [email protected]). Three single plants were randomly selected from each material, and each single plant was selected from the apical middle of the young leaves and stored at −80 °C in an ultra-low temperature refrigerator.

2.2. Extraction of Genomic DNA

The DNA kit was purchased from Tiangen Biochemical Technology (Beijing) Co. The DNA quality and concentration were measured by a NanoDrop2000/2000c ultra-micro UV spectrophotometer with OD 260/280 values of 1.8~2.0 as reference, and samples that did not meet the standard were re-extracted. The final sample of DNA was diluted to 50 ng∙μL−1 and stored at −20 °C.

2.3. SSR Primers

Based on our laboratory’s previous transcriptome data of Lycium, we performed sequence assembly using the Trinity software (1 March 2023). Subsequently, the Micro SAtellite (MISA) tool (http://pgrc.ipk-gatersleben.de/misa/misa.html) (8 March 2023) was employed to search for SSR (Simple Sequence Repeat) loci in the Unigene sequences. Primer pairs for the SSR loci-containing sequences were designed using Primer Premier 3.0 software with the following parameters: primer length ranging from 18 to 27 bp, GC content between 40% and 60%, annealing temperature set at 50 to 60 °C, PCR amplification length between 100 and 300 bp, and other parameters were set to their default values. The SSR primers were synthesized by DynaScience Biotechnology (Shanghai) Co., Shanghai, China. We performed an initial screening using 108 pairs of primers synthesized based on the transcriptome data. These primers were designed to target SSR loci in 8 genetically diverse accessions; they were collected from geographically distant locations and exhibited significant phenotypic variations.
Out of the initial 108 pairs of primers assessed in the previous study, a final selection of 16 pairs of primers was made based on specific criteria, including the presence of clear bands, high polymorphism, and good reproducibility (Table 2). These 16 primer pairs were utilized in the SSR capillary electrophoresis molecular marker technique, which was applied to analyze the genetic characteristics of the Lycium germplasm material in this study. Each pair of primers was used in the amplification and subsequent analysis of the SSR markers present in the Lycium samples.

2.4. PCR Amplification and Capillary Electrophoresis

Table 2 shows 16 pairs of SSR capillary electrophoresis primers. The M13 universal junction series (TGTAAAACGACGGCCAGT) was selected to be added to the 5’ direction of the F primer of each pair of primers, and three different kinds of fluorescent markers were selected in this experiment, which were divided into FAM, HEX, and TAMRA, and then the synthesis of M13 junction sequences carrying different fluorescent moieties was completed. Then, the PCR products carrying fluorescence were detected by fluorescence electrophoresis using a DNA sequencer ABI 3730xl, and then the initial data of the experiment were strip-typed using Gene Marker V2.2.0.
PCR was amplified using Applied Biosystem’s PCR instrument. The PCR reaction conditions were 96 °C for 3 min for the pre-denaturation phase, 96 °C for 30 s for denaturation, 72 °C for 30 s~1 min for annealing, and 30 cycles for extension; the conditions were 72 °C for 10 min for extension. The final PCR products were stored in the refrigerator. A 15 μL reaction system was used for SSR-PCR amplification: 7.5 μL 2×Taq PCR Master Mix (Genetech (Shanghai, China)), 2 μL Mix primer, 1 μL DNA template (50–200 ng), and 4.5 μL ddH2O were needed to make up the 15 μL PCR reaction system.
The fluorescent PCR products were identified by agarose gel electrophoresis, and the PCR bands were detected using the electrophoresis results. Then, the PCR products were diluted at a ratio of 1:5 to 1:30 after selecting single bands with matching sizes for detection on the machine.

2.5. Data Reading and Processing

A data matrix was constructed and amplified fragments were scored with the presence of 1 in each SSR locus and the absence of 0. Shannon’s information index (I) and expected heterozygosity (He) were tested based on codominant allelic data using Popgen Ver.1.32. The number of alleles, gene diversity index, and polymorphism information content (PIC) were calculated using Power Marker V3.25 software (http://www.powermarker.net) (20 March 2023). Genetic distances were calculated by the method of Nei [11] and used to construct a similarity tree based on the unweighted pair group method of mathematical averages (UPGMA), as implemented in MEGAX (https://www.megasoftware.net) (28 March 2023). Based on Bayesian clustering method, the population structure analysis was performed by STRUCTURE 2.3 software [12]. The number of populations (K) was set from 1 to 20, and a replicate of 20 for each K value was run at a burn-in period of 10,000 followed by 100,000 iterations. The logarithm of the posterior probability of data (lnP(D)) was examined across the different K values. In order to assess the best K value, the △K line chart was drawn and the K value was then confirmed [13]. The analysis of molecular variance (AMOVA) was performed by GeneAlEx-6.5 [14] to find the genetic differentiation genotypes. To assess the population structure of the Lycium germplasm, the Structure software was utilized, employing a Bayesian clustering approach, as described by Pritchard et al. [15].

3. Results

3.1. Primer Screening and Polymorphism Analysis

The analysis of the selected 16 pairs of primers revealed a high level of genetic variation within the Lycium resources, as demonstrated by the detection of an average of 11.94 alleles (Na) per primer pair. Among the primers, E8 and E14 exhibited the highest number of detected alleles, both identifying 22 alleles, while F1 and H2 detected the lowest number of alleles, each with only 4 alleles.
The observed genetic variation is further supported by various genetic diversity parameters (Table 3). The effective alleles (Ne) ranged from 1.80 to 4.43, with an average value of 2.9. The observed heterozygosity (Ho) varied from 0.26 (primer B6) to 0.86 (primer E13), with an average value of 0.58. The expected heterozygosity (He) ranged from 0.37 (primer G6) to 0.72 (primer E13), with an average value of 0.57. The Shannon information index (I) exhibited a mean value of 1.04, indicating the amount of genetic diversity present in the Lycium samples. The polymorphism information content (PIC) had an average value of 0.73, further highlighting the level of polymorphism within the studied loci.
Based on Botstein’s theory [16], the PIC values of 15 out of the 16 primer pairs (excluding B6) exceeded 0.5, indicating highly polymorphic loci. Only the primer G6 exhibited moderate polymorphism. This analysis confirms the substantial genetic diversity present in the Lycium resources, with the majority of the selected primer pairs exhibiting high polymorphism, thus providing valuable information for future genetic studies and breeding programs.

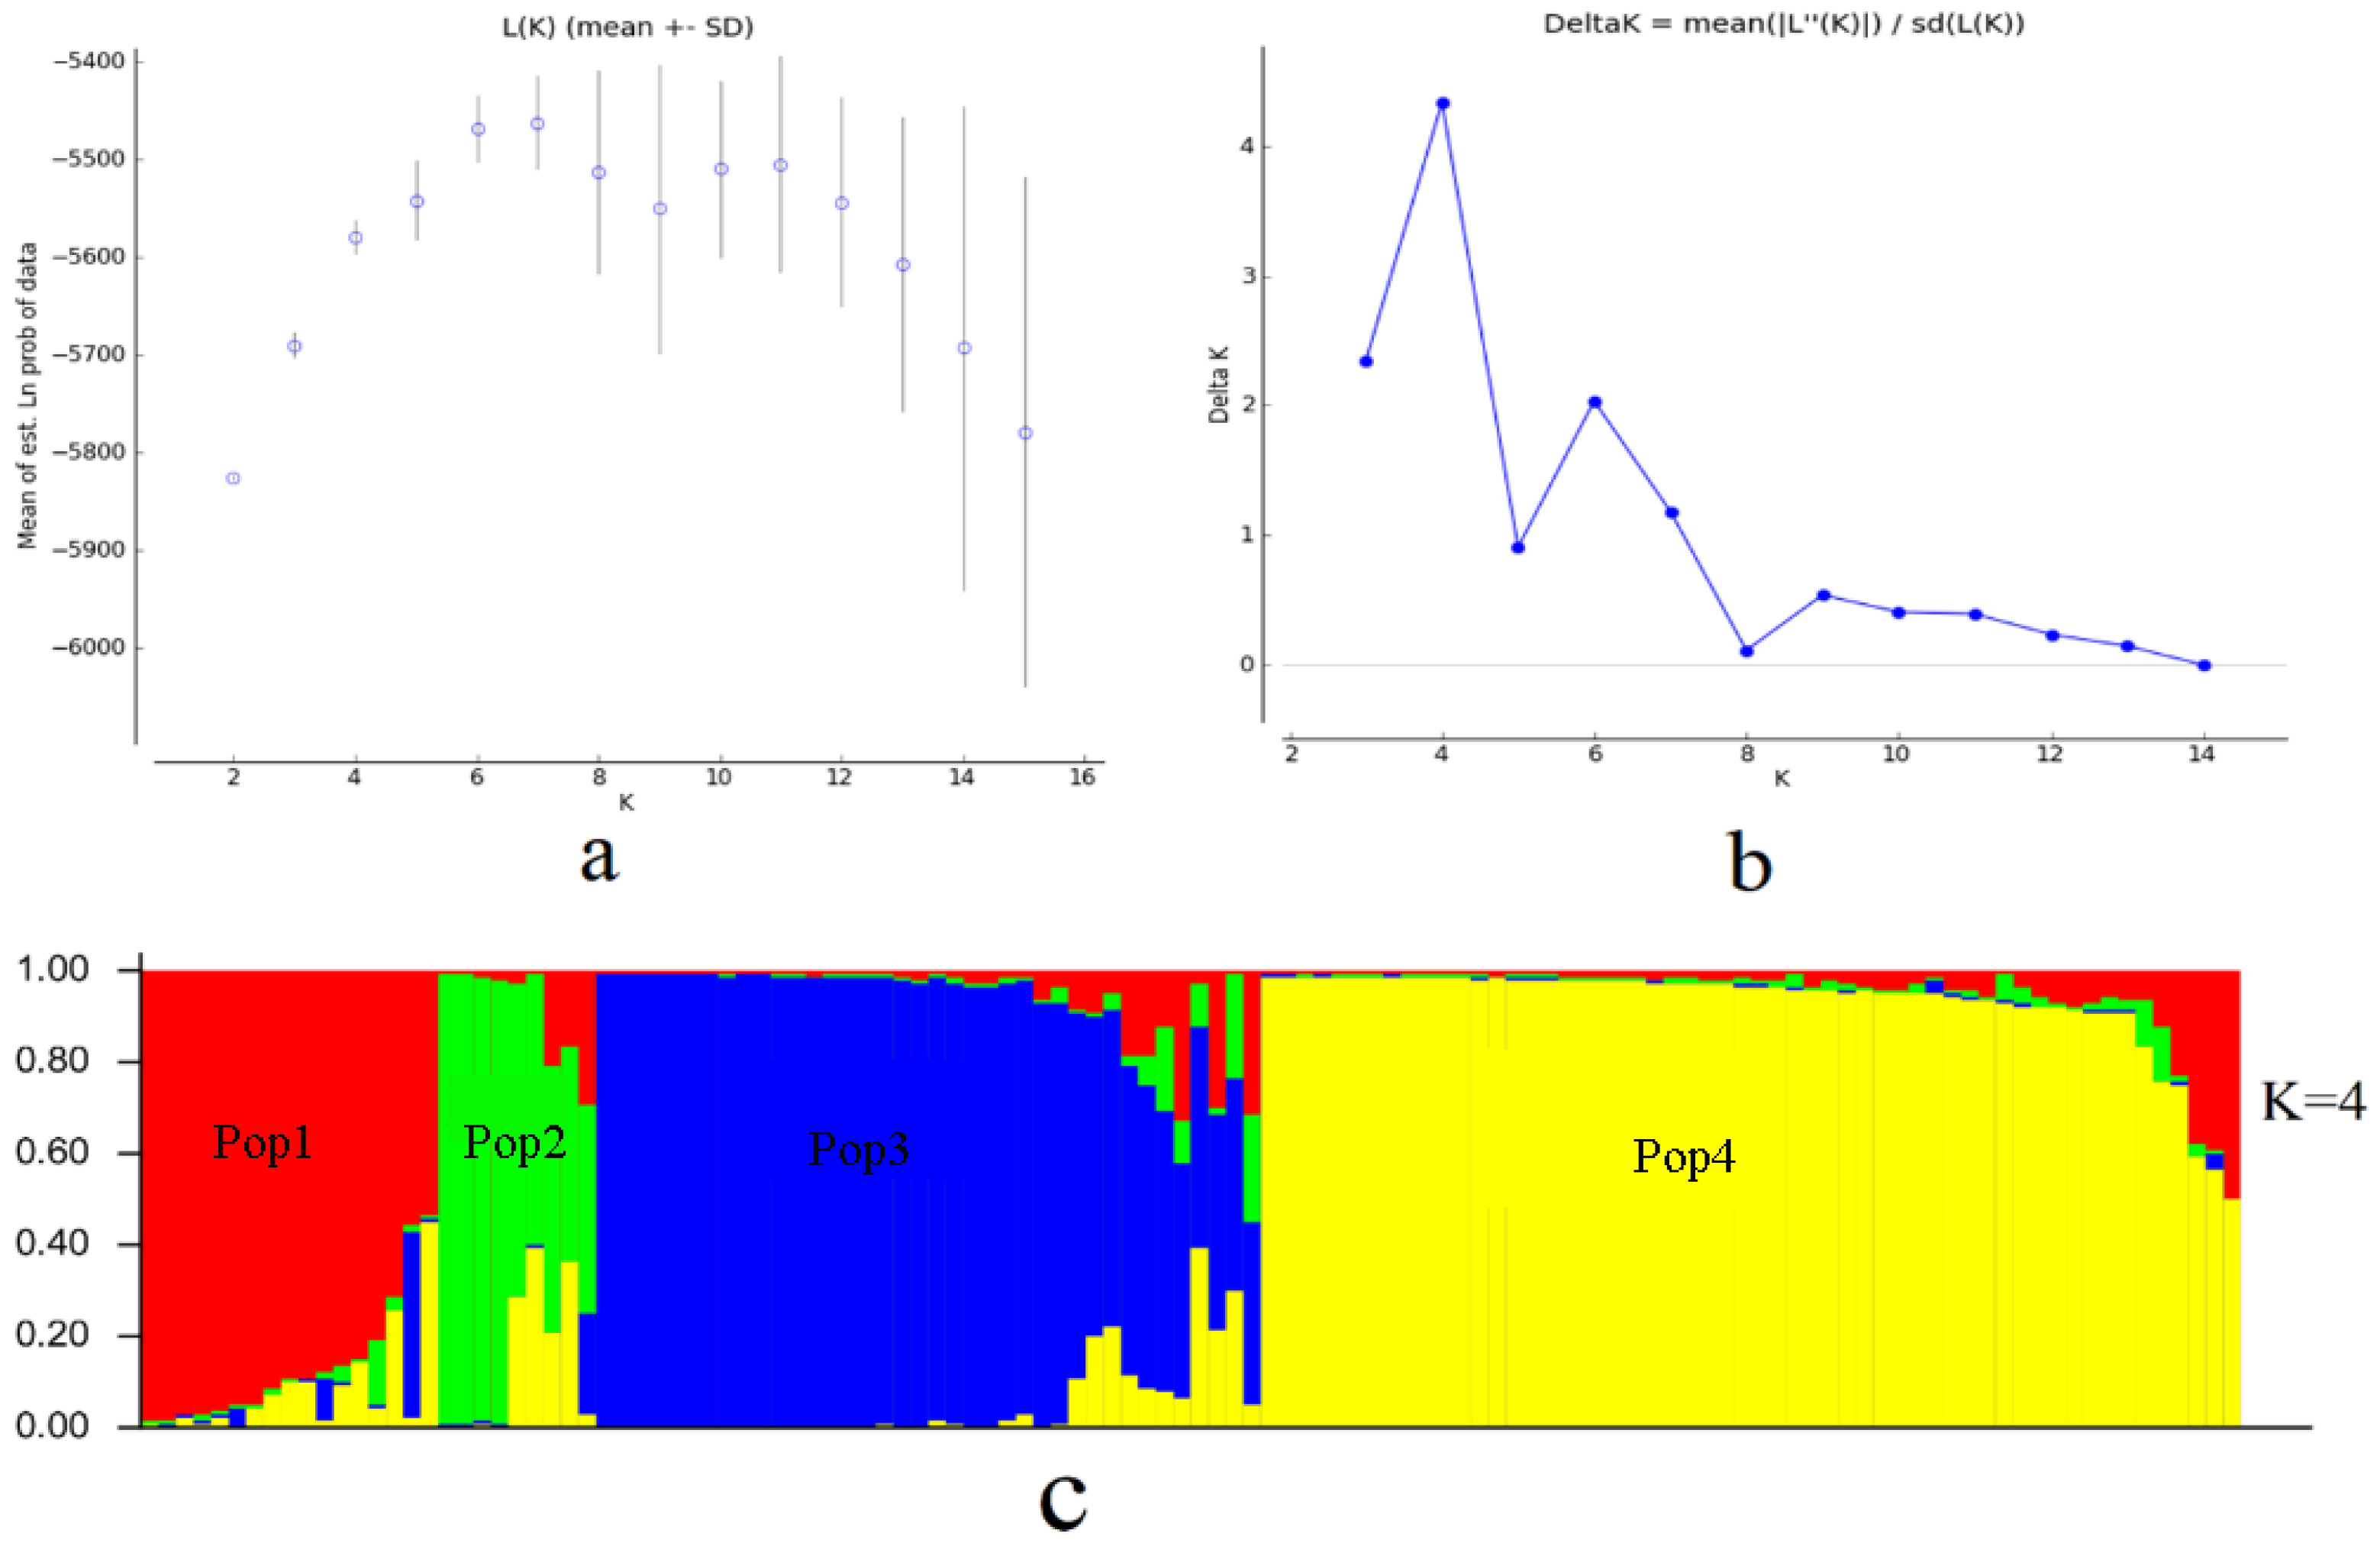
3.2. Structure Clustering Analysis

The most likely subpopulation classification for all Lycium resources was K = 4 after running STRUCTURE starting with K = 1. Accordingly, when K was set to 4 a total of 107 germplasm resources exhibited Q values greater than 0.6, indicating a relatively uniform genetic background and clear genetic origin. These 107 resources, along with the additional 13 resources, were classified into four distinct subgroups (Figure 1). This analysis provides valuable insights into the population structure of the Lycium germplasm, highlighting the presence of distinct subgroups within the studied population.

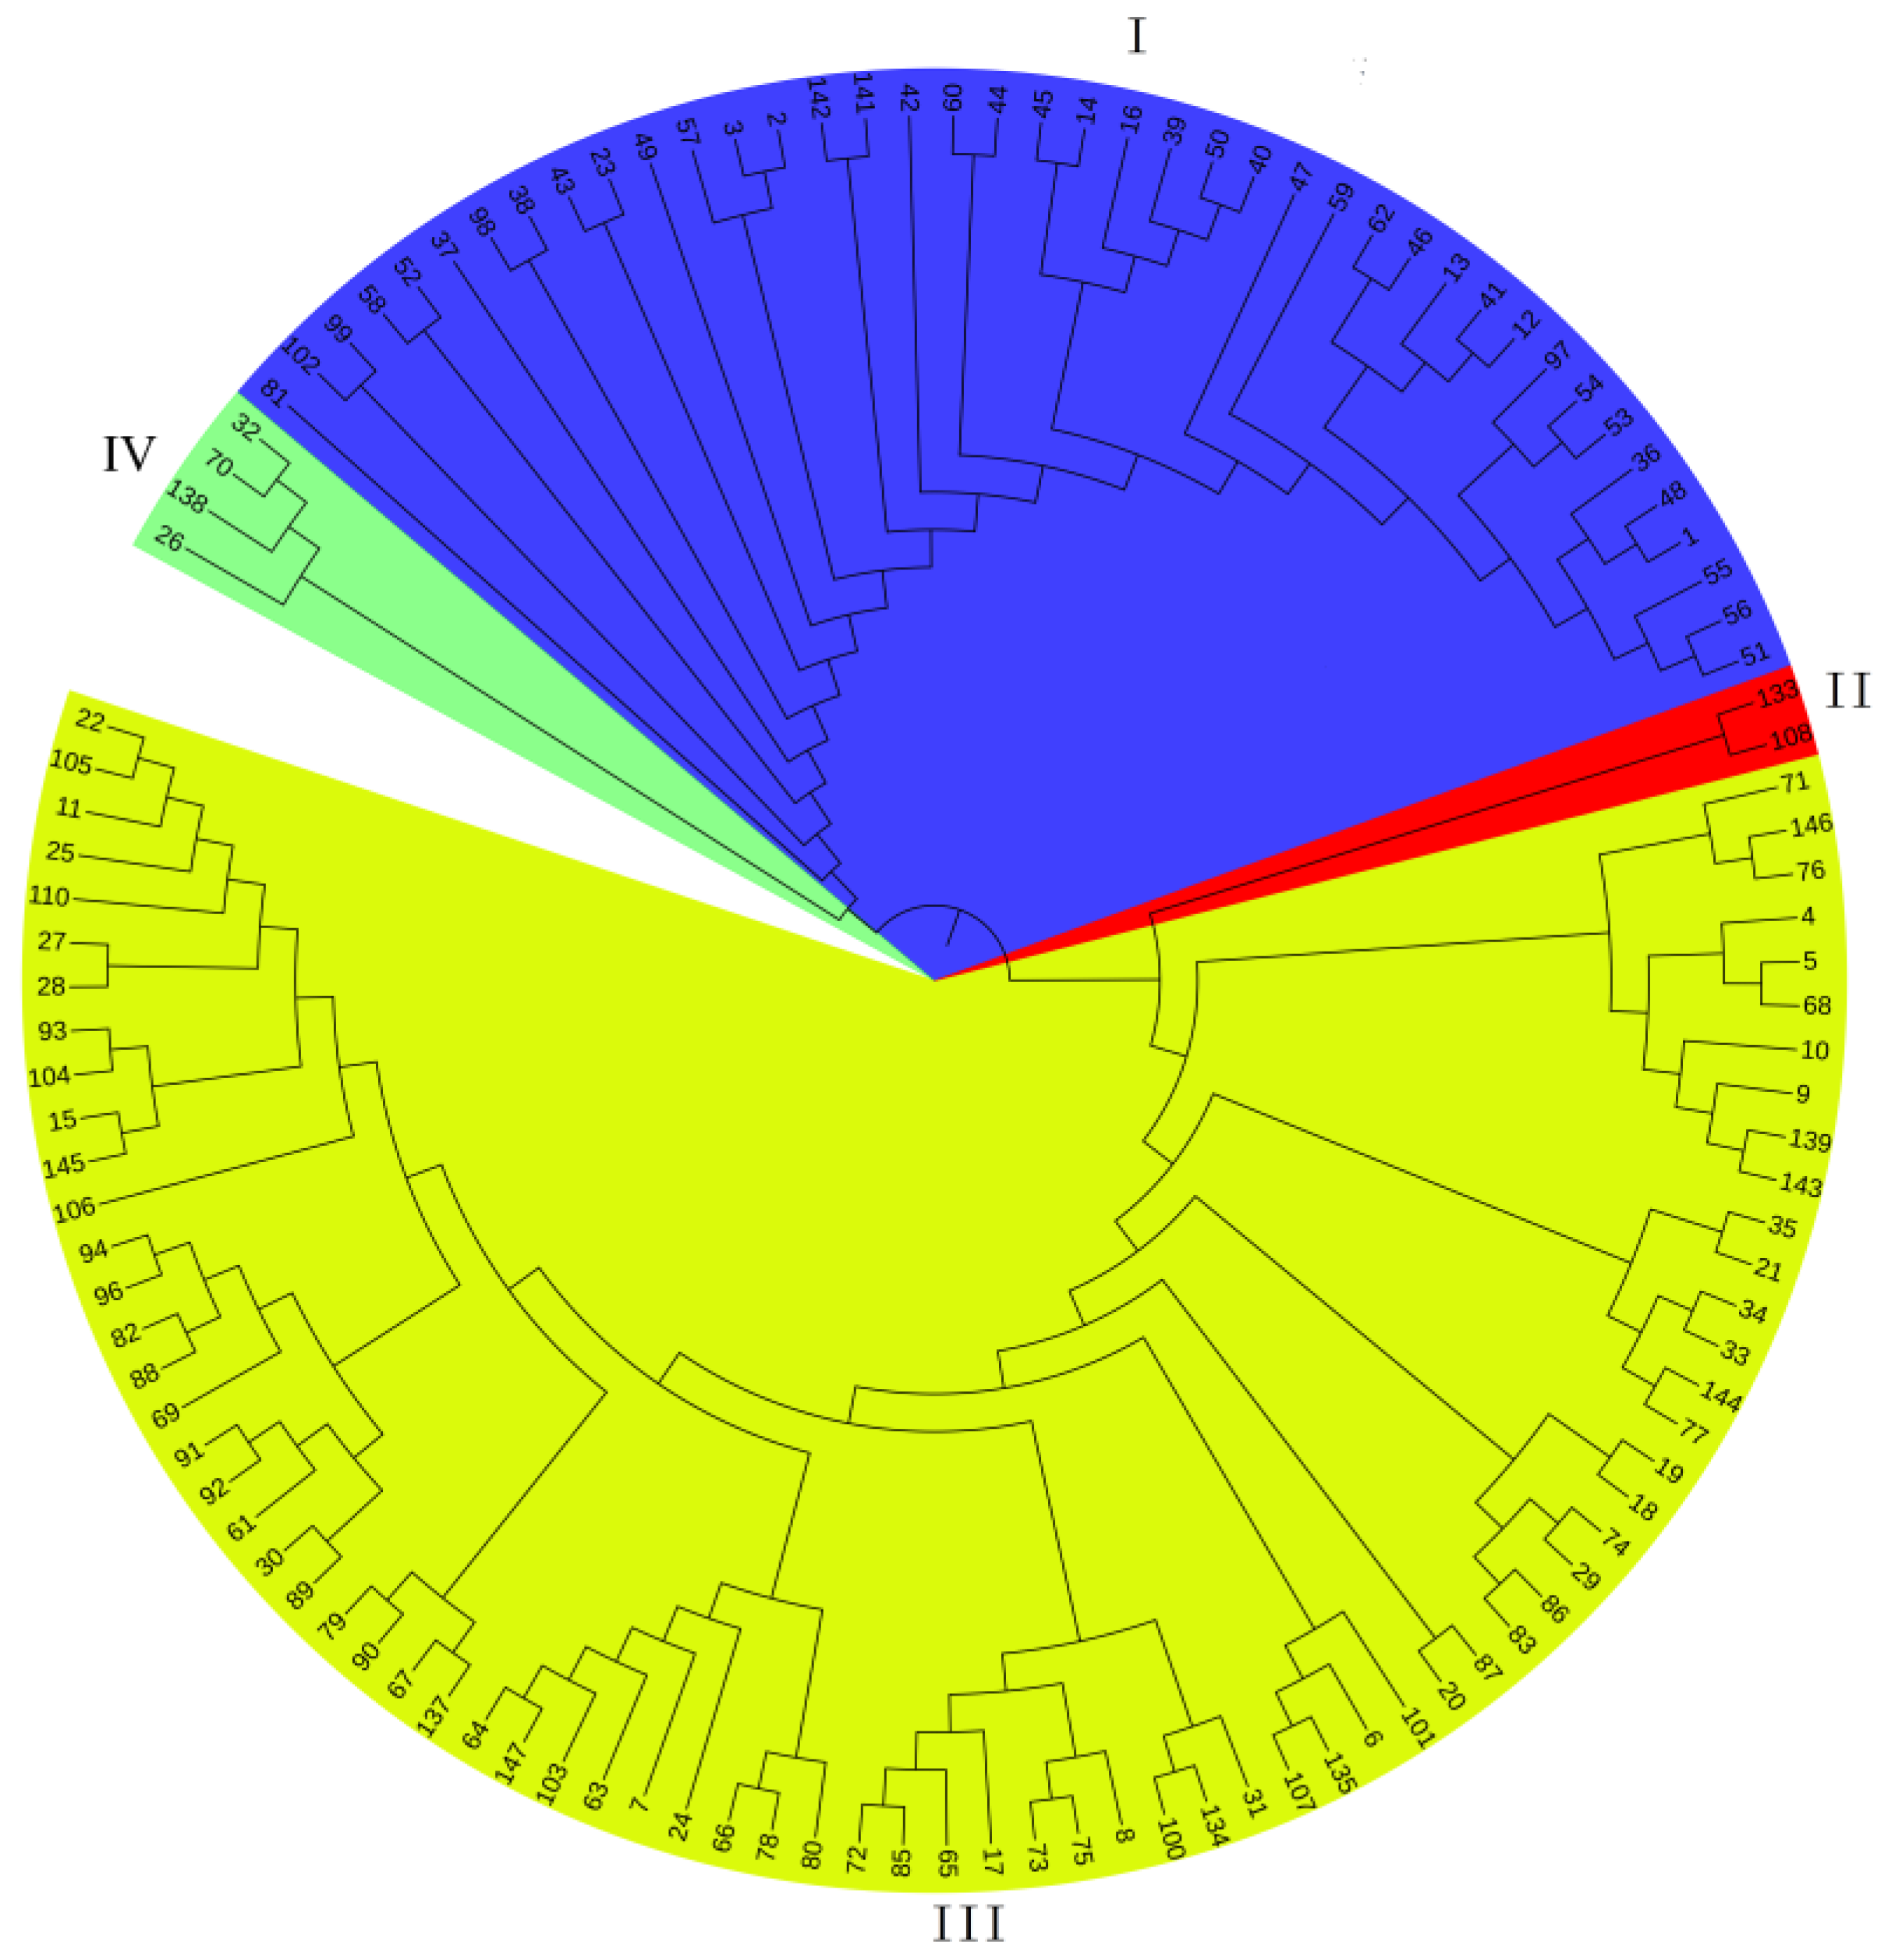
3.3. UPGMA Cluster Analysis

For further confirmation and classification, cluster analysis was conducted using the unweighted pair group method with arithmetic mean (UPGMA) based on Nei’s genetic distance theory. This analysis confirmed the existence of four subgroups within the Lycium germplasm population.
Subcluster I consisted of 73 samples, primarily comprising Lycium samples from Xinjiang. Additionally, one red-fruited Lycium sample from Yunnan was also included in this subgroup. Subcluster II comprised 41 resources, mainly originating from Qinghai, Gansu, and Ningxia. Two resources, one from Yancheng in Jiangsu and another from Pizhou in Xuzhou, Jiangsu, which were involved in cooperative analysis, formed a separate category known as subcluster III. This finding suggests that Lycium samples from East China possess a distinct genetic background. Four L. ruthenicum samples, which served as an outgroup, were classified into a separate category known as subcluster IV.
These findings, depicted in Figure 2, provide further insight into the genetic structure of the Lycium germplasm, demonstrating the presence of distinct subgroups. The results reveal the geographic distribution patterns and genetic relationships among the studied Lycium samples, highlighting the unique genetic backgrounds of different regions and the separation of L. ruthenicum as an outgroup.

3.4. Molecular Analysis of Variance

The evolutionary potential of a species, as well as its ability to adapt to adversity, relies on both the genetic structure of the population and the level of genetic variation within that population [17]. The AMOVA analysis allowed for the calculation of gene flow (Nm) and the population differentiation coefficient (Fst) (Table 4). Gene flow plays a crucial role in preventing genetic differentiation between populations. Species with high gene flow typically exhibit lower levels of genetic differentiation among populations. A value of Fst greater than 0.25 is considered indicative of a high degree of genetic differentiation among populations [18].
In this study, the AMOVA analysis revealed that 27.01% of the genetic variation was attributed to interpopulation differences, while 72.99% of the genetic variation resided within the populations. The calculated Fst value was 0.27, indicating a high degree of genetic differentiation among the populations studied. Therefore, the genetic variation observed in this Lycium resource was primarily found within the individual populations rather than between them.

4. Discussion

At present, high-throughput sequencing technology has been widely used in the development of SSR markers, and SSR markers are most widely used in the genetic diversity analysis of germplasm resources [19]. In this study, we used SSR primers to explore the genetic diversity of Lycium in Northwest China. The results showed that the genetic diversity of Lycium in Northwest China was at a relatively high level, with PIC values ranging from 0.44 to 0.91, higher than those of tomatoes [20] and eggplants [21]. In an earlier study using SSR molecular markers to explore the genetic diversity of Lycium germplasm resources, the PIC values for the different populations were 0.3296 [9] and 0.679 [22], which were within the range of the results of this study. Because the collection of our germplasm was more extensive, the range of PIC values was larger, indicating a greater degree of DNA variation detected.
Through the utilization of Bayesian methods and UPGMA, clustering results were obtained, which divided the red-fruited Lycium into two main subgroups: the Qinghai–Gansu–Ningxia subgroup dominated by samples from Qinghai, Gansu, and Ningxia, and the Xinjiang subgroup as a separate cluster. These clustering results aligned well with the geographical distribution of the sample materials. The proximity of Qinghai, Gansu, and Ningxia provinces in terms of geographical location and the close genetic backgrounds of their germplasm materials suggest that geographical isolation plays a significant role in shaping the observed genetic diversity. The samples from Xinjiang formed a distinct cluster, potentially reflecting the higher genetic diversity present in Lycium from that region. Notably, one sample from Yunnan was classified into the Xinjiang cluster, possibly due to the limited number of Yunnan samples, which may have failed to adequately capture its specific genetic background. Notably, we did not observe significant phenotypic differences based on molecular markers derived from the subgroup classification results, including fruit and leaves. Perhaps our detection of phenotypic differences was not detailed and systematic enough, which deserves further in-depth investigation.
Molecular AMOVA analysis further confirmed the large genetic variation within the sampled populations and significant genetic differentiation between populations, consistent with previous findings on L. ruthenicum [23]. This differentiation may be attributed to the attractive qualities of red-fruited Lycium, such as bright color and sweet taste, which make them desirable for feeding by birds, animals, or human-mediated dispersal, thereby facilitating genetic exchange among germplasm resources. Moreover, the complex geographical, climatic, and environmental factors in the Northwest region influence natural selection and the evolutionary trajectory of Lycium berries. Previous studies suggest that black-fruited Lycium berries and other desert plants may have expanded outward along the Taklamakan Desert and migrated westward through the Hexi Corridor [23,24,25], which may provide an explanation for the division of red-fruited Lycium berries into two main subgroups in Northwest China.
Considering the vast land area and climatic variations across different regions in China, further sampling and analysis are necessary to explore the complexity and specificity of the genetic backgrounds of Lycium in East, Northeast, and Southwest China. With the recent publication of the complete genome data of L. barbarum in 2021 [26], Lycium research has entered the “post-genomic era”. In addition to Chinese Lycium resources, future studies should also encompass Lycium resources distributed in Africa, South America, and other regions. The use of multi-omics and other advanced techniques will be crucial for conducting in-depth and systematic genetic evolution and genetic resources analyses, thereby accelerating the development and utilization of wild Lycium germplasm. This will be an important focus of future Lycium research.

5. Conclusions

In this study, 16 pairs of highly polymorphic SSR primers were carefully selected to analyze and infer the genetic diversity of Lycium germplasm. The Lycium germplasm collected from Northwest China can be categorized into two subpopulations: the Qinghai–Gansu–Ningxia subpopulation and the Xinjiang subpopulation. Notably, most of the genetic diversity was found within populations, suggesting that a large amount of variation exists within populations. This is the first comprehensive exploration of the genetic diversity of Lycium in the major germplasm distribution areas of China, providing valuable insights into the origin of germplasm resources in different regions. Overall, this study serves as a preliminary scientific database for future research, improvement, and conservation programs targeting Lycium on a larger scale. The findings contribute to our understanding of the genetic diversity and relationships within Lycium germplasm resources, supporting the development of more effective strategies for breeding, conservation, and utilization of Lycium in the future.

Author Contributions

Methodology, X.G. and J.S.; software, J.L. and X.G.; formal analysis, X.G.; data curation, X.G.; writing—original draft preparation, X.G.; writing—review and editing, X.G. and Q.G.; and project administration and funding acquisition, Q.G. All authors have read and agreed to the published version of the manuscript.

Funding

This research was funded by the National Natural Science Foundation of China (grant number: 31971648) and the Study on Germplasm Resources of Important Indigenous Economic Tree Species in Nanjing Forestry University (grant number: GXL2018001).

Data Availability Statement

Not applicable.

Acknowledgments

We thank Yancheng forest farm and the Co-Innovation Center for Sustainable Forestry in Southern China for allowing us to use their research facilities.

Conflicts of Interest

The authors declare no conflict of interest.

References

  1. Chang, R.C.; So, K.F. Use of anti-aging herbal medicine, Lycium barbarum, against aging-associated diseases. What do we know so far? Cell Mol. Neurobiol. 2008, 28, 643–652. [Google Scholar] [CrossRef] [PubMed]
  2. Yue, Y.; Wei, A.; Jianhua, Z.; Yanlong, L.; Yunfang, F.; Jinhuan, C.; Youlong, C.; Xiangqiang, Z. Constructing the wolfberry (Lycium spp.) genetic linkage map using AFLP and SSR markers. J. Integr. Agric. 2022, 21, 131–138. [Google Scholar] [CrossRef]
  3. Choudhury, D.R.; Kumar, R.; Maurya, A.; Semwal, D.P.; Rathi, R.S.; Gautam, R.K.; Trivedi, A.K.; Bishnoi, S.K.; Ahlawat, S.P.; Singh, K.; et al. SSR and SNP Marker-Based Investigation of Indian Rice Landraces in Relation to Their Genetic Diversity, Population Structure, and Geographical Isolation. Agriculture 2023, 13, 823. [Google Scholar] [CrossRef]
  4. Kong, Q.; Zhang, G.; Chen, W.; Zhang, Z.; Zou, X. Identification and development of polymorphic EST-SSR markers by sequence alignment in pepper, Capsicum annuum (Solanaceae). Am. J. Bot. 2012, 99, e59–e61. [Google Scholar] [CrossRef] [Green Version]
  5. Ismail, N.A.; Rafii, M.Y.; Mahmud, T.M.M.; Hanafi, M.M.; Miah, G. Genetic Diversity of Torch Ginger (Etlingera elatior) Germplasm Revealed by ISSR and SSR Markers. Biomed. Res. Int. 2019, 2019, 5904804. [Google Scholar] [CrossRef] [Green Version]
  6. Wang, Y.; Rashid, M.A.R.; Li, X.; Yao, C.; Lu, L.; Bai, J.; Li, Y.; Xu, N.; Yang, Q.; Zhang, L.; et al. Collection and Evaluation of Genetic Diversity and Population Structure of Potato Landraces and Varieties in China. Front. Plant Sci. 2019, 10, 139. [Google Scholar] [CrossRef] [Green Version]
  7. Banks, S.C.; Cary, G.J.; Smith, A.L.; Davies, I.D.; Peakall, R. How does ecological disturbance influence genetic diversity? Trends Ecol. Evol. 2013, 28, 670–679. [Google Scholar] [CrossRef]
  8. Rao, V.R.; Hodgkin, T. Genetic diversity and conservation and utilization of plant genetic resources. Plant Cell Tissue Organ. Cult. 2002, 68, 1–19. [Google Scholar]
  9. Zhao, W.G.; Chung, J.W.; Cho, Y.I.; Rha, W.H.; Lee, G.A.; Ma, K.H.; Han, S.H.; Bang, K.H.; Park, C.B.; Kim, S.M.; et al. Molecular genetic diversity and population structure in Lycium accessions using SSR markers. Comptes Rendus Biol. 2010, 333, 793–800. [Google Scholar] [CrossRef]
  10. Chen, C.; Xu, M.; Wang, C.; Qiao, G.; Wang, W.; Tan, Z.; Wu, T.; Zhang, Z. Characterization of the Lycium barbarum fruit transcriptome and development of EST-SSR markers. PLoS ONE 2017, 12, e0187738. [Google Scholar] [CrossRef] [Green Version]
  11. Info, M.N. Analysis of Gene Diversity in Subdivided Populations. Proc. Natl. Acad. Sci. USA 1973, 70, 3321–3323. [Google Scholar] [CrossRef]
  12. Falush, D.; Stephens, M.; Pritchard, J.K. Inference of population structure using multilocus genotype data: Dominant markers and null alleles. Mol. Ecol. Notes 2007, 7, 574–578. [Google Scholar] [CrossRef]
  13. Evanno, G.; Regnaut, S.; Goudet, J. Detecting the number of clusters of individuals using the software STRUCTURE: A simulation study. Mol. Ecol. 2005, 14, 2611–2620. [Google Scholar] [CrossRef] [Green Version]
  14. Peakall, R.O.D.; Smouse, P.E. Genalex 6: Genetic analysis in Excel. Population genetic software for teaching and research. Mol. Ecol. Notes 2006, 6, 288–295. [Google Scholar] [CrossRef]
  15. Pritchard, J.K.; Stephens, M.; Donnelly, P. Inference of population structure using multilocus genotype data. Genetics 2000, 155, 945–959. [Google Scholar] [CrossRef]
  16. Das, A.K.; Kumar, S.; Rahim, A. Estimating microsatellite based genetic diversity in Rhode Island Red chicken. Iran. J. Vet. Res. 2015, 16, 274–277. [Google Scholar] [PubMed]
  17. Keller, L.F.; Waller, D.M. Inbreeding effects in wild populations. Trends Ecol. Evol. 2002, 17, 230–241. [Google Scholar] [CrossRef]
  18. Wright, S. Variability within and among Natural Populations; University of Chicago Press: Chicago, IL, USA, 1978. [Google Scholar]
  19. Li, L.; Fang, Z.; Zhou, J.; Chen, H.; Hu, Z.; Gao, L.; Chen, L.; Ren, S.; Ma, H.; Lu, L. An accurate and efficient method for large-scale SSR genotyping and applications. Nucleic Acids Res. 2017, 45, e88. [Google Scholar] [CrossRef] [Green Version]
  20. Fanjuan, M.; Xiangyang, X.; Fenglan, H.; Jingfu, L. Analysis of Genetic Diversity in Cultivated and Wild Tomato Varieties in Chinese Market by RAPD and SSR. Agric. Sci. China 2010, 9, 1430–1437. [Google Scholar] [CrossRef]
  21. Liu, J.; Yang, Y.; Zhou, X.; Bao, S.; Zhuang, Y. Genetic diversity and population structure of worldwide eggplant (Solanum melongena L.) germplasm using SSR markers. Genet. Resour. Crop Evol. 2018, 65, 1663–1670. [Google Scholar] [CrossRef]
  22. Yin, Y.; An, W.; Zhao, J.; Wang, Y.; Fan, Y.; Cao, Y. SSR information in transcriptome and development of molecular markers in Lycium ruthenicum. J. Zhejiang AF Univ. 2019, 36, 422–428. [Google Scholar]
  23. Yisilam, G.; Wang, C.X.; Xia, M.Q.; Comes, H.P.; Li, P.; Li, J.; Tian, X.M. Phylogeography and Population Genetics Analyses Reveal Evolutionary History of the Desert Resource Plant Lycium ruthenicum (Solanaceae). Front. Plant Sci. 2022, 13, 915526. [Google Scholar] [CrossRef]
  24. Meng, H.H.; Gao, X.Y.; Huang, J.F.; Zhang, M.L. Plant phylogeography in arid Northwest China: Retrospectives and perspectives. J. Syst. Evol. 2015, 53, 33–46. [Google Scholar] [CrossRef]
  25. Shi, X.J.; Zhang, M.L. Phylogeographical structure inferred from cpDNA sequence variation of Zygophyllum xanthoxylon across north-west China. J. Plant Res. 2015, 128, 269–282. [Google Scholar] [CrossRef] [PubMed]
  26. Cao, Y.L.; Li, Y.L.; Fan, Y.F.; Li, Z.; Liu, Z.J. Wolfberry genomes and the evolution of Lycium (Solanaceae). Commun. Biol. 2021, 4, 671. [Google Scholar] [CrossRef] [PubMed]
Figure 1. Structure analyses of Lycium resource. (a) Mean Ln P(D) (±SD) over 15 runs for each K value. (b) The corresponding ΔK statistics calculated. (c) Structure clustered.
Forests 14 01598 g001
Figure 2. UPGMA clustered. The 120 resources are aggregated into four subcluster, represented by I (Xinjiang Subcluster), II (Qinghai-Gansu-Ningxia Subcluster), III (Jiangsu Subcluster), IV (outgroup).
Forests 14 01598 g002
Table 1. Collection information of wild Lycium resources.
No.Longitude, EDimensionality, NNo.Longitude, EDimensionality, NNo.Longitude, EDimensionality, NNo.Longitude, EDimensionality, N
1101.7036.233187.4240.7161101.7636.739287.5047.12
2101.7036.233286.2041.6362101.4936.669387.9344.14
3101.7036.183395.8736.2163100.1339.239489.0643.84
4102.5336.183495.8736.216499.6439.559689.0643.84
5103.2836.173595.8736.216598.6039.849789.0643.84
6103.2836.1736104.1035.536698.5839.849889.0643.84
7103.2836.1737104.1835.466798.539.799989.6144.04
8103.2836.1738104.1835.466898.0639.8110089.6144.04
9104.0136.4939104.4035.296997.0740.2710190.1143.82
10104.0136.4940104.4135.017097.0340.3010293.0243.60
11104.5136.6741104.4534.567197.0440.3310393.3444.24
12105.0836.6442105.0934.457295.7640.5210494.6943.25
13105.6936.5543105.5734.367395.7540.5210595.2743.22
14106.9336.0544105.5734.397495.7440.5210696.5540.53
15112.3237.6545105.4134.277595.7640.5210788.9139.26
16111.8438.0846105.4534.237695.6940.5110887.3638.69
17109.9338.2947105.4434.247787.2243.74110117.9034.40
18106.7939.2648105.4234.287885.7644.28133102.7625.06
19106.1339.0349105.4234.467985.7644.28134120.1633.35
20103.0939.6350105.3934.468084.5844.4413583.0446.73
21101.9738.2351104.3035.328180.9243.98137106.1339.03
22101.1438.5352104.1435.288281.8543.2113886.3944.51
23100.2338.1953103.4835.248381.8543.2113986.3944.51
24100.2537.2654103.3435.278584.2541.78141102.0335.43
2598.5637.0155102.5735.258686.1542.32142103.836.06
2697.5136.0356102.0635.368787.4542.8614382.6544.55
2793.6236.7557102.0635.738888.4943.3914489.0643.84
2888.1739.0758102.0635.738987.6043.3914587.3638.69
2987.4240.7159101.7836.849087.5244.03146105.9534.65
3087.4240.7160101.7636.7291101.7636.7314780.5140.68
Note: Serial numbers 26, 32, 70, and 138 are L. ruthenicum; 108 are from Yancheng, Jiangsu, 133 are from Xuzhou, Jiangsu, and 110 are from Kunming, Yunnan.
Table 2. SSR Primer sequences.
Primer NameForward PrimersReverse PrimersTarget Fragment Length
B6CAAGAAGCAAATCTGCCACATCACCCGCTTTCCTATCAAC140
B18CCTCCGATTTCGTGTGCTATAGCCCAGTTCTACCCCTTGT150
E8AAGATTTGGGGAAGACGACGCATGGCAGCATATTAGCGAAG150
E14GGATGAATGAATGCTCGTGCTCCTCTTCCCTTCAAAATACCC100
E16CCAGTTGTACAGGTAGCTATGCGGACTTTCCTTGGGCTCTCATG140
E19CCCATACATACTCATCACCTCTGCGTTGTCCAAACAACACACAGTGC140
E13TTCCATTACACTTCGCTGCTCCAGATGAAGAGGGACGAGACG150
E18TGCTGCAGAGAACAACATTAGGTCTCCCATTCAATCCAGTATGC150
F1CAAGTCATCACGTGGACGCCTCTGAAACGAGAAGGACGG120
G6TTGGAACCAATGCTAATGGAAGGGGACATCAGTTGGAAATTAG140
H1ACAAACCGAAAGCGAGAAGAGAACAACTCGTGGTGACCCT189
H2TGCCACCTTGTATTGGTTCAGGGTCTGTTTGGTTGTTTGA115
H3CTCGTCTCCCTTCCAAACAAATGCACATCCTACCACCACA155
H4TGGCAAGCTTACAGGTTGTGCCCAAATTGATCTGTGTAGAGGA113
H8AATGGATTGCTTATTCCAGCACCAATTTCAGC147
H12CACCACAAACTCCTCAGCAATCTCCCTCGAGCAACTGAAT182
H13AGGTGCATGAAAAGCCAAAAAAAGAGGGTTTAGGCCCGTA226
Table 3. SSR markers and their diversity statistics values.
PrimersNaNeHoHeIPIC
B6101.990.260.420.710.62
B18123.050.670.621.150.82
E8224.430.660.691.410.91
E13214.190.860.721.440.89
E14223.210.510.601.130.84
E18152.340.590.520.910.75
E19154.020.730.721.420.84
F142.000.560.460.710.61
G651.800.340.370.590.44
H183.010.710.621.120.80
H241.920.340.440.680.55
H382.200.510.480.850.60
H4103.180.670.641.180.83
H882.610.550.560.970.70
H12123.410.680.681.290.79
H13152.970.690.621.100.79
average11.942.900.580.571.040.73
Table 4. Analysis of molecular variance from different regions.
Source of VariationdfSSMSvarPercent (%)NmFst
Inter populations 3338.06112.694.9927.010.680.27
Within populations1161563.6413.4813.4872.99//
Total1191901.70124.1718.471.00//
Disclaimer/Publisher’s Note: The statements, opinions and data contained in all publications are solely those of the individual author(s) and contributor(s) and not of MDPI and/or the editor(s). MDPI and/or the editor(s) disclaim responsibility for any injury to people or property resulting from any ideas, methods, instructions or products referred to in the content.

