Abstract
The continuous prohibition of commercial logging and intensifying conservation endeavors have encompassed the implementation of the Natural Forest Conservation Program (NFCP) and the Grain-to-Green Program (GTGP) by the Chinese government since 1999. Nevertheless, the efficacy of the commercial logging ban and its effectiveness in halting deforestation remain uncertain. Likewise, the destructive aftermath of the 7.9 magnitude Wenchuan earthquake in 2008 continues to be under scrutiny, necessitating ongoing study and analysis. Thus, there exists a pressing need to comprehensively monitor the spatio-temporal evolution of the forest habitat and assess the ecological status over the past two decades. The Jiudingshan Nature Reserve (JNR) is situated in the upper reaches of the Tuojiang River basin in Sichuan province, China, constituting an integral part of the Giant Panda National Park (GPNP). In this study, we classified land cover types and conducted a meticulous monitoring of forest habitat alterations within JNR, by a multilayer perceptron model (MLP) with a highly learning-sensitive algorithm. To quantify these changes, the Simple Ratio Index (SRI) and the Normalized Difference Vegetation Index (NDVI) were computed from Landsat TM/OLI images of four years (i.e., 1997, 2007, 2008, and 2018). Additionally, elevation, slope, aspect, and other topographic data were acquired from the Digital Elevation Model (DEM). The findings of our study unveil a notable expansion in both the scope and proportion of mixed conifer and broadleaf forest from 1997 to 2004. The growth of coniferous forest and the augmented areas of mixed conifer and broadleaf forest signify a substantial improvement in panda habitat. However, the seismic event of 2008 exhibited a pronounced adverse impact on vegetation, particularly within forested regions. Although there is evidence of forest recovery spanning 21 years, concerns regarding fragmentation linger. It is pivotal to acknowledge the potential long-term adverse implications arising from widespread socio-economic development and a multitude of geohazards. Hence, sustained long-term monitoring coupled with effective management strategies remain pivotal for the preservation and rehabilitation of the Giant Panda National Park (GPNP) and giant panda habitat in the future.
1. Introduction
Alteration and fragmentation of forest landscapes detrimentally impact their ecosystem functions, leading to the loss of biological diversity and the decline in carbon storage capacity [1,2]. For a national park (the International Union for Conservation of Nature (IUCN) Category II), the size and main objective are focused on protecting functional ecosystems. The definition of national park is a “large natural or near-natural area protecting large-scale ecological processes with characteristic species and ecosystems, which also have environmentally and culturally compatible spiritual, scientific, educational, recreational and visitor opportunities” [3]. The primary purpose of national parks is “to protect natural biodiversity along with its underlying ecological structure and supporting environmental processes, and to promote education and recreation” [3]. Yellowstone National Park holds the distinction of being the world’s inaugural national park, established with the primary objective of conserving wildlife and preserving natural resources on 1 March 1872 [4]. In the European Union, national parks (NPs) represent approximately 13% of the total protected natural areas, including approximately 25% of the areas that are protected by the EU, national PAs, and Natura 2000 sites [5].
The giant panda (Ailuropoda melanoleuca), renowned as a symbol of global conservation priority, inhabits the mountainous regions of west-central China and remains the most endangered ursid species worldwide [6]. Forest fragmentation and degradation are considered the primary factors responsible for the decline in the wild giant panda population and the degradation of its habitat [7,8]. Currently, suitable habitat for giant pandas is only about 25,000 km2 [6] and is associated with the presence of bamboo, which is their main food source, mainly in mixed deciduous and coniferous forests in areas with complex topography and rapid elevation changes [9]. Generally, forests at mid-altitude provide more suitable food conditions for giant pandas, which tend to prefer areas with low or moderate slopes and warmer terrain for their activities [6,10,11]. Forest, slope, and elevation are also often used as defining variables for habitat suitability for giant pandas [12].
The International Union for Conservation of Nature (IUCN) recently reclassified the conservation status of the giant panda from “endangered” to “vulnerable”, reflecting a remarkable turnaround in its conservation efforts [13]. The remarkable shift in the giant panda’s conservation status can be attributed to the persistent and effective conservation efforts of the Chinese government for numerous years. The cessation of commercial logging occurred in 1999 when the Natural Forest Conservation Program (NFCP) and the Grain-to-Green Program (GTGP) were launched [14]. The implementation of these programs has resulted in substantial improvements in the habitat of the giant panda [15]. The Chinese government continues to prioritize the protection of the giant panda and has recently implemented additional conservation measures, including the approval of the pilot Giant Panda National Park System (GPNPS) and the establishment of the Giant Panda National Park Administration Bureau (GPNPAB) [16,17,18].
Although these efforts of the Chinese government have achieved great conservation results, the “downgrade” of giant pandas is still considered premature [19]. The present and future of giant pandas and their habitats remains bleak, as they continue to face various human-induced threats such as road construction, timber harvesting, tourism, and livestock grazing [6,16,20]. Except for the influence of the activities of humans, substantial habitat fragmentation is anticipated to be impacted by natural disasters such as earthquakes, landslides, and soil erosion [21,22]. The main earthquake and subsequent aftershocks caused a series of geohazards, such as rock avalanches, landslides, and debris flows [23]. The earthquake seriously resulted in a temporary loss of panda habitat and an upsurge in habitat fragmentation. The Mw 7.9 Wenchuan earthquake occurred in 12 May 2008 Sichuan province [24]. Several investigative teams effectively employed remote sensing data for a rapid assessment of the repercussions of that significant earthquake that occurred within panda habitat in 2008 [25,26].
High-spatial-resolution images have been continuously collected worldwide by the Landsat Earth observation program for the past 50 years [27]. Images are obtained every 16 days by Landsat 1–7 and every 8 days by Landsat 8–9 with a wide swath (185 km) [28]. The Landsat archive currently houses over five million images [29]. The US Geological Survey (USGS) has been providing access to the Landsat archive free of charge since 2008 [27]. The multilayer perceptron (MLP) model, as a group of high-learning-sensitive artificial neural networks (ANN), was proven to be effective in classifying images with higher accuracy compared to traditional classifiers for several decades [30,31,32,33,34]. In addition, the MLP model enhances forest change detection and improves the effectiveness of giant panda habitat classification by providing more direct information of the habitat and its dynamic characteristics [30,35]. Plant leaves demonstrate distinct absorption and reflectivity characteristics concerning red and near-infrared light wavelengths [36]. The spectrum bands of the multi-spectral sensor encompass both visible and infrared wavelengths, contributing to the production of vegetation indices [37]. Two commonly used indices for exploiting the spectral signature of plant materials are simple ratio index (SRI) and normalized difference vegetation index (NDVI) [38].
As an important part of the Giant Panda National Park (GPNP), Jiudingshan Nature Reserve (JNR) has conducted a lot of work on the protection of the giant panda. However, few forms of monitoring work within giant panda habitat, and little is known about the spatio-temporal change of its forest habitat. Therefore, monitoring the giant panda habitat more constantly and effectively is a critical issue. In order to map and monitor more accurately the spatio-temporal change of forest habitat in JNR, our study uses the multilayer perceptron (MLP) model, a group of high-learning-sensitive artificial neural networks (ANN), with the Landsat images from 1997 to 2018, and information data about elevation, slope, aspect, topographic features data, simple ratio index (SRI), and normalized difference vegetation index (NDVI). The results obtained from this study will yield scientific recommendations for monitoring the giant panda habitat, thereby facilitating the development of effective Giant Panda National Park (GPNP) management interventions.
2. Study Area
The study area, Jiudingshan Nature Reserve (JNR), is situated in the upper reaches of the Tuojiang River basin in Sichuan province, China, and forms a constituent part of the Giant Panda National Park (GPNP). JNR was established in 1999, encompassing an area of approximately 581 km2, located on the edge of the Tibetan Plateau, the southwestern region of China (103°47′–104°7′ E; 31°22′–31°42′ N) (Figure 1). It is a part of the mountainous region on the western edge of the Sichuan Basin and serves as a transitional zone from the Sichuan Basin to the Qinghai–Tibet Plateau. Jiudingshan is also the origin of the Tuojiang River, which is a tributary of the Yangtze River. There are no residents living in the nature reserve. There are six townships bordering the reserve, namely Qingping township, Tianchi township, Wudu town, Jinhua township, and Jiulong township in Mianzhu city, and Hongbai town in Shifang city, with a total population of 43,683 and an area of 490.78 km2. Since the implementation of the Grain-for-Green project (GTGP) in 2000, it has received good economic benefits. The local area is mainly focused on industry and forestry, with a per capita annual income of over 4000 yuan. However, due to factors such as resources and natural geographical conditions, the economic status of each township varies. The elevation of JNR is from 1486 m to 4989 m. The annual mean temperature in the area stands at 10.9 °C, with the lowest and highest temperatures recorded as 6.8 °C and 15 °C, respectively. The average annual precipitation in the area amounts to 1300 mm [39,40]. It is primarily covered with three forest types in JNR: broadleaf forest (BF), conifer forest (CF), and mixed conifer and broadleaf forest (MCBF). According to the third and fourth giant panda surveys, there were approximately 13 and 3 individuals living here in 2006 and 2015, respectively [41,42].
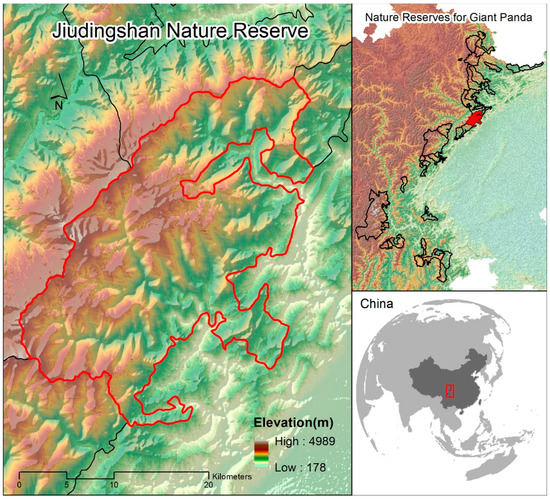
Figure 1.
The location of Jiudingshan Nature Reserve in Sichuan province in China.
Through field surveys of plant communities within Jiudingshan Nature Reserve, a total of 1790 species belonging to 665 genera and 175 families of higher plants have been identified [43]. Among them, there are 122 species of bryophytes belonging to 73 genera and 43 families, 46 species of ferns belonging to 19 genera and 15 families, 22 species of gymnosperms belonging to 10 genera and four families, and 1600 species of angiosperms belonging to 563 genera and 113 families [43]. From the composition of plant families and genera in the reserve, it is evident that certain dominant families and genera are notable. Globally significant families such as Asteraceae, Poaceae, Orchidaceae, and Fabaceae exhibit the highest species in this region; Asteraceae comprises 48 genera, Poaceae comprises 52 genera, Orchidaceae comprises 37 genera, and Fabaceae comprises 22 genera; Additionally, Rosaceae includes 37 genera, while Lamiaceae and Ranunculaceae each encompass 15 and 11 genera, respectively [43].
3. Data and Methods
3.1. Input Layer and Output Layer
The data included Landsat TM/OLI images (6 September 1997, 7 July 2004, 18 July 2008, 1 June 2014, 5 June 2018), which were freely acquired from USGS (accessed on 29 January 2022, www.glovis.usgs.gov). Considering the impact of perpetual clouds and the errors in phenology and seasonality detection, we selected the images in June, July, August, and September. To eliminate cloud effects, we merged the images of 1 June 2014 and 5 June 2018.
Elevation, slope, aspect, and topographic feature data were acquired from the digital elevation model (DEM), which has the 30 m × 30 m spatial resolution. The DEM data are freely provided from the Geospatial Data Cloud site, Computer Network Information Center, Chinese Academy of Sciences (accessed on 29 January 2022, http://www.gscloud.cn). The inclusion of four topographic layers (elevation, slope, aspect, and topographic features) enhances the network training process by providing supplementary information.
All of the data had been radiometric rectified. By performing geometric rectification on the four images and employing 15 ground control points (GCPs), we achieved an accuracy improvement of 1 pixel. The TM/OLI images have been georeferenced, ensuring that they are all registered to the same set of coordinates.
The simple ratio index (SRI) and normalized difference vegetation index (NDVI) were derived from Landsat TM/OLI images of four years (i.e., 1997, 2007, 2008, and 2018). The simple ratio index (SRI) is computed by taking the ratio of the near-infrared and red bands [38]. The NDVI is calculated as the ratio of the disparity between the near-infrared and red bands to their sum [37]. The NDVI spans from −1.0 to +1.0, wherein a value below 0 signifies regions devoid of vegetation, while a value above 0 indicates the presence of vegetation [44].
By stacking the three layers with the standard TM and OLI imagery, we obtained a set of 12 layers for the years 1997, 2004, and 2008, and a set of 14 layers for the year 2018, which served as the input layers for the classification system. The output layer of this study consisted of five distinct classes, namely broadleaf forests (BF), mixed conifer and broadleaf forests (MCBF), conifer forests (CF), shrub and grass (SG), and others (including water area, residences, barren lands, and roads).
3.2. Configuration of Parameters and Software
The classification system in this study employs the MLP model, which is composed of an input layer, a hidden layer, and an output layer. During the training process, pixel values are introduced to the neural network along with corresponding class pixel values. The objective of network training is to construct a model of the data-generating process, enabling the network to generalize and forecast outputs for inputs it has not previously encountered during the testing stage. The most frequently utilized algorithm in remote sensing is back-propagation, employing the generalized delta rule [32]. Network weights are optimized to minimize an error predicated on the discrepancy between the desired and the actual feed-forward network output. This iterative procedure is reiterated until the aggregate system error descends to a predetermined level or upon reaching a specified count of iterations. This threshold, necessitating experimental determination, regulates both the network’s capacity for generalization and the comprehensive training duration.
Both the input and hidden layers consist of 20 nodes, which are determined based on the image from 2008 or the other 3 years. The output layer consists of 10 nodes to accommodate the final five classes. ENVI (Environment for Visualizing Images) is a robust remote sensing image processing software developed by remote sensing scientists and utilizing interactive data language (IDL) [30,45]. We implemented neural network classification in the software ENVI 5.3 with the neural network package installed.
3.3. Landscape Change Monitoring and Landscape Indices
In order to prioritize the monitoring of forest changes, we calculate the annual area of each habitat class, and then analyzed the variations in these habitat types over four stages, covering a period of approximately 20 years. We utilized 9 indices to investigate the attributes of JNR, including changes in area, shape, fragmentation, diversity, and spatial configuration (Table 1). The indices used include number of patches (NP), patch density (PD), largest patch index (LPI), landscape shape index (LSI), mean nearest neighbor distance (MNN), contagion (CONTAG), landscape division index (DIVISION), Shannon’s diversity index (SHDI), and Shannon’s evenness index (SHEI). The indices NP, PD, LPI, LSI, MNN, CONTAG, and DIVISION are used to assess the level of fragmentation in the landscape, while SHDI and SHEI quantify the diversity of the landscape [30,45]. For the analysis, a 30 m x 30 m square moving window was used to specially produce DIVISION and SHDI model diagrams, emphasizing habitat fragmentation and diversity through software FRAGSTATS 4.2.1(Kevin Mcgarigal and Eduard Ene).

Table 1.
The main landscape pattern analysis indices.
4. Results
4.1. MLP Mapped Land Use/Cover Patterns for 20 Years
There are five main types of the study area, which are broadleaf forest (BF), mixed conifer and broadleaf forest (MCBF), conifer forest (CF), shrub and grass (SG), and others (barren lands, landslide, residences, road, and water) (Figure 2 and Figure 3; Table 2). In 1997, the proportion of other land cover types was the lowest (6.03%), and that of mixed conifer and broadleaf forest (MCBF) was the largest (35.95%) (Figure 2a and Figure 3a). In 2004, compared to 1997, the proportion of coniferous forest (CF) in the total area increased from 22.01% to 27.71%, while that of broadleaf forest (BF) decreased from 18.82 to 11.99% (Figure 2b and Figure 3b). In 2008, there was a notable surge in the proportion of the other land cover types, which rose sharply to 32.10%, while the proportion of shrub and grass (SG) remained relatively stable. (Figure 2c and Figure 3c). However, the proportions of broadleaf forest (BF), conifer forest (CF), and mixed conifer and broadleaf forest (MCBF) all decreased, and the proportion of mixed forest (MF) decreased to 21.55% (Figure 2c and Figure 3c). Ten years later, in 2018, the study area witnessed a gradual recovery of vegetation, marked by a significant increase in the area of mixed conifer and broadleaf forest (MCBF), and a significant decrease in the proportion of other types (Figure 2d and Figure 3d). The findings demonstrate that the land cover type in the area underwent significant changes due to the Wenchuan earthquake, causing severe repercussions on the giant panda habitat. Nevertheless, by 2018, the habitat condition showed signs of recovery.
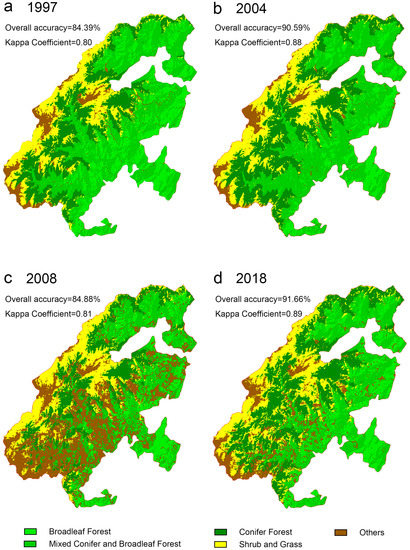
Figure 2.
Land use/cover classifications were performed in Jiudingshan Nature Reserve using a multilayer perceptron model for the years 1997 (a), 2004 (b), 2008 (c), and 2018 (d).
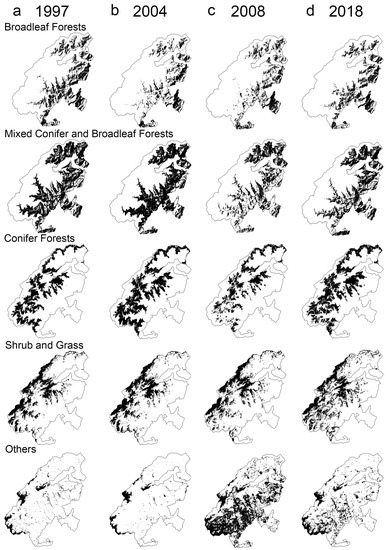
Figure 3.
Twenty years of evolution of Jiudingshan Nature Reserve habitat types.
Table 2.
Areas and percentages for five types of land use/cover in Jiudingshan Nature Reserve for years of 1997, 2004, 2008, and 2018.
4.2. Habitat Change Detection of JNR
Figure 4 shows the area change trend of five land use/cover types in the study area during 1997–2018, and their changes are different in the four periods (Figure 4). In terms of area, the areas of mixed conifer and broadleaf forest, coniferous forest, shrub, and grassland increased by 1.06%, 5.70%, 1.18%, respectively, from 1997 to 2004, while the area of broadleaf forest and others decreased by −6.83% and −1.11%. From 2004 to 2008, the type of broadleaf forest increased by 0.43% and others increased egregiously by 27.18%, while the areas of mixed conifer and broadleaf forest, coniferous forest, and shrub and grassland declined by −15.46%, −10.96%, −1.19%, respectively. Among them, coniferous forest and mixed conifer and broadleaf forest decreased the most, from 21,516 ha and 16,114 ha in 2004 to 12,528 ha and 9741 ha in 2008, by −15.46%, −10.96%, and −1.19%, respectively. From 2008 to 2018, the type of others (including water area, residences, barren lands, and roads) decreased significantly by −19.36%. Meanwhile, the area of conifer forest increased from 9741 ha in 2008 to 15,496 ha in 2018, almost approaching 16,114 ha in 2004. Compared with 2008, the area of mixed conifer and broadleaf forest in 2018 increased significantly by 9.90%, but it was still lower than that in 2004, only 14,988 ha (Figure 4, Table 2).
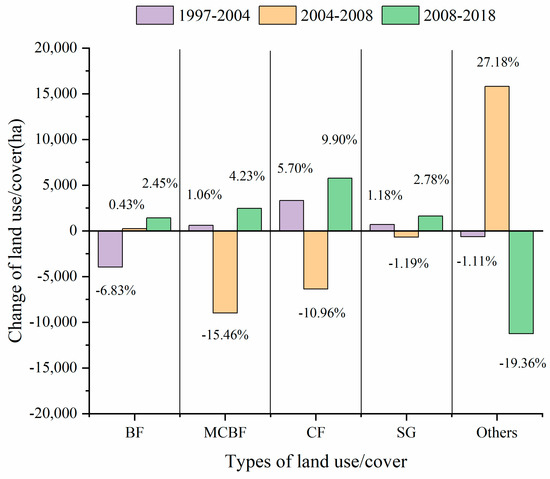
Figure 4.
Change of areas and percentages of 5 classes between 1997–2004, 2004–2008, and 2008–2018 in Jiudingshan Nature Reserve. CF stands for “coniferous forest”, MCBF stands for “mixed conifer and broadleaf forests”, BF stands for “broadleaf forests”, SG stands for “shrub and grass”, and others stands for “water area, residence, barren lands, and roads”.
From 1997 to 2018, the proportion of conifer forests increased from 22.01% to 26.65%, broadleaf forest decreased from 18.82% to 14.82%, mixed conifer and broadleaf forest decreased from 35.95% to 25.78%, shrub and grass increased from 17.19% to 19.97, and others increased from 6.03% to 12.75% (Figure 4, Table 2). Overall, the proportion and area of broadleaf forest, and shrub and grass fluctuated little in the four periods from 1997 to 2018. Due to the impact of the 2008 earthquake, the proportion and area of mixed conifer and broadleaf forest, conifer forest, and others fluctuated dramatically, with the proportion of mixed conifer and broadleaf forest falling from 37.00% to 21.55%, and conifer forest from 27.71% to 16.75%. By 2018, conifer forest had become the most dominant land cover type in the study area (26.65%), followed by mixed conifer and broadleaf forest (25.78%), shrub and grass (19.97%), broadleaf forest (14.86%), and others (12.75%) (Table 2).
4.3. Patterns of Landscape Indices
The indices of NP, PD, LPI, LSI, MNN, CONTAG, DIVISION, SHDI, and SHEI all can provide quantitative information of fragmentation. It was in 2008 that NP and PD reached their peak values, while MNN reached its lowest values; in addition, LPI, LSI, and DIVISION attained their highest values in 2018, demonstrating the utmost degree of fragmentation (Table 3, Figure 5).
Table 3.
Landscape indices for the years of 1997, 2004, 2008, and 2018 in Jiudingshan Nature Reserve.
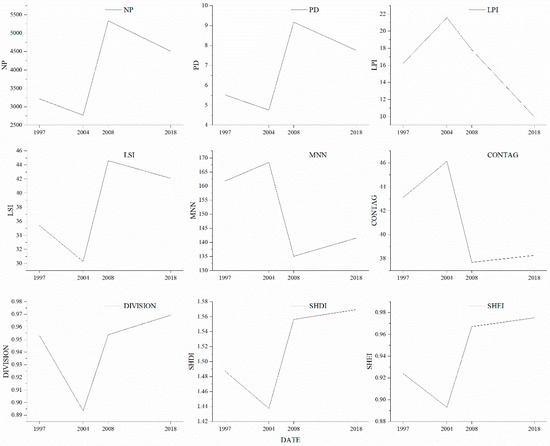
Figure 5.
Change of landscape indices for the years of 1997, 2004, 2008, and 2018 in Jiudingshan Nature Reserve in Sichuan, China. NP stands for “number of patches”, PD stands for “patch density”, LPI stands for “largest patch index”, LSI stands for “landscape shape index”, MNN stands for “mean nearest neighbor distance”, CONTAG stands for “contagion”, DIVISION stands for “landscape division index”, SHDI stands for “Shannon’s diversity index”, and SHEI stands for “Shannon’s evenness index”.
Based on the observed changes in NP and PD, it can be concluded that MNN will undergo a continuous decrease in the coming period. The LSI values were at their minimum in 2004 but showed a significant increase, reaching their peak in 2008. The peak of LPI was observed in 2004, followed by a gradual decrease in subsequent years. The lowest values of SHDI, DIVISION, and SHEI were observed in 2004, but they showed an upward trend in 2008 and reached their highest values in 2018, suggesting that the fragmentation issue in the giant panda habitat has been improving since the Wenchuan earthquake (Table 3, Figure 5).
5. Discussion
5.1. MLP: A Powerful Classification Model
For decades, the multilayer perceptron (MLP) model, as a group of artificial neural networks (ANN), has consistently demonstrated its effectiveness in achieving higher image classification accuracy compared to traditional classifiers. The utilization of remote sensing is instrumental in promptly equipping decision makers with essential information in the aftermath of environmental catastrophes [30,46,47,48,49]. The artificial neural network (ANN), as an information-processing paradigm, incorporates the densely interconnected, parallel structure of the brain’s processing system, enabling it to effectively model complex relationships between variables [50,51]. It exhibits a unique advantage in supervised classification by delivering accurate results using a smaller amount of training data in comparison to the maximum likelihood classifier [52]. Liu achieved an overall mapping accuracy of over 84% for Foping Nature Reserve by utilizing only 50 ground truthing points (out of a total of 160 points) for training and classification purposes [53]. In our study, using the MLP model, the integrated Landsat ETM/OLI images were classified and land cover changes were assessed from 1997 to 2018 in JNR, and the mapping accuracy was 84.4% in 1997, 84.4% in 2008, and 83.6% in 2016. The ability of the multilayer perceptron (MLP) model to handle complex image features and adapt to diverse datasets contributes to its effectiveness in image classification.
5.2. Dynamic Change of Forest Landscape in JNR
Our findings highlight a significant increase by 5.70% (Figure 4) in the coverage and proportion of mixed conifer and broadleaf forest (MCBF) during the period of 1997 to 2004, indicating the sustained implementation of the ban (NFCP and GTGP) on commercial logging and the successful outcomes of heightened protection endeavors. In relatively steep mountains with elevations ranging from 700 m to 3500 m, there exist 28 species belonging to seven general categories of staple food bamboos, including variant species [41]. Seven general categories are Phyllostachys, Chimonobambusa, Qiongzhuea, Fargesia, Yushania, Bashania, and Indocalamus. These bamboos are distributed under the canopy of various forests such as subalpine dark coniferous forest, mountain dark coniferous forest, mountain mixed conifer and broadleaf forest, and others [41,54]. The expansion of coniferous forest and mixed conifer and broadleaf forest areas signifies a significant improvement in the panda habitat. The ongoing efforts in implementing conservation policies have shown promising results in terms of regenerating forest cover and preserving the integrity of natural forests [14,15,55]. In 2008, conifer forests (CF) and mixed conifer and broadleaf forest (MCBF), closely related to bamboo, the staple food of giant pandas, were the most severely damaged in the study area, with a significant decrease in area (Figure 4). Affected by the Wenchuan earthquake in 2008, regional vegetation suffered serious damage [48]. This suggests that the earthquake had a significant impact on panda habitat, which has been confirmed in other studies [56]. In 2018, conifer forest (CF), shrub and grass (SG), and broadleaved forest (BF) had recovered to the level of 2004, indicating that the vegetation recovered rapidly after the earthquake [57], and that the habitat of the giant panda has recovered from the effects of the earthquake. In addition, our analysis of the landscape index pattern of giant panda habitat from 1997 to 2018 revealed that the catastrophic Wenchuan earthquake had a significant adverse impact on vegetation. Despite a decade having passed since the earthquake, fragmentation still persists. The results of our study demonstrated the considerable influence of restoration initiatives on the recovery of forests after the catastrophic Wenchuan earthquake. The earthquake had a significant detrimental effect on vegetation, particularly forested areas, and the recovery and regrowth of the forest are estimated to necessitate a substantial timeframe spanning several years [26,58,59]. Despite the short-term improvements in the status of the giant panda due to rigorous and proactive protection measures, the long-term negative impacts from large-scale socio-economic development and numerous geohazards cannot be overlooked [60,61].
6. Conclusions
The multilayer perceptron model (MLP), coupled with a highly sensitive learning algorithm, is utilized to classify land cover types and monitor changes in the forest habitat within the Jiudingshan Nature Reserve (JNR) from 1997 to 2018. The results of our study show a significant increase in both the extent and proportion of mixed conifer and broadleaf forest from 1997 to 2004, signifying the continued implementation of the ban (NFCP and GTGP) on commercial logging and the positive results of heightened conservation endeavors. The expansion of coniferous forest and mixed conifer and broadleaf forest areas indicates a substantial enhancement in the panda habitat. The ongoing implementation of conservation policies has yielded promising outcomes in terms of regenerating forest cover and preserving the integrity of natural forests. Our study results highlight the substantial influence of restoration efforts on forest recovery after the catastrophic Wenchuan earthquake in 2008. The seismic activity had a notable adverse impact on vegetation, especially in forested regions, and it is estimated that the recovery and regrowth of the forest will necessitate a significant time period spanning several years. Although the forest has made progress in its recovery over the course of several years, the issue of fragmentation continues to be a concern, although there have been some positive developments. Despite the initial improvements in the giant panda’s situation as a result of rigorous and proactive protective measures, it is crucial to acknowledge the potential long-term negative impacts caused by extensive socio-economic development and numerous geohazards. Therefore, long-term monitoring and effective management are essential for the restoration and preservation of the Giant Panda National Park (GPNP) and the giant panda habitat in the future.
Regarding data volume and vegetation species information, our study possesses certain limitations. Subsequent investigations could enhance the scope by integrating more exhaustive data, encompassing meticulous details about vegetation species, alongside higher-resolution LiDAR (Light Detection and Ranging) data. Such an augmentation would serve to bolster the comprehensive surveillance and preservation endeavors concerning both the Giant Panda National Park (GPNP) and the habitation of giant pandas.
Author Contributions
Conceptualization, J.W., D.Z. and J.L.; methodology, D.Z., P.P. and J.L.; software, D.Z., Y.F. and S.Z.; validation, X.L., Q.S., D.Y. and F.Z.; formal analysis, D.Z. and X.L.; investigation, J.W. and X.L.; resources, J.W. and D.Z.; data curation, Q.S., D.Y., F.Z., Y.F. and S.Z.; writing—original draft preparation, J.W.; writing—review and editing, J.W. and D.Z.; visualization, D.Z. and Y.F.; supervision, P.P. and J.L. All authors have read and agreed to the published version of the manuscript.
Funding
This research was funded by National Park Research Center (Grant No. GJGY2022-YB007), Tuojiang River Basin High-Quality Development Research Center (Grant No. TJGZL2022-19) and Henan Province Joint Fund Project of Science and Technology (Grant No. 222103810097).
Data Availability Statement
To obtain data for our study, please contact the authors via email.
Conflicts of Interest
The authors declare no conflict of interest.
References
- Laurance, W.F.; Lovejoy, T.E.; Vasconcelos, H.L.; Bruna, E.M.; Didham, R.K.; Stouffer, P.C.; Gascon, C.; Bierregaard, R.O.; Laurance, S.G.; Sampaio, E. Ecosystem decay of Amazonian forest fragments: A 22-year investigation. Conserv. Biol. 2002, 16, 605–618. [Google Scholar] [CrossRef]
- Mollicone, D.; Achard, F.; Federici, S.; Eva, H.D.; Grassi, G.; Belward, A.; Raes, F.; Seufert, G.; Stibig, H.-J.; Matteucci, G. An incentive mechanism for reducing emissions from conversion of intact and non-intact forests. Clim. Change 2007, 83, 477–493. [Google Scholar] [CrossRef]
- Stolton, S.; Shadie, P.; Dudley, N. IUCN WCPA best practice guidance on recognising protected areas and assigning management categories and governance types. In Best Practice Protected Area Guidelines Series; IUCN: Gland, Switzerland, 2013; Volume 21, pp. 1–31. [Google Scholar]
- Sellars, R.W. Preserving Nature in the National Parks: A History: With A New Preface and Epilogue; Yale University Press: New Haven, CT, USA, 2009. [Google Scholar]
- European Environment Agency. Protected Areas in Europe—An Overview; No. 5; European Environment Agency: Copenhagen, Denmark, 2012; p. 130.
- Hull, V.; Zhang, J.; Huang, J.; Zhou, S.; Vina, A.; Shortridge, A.; Li, R.; Liu, D.; Xu, W.; Ouyang, Z.; et al. Habitat Use and Selection by Giant Pandas. PLoS ONE 2016, 11, e0162266. [Google Scholar] [CrossRef] [PubMed]
- Hu, J.; Schaller, G.; Pan, W.; Zhu, J. The Giant Panda of Wolong; Sichuan Scientific and Technological Publishing House: Chengdu, China, 1985. (In Chinese) [Google Scholar]
- Loucks, C.J.; Lü, Z.; Dinerstein, E.; Wang, H.; Olson, D.M.; Zhu, C.; Wang, D. Giant Pandas in a Changing Landscape. Science 2001, 294, 1465. [Google Scholar] [CrossRef]
- Bearer, S.; Linderman, M.; Huang, J.; An, L.; He, G.; Liu, J. Effects of fuelwood collection and timber harvesting on giant panda habitat use. Biol. Conserv. 2008, 141, 385–393. [Google Scholar] [CrossRef]
- Reid, D.G.; Jinchu, H. Giant Panda Selection Between Bashania fangiana Bamboo Habitats in Wolong Reserve, Sichuan, China. J. Appl. Ecol. 1991, 28, 228–243. [Google Scholar] [CrossRef]
- Liu, X.; Cheng, X.; Skidmore, A.K. Potential solar radiation pattern in relation to the monthly distribution of giant pandas in Foping Nature Reserve, China. Ecol. Model. 2011, 222, 645–652. [Google Scholar] [CrossRef]
- Liu, J.; Ouyang, Z.; Taylor, W.W.; Groop, R.; Tan, Y.; Zhang, H. A Framework for Evaluating the Effects of Human Factors on Wildlife Habitat: The Case of Giant Pandas. Conserv. Biol. 1999, 13, 1360–1370. [Google Scholar] [CrossRef]
- Swaisgood, R.; Wang, D.; Wei, F. Ailuropoda melanoleuca: The IUCN Red List of Threatened Dpecies. International Union for Conservation of Nature. T712A45033386. 2016. Available online: http://www.iucnredlist.org/details/712/0 (accessed on 29 January 2022).
- Liu, J.; Li, S.; Ouyang, Z.; Tam, C.; Chen, X. Ecological and socioeconomic effects of China’s policies for ecosystem services. Proc. Natl. Acad. Sci. USA 2008, 105, 9477–9482. [Google Scholar] [CrossRef]
- Li, Y.; Vina, A.; Yang, W.; Chen, X.; Zhang, J.; Ouyang, Z.; Liang, Z.; Liu, J. Effects of Conservation Policies on Forest Cover Change in Giant Panda Habitat Regions, China. Land Use Policy 2013, 33, 42–53. [Google Scholar] [CrossRef]
- Kang, D. A review of the impacts of four identified major human disturbances on the habitat and habitat use of wild giant pandas from 2015 to 2020. Sci. Total Environ. 2021, 763, 142975. [Google Scholar] [CrossRef]
- Xu, Y.; Liu, R.; Xue, C.; Xia, Z. Ecological Sensitivity Evaluation and Explanatory Power Analysis of the Giant Panda National Park in China. Ecol. Indic. 2023, 146, 109792. [Google Scholar] [CrossRef]
- Huang, Q.; Fei, Y.; Yang, H.; Gu, X.; Songer, M. Giant Panda National Park, a step towards streamlining protected areas and cohesive conservation management in China. Glob. Ecol. Conserv. 2020, 22, e00947. [Google Scholar] [CrossRef]
- Kang, D.; Li, J. Premature downgrade of panda’s status. Science 2016, 354, 295. [Google Scholar] [CrossRef]
- Liu, J. Promises and perils for the panda. Science 2015, 348, 642. [Google Scholar] [CrossRef]
- Xu, W.; Vina, A.; Kong, L.; Pimm, S.L.; Zhang, J.; Yang, W.; Xiao, Y.; Zhang, L.; Chen, X.; Liu, J.; et al. Reassessing the conservation status of the giant panda using remote sensing. Nat. Ecol. Evol. 2017, 1, 1635–1638. [Google Scholar] [CrossRef]
- Swaisgood, R.R.; Wang, D.; Wei, F. Panda Downlisted but not Out of the Woods. Conserv. Lett. 2018, 11, e12355. [Google Scholar] [CrossRef]
- Cui, P.; Chen, X.-Q.; Zhu, Y.-Y.; Su, F.-H.; Wei, F.-Q.; Han, Y.-S.; Liu, H.-J.; Zhuang, J.-Q. The Wenchuan Earthquake (May 12, 2008), Sichuan Province, China, and resulting geohazards. Nat. Hazards 2009, 56, 19–36. [Google Scholar] [CrossRef]
- der Hilst, B. A geological and geophysical context for the Wenchuan earthquake of 12 May 2008, Sichuan, People’s Republic of China. GSA Today 2008, 18, 5. [Google Scholar]
- Wang, D.; Li, S.; Sun, S.; Wang, H.; Chen, A.; Li, S.; Li, J.; Lu, Z. Turning earthquake disaster into long-term benefits for the panda. Conserv. Biol. 2008, 22, 1356–1360. [Google Scholar] [CrossRef] [PubMed]
- Xu, W.; Wang, X.; Ouyang, Z.; Zhang, J.; Li, Z.; Xiao, Y.; Zheng, H. Conservation of giant panda habitat in South Minshan, China, after the May 2008 earthquake. Front. Ecol. Environ. 2009, 7, 353–358. [Google Scholar] [CrossRef]
- Wulder, M.A.; Roy, D.P.; Radeloff, V.C.; Loveland, T.R.; Anderson, M.C.; Johnson, D.M.; Healey, S.; Zhu, Z.; Scambos, T.A.; Pahlevan, N.; et al. Fifty years of Landsat science and impacts. Remote Sens. Environ. 2022, 280, 113195. [Google Scholar] [CrossRef]
- Hemati, M.; Hasanlou, M.; Mahdianpari, M.; Mohammadimanesh, F. A Systematic Review of Landsat Data for Change Detection Applications: 50 Years of Monitoring the Earth. Remote Sens. 2021, 13, 2869. [Google Scholar] [CrossRef]
- Wulder, M.A.; White, J.C.; Loveland, T.R.; Woodcock, C.E.; Belward, A.S.; Cohen, W.B.; Fosnight, E.A.; Shaw, J.; Masek, J.G.; Roy, D.P. The global Landsat archive: Status, consolidation, and direction. Remote Sens. Environ. 2016, 185, 271–283. [Google Scholar] [CrossRef]
- Liu, X.; Wu, P.; Shao, X.; Songer, M.; Cai, Q.; Zhu, Y.; He, X. Spatiotemporally monitoring forest landscape for giant panda habitat through a high learning-sensitive neural network in Guanyinshan Nature Reserve in the Qinling Mountains, China. Environ. Earth Sci. 2017, 76, 589. [Google Scholar] [CrossRef]
- Satir, O.; Erdogan, M.A. Monitoring the land use/cover changes and habitat quality using Landsat dataset and landscape metrics under the immigration effect in subalpine eastern Turkey. Environ. Earth Sci. 2016, 75, 1118. [Google Scholar] [CrossRef]
- Rumelhart, D.E.; Hinton, G.E.; Williams, R.J. Learning internal representations by error propagation. In Parallel Distributed Processing: Explorations in the Microstructure of Cognition; Rumelhart, D.E., McClelland, J.L., the PDP Research Group, Eds.; MIT Press: Cambridge, MA, USA, 1986; pp. 318–362. [Google Scholar]
- Benediktsson, J.A.; Swain, P.H.; Ersoy, O.K. Neural network approaches versus statistical methods in classification of multisource remote sensing data. In Proceedings of the IEEE Transactions on Geoscience and Remote Sensing, Vancouver, BC, Canada, 10–14 July 1989. [Google Scholar] [CrossRef]
- Bischof, H.; Schneider, W.; Pinz, A.J. Multispectral classification of Landsat-images using neural networks. IEEE Trans. Geosci. Remote Sens. 1992, 30, 482–490. [Google Scholar] [CrossRef]
- Gopal, S.; Woodcock, C. Remote sensing of forest change using artificial neural networks. IEEE Trans. Geosci. Remote Sens. 1996, 34, 398–404. [Google Scholar] [CrossRef]
- Xu, P.; Fang, W.; Zhou, T.; Zhao, X.; Luo, H.; Hendrey, G.; Yi, C. Spatial Upscaling of Tree-Ring-Based Forest Response to Drought with Satellite Data. Remote Sens. 2019, 11, 2344. [Google Scholar] [CrossRef]
- Brown, M.E.; Pinzón, J.E.; Didan, K.; Morisette, J.T.; Tucker, C.J. Evaluation of the consistency of long-term NDVI time series derived from AVHRR, SPOT-vegetation, SeaWiFS, MODIS, and Landsat ETM+ sensors. IEEE Trans. Geosci. Remote Sens. 2006, 44, 1787–1793. [Google Scholar] [CrossRef]
- Pinty, B.; Verstraete, M.M. GEMI: A non-linear index to monitor global vegetation from satellites. Vegetatio 1992, 101, 15–20. [Google Scholar] [CrossRef]
- Min, Z.; Hong-gui, L.; BO, F.; Xiao-gang, Y.; Xiong, Z.; Zu-ji, Z. Diversity Survey on Mammals Resources in Jiudingshan Nature Reserve of Sichuan Province. J. Sichuan For. Sci. Technol. 2015, 36, 25–29. [Google Scholar]
- Zheng, X.; Li, B.; Jiang, G.; Wang, Z. The community structure of small mammals in Jiudingshan Nature Reserve, Sichuan. J. Sichuan For. Sci. Technol. 2009, 30, 69–71. [Google Scholar]
- State Forestry Administration. The 3rd National Survey Report on Giant Panda in China; Science Press: Beijing, China, 2006.
- Sichuan Forestry Department. The 4th Survey Report on Giant Panda in Sichuan Province; Sichuan Science and Technology Press: Chengdu, China, 2015.
- Zhao, M.; Yu, X.; Zheng, X.; Wang, Z.; Ji, X.; Feng, B. Floristic classification of plant in Jiuding Mountain Nature Reserve in Sichuan Province. J. For. Eng. 2011, 25, 44–46. [Google Scholar] [CrossRef]
- Brehaut, L.; Danby, R.K. Inconsistent relationships between annual tree ring-widths and satellite-measured NDVI in a mountainous subarctic environment. Ecol. Indic. 2018, 91, 698–711. [Google Scholar] [CrossRef]
- Zhang, C.; Wu, S.; Zhao, D.; Guo, Q.; Peng, P. 20 Years of Evolutionary Analysis of Giant Panda Habitat Using Ecological Landscape Patterns of Xiaohegou Nature Reserve. Pol. J. Environ. Stud. 2015, 24, 1401–1411. [Google Scholar] [CrossRef]
- Tang, P.; Chen, F.; Guo, H.; Tian, B.; Wang, X.; Ishwaran, N. Large-Area Landslides Monitoring Using Advanced Multi-Temporal InSAR Technique over the Giant Panda Habitat, Sichuan, China. Remote Sens. 2015, 7, 8925–8949. [Google Scholar] [CrossRef]
- Jiang, W.-G.; Jia, K.; Wu, J.-J.; Tang, Z.-H.; Wang, W.-J.; Liu, X.-F. Evaluating the Vegetation Recovery in the Damage Area of Wenchuan Earthquake Using MODIS Data. Remote Sens. 2015, 7, 8757–8778. [Google Scholar] [CrossRef]
- Liu, X.; Jiang, W.; Li, J.; Wang, W. Evaluation of the Vegetation Coverage Resilience in Areas Damaged by the Wenchuan Earthquake Based on MODIS-EVI Data. Sensors 2017, 17, 259. [Google Scholar] [CrossRef]
- Fan, X.; Domènech, G.; Scaringi, G.; Huang, R.; Xu, Q.; Hales, T.C.; Dai, L.; Yang, Q.; Francis, O. Spatio-temporal evolution of mass wasting after the 2008 Mw 7.9 Wenchuan earthquake revealed by a detailed multi-temporal inventory. Landslides 2018, 15, 2325–2341. [Google Scholar] [CrossRef]
- Mas, J.F.; Flores, J.J. The application of artificial neural networks to the analysis of remotely sensed data. Int. J. Remote Sens. 2008, 29, 617–663. [Google Scholar] [CrossRef]
- Mas, J. Mapping land use/cover in a tropical coastal area using satellite sensor data, GIS and artificial neural networks. Estuar. Coast. Shelf Sci. 2004, 59, 219–230. [Google Scholar] [CrossRef]
- Paola, J.D.; Schowengerdt, R.A. A detailed comparison of backpropagation neural network and maximum-likelihood classifiers for urban land use classification. IEEE Trans. Geosci. Remote Sens. 1995, 33, 981–996. [Google Scholar] [CrossRef]
- Liu, X. Mapping and Modelling the Habitat of Giant Pandas in Foping Nature Reserve, China; Wageningen University and Research: Wageningen, The Netherlands, 2001. [Google Scholar]
- Zhao, D.; Wang, J.; Chen, W.; Liu, X.a.; Zhang, C.; Peng, P. How Potassium Content in Soil Shapes Giant Panda Distribution. Pol. J. Environ. Stud. 2018, 28, 973–979. [Google Scholar] [CrossRef] [PubMed]
- Kong, L.; Xu, W.; Zhang, L.; Gong, M.; Xiao, Y.; Ouyang, Z. Habitat conservation redlines for the giant pandas in China. Biol. Conserv. 2017, 210, 83–88. [Google Scholar] [CrossRef]
- Yu, H.; Zhao, Y.; Ma, Y.; Sun, Y.; Zhang, H.; Yang, S.; Luo, Y. A remote sensing-based analysis on the impact of Wenchuan Earthquake on the core value of World Nature Heritage Sichuan Giant Panda Sanctuary. J. Mt. Sci. 2011, 8, 458. [Google Scholar] [CrossRef]
- Sun, X.-f.; Yuan, L.-g.; Zhou, Y.-z.; Shao, H.-y.; Li, X.-f.; Zhong, P. Spatiotemporal change of vegetation coverage recovery and its driving factors in the Wenchuan earthquake-hit areas. J. Mt. Sci. 2021, 18, 2854–2869. [Google Scholar] [CrossRef]
- Zhang, J.; Hull, V.; Huang, J.; Yang, W.; Zhou, S.; Xu, W.; Huang, Y.; Ouyang, Z.; Zhang, H.; Liu, J. Natural recovery and restoration in giant panda habitat after the Wenchuan earthquake. For. Ecol. Manag. 2014, 319, 1–9. [Google Scholar] [CrossRef]
- Kou, C.; Xu, Y.-Y.; Ke, C.-Q.; He, Y.-T. Impact of Wenchuan earthquake on the giant panda habitat in Wolong National Nature Reserve, China. J. Appl. Remote Sens. 2014, 8, 083507. [Google Scholar] [CrossRef]
- Lu, T.; Shi, F.; Sun, G.; Luo, Y.; Wang, Q.; Wu, Y.; Wu, N. Reconstruction of the Wenchuan Earthquake-Damaged Ecosystems: Four Important Questions. Chin. J. Appplied Environ. Biol. 2010, 16, 301–304. [Google Scholar] [CrossRef]
- Ma, B.; Lei, S.; Qing, Q.; Wen, Y. Should the Endangered Status of the Giant Panda Really Be Reduced? The Case of Giant Panda Conservation in Sichuan, China. Animals 2018, 8, 69. [Google Scholar] [CrossRef] [PubMed]


Disclaimer/Publisher’s Note: The statements, opinions and data contained in all publications are solely those of the individual author(s) and contributor(s) and not of MDPI and/or the editor(s). MDPI and/or the editor(s) disclaim responsibility for any injury to people or property resulting from any ideas, methods, instructions or products referred to in the content. |
© 2023 by the authors. Licensee MDPI, Basel, Switzerland. This article is an open access article distributed under the terms and conditions of the Creative Commons Attribution (CC BY) license (https://creativecommons.org/licenses/by/4.0/).