Article

Dynamic Analysis of Provincial Forest Carbon Storage Efficiency in China Based on DEA Malmquist Index

1
School of Resources & Environmental Engineering, Wuhan University of Technology, Wuhan 430070, China
2
Changjiang River Scientific Research Institute of Changjiang Water Resources Commission, Wuhan 430010, China
*
Authors to whom correspondence should be addressed.
Forests 2023, 14(8), 1629; https://doi.org/10.3390/f14081629
Submission received: 6 July 2023 / Revised: 7 August 2023 / Accepted: 10 August 2023 / Published: 12 August 2023
(This article belongs to the Section Forest Ecology and Management)

Abstract

:
Global climate change caused by greenhouse gas emissions has a direct impact on the sustainable development of human society and has gained widespread concern globally. Biological carbon sequestration measures, mainly forests, are conducive to improving the ecological carbon sink capacity and play an important role in mitigating global climate change. Therefore, assessing the efficiency of forest carbon storage (FCS) is key. In view of the lack of evaluation methods for forest carbon storage efficiency (FCSE) on a large spatial scale and long time series, a method based on Data Envelopment Analysis (DEA) was proposed in this paper. The FCS was calculated using the forest storage expansion method, and the FCSE was calculated using the DEA-Malmquist index to solve the dynamic balance between regional forestry economic input and carbon storage output efficiency. The FCSE in Chinese provinces was analyzed. The results showed that from 1999 to 2018, China’s FCS increased annually, from 7558.34 million tons to 9476.73 million tons, and the spatial distribution pattern of total FCS was always different among regions. The average TFP value of FCSE was 1.089, which proves that the FCSE in China has been on the rise in the past 20 years, but the efficiency growth differed between provinces and was affected by different factors such as technical efficiency and technological progress.

1. Introduction

Global warming will have complex and far-reaching impacts on Earth and human beings [1]. Mitigating climate change has become a serious challenge worldwide, and the concentration of carbon dioxide (CO2) in atmosphere has a huge impact on the climate [2,3,4]. After the adoption of the Paris Agreement on Climate Change, 136 countries proposed the goal of net zero emissions or carbon neutrality. China is a major CO2 emitter, with emissions from energy and processing reaching 11947Mt in 2021 (Figure S1), accounting for 32.95% of the world’s total [5], and its carbon emissions and carbon neutralization level have a significant impact on achieving the global temperature control goal. In September 2020, China put forward the dual carbon target of “striving to reach the peak of CO2 emissions by 2030 and strive to achieve carbon neutrality by 2060”. In the past few decades, carbon sequestration in terrestrial ecosystems has played an important role in offsetting carbon dioxide emissions [6,7,8,9,10,11]. Among all types of terrestrial ecosystems, forest carbon sequestration was the strongest, accounting for 68%–71% [12,13,14,15]. Further research on the mechanism of forest carbon sequestration is conducive to providing theoretical support for China to achieve carbon neutrality, thus contributing to climate change mitigation. Many scholars and researchers are increasingly concerned about the role of forests in carbon storage [16,17,18]. Due to the scarcity of available land resources, when the forest area reaches a certain extent, strengthening the management of the existing forest land becomes an effective way to increase the carbon sink [19]. The assessment and dynamic analysis of forest carbon storage efficiency (FCSE) will help China’s provinces clarify the relationship between forestry economic input and forest carbon storage output, better understand the provincial differences and temporal and spatial changes in FCSE, and reveal the main constraints and driving factors affecting FCSE in each province.
FCSE involves taking forest management as a system, transforming forest carbon fixation into an economic problem, and seeking a breakthrough from its input–output mechanism [20]. Currently, there are various research methods for estimating ecological efficiency. Commonly used evaluation methods include life-cycle assessment (LCA), index evaluation, and Data Envelopment Analysis (DEA). As an environmental management tool, LCA is mainly used to assess the environmental load caused by products or production activities and to evaluate the impact of energy and material utilization and waste emissions through quantitative research on the environmental emissions of energy and substances. However, this method, which needs to consider the entire production process, is costly and time-consuming, and it is difficult to obtain a large amount of reliable data, which are still under development. There are no widely accepted uniform standards, and the index evaluation method is relatively simple to operate. It is a method of using multiple indicators to evaluate the evaluation objects in many aspects. However, this method is significantly affected by subjectivity, and different factor selection methods produce different evaluation results. DEA, a non-parametric method, has been increasingly used as it does not need to determine the form of the production function in advance, allows the existence of inefficiency, and is easy to decompose [21]. DEA is an effective model for evaluating the relative efficiency of multiple decision-making units. The relative efficiency of each unit can be evaluated by analyzing the input and output index data. Thus far, research on low-carbon efficiency based on DEA has made certain progress in theory and practice [22,23,24]. However, the traditional DEA method can only evaluate section data and not process time series information. The Malmquist index improves the traditional DEA model to measure the dynamic change in efficiency by dividing total factor productivity (TFP) [25]. This indicator is used to measure production efficiency and is significant in all industries [26,27,28]. It involves a wide range of factors, including technical and nontechnical factors. The improvement in TFP is the result of the joint influence of technical progress, technical efficiency, and other factors [29].
Some scholars have applied the Douglas production function principle to the DEA-Malmquist index research and divided the input into labor, land, and capital elements. The FCSE is evaluated by taking the completed amount of forestry fixed assets investment, the number of employees of the forestry system at the end of the year, and the forest area as the input factors and the FCSE as the output factor [30]. Three types of accounting methods are widely used to estimate forest carbon storage: sample field measurement, remote sensing, and biomass. The traditional sampling method is more accurate, but large-scale sampling surveys consume considerable manpower and material resources and are difficult to implement at the urban scale. The remote sensing method uses remotely sensed images to obtain various vegetation state parameters and combines them with ground surveys to estimate forest carbon storage on a large spatial scale and long time series. However, this method also requires the measured data of sample plots, which are still difficult to obtain [31,32,33,34,35]. The biomass method uses forest biomass characteristics to estimate forest carbon storage [36,37,38,39]. The estimation of forest biomass is mainly based on the volume of forest, which is divided into the biomass model of single tree volume and the biomass model of forest unit hectare volume [40,41]. Among them, the biomass model based on unit hectare volume has obvious advantages in using inventory data to estimate national and regional biomass, such as the estimation of forest carbon stocks in the central Himalayas in India [42].
On the one hand, the change in FCSE has a long time sequence, and the static efficiency research method cannot analyze the dynamic change in FCSE, and cannot provide the basis for local governments to invest in forestry. On the other hand, the method that needs to be combined with the measured data of the sample site consumes a lot of manpower and material resources, and cannot be applied on a large spatial scale.
To solve the problem of lack of FCSE evaluation methods with large spatial scales and long time series, countries and regions with forestry statistics can use the forest volume expansion method and DEA-Malmquist index to effectively evaluate FCSE. In this study, the forest stock expansion method was used to obtain the carbon stock of China’s provincial forests during the 6th to 9th forest inventories. On this basis, the DEA-Malmquist index is used to evaluate the carbon storage efficiency of China’s provincial forests at each stage, which provides development ideas for governments at all levels to formulate more reasonable forestry economic policies and has strong practical significance.

2. Study Area and Data

2.1. Study Area

Due to the large differences in the natural resource conditions affecting forest growth, such as climate and terrain in different regions of China, 34 provinces (cities and autonomous regions) in China were divided into six regions: northeast, southwest, northwest, north China, east China, and south-central China (relevant data from the Hong Kong Special Administrative Region, Macao Special Administrative Region, and Taiwan are missing).

2.2. Data Sources

The administrative division data used were from the Resource and Environmental Science and Data Center of the Institute of Geographic Sciences and Resources, Chinese Academy of Sciences (https://www.resdc.cn/ (accessed on 7 October 2022)), and the forest area and volume data were from the 2014–2018 China Forest Resources Report published by the China Forestry Publishing House. The series of forest resource inventory data used in this study are the data of the sixth (1999–2003), seventh (2004–2008), eighth (2009–2013), and ninth (2013–2018) inventories. The completed amount of forestry fixed assets investment and the number of employees of forestry system units at the end of the year are from the China Forestry Statistical Yearbook published by the China Forestry Publishing House from 1999 to 2018.

3. Research Method

3.1. Forest Stock Expansion Method

For countries or regions with forest resource inventory data, forest stock is easy to obtain, and it is more convenient and effective to use biomass models to estimate regional forest carbon stocks. China conducted forest inventory every five years during the study period. Therefore, based on the biomass model of the forest stock expansion method, the carbon stock of China’s provincial forests in the previous inventory stages was estimated. The basic model of the forest volume expansion method is:
C f = s i j × C i j + α s i j × C i j + β s i j × C i j
C i j = V i j × δ × ρ × γ
where C f is the total carbon sequestration of the forest, s i j is the area of the j-type forest in the i-type area, C i j is the forest carbon density of the j-type forest in the i-type area, α is the carbon conversion coefficient of the understory plants, β is the forest carbon conversion coefficient, V i j is the forest unit area storage of the j-type forest in the i-type area, δ is the biomass expansion coefficient, ρ is the volume coefficient, and γ is the carbon-content rate. In this study, the IPCC default values were used for various conversion factors: δ = 1 .9, γ = 0 .5, ρ = 0 .5, α = 0 .195, β = 1 .244.

3.2. Cobb–Douglas Production Function

The Cobb–Douglas production function is the most widely used form of a production function in economics. It is mainly used to measure the impact of capital and labor inputs on output in the production process. In this study, the provincial FCSE index system in China was constructed using the balance between forestry economic input and forest carbon storage output based on the Cobb–Douglas production function (Table 1), and its basic form is as follows:
Y = A t L α K β μ
where Y is the total output value, A t is the comprehensive technical level, L is the number of labor inputs, K is the capital input which generally refers to the net value of fixed assets, α is the elasticity coefficient of labor output, β is the elasticity coefficient of capital output, μ indicates the influence of random interference, and μ ≤ 1.
In this study, we set the forest carbon storage index as the total output value (Y), the number of employees of the forestry system at the end of the year index as the number of labor inputs (L), and the completed amount of forestry fixed assets investment index as the capital input (K); the forest area index was used to characterize scale. On this basis, the scale efficiency and the comprehensive technical level of FCS in China were studied.
The combination of α and β has three types:
(1)
α + β > 1, increasing returns to scale, indicating that it is beneficial to increase output by expanding production scale according to the existing technology.
(2)
α + β < 1, the return to scale decreases, indicating that, according to the existing technology, it is not worth the loss to increase output by expanding the production scale.
(3)
α + β = 1, the return to scale remains unchanged, indicating that production efficiency will not increase with the expansion of production scale. Economic benefits can be improved only by increasing the technical level.

3.3. DEA-Malmquist Index Method

The combination of the Malmquist index and DEA can provide a description of dynamic changes in efficiency. The changes in FCSE were continuous and dynamic. Therefore, this study calculated the FCSE of China’s provinces based on the DEA-Malmquist index method.
The Malmquist index is defined as the product of efficiency and technological changes. The efficiency change reflects the improvement or deterioration of the efficiency of the decision-making unit (DMU), while the technical change reflects the change in the efficiency frontier in the two periods. In this study, an adjacent reference Malmquist model with a variable scale under output guidance was selected.
Suppose x t , y t and x t + 1 , y t + 1 represent the input and output of the t and t + 1 periods; D c t x t , y t and D c t + 1 x t + 1 , y t + 1 are the output distance functions under different technical conditions, and subscript c represents the constant return to scale. The Malmquist index is then expressed as:
T F P = M t + 1 x t + 1 , y t + 1 , x t , y t = D c t x t + 1 , y t + 1 D c t x t , y t × D c t + 1 x t + 1 , y t + 1 D c t + 1 x t , y t 1 2
Assuming that the return to scale remains unchanged, the Malmquist index is divided into the technical efficiency change index (Effch) and technical progress index (Tech), as shown below.
E e f f e c h = D c t + 1 x t + 1 , y t + 1 D c t x t , y t
T e c h = D c t x t + 1 , y t + 1 D c t + 1 x t + 1 , y t + 1 × D c t x t , y t D c t + 1 x t , y t 1 2
The relationship between TFP and Effch and Tech is:
T F P = M t + 1 x t + 1 , y t + 1 , x t , y t = E f f e c h × T e c h
If the return to scale is variable, the technical efficiency change index is divided into the pure technical efficiency index (Pech) and scale efficiency index (Sech), where the subscript v represents the variable return to scale, as shown below:
P e c h = D v t + 1 x t + 1 , y t + 1 D v t x t , y t
S e c h = D v t x t + 1 , y t + 1 D c t x t + 1 , y t + 1 D v t x t , y t D c t x t , y t × D v t + 1 x t + 1 , y t + 1 D c t + 1 x t + 1 , y t + 1 D v t + 1 x t , y t D c t + 1 x t , y t 1 2
The relationship between Effch and Pech and Sech is:
E f f e c h = P e c h × S e c h
The economic meaning of TFP is as follows:
(1)
M t + 1 x t + 1 , y t + 1 , x t , y t > 1, TFP shows an upward trend from t to t + 1, and efficiency is improved.
(2)
M t + 1 x t + 1 , y t + 1 , x t , y t = 1, the TFP index remains unchanged from t to t + 1, and efficiency remains unchanged.
(3)
M t + 1 x t + 1 , y t + 1 , x t , y t < 1, the TFP index decreases from t to t + 1, and efficiency also decreases.
Effch represents the catch-up trend of each observation object relative to the production frontier from t to t + 1; that is, the technical efficiency change degree of the competent unit of the decision-making unit from t to t + 1. Effch reflects the ratio of the distance between the actual output level and the optimal output level in different periods, which means that under the current technical level, the technical level can be better played by coordinating various resource elements.
(1)
Effch > 1 indicates that technical efficiency is improved, that is, the management mode and decision-making of the decision-making unit are correct.
(2)
Effch < 1 indicates that technical efficiency deteriorates; that is, the management mode and decision making of the decision-making unit are incorrect.
Tech represents the movement of the production frontier from t to t + 1, reflecting a change in production technology, which means that more output can be achieved with the same combination of inputs.

4. Results and Discussion

4.1. Regional Spatial Differences of Forest Carbon Storage in China’s Provinces

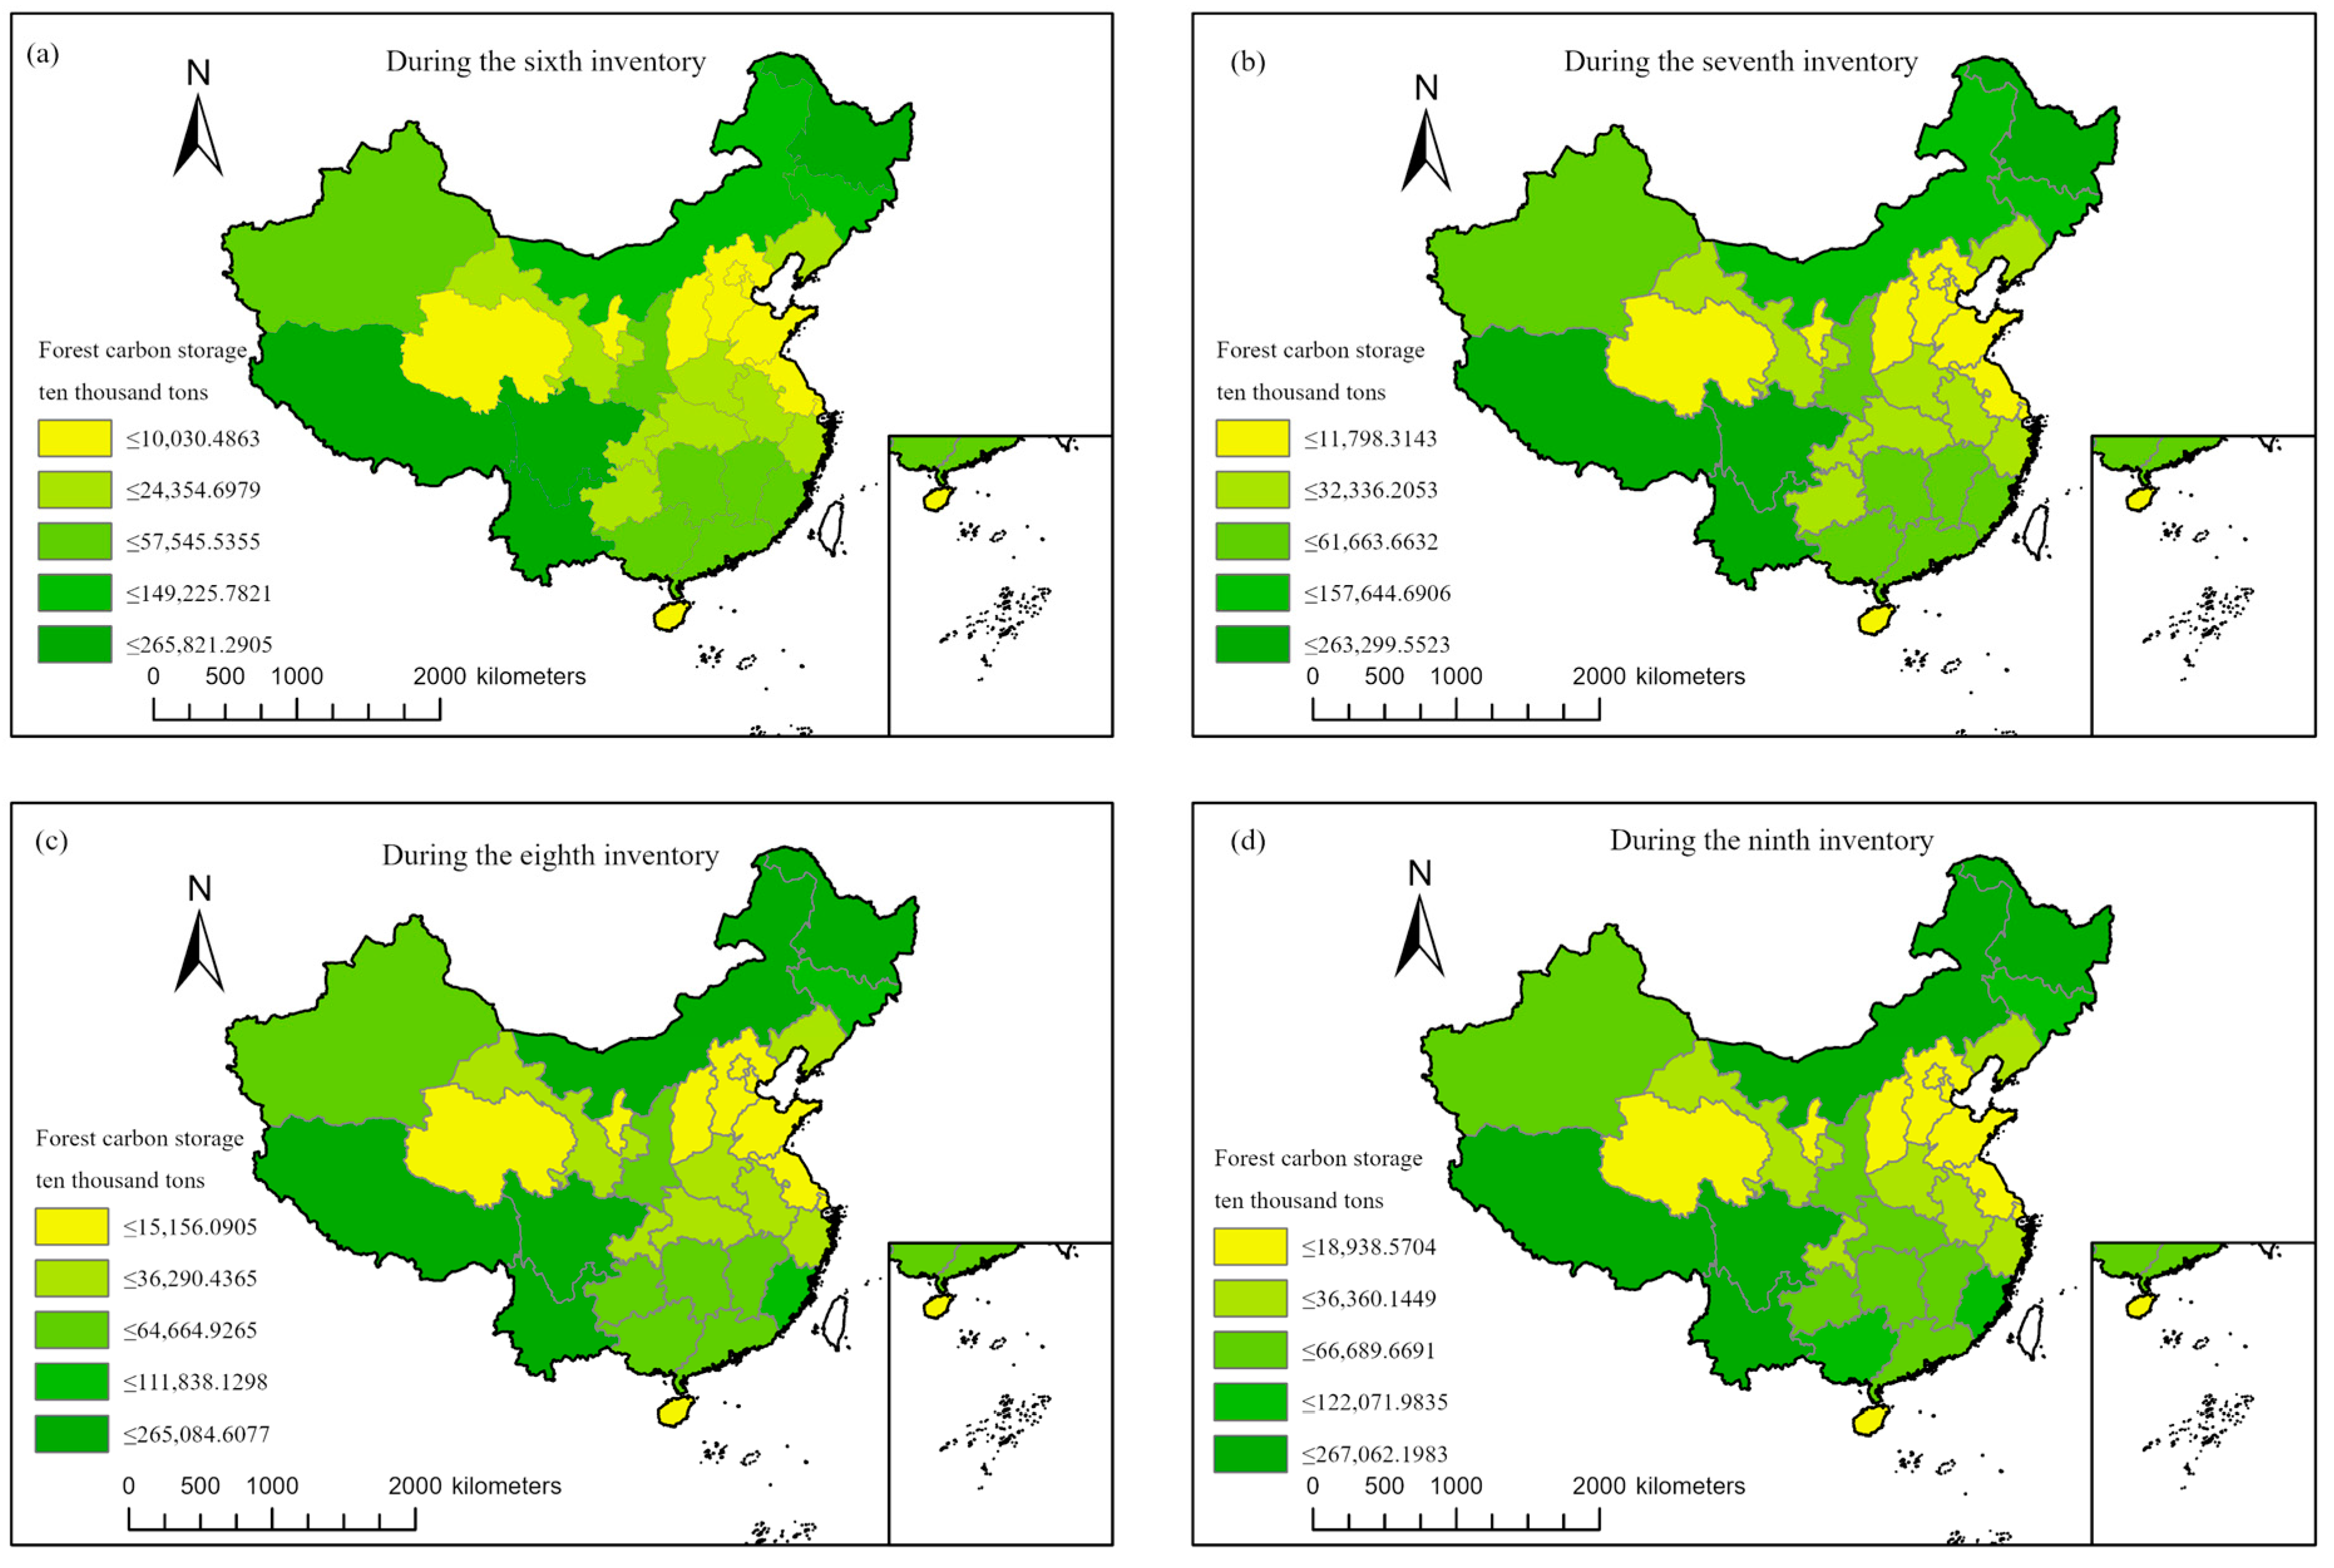
Based on the forest volume expansion method, provincial forest carbon stocks during the 6th to 9th forest inventory in China were obtained (Figure 1). From the perspective of spatial patterns, China’s forest carbon reserves exhibit large regional differences (Figure 2); the forest carbon reserves of provinces in southwest and northeast China were generally large, followed by central south and north China, and the forest carbon reserves of eastern and northwestern China were small. This spatial pattern is closely related to the natural resource conditions of various regions, and is also inseparable from the forestry economic policies in various regions.
The southwest and northeast regions had good forest carbon storage performances. Southwest China is the second-largest natural forest region in the country. On the one hand, southwest China is affected by the subtropical monsoon climate, with large precipitation and superior conditions for forest growth. On the other hand, the complex terrain, small population density, and less man-made damage to forests in the southwest region make the trees denser and older, which are significant reasons for the good performance of forest carbon storage in the southwest region. Northeast China is the largest natural forest region in the country, with fertile soil and sufficient water resources. In the process of changing the long-term growth cycle, the forest region has accumulated a large amount of humus, and the soil fertility under the forest has been continuously improving, providing favorable conditions for the growth and development of trees.
In northwest and east China, forest carbon storage is poor. The main limiting factor of forest carbon storage in northwest China is the natural resource conditions. Northwest China is surrounded by mountains on all sides and precipitation is low. It is an arid to semi-arid area. The growth of forests requires sufficient water resources, and the development of forests in northwest China is limited. The level of forest carbon storage in east China is mainly restricted by human economic activities. East China has a flat terrain, numerous cities, and a significant amount of human activity. The development of agriculture, industry, and transportation occupies land, and the development of forests in east China is limited.
The provincial forest areas of Yunnan Province, Sichuan Province, and the Tibet Autonomous Region in the southwest region are among the top in the country, and the forest storage per unit area is large. Under comprehensive influence, the forest carbon reserves of the Tibet Autonomous Region, Yunnan Province, and Sichuan Province are extremely high, ranking first, second, and fourth in the national forest carbon storage in the same period, respectively, which has boosted the forest carbon storage level of the entire southwest region. Heilongjiang and Jilin provinces had the best performance in forest carbon storage in northeast China. The forest storage per unit area of the two provinces is large, along with the forest area of the Heilongjiang Province, making it the third largest province in the country’s forest area in the same period. In east China, north China, and northwest China, except for the Inner Mongolia Autonomous Region, Fujian Province, Jiangxi Province, Shaanxi Province, and Xinjiang Uygur Autonomous Region, which have large forest areas, the forest carbon storage performance of other provinces is poor.
From the perspective of provinces with outstanding performance, in terms of forest area, during the 9th inventory, the forest area of the Inner Mongolia Autonomous Region reached 26.1485 million hectares, ranking first in China. As an important ecological safety barrier in northern China, the region has persistently promoted afforestation and forest management projects. During the 6th to the 9th forest resources inventory, key ecological projects have been included, such as natural forest resources protection, Beijing-Tianjin wind and sand source control, “Three North” protective forest construction, returning farmland to forest and grassland, returning grazing land to grassland, and water and soil conservation. The forest area has increased by 4.641 million hectares. In terms of forest storage per unit area, the highest forest storage per unit area in Tibet Autonomous Region is 154.61 cubic meters per hectare during the 9th inventory. The forest in the Tibet Autonomous Region is one of the few natural resources in the original state of the world, the vast majority of which are natural forests. At the same time, the proportion of near-mature and over-mature forests in the Western Tibet Autonomous Region is high. The forest carbon storage density of this age is higher than that of young and middle-aged forests, and in the same area of the same species, the higher the proportion of near-mature forest and mature forest, the higher the forest carbon storage. The unique forest composition is the internal reason for the highest storage per unit area in the Tibet Autonomous Region and is also the endogenous driving force for large forest carbon storage in the Tibet Autonomous Region.

4.2. Dynamic Changes of Forest Carbon Storage in China’s Provinces

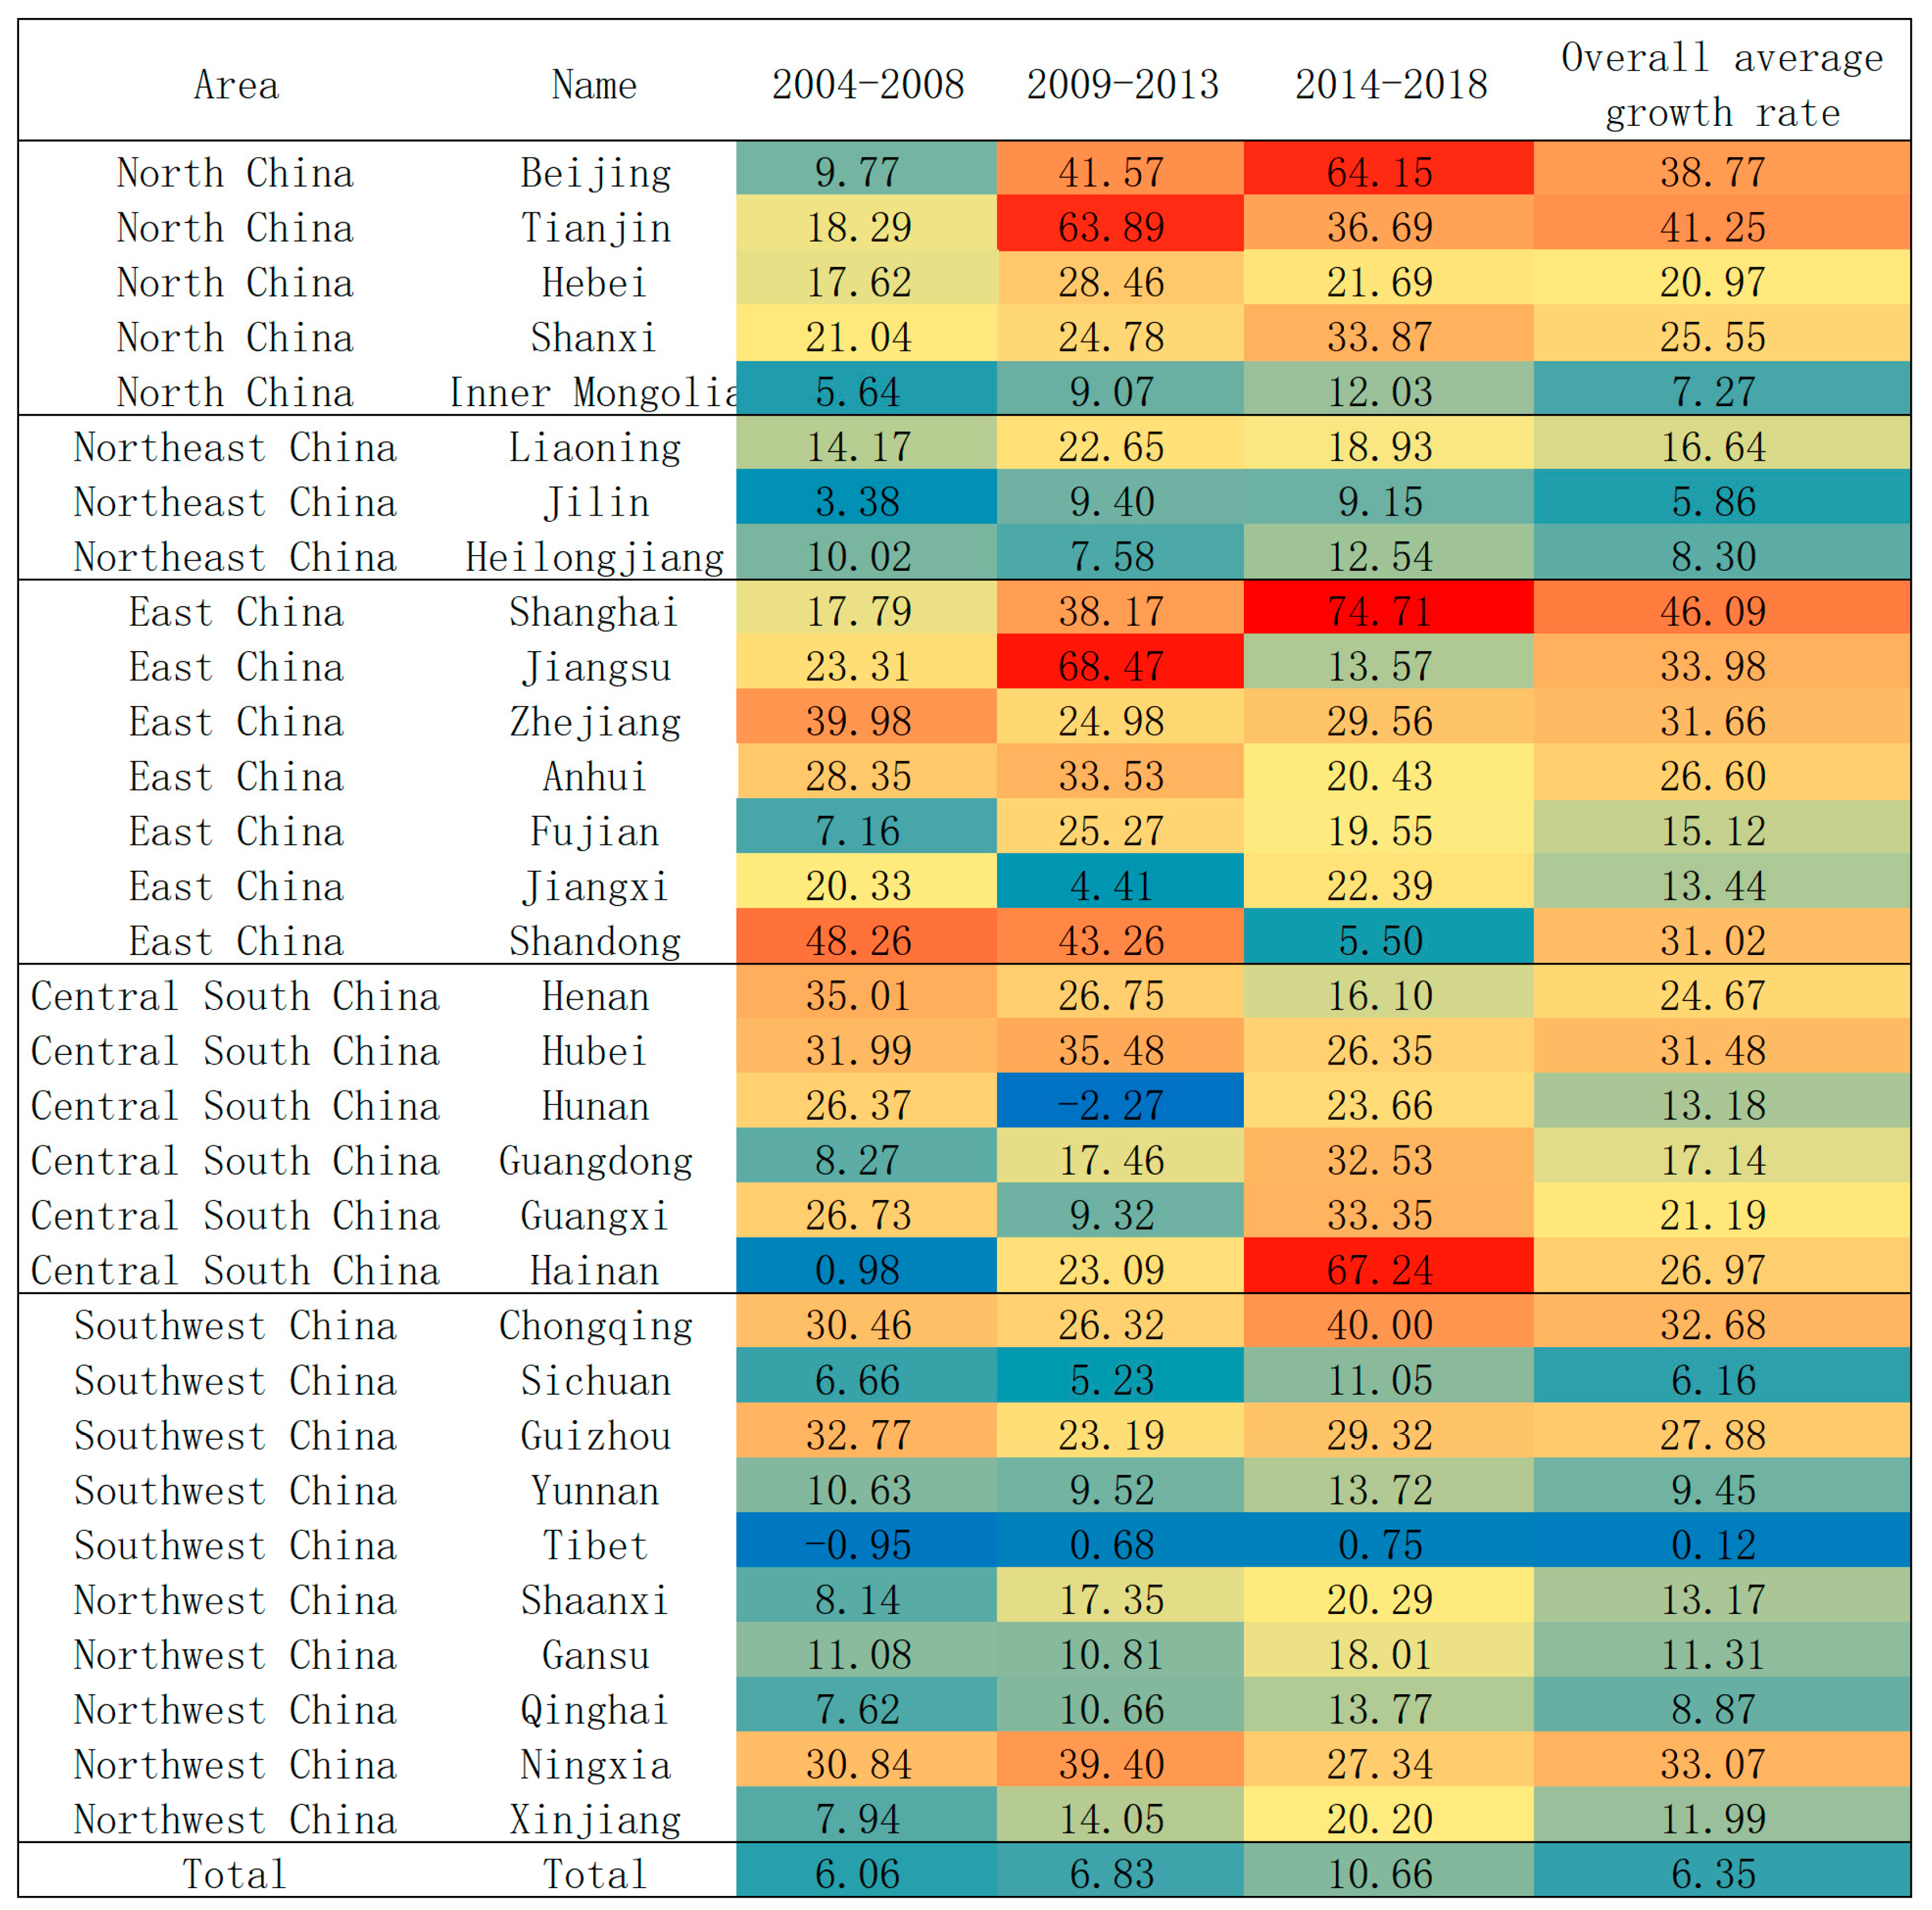
China’s forest carbon stock has maintained steady growth during the 6th to 9th forest resource inventories, but there are differences in the growth rate between different regions and provinces (Figure 3). From the perspective of regional growth, in the past 20 years, the growth rate of forest carbon reserves in the central-southern and eastern regions of China was higher, at 82.17% and 76.26%, respectively, while the growth rate of forests in the southwest region was the lowest at 23.66%.
The growth rates of forest carbon stocks in Hubei and Hainan provinces in the central-southern regions were 125.94% and 107.88%, respectively. During the 6th to 9th forest resource inventories, the forest area and unit area stock in Hubei Province increased significantly. The growth of forest areas in Hubei Province is due to projects such as planting trees in barren mountains, which have been promoted continuously in Hubei Province for many years. The growth of unit area forest stock benefited from the construction of a large number of Masson pine forests in Hubei Province in the sixties and seventies. With the change in time series, the proportion of near-mature forests continues to increase, which provides a larger storage capacity than before. The growth of carbon storage in Hainan Province is due to the substantial increase in the stock of hardwood and broad-leaved mixed tree species among the dominant tree species in Hainan Province, which has driven the growth of forest stock per unit area in Hainan Province, and further promoted the growth of forest carbon storage in Hainan Province. The province with the highest growth rate of forest carbon storage in east China is Shanghai, which has reached the growth rate of 184.35%, and is also the province with the highest growth rate of forest carbon storage in China. The growth of forest carbon storage in Shanghai is mainly due to the growth of forested areas.
The low growth rate of forest carbon storage in southwest China is mainly due to the forest structure dominated by natural forests. The growth rate of carbon reserves in the Tibet Autonomous Region has been low over the past 20 years. It is the province with the lowest growth rate in carbon reserves in the country. It only increased by 0.47% and even experienced negative growth during the 6th to 7th inventories. On the one hand, the original forest area of the Tibet Autonomous Region is relatively large and the forest unit stock is relatively high. Although the forest area has increased in the past 20 years, due to the large base of its original forest area and the harsh natural conditions in Tibet, the conditions for the development of forests in suitable forest areas are also poor, and the growth rate of forest area is relatively low; on the other hand, among the arbor forests in the Tibet Autonomous Region, nearly mature and over-mature forests account for a large proportion, while mature and over-mature forests represent forests that are declining or have begun to decline. Under such circumstances, it is also difficult for the unit area of regional forests to increase significantly, and various factors contribute to the growth rate of forest carbon storage in the Tibet Autonomous Region.
In addition, Tianjin and Beijing showed good performance in terms of the growth rate of forest carbon reserves. The growth of forest carbon storage in Tianjin mainly comes from the growth of forest areas. In Beijing, both the forest area and forest volume per unit area have increased significantly. The increase in the forest area in Beijing benefited from the increase in the area of artificial forests in Beijing since 2003, whereas the increase in the forest volume per unit area benefited from the continuous improvement of the forest age structure.

4.3. Dynamic Differences of Forest Carbon Storage Efficiency in China’s Provinces

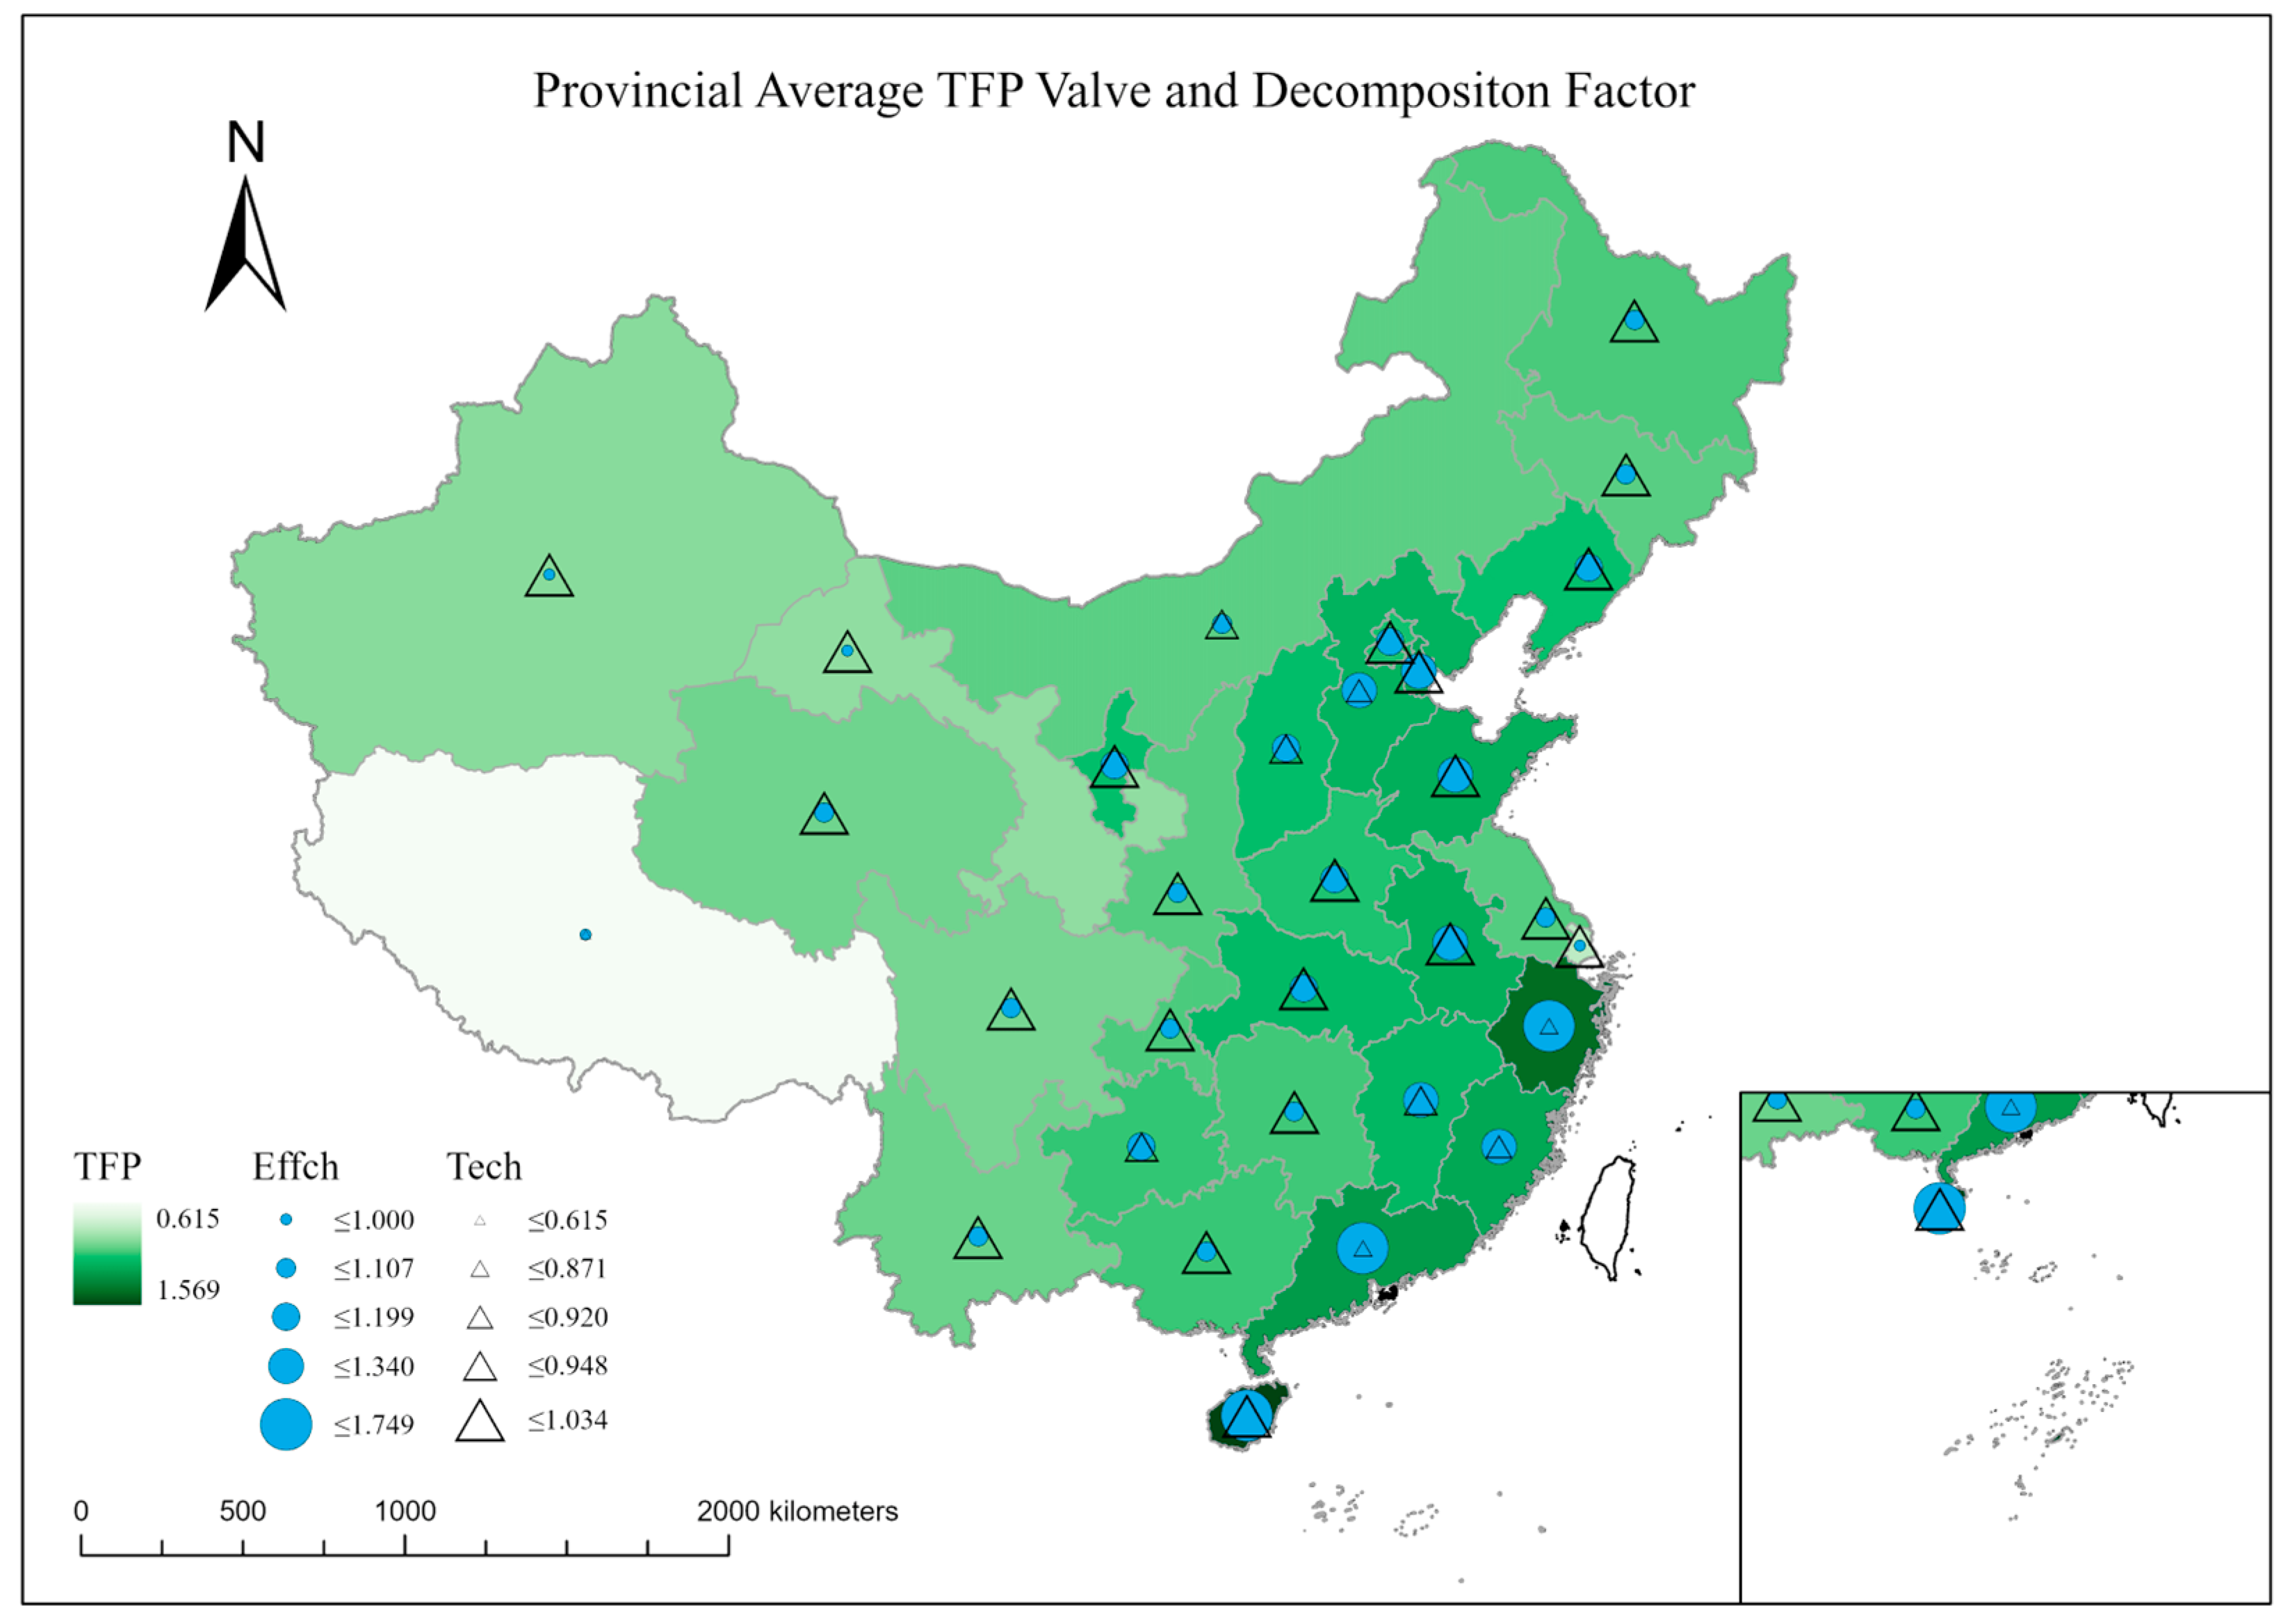
The carbon storage efficiency of provincial forests during the 6th to 9th forest inventories in China was obtained using the DEA-Malmquist index method (Table 2). The average TFP value of carbon storage efficiency in China’s forested provinces over the past 20 years was 1.089, representing an overall upward trend in China’s FCSE from 1999 to 2018, and showing the spatial distribution characteristics of high in the southeast and low in the northwest (Figure 4). On the other hand, from the perspective of the components of TFP changes, the improvement of Effch, particularly that of Pech, has always been the driving factor for the rise of FCSE in China’s provinces, while Tech is the limiting factor; in general, return to scale has always been decreasing.
From the perspective of the Tech index of the FCSE, Hainan Province, the province with the largest increase in FCSE in the past 20 years, is also the only province with a technological progress index greater than 1 in the past 20 years, with a TFP value of 1.569 and a Tech value of 1.034, which reflects the efforts made by Hainan Province to advance forestry technology. Frontier technological progress plays a driving role in Hainan Province. In the future, Hainan Province should continue to learn cutting-edge forestry technologies to guide the continuous improvement of forest carbon sink efficiency.
In addition, the Tech is a factor that restricts the development of FCSE in the other 30 provinces, particularly in the Tibet Autonomous Region, which has the most negative growth in FCSE in the past 20 years and is also the province with the lowest Tech index. This is related to the developmental characteristics of forest carbon sinks in the Tibet Autonomous Region, which is dominated by natural forests, and human forces contribute less to the growth of forest carbon sinks in this region. Simultaneously, owing to the limitations of the natural environment of the Tibet Autonomous Region, it is difficult for emerging technologies to be widely used in the region, and there are many restrictions on catching up with the technological frontier.
For this region, which is greatly restricted by natural conditions, the local government should pay more attention to the protection of existing forest resources and improve forest management technology when formulating forestry policies to increase forest carbon storage output. For other regions that are less restricted by natural conditions, but whose Tech index is still low, local forestry and grass departments should speed up the catch up of cutting-edge technologies, increase scientific and technological investment in forest carbon sinks, introduce advanced technologies, and improve the scientific and technological level of forest carbon sinks.
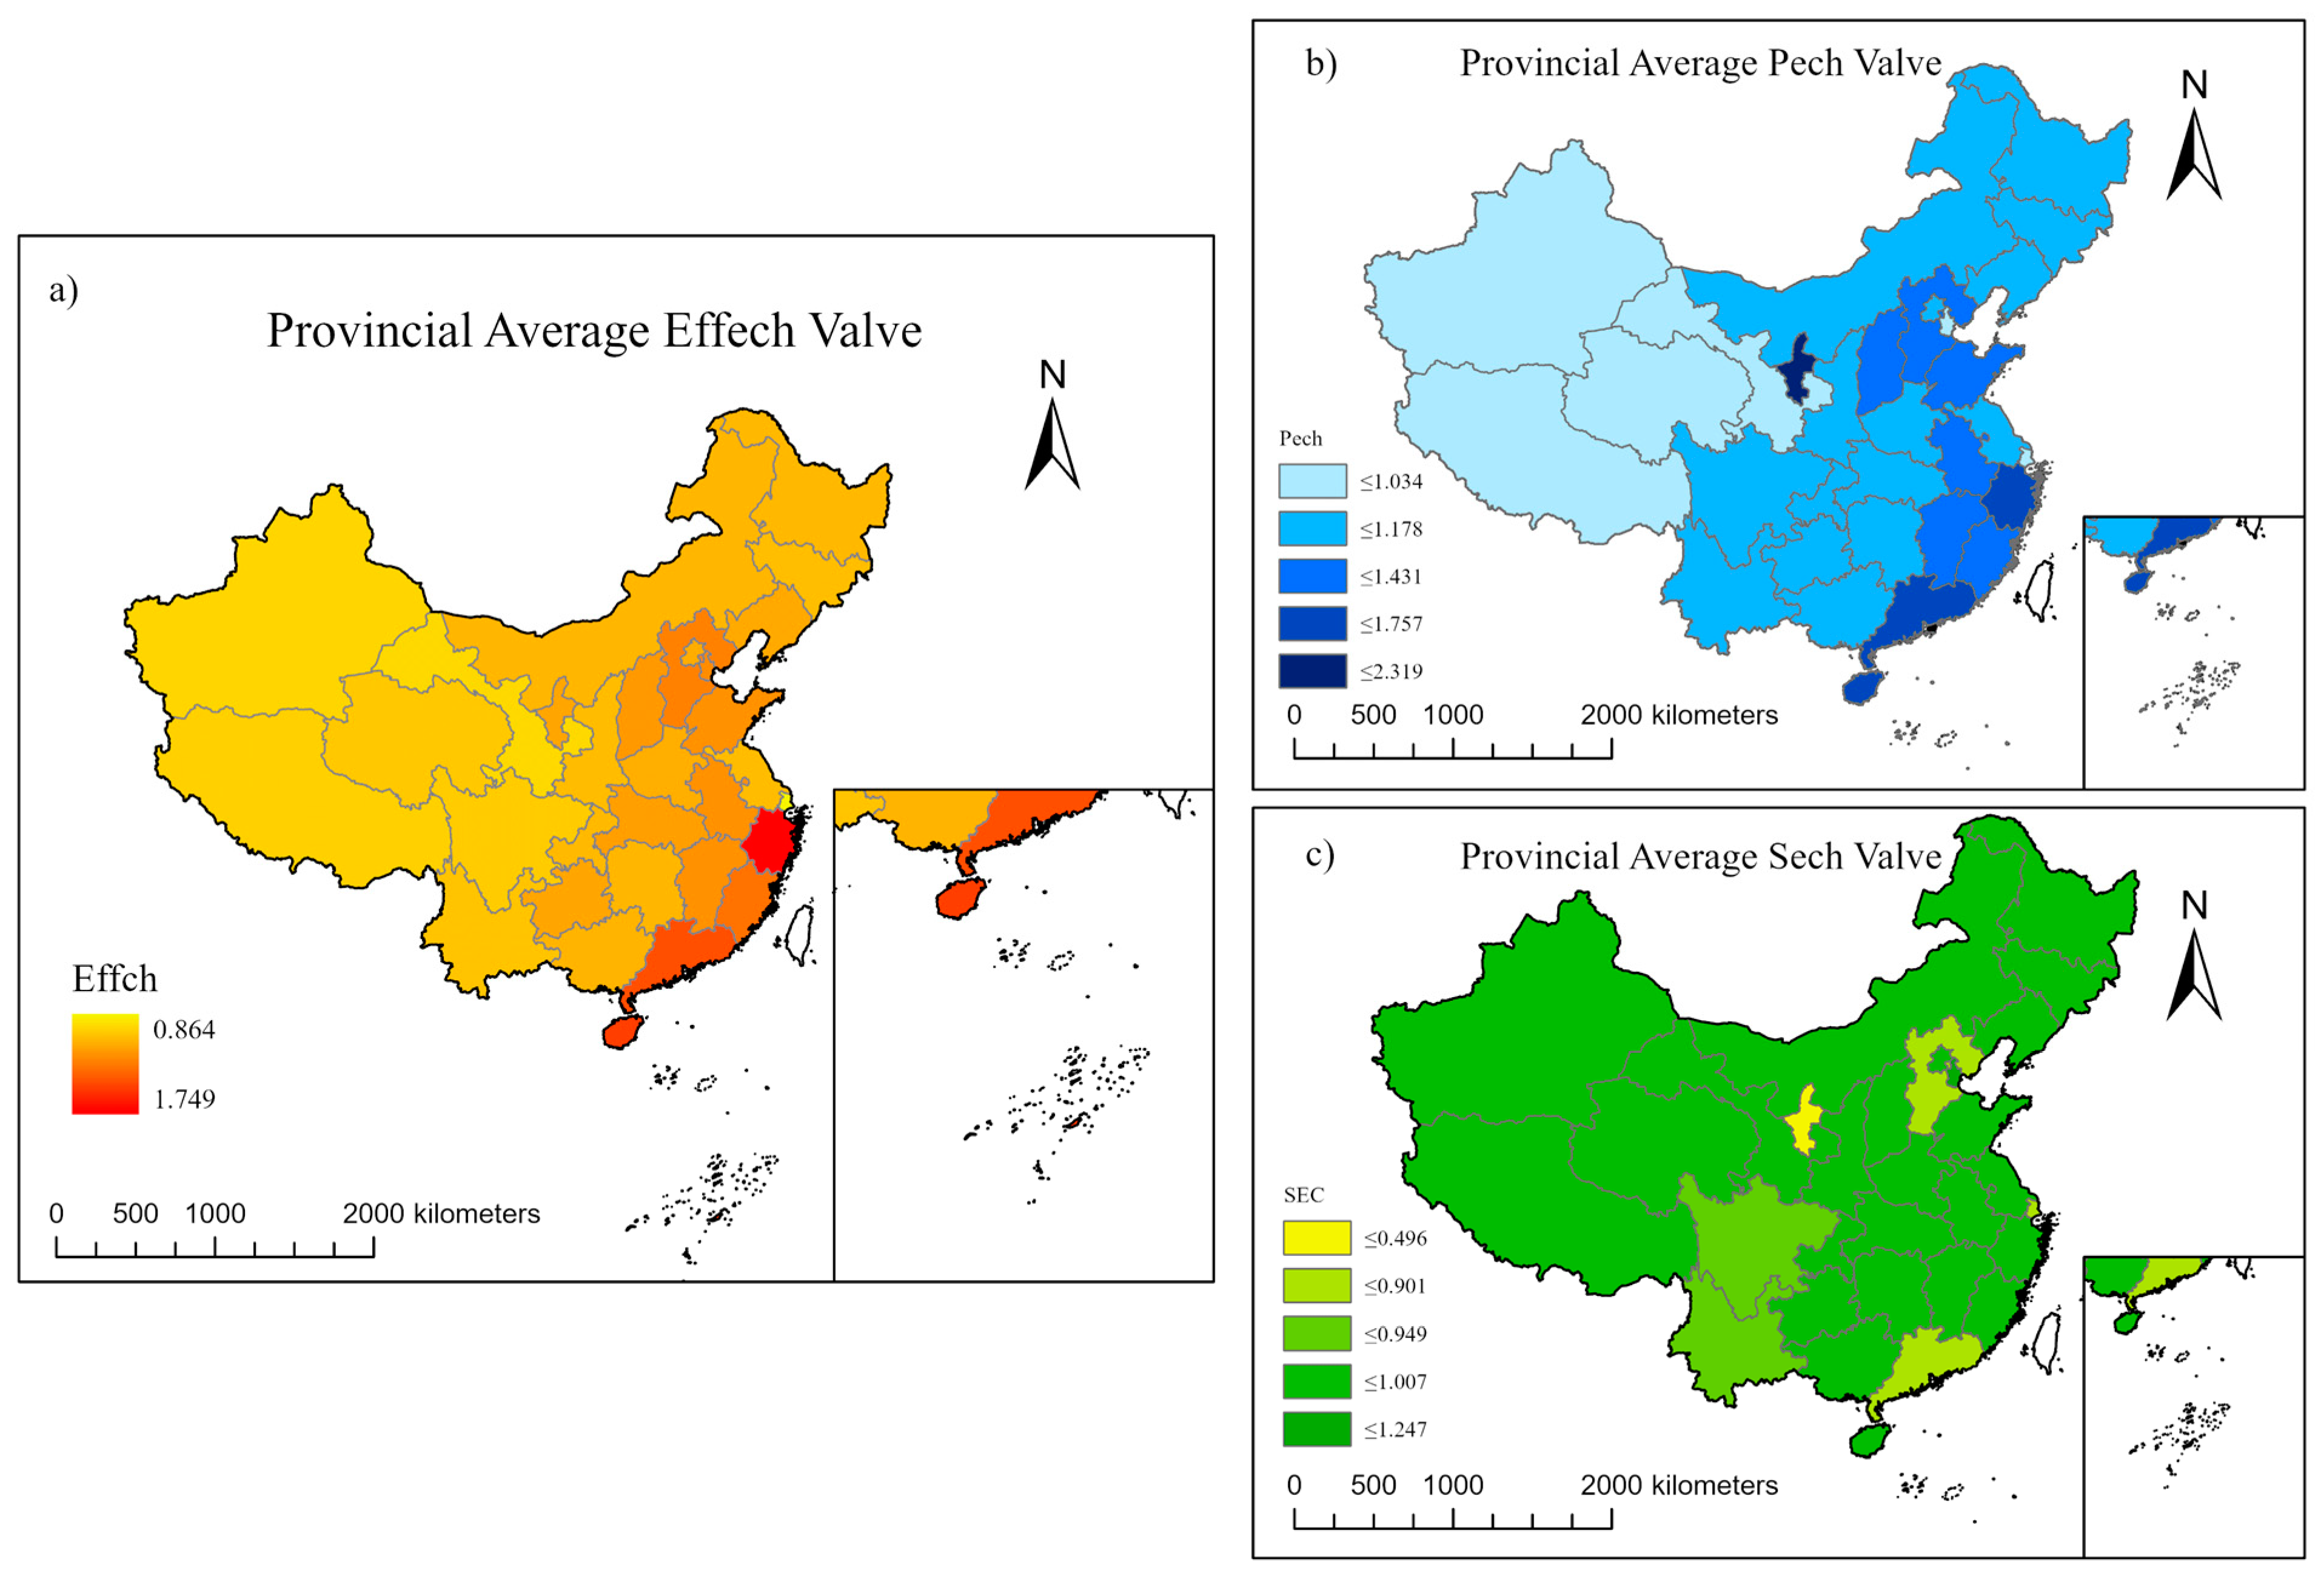
The overall improvement of Effch of FCSE in various provinces presents a spatial pattern of high in the southeast and low in the northwest, which is consistent with the spatial distribution pattern of carbon storage efficiency (Figure 5).
Pech can be used to measure the impact of technology and management factors on forest carbon sequestration. The improvement of the technical efficiency of forest carbon sequestration at the provincial level in China benefits from the implementation of the natural forest protection project and the policy of returning farmland to forests in China. The promotion of these measures has, to some extent, strengthened the importance of forestry technology in various provinces and encouraged managers to improve forestry technology by adjusting factor input, improving management level, introducing new technologies, and improving the technical efficiency of forest carbon sequestration.
The Pech index of Gansu Province and Xinjiang Uygur Autonomous Region is less than 1, which indicates that there is still much room for progress in the technical application and management of the input and output of forest carbon sinks in the two provinces. The local government and forestry and grass departments should strengthen the management and technical training of forestry practitioners, promote the rational allocation of forestry resources, and improve technical efficiency.
The Sech of most provinces has decreased in the past 20 years from the perspective of scale returns of FCSE in each province, reflecting the uniqueness of forest carbon sinks. On the one hand, for forests, the expansion of forestland area does not mean an equal expansion of forest carbon storage capacity. Due to the large differences in carbon storage capacity of forests of different age groups, and the generally long growth cycle of forests, for provinces where the original forests have become a certain size, the beneficial growth of forest carbon storage from afforestation needs a longer duration to be fully visible. On the other hand, the expansion of forest scale is accompanied by the growth in the number of forestry practitioners and the increase in forestry inputs. These inputs are essential in the early stage of forest formation; however, in the short term, although the expansion of forest area can relatively increase forest carbon storage, it cannot immediately obtain the same carbon storage output as forest formation. The combination of an increase in inputs and a delay in forest carbon storage output has led to a decrease in the return on the scale of forest carbon storage in China’s provinces.
Only Jiangsu Province, Inner Mongolia Autonomous Region, Hainan Province, and Tianjin have increased in scale returns, which proves that afforestation investment in these regions can form scale returns in a relatively short time. At this stage, forest carbon storage can still be increased by expanding forest scale.
According to the different index divisions, each province should have a different emphasis when formulating forestry economic development policies. For provinces with a Tech index of FCSE less than 1, local governments should strengthen investment in technology introduction and close to the frontier of domestic and foreign forestry technology. For provinces with a Effch index less than 1, the local government should strengthen the management and personnel training of the forestry department, adjust the allocation of forestry economic input, and reasonably allocate resources. For provinces with increasing economies of scale, the forestry department can allocate more forestation investment. For provinces with decreasing economies of scale, the local forestry department should strengthen its forestation investment in the short term.
The results reported by our study should be reasonable. On the one hand, the distribution of forest carbon storage efficiency obtained by us presents the spatial distribution characteristics of high southeast and low northwest, which is consistent with the findings of Yao et al. [43]. Their research results also show that the forest carbon storage efficiency of provinces located in the southwest, southeast, and northeast is significantly higher than that of other provinces. At the same time, from the perspective of time series, China’s provincial forest carbon storage efficiency showed an overall upward trend from 1999 to 2018, which was consistent with the conclusion of Yin et al. [30]. Other studies using DEA to analyze China’s provincial forest carbon storage efficiency have reached similar conclusions [44].
In addition, Shu et al. also found that the Sech index was the main factor limiting comprehensive efficiency in their study on the evolution of forest carbon sink efficiency in the natural conservation engineering area [45]. However, Shu et al. believed that the Effch and Tech index jointly promoted TFP efficiency, which was different from the result that the Tech index limited TFP in this study. Such differences were related to the selection of the research scope. For example, the Tibet Autonomous Region, a province with a very low technological progress index, was not included in the study reported by Shu et al. The selection of different study areas affected the overall assessment of the Tech index.

5. Conclusions

In China, the carbon sequestration effect of forests plays an important role in achieving carbon neutrality. Strengthening the research on FCSE will help clarify the relationship between forestry economic input and forest carbon storage output and provide support for the national and regional balance of forestry input. To better estimate the FCSE at large spatial scales and long time series, the DEA-Malmquist index was introduced into the calculation of FCSE, and forest carbon storage was evaluated using forest resource inventory data. Taking China as an example, this study calculates and analyzes the forest carbon storage and FCSE of 31 provinces (cities and autonomous regions) in China during the 20 years from 1999 to 2018 using the forest volume expansion method and the DEA-Malmquist index. The results show that:
China’s forest carbon reserves have increased annually, showing a distinct spatial differentiation pattern. Forest carbon reserves and their growth rates in different regions under different natural resource endowments and socioeconomic development conditions differ substantially. The forest carbon reserves of provinces in southwest and northeast China are generally large, followed by central and southern China and north China, while those in eastern and northwestern China are relatively small. The growth rate of forest carbon reserves in central south China and eastern China is relatively high, while that in southwest China is the lowest.
China’s provincial FCSE is on the rise and is driven and restricted by different factors, showing a spatial differentiation pattern of high in the southeast and low in the northwest. The improvement of technological efficiency has always been the driving factor for the rise of the carbon storage efficiency of China’s provincial forests, while the lag in technological progress is the limiting factor. In general, afforestation investment cannot form a scale effect in a short time.
The FCSE evaluation process proposed in this paper can effectively evaluate FCSE on a large spatial scale and long time series. The research results are helpful in helping local governments and forestry and grass departments comprehensively consider the progress of local forestry technology, the forest area, and the application level of forestry technology in the province to formulate suitable forest carbon fixation policies in the province according to local conditions. This method can be widely used in countries and regions using forest resource inventory data.

Supplementary Materials

The following supporting information can be downloaded at: https://www.mdpi.com/article/10.3390/f14081629/s1, Figure S1: Total CO2 emissions in China, 1990–2021.

Author Contributions

Conceptualization, X.L. and J.H.; Data curation, X.L.; Formal analysis, X.L.; Funding acquisition, J.H.; Investigation, H.Z.; Methodology, X.L., J.H. and H.Z.; Project administration, J.H.; Resources, X.C.; Supervision, H.Z.; Validation, J.S. and Q.W.; Visualization, H.Z.; Writing—original draft, X.L.; Writing—review & editing, H.Z. All authors have read and agreed to the published version of the manuscript.

Funding

This work was supported by the National Natural Science Foundation of China (No. 42001018, 41071104).

Data Availability Statement

The data used to support the findings of this study are available from the corresponding author upon request.

Conflicts of Interest

The authors declare no conflict of interest.

References

  1. Gao, X.; Zhu, J.; Zeng, X.; Zhang, M.; Dai, Y.; Ji, D.; Zhang, H. Changes in Global Vegetation Distribution and Carbon Fluxes in Response to Global Warming: Simulated Results from IAP-DGVM in CAS-ESM2. Adv. Atmos. Sci. 2022, 39, 1285–1298. [Google Scholar] [CrossRef]
  2. Lin, B.; Ge, J. Valued forest carbon sinks: How much emissions abatement costs could be reduced in China. J. Clean. Prod. 2019, 224, 455–464. [Google Scholar] [CrossRef]
  3. Hessen, D.O.; Vandvik, V. Buffering Climate Change with Nature. Weather Clim. Soc. 2022, 14, 439–450. [Google Scholar] [CrossRef]
  4. Huang, Y.; Sun, W.; Qin, Z.; Zhang, W.; Yu, Y.; Li, T.; Zhang, Q.; Wang, G.; Yu, L.; Wang, Y.; et al. The role of China’s terrestrial carbon sequestration 2010–2060 in offsetting energy-related CO2 emissions. Natl. Sci. Rev. 2022, 9, 153–166. [Google Scholar] [CrossRef] [PubMed]
  5. IEA. Global Energy Review: CO2 Emissions in 2021. IEA 2022, Flagship Report March 2022, License: CC BY 4.0. Available online: https://www.iea.org/reports/global-energy-review-co2-emissions-in-2021-2 (accessed on 3 August 2023).
  6. Chen, S.; Lu, N.; Fu, B.; Wang, S.; Deng, L.; Wang, L. Current and future carbon stocks of natural forests in China. For. Ecol. Manag. 2022, 511, 120137. [Google Scholar] [CrossRef]
  7. Tang, X.; Zhao, X.; Bai, Y.; Zhou, G. Carbon Pools in China’s Terrestrial Ecosystems: New Estimates Based on an Intensive Field Survey. Proc. Natl. Acad. Sci. USA 2018, 115, 4021–4026. [Google Scholar] [CrossRef] [Green Version]
  8. Wang, H.; Huang, J.; Zhou, H.; Deng, C.; Fang, C. Analysis of sustainable utilization of water resources based on the improved water resources ecological footprint model: A case study of Hubei Province, China. J. Environ. Manag. 2020, 262, 110331. [Google Scholar] [CrossRef]
  9. Houghton, R.A.; House, J.I.; Pongratz, J.; Van Der Werf, G.R.; DeFries, R.S.; Hansen, M.C.; Le Quéré, C.; Ramankutty, N. Carbon Emissions Land Use Land-Cover Change. Biogeosciences 2012, 9, 5125–5142. [Google Scholar] [CrossRef] [Green Version]
  10. Wang, Q.; Huang, J.; Zhou, H.; Sun, J.; Yao, M. Carbon Emission Inversion Model from Provincial to Municipal Scale Based on Nighttime Light Remote Sensing and Improved STIRPAT. Sustainability 2022, 14, 6813. [Google Scholar] [CrossRef]
  11. Piao, S.; He, Y.; Wang, X.; Chen, F. Estimation of China’s Terrestrial Ecosystem Carbon Sink: Methods, Progress and Prospects. Sci. China Earth Sci. 2022, 65, 641–651. [Google Scholar] [CrossRef]
  12. Ma, X.; Qin, Y.; Wu, L.; Zhu, Y.; Wu, J. Simulation of Vegetation Carbon Sink of Arbor Forest and Carbon Mitigation of Forestry Bioenergy in China. Int. J. Environ. Res. Public Health 2022, 19, 13507. [Google Scholar] [CrossRef] [PubMed]
  13. Yu, Z.; Zhou, G.; Ciais, P.; Piao, S.; Houghton, R.A.; Lu, C.; Tian, H.; Agathokleous, E.; Kattel, G.R.; Sitch, S.; et al. Forest Expansion Dominates China’s Land Carbon Sink since 1980. Nat. Commun. 2022, 13, 5374. [Google Scholar] [CrossRef] [PubMed]
  14. Liang, Y.; Hashimoto, S.; Liu, L. Integrated assessment of land-use/land-cover dynamics on carbon storage services in the Loess Plateau of China from 1995 to 2050. Ecol. Indic. 2021, 120, 106939. [Google Scholar] [CrossRef]
  15. Tong, X.; Brandt, M.; Yue, Y.; Ciais, P.; Rudbeck Jepsen, M.; Penuelas, J.; Wigneron, J.-P.; Xiao, X.-P.; Song, X.-P.; Horion, S.; et al. Forest management in southern China generates short term extensive carbon sequestration. Nat. Commun. 2020, 11, 129. [Google Scholar] [CrossRef] [Green Version]
  16. Xu, C.; Wang, B.; Chen, J. Forest carbon sink in China: Linked drivers and long short-term memory network-based prediction. J. Clean. Prod. 2022, 359, 132085. [Google Scholar] [CrossRef]
  17. Yu, Z.; You, W.; Agathokleous, E.; Zhou, G.; Liu, S. Forest management required for consistent carbon sink in China’s forest plantations. For. Ecosyst. 2021, 8, 726–734. [Google Scholar] [CrossRef]
  18. Gu, L.; Gong, Z.; Bu, Y. Forest Quality Dynamic Change and Its Driving Factors Accompanied by Forest Transition in China. Forests 2021, 12, 733. [Google Scholar] [CrossRef]
  19. Liu, S.; Pang, Y.; Zhang, H.; Wang, B.; Ye, B.; Jiang, Z.; Xie, H.; Niu, X.; Wang, D.; Ding, Y.; et al. Evaluation Indicator System and Method Designed for Natural Forest Protection Program of China. Acta Ecol. Sin. 2021, 41, 5067–5079. [Google Scholar]
  20. Chen, N.; Qin, F.; Zhai, Y.; Cao, H.; Zhang, R.; Cao, F. Evaluation of coordinated development of forestry management efficiency and forest ecological security: A spatiotemporal empirical study based on China’s provinces. J. Clean. Prod. 2020, 260, 121042. [Google Scholar] [CrossRef]
  21. Wu, Y.; Lin, S. Efficiency evaluation of Asia’s cultural tourism using a dynamic DEA approach. Socio-Econ. Plan. Sci. 2022, 84, 101426. [Google Scholar] [CrossRef]
  22. Liang, S.; Yang, J.; Ding, T. Performance evaluation of AI driven low carbon manufacturing industry in China: An interactive network DEA approach. Comput. Ind. Eng. 2022, 170, 108248. [Google Scholar] [CrossRef]
  23. Huang, Y.; He, X.; Dai, Y.; Wang, Y.-M. Hybrid game cross efficiency evaluation models based on interval data: A case of forest carbon sequestration. Expert Syst. Appl. 2022, 204, 117521. [Google Scholar] [CrossRef]
  24. Niu, H.; Luo, M.; Zhang, Z. Evaluation and Prediction of Low-Carbon Economic Efficiency in China, Japan and South Korea: Based on DEA and Machine Learning. Int. J. Environ. Res. Public Health 2022, 19, 12709. [Google Scholar] [CrossRef]
  25. Caves, D.W.; Christensen, L.R.; Diewert, W. The economic theory of index numbers and the measurement of input, output, and productivity. Econometrica 1982, 50, 1393–1414. [Google Scholar] [CrossRef]
  26. Zhai, R.; Lou, Z. Chinese agricultural output and TFP: 1661–2019. Econ. Lett. 2022, 213, 110415. [Google Scholar] [CrossRef]
  27. Zhang, C. Research on the Fluctuation and Factors of China TFP of IT Industry. J. Ind. Integr. Manag. 2019, 4, 1950013. [Google Scholar] [CrossRef]
  28. Qu, X.; Wang, Z. Evaluation of Green Total Factor Productivity of China’s Tobacco Manufacturing Industry Based on DEA-Malmquist Index Method. E3S Web Conf. 2021, 261, 3027. [Google Scholar] [CrossRef]
  29. Xu, H.; Liu, X. Research on TFP Change and Convergence of China’s Regional Real Estate Industry. IOP Conf. Ser. Earth Environ. Sci. 2019, 371, 022023. [Google Scholar] [CrossRef]
  30. Yin, S.; Gong, Z.; Gu, L.; Deng, Y.; Niu, Y. Driving forces of the efficiency of forest carbon sequestration production: Spatial panel data from the national forest inventory in China. J. Clean. Prod. 2022, 330, 129776. [Google Scholar] [CrossRef]
  31. Chen, L.; Wang, Y.; Ren, C.; Zhang, B.; Wang, Z. Assessment of multi-wavelength SAR and multispectral instrument data for forest aboveground biomass mapping using random forest kriging. For. Ecol. Manag. 2019, 447, 12–25. [Google Scholar] [CrossRef]
  32. Liao, Z.; He, B.; Quan, X. Potential of texture from SAR tomographic images for forest aboveground biomass estimation. Int. J. Appl. Earth Obs. Geoinf. 2020, 88, 102049. [Google Scholar] [CrossRef]
  33. Qin, S.; Nie, S.; Guan, Y.; Zhang, D.; Wang, C.; Zhang, X. Forest emissions reduction assessment using airborne LiDAR for biomass estimation; Resources. Conserv. Recycl. 2022, 181, 106224. [Google Scholar] [CrossRef]
  34. Tian, Y.; Huang, H.; Zhou, G.; Zhang, Q.; Tao, J.; Zhang, Y.; Lin, J. Aboveground mangrove biomass estimation in Beibu Gulf using machine learning and UAV remote sensing. Sci. Total Environ. 2021, 781, 146816. [Google Scholar] [CrossRef]
  35. Vatandaşlar, C.; Abdikan, S. Carbon Stock Estimation by Dual-Polarized Synthetic Aperture Radar (SAR) and Forest Inventory Data in a Mediterranean Forest Landscape. J. For. Res. 2022, 33, 827–838. [Google Scholar] [CrossRef]
  36. Fang, J.; Guo, Z.D.; Piao, S.L.; Chen, A.P. Terrestrial vegetation carbon sinks in China; 1981–2000. Sci. China Ser. D Earth Sci. 2007, 50, 1341–1350. [Google Scholar] [CrossRef]
  37. Pan, Y.; Luo, T.; Birdsey, R.; Hom, J.; Melillo, J. New Estimates of Carbon Storage and Sequestration in China’s Forests: Effects of Age-Class and Method On Inventory-Based Carbon Estimation. Clim. Chang. 2004, 67, 211–236. [Google Scholar] [CrossRef]
  38. Ali, A.; Ashraf, M.I.; Gulzar, S.; Akmal, M. Estimation of forest carbon stocks in temperate and subtropical mountain systems of Pakistan: Implications for REDD+ and climate change mitigation. Environ. Monit. Assess. 2022, 192, 198. [Google Scholar] [CrossRef] [PubMed]
  39. Dar, J.A.; Rather, M.Y.; Subashree, K.; Sundarapandian, S.; Khan, M.L. Distribution patterns of tree, understorey, and detritus biomass in coniferous and broad-leaved forests of Western Himalaya, India. J. Sustain. For. 2017, 36, 787–805. [Google Scholar] [CrossRef]
  40. Kumar, A.; Kishore, B.; Saikia, P.; Deka, J.; Bharali, S.; Singha, L.; Tripathi, O.; Khan, M. Tree diversity assessment and above ground forests biomass estimation using SAR remote sensing: A case study of higher altitude vegetation of North-East Himalayas, India. Phys. Chem. Earth Parts A/B/C 2019, 111, 53–64. [Google Scholar] [CrossRef]
  41. Nogueira, E.M.; Fearnside, P.M.; Nelson, B.W.; Barbosa, R.I.; Keizer, E.W.H. Estimates of forest biomass in the Brazilian Amazon: New allometric equations and adjustments to biomass from wood-volume inventories. For. Ecol. Manag. 2008, 256, 1853–1867. [Google Scholar] [CrossRef]
  42. Joshi, V.C.; Negi, V.S.; Bisht, D.; Sundriyal, R.; Arya, D. Tree biomass and carbon stock assessment of subtropical and temperate forests in the Central Himalaya, India. Trees For. People 2021, 6, 100147. [Google Scholar] [CrossRef]
  43. Yao, R.; Bian, W.; Fan, H.; Guan, J. Analysis on the evolution of provincial forest carbon sequestration efficiency in China. Issues For. Econ. 2021, 41, 51–59. [Google Scholar] [CrossRef]
  44. He, X.; Chen, L.; Huang, Y. A study of forest carbon sink increment from the perspective of efficiency evaluation based on an inverse DEA model. Forest 2022, 13, 1563. [Google Scholar] [CrossRef]
  45. Shu, M.; Wu, J.; Li, C.; Ding, S. Analysis on the evolution of forest carbon sinks efficiency in natural forest protection project regions. Issues For. Econ. 2022, 42, 490–497. [Google Scholar] [CrossRef]
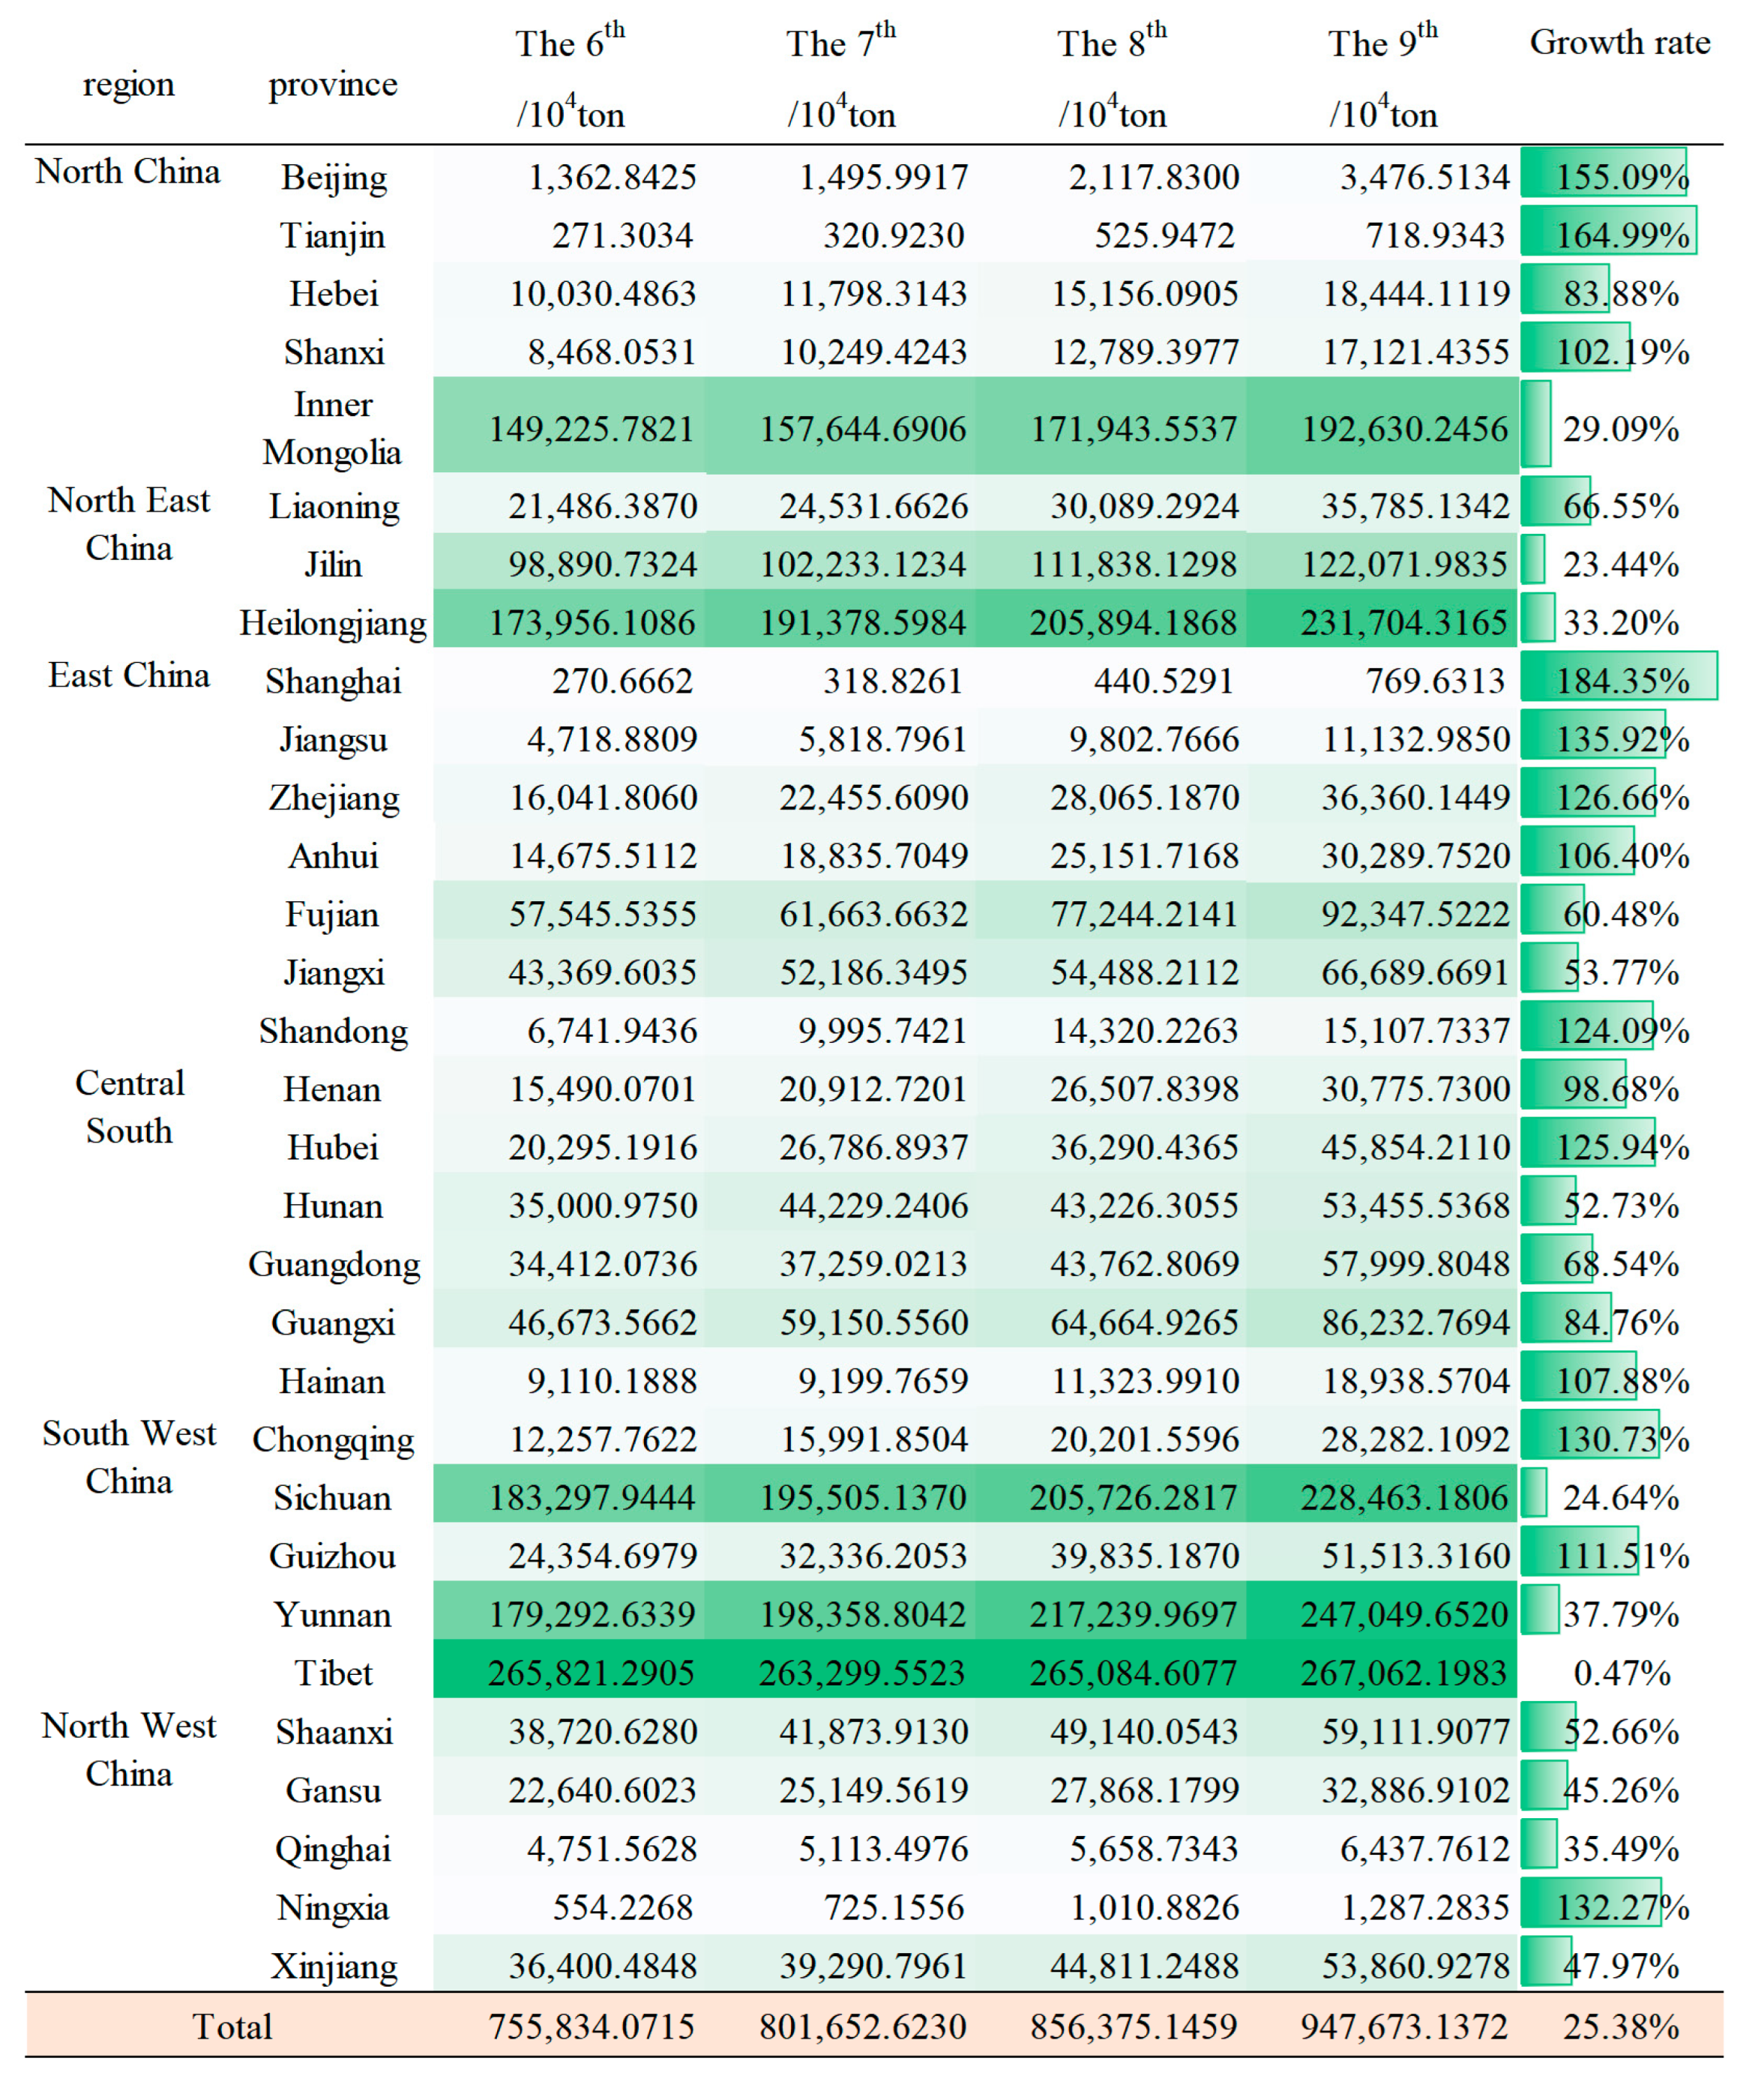
Figure 1. Provincial forest carbon storage during the 6th–9th forest resource inventories in China.
Forests 14 01629 g001
Figure 2. Forest carbon storage distribution during the 6th to 9th forest resource inventory in China. (a) during the 6th inventory, (b) during the 7th inventory, (c) during the 8th inventory, (d) during the 9th inventory.
Forests 14 01629 g002
Figure 3. Dynamic changes of forest carbon storage during the 6th–9th forest resource inventories.
Forests 14 01629 g003
Figure 4. Provincial FCSE and its factors during the 6th–9th forest resource inventories.
Forests 14 01629 g004
Figure 5. Provincial Effch and its factors during the 6th–9th forest resource inventories. (a) provincial average Effch valve, (b) provincial average Pech value, (c) provincial average Sech value.
Forests 14 01629 g005
Table 1. The provincial FCSE index system in China.
VariableIndexUnit
InputLaborNumber of employees of the forestry system at the end of the yearpeople
CapitalCompleted amount of forestry fixed assets investment104 yuan
LandForest area104 hectares
OutputCarbon storageForest carbon storage104 ton
Table 2. The carbon storage efficiency of provincial forests during the 6th to 9th forest inventories in China.
Region EffchTechPechSechTFP
North ChinaBeijing1.1280.9781.1480.9831.104
Tianjin1.2470.9781.0001.2471.220
Hebei1.2890.9201.4310.9011.185
Shanxi1.1990.9451.220.9831.133
Inner Mongolia1.0920.9481.0871.0041.036
Northeast ChinaLiaoning1.1430.9781.1490.9951.119
Jilin1.0650.9781.0760.9901.042
Heilongjiang1.0870.9781.0990.9901.063
East ChinaShanghai0.8640.9781.0000.8640.845
Jiangsu1.0770.9781.0741.0031.054
Zhejiang1.7490.8281.7570.9961.448
Anhui1.2270.9781.2300.9981.201
Fujian1.3400.9151.3650.9821.227
Jiangxi1.2280.9441.2550.9791.160
Shandong1.2250.9781.2270.9981.198
Central-SouthHenan1.1250.9781.1260.9981.100
Hubei1.1770.9781.1780.9991.151
Hunan1.1010.9781.1011.0001.077
Guangdong1.4650.8711.6360.8951.275
Guangxi1.1070.9781.1071.0001.083
Hainan1.5181.0341.5081.0071.569
Southwest ChinaChongqing1.0830.9781.0870.9971.06
Sichuan1.0190.9781.0750.9490.997
Guizhou1.1540.9431.1700.9861.088
Yunnan1.0490.9691.1110.9441.016
Tibet1.0000.6151.0001.0000.615
Northwest ChinaShaanxi1.0720.9781.0730.9991.049
Gansu0.9700.9780.9710.9980.949
Qinghai1.0300.9781.0340.9961.008
Ningxia1.1510.9782.3190.4961.126
Xinjiang0.9840.9780.9850.9990.963
mean1.1490.9481.1890.9661.089
Disclaimer/Publisher’s Note: The statements, opinions and data contained in all publications are solely those of the individual author(s) and contributor(s) and not of MDPI and/or the editor(s). MDPI and/or the editor(s) disclaim responsibility for any injury to people or property resulting from any ideas, methods, instructions or products referred to in the content.