Abstract
Pinus massoniana (Lamb.) is an important plantation species in southern China. Accurate measurement of P. massoniana seedling morphological indicators is crucial for accelerating seedling quality assessment. Machine vision, with its objectivity and stability, can replace human eyes in performing these measurements. In this paper, a measurement method for seedling morphological indicators based on Euclidean distance, Laplacian contraction, PointNet++, and 3D reconstruction is proposed. Firstly, multi-angle sequence images of 30 one-year-old P. massoniana seedlings were collected, distorted, and corrected to generate a sparse point cloud through the Structure-from-Motion (SFM) and dense point cloud through the Patch-Based Multiple View Stereo (PMVS). Secondly, a Dense Weighted Semantic Segmentation Model based on PointNet++ was designed, achieving effective segmentation of the P. massoniana seedling point clouds. Finally, a multi-iteration plane method based on Laplacian contraction was proposed. The new skeleton points were refined by minimizing the Euclidean distance, iteratively generating the optimal morphological skeleton, thus facilitating the extraction of morphological indicators. The experimental results demonstrated a good correlation between the machine vision-extracted morphological indicators (including plant height, ground diameter, and height-to-diameter ratio) and manually measured data. The improved PointNet++ model achieved an accuracy of 0.9448 on the training set. The accuracy and Mean Intersection over Union (MIoU) of the test set reached 0.9430 and 0.7872, respectively. These findings can provide reliable technical references for the accurate assessment of P. massoniana seedling quality and the promotion of digital forestry construction.
1. Introduction
Forests serve as the cradle of human civilization, and artificial forests, as an important component of China’s forest resources, play an increasingly prominent role in maintaining global carbon balance and mitigating global warming [1]. In a series of ecological projects implemented in China, such as the Grain for Green Program, Pinus massoniana (Lamb.), as a crucial pioneer afforestation species in barren mountainous areas, has significantly improved the low forest coverage and scarcity of forest resources [2,3]. P. massoniana, known for its preference for sunlight, drought tolerance, strong adaptability, rapid growth, and high economic value, is widely distributed in China’s subtropical regions, making significant contributions to the development of artificial forests [4].
High-quality and robust seedlings serve as the material foundation and prerequisite for the sustainable development of plantation forestry. The quality of P. massoniana seedlings directly affects the success of afforestation, operational costs, and economic benefits. Therefore, employing scientifically sound methods for evaluating seedling quality is a crucial mean of ensuring the production of superior seedlings [5,6].
Currently, the main indicators used to evaluate the quality of nursery seedlings and establish grading standards are morphological indicators. These indicators primarily include seedling height, ground diameter, height-to-diameter ratio, root system morphology, stem–root ratio, and apical bud, among other comprehensive quality indices. These indicators are closely related to the growth status of the seedlings [7,8]. Traditional measurements of seedling height and ground diameter rely heavily on tools such as vernier calipers and rulers, which are time-consuming, inefficient, and prone to significant subjective errors in manual measurements [9].
To enhance the accuracy of morphological indicator measurements, researchers have integrated computer technology, image processing techniques, machine vision, and Deep Learning (DL) techniques into the extraction of seedling morphological indicators [10,11,12,13,14]. McGuinness et al. [15] proposed three algorithms that effectively and accurately measure the morphological features of the stem, height, and root system of radiata pine seedlings in New Zealand. They also developed a machine vision system for the sorting of radiata pine seedlings. The study employed denoising and segmentation techniques for preprocessing the acquired images and introduced an algorithm for measuring the feature dimensions of the images. The results demonstrated a strong correlation between the measured data of seedling features obtained by the machine vision system and the actual values. Suo Rui et al. [16] proposed a transfer learning approach for apple seedling segmentation based on Blend Mask with ResNet-101. The novel labeling strategy employed in this study contributed to improved accuracy in image segmentation, enabling precise measurement of apple seedling morphological indicators. Hao et al. [17] applied Mask Region Convolutional Neural Networks (Mask R-CNNs) and Residual Neural Network-50 (ResNet-50) to segment Chinese fir, achieving an F1 score of 84.7% and an IoU score of 91.3%.
Accurate and robust plant segmentation based on DL is a key technique in machine vision for measuring morphological indicators [18,19]. Compared to traditional plant segmentation methods, DL approaches exhibit significant advantages in various aspects, including speed and accuracy [20,21,22,23]. Expanding DL from two-dimensional (2D) to three-dimensional (3D) research applications is currently a trending research direction [24,25]. Utilizing machine vision techniques to acquire image-based 3D models of seedlings offers several advantages. It eliminates the need for strict research environments, mitigates costly expenses, and enables the capture of color, texture information, and improved measurement precision [26,27]. Sun et al. [28] proposed a high-throughput, three-dimensional rapid plant point cloud reconstruction method based on autonomous calibration of the Kinect v2 sensor position. The sensor captured two Red–Green–Blue-Depth (RGB-D) images of the turntable surface, automatically calculated the center point and normal vector of the turntable rotation axis, and aligned the coordinate systems of the depth images taken from different viewpoints to achieve coarse registration. Subsequently, the iterative closest point algorithm was employed for precise registration of the multi-viewpoint point cloud, enabling fast three-dimensional point cloud reconstruction and extraction of morphological parameters for greenhouse plants. Turgut et al. [29] employed a DL approach based on a 3D point cloud to achieve segmentation and morphological feature extraction of plants in the Rosa genus. The study utilized six novel point cloud-based DL architectures to segment the structural components of the rose tree models and generate 3D models. The results indicated that among the six methods, PointNet++ exhibited the highest segmentation accuracy. The advantage of PointNet++ lies in its flexibility in handling the hierarchical organization of point cloud data. By iteratively extracting features from the neighborhood of each point, PointNet++ enables the network to effectively capture local features of the point cloud [30].
The aforementioned studies have demonstrated the accuracy and effectiveness of morphological feature extraction methods using three-dimensional reconstruction techniques. However, there is currently limited research on the reconstruction of three-dimensional point cloud models for coniferous seedlings. In order to address this gap, we proposed a viable theoretical approach to further meet the demands of technology-assisted ecological engineering in forestry. In this paper, a series of corrected two-dimensional images of P. massoniana from multiple viewpoints were collected, and these images were reconstructed into a 3D point cloud, which then underwent preprocessing. Subsequently, a dense weighted semantic segmentation network based on PointNet++ was introduced to construct a dense weighted semantic segmentation model. Finally, a multi-iteration plane method based on Laplacian contraction to extract the skeletal points of the stems in a refined manner was designed, enabling the extraction of morphological feature values for P. massoniana. This research provides a novel method for detecting morphological indicators during the process of seedling production and cultivation.
2. Materials and Methods
This study primarily focuses on the non-destructive measurement of morphological indicators of P. massoniana. The research involves the collection of images and the utilization of the SFM [31] and PMVS [32] algorithms for reconstructing P. massoniana seedlings. Various processing techniques were applied to the resulting point cloud of P. massoniana, enabling the extraction of seedling morphological indicators. The experimental workflow is illustrated in Figure 1.
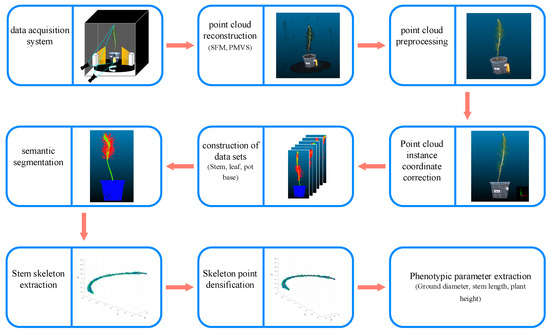
Figure 1.
Experimental workflow.
2.1. Sample and Experimental Environment
The P. massoniana seedling samples used in this study were sourced from the Qingyuan Nursery in Yizhou District, Hechi City, Guangxi, China. A total of 30 one-year-old seedlings with diverse morphological characteristics were selected, and a subset of these samples is illustrated in Figure 2. Environment for multi-angle image acquisition is illustrated in Figure 3. Parameters of industrial camera and lens are illustrated in Table 1.
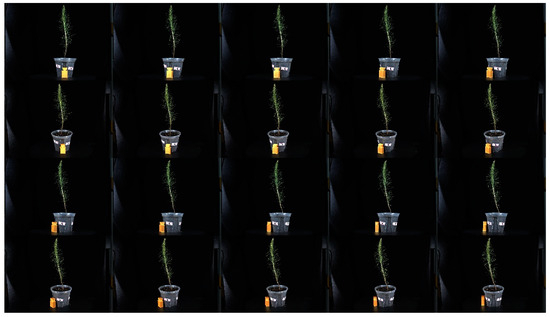
Figure 2.
Samples of ten P. massoniana samples with distinct morphological features.
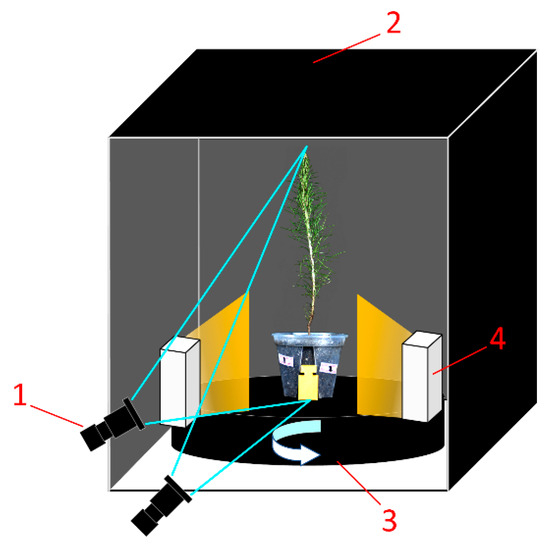
Figure 3.
Environment for multi-angle image acquisition of P. massoniana seedlings. 1—camera; 2—dark box; 3—turntable; 4—strip light source.

Table 1.
Parameters of industrial camera and lens.
2.2. Camera Calibration
To achieve high-precision 3D reconstruction, it is necessary to obtain the camera’s parameter matrix and perform distortion correction on the images. Camera calibration involves solving parameters such as intrinsic parameters and distortion parameters. In this study, Zhang Zhengyou’s calibration method [33] was chosen for its simplicity of operation and high accuracy in obtaining these parameters. A chessboard pattern with a size of 4 × 5 and a grid size of 20 per cell was used as the calibration target. Initially, a total of 60 images capturing the chessboard pattern at various poses were collected. Subsequently, the Zhang Zhengyou camera calibration method was applied to obtain the camera’s parameter matrix. To determine the scaling factor of the P. massoniana point cloud, a known-sized calibration block was placed during the capture process. The scaling factor was calculated by comparing the point cloud height of the calibration block with its actual height.
2.3. Acquisition and Preprocessing of Point Cloud
2.3.1. Acquisition of Point Cloud
After distortion correction, multi-angle images of P. massoniana were processed using the SFM algorithm to obtain an initial sparse point cloud, which is then refined into a dense point cloud using the Patch-Based PMVS algorithm. However, due to the minimal color difference and indistinctive shape features of the leaf at the top of P. massoniana seedlings, the algorithm detected only a few feature points, resulting in scattered and discontinuous point cloud data. To address this issue, paper labels were added to the pots containing the seedlings to increase the number of feature points, thereby enhancing the accuracy of the three-dimensional reconstruction of P. massoniana seedlings.
2.3.2. Point Cloud Denoising
Due to the influence of the shooting environment and image background, the obtained dense point cloud of P. massoniana seedlings contained irrelevant points and abundant background noise. Therefore, further processing of the acquired dense point cloud was necessary to reduce the impact of irrelevant information and noise on subsequent plant semantic segmentation and extraction of morphological parameters.
Firstly, prior to capturing multi-angle images of P. massoniana seedlings, a black background with a significant color contrast to the plants and a turntable were chosen. Thus, unrelated noise points resulting from the image background can be directly eliminated using RGB threshold segmentation. The RGB threshold (Red, Green, Blue) is set to (0,0,0)~(40,45,50).
Additionally, to address the issue of scattered outliers and abnormal points in the point cloud of P. massoniana seedlings, this study employed the Statistical Outlier Removal (SOR) filtering method [34] for removal. The SOR filtering algorithm calculates various metrics such as the average distance and standard deviation of each point’s surrounding k-nearest neighbors. By setting an appropriate threshold, the algorithm identifies and eliminates the noise points from the point cloud. The SOR filtering algorithm is configured with a neighborhood point count of k = 6 and a standard deviation multiplier parameter of nSigma = 1.
2.3.3. Point Cloud Coordinate Calibration
The dense point cloud of P. massoniana obtained using SFM-PMVS was unordered and inconsistent. To facilitate the subsequent experimental measurement of various scalar parameters of the P. massoniana point cloud, it is necessary to redefine the coordinate system.
Due to the intricate and complex stem and leaf structure of P. massoniana, it is not suitable for coordinate calibration. Therefore, the point cloud of the pot was first clipped using CloudCompare software 2.12.3. Then, four points, , located on the circular top surface of the pot, were selected which are the minimum and maximum coordinates on the and axes, respectively, as shown in Figure 4.
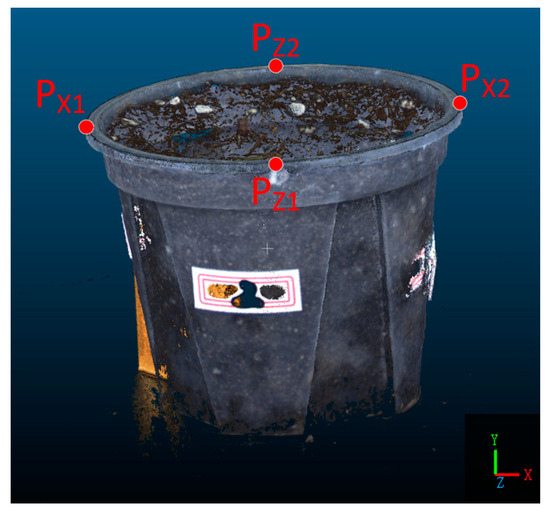
Figure 4.
Coordinate Calibration.
Firstly, two points, , are selected. After applying the rotation matrix , the transformed points, , are obtained, ensuring that the line segment formed by is perpendicular to the -axis. By utilizing the equality of the -coordinates of the transformed points, the rotation angle of the point cloud around the -axis can be determined. The coordinate transformation equation for the point cloud is represented by Equation (1):
where represents the index of the -th point, and denotes the angle of rotation of the point cloud around the -axis.
Next, two points, , are selected. After applying the rotation matrix , the transformed points, , are obtained, and the line segment formed by connecting is perpendicular to the -axis. By utilizing the constraint of equal -coordinates for the transformed points, the rotation angle around the -axis for the point cloud is determined. The point cloud coordinate transformation is given by Equation (2):
where represents the index of the -th point, and denotes the angle of rotation around the -axis for the point cloud.
In conclusion, the corrected point cloud of P. massoniana exhibits a bottom surface point cloud parallel to the plane, while the stem point cloud extends vertically along the -axis. The coordinate calibration equation for the P. massoniana seedling point cloud is represented by Equation (3):
where represents the index of the -th point, denotes the -th point, and represents the -th point after correction.
2.4. Dense Weighted Semantic Segmentation Model Based on PointNet++
In subsequent experiments aimed at extracting morphological indicators from P. massoniana seedlings, different parts of the plant were used to correspond to distinct morphological characteristics. For instance, the pot containing the P. massoniana seedling represents irrelevant background information and needs to be removed prior to measuring the morphological indicators of the stem and leaf. The stem section of P. massoniana can provide parameters such as stem length and ground diameter, while the combination of the stem and leaf sections enables the extraction of the tree height parameter.
The semantic segmentation using the PointNet++-based dense weighted model allows for the rapid and automated segmentation of different parts of P. massoniana point cloud, facilitating subsequent parameter measurements. Compared to the original PointNet++ model, the PointNet++-based dense weighted semantic segmentation model exhibits higher accuracy. Given the dense leaves of P. massoniana with its close connection to the stem, and the green appearance of the stem surface, traditional clustering and threshold segmentation methods prove inadequate, while the PointNet++-based dense weighted semantic segmentation model successfully accomplishes the segmentation task.
PointNet [35] and PointNet++ [30] are DL networks that directly take point cloud data as input. PointNet initially elevates the coordinates of each point to high-dimensional features using Multilayer Perceptrons (MLPs), and then obtains global features through max pooling. Finally, fully connected MLPs [29] are employed. However, this design limitation hinders PointNet’s ability to effectively extract local fine-grained features.
PointNet++ consists of two main layers: the Hierarchical Set Abstraction (SA) layer and the Feature Propagation (FP) layer. The SA layer includes the sampling and grouping stages. Firstly, the Furthest Point Sample (FPS) algorithm is employed to uniformly sample a fixed number of points from the input point cloud. Then, each sampled point forms a local neighborhood with a radius of R, resulting in multiple overlapping neighborhoods that partition the input point cloud. Finally, PointNet is applied to each neighborhood to extract features specific to that neighborhood. On the other hand, the FP layer propagates the extracted features from each local neighborhood back to the original input point cloud. Therefore, PointNet++ aims to extract fine-grained features at different scales of the input point cloud, focusing on local rather than global information.
Due to the numerous imbalances in the total number of sample points among different classes in the dataset, training the model directly yields unsatisfactory results. Therefore, to achieve a better balance among the quantities of pot, stem, and leaf samples in the entire dataset, this study incorporated class balance weights into the loss function. When calculating the class balance weights, the total number of each class in the dataset is first computed, and the proportion of each class in the dataset is determined using Equation (4):
where represents the total number of points labeled as in the training set; represents the total number of all points in the training set; 0 denotes the pot, 1 denotes the stem, and 2 denotes the leaf; and represents the proportion of labels in the dataset.
Subsequently, the average proportion, denoted as the , is computed for each class. Based on the and , the balanced weights for each class in the dataset are determined using Equation (5):
where represents the balancing weight for each class.
The FP layer of PointNet++ propagates local features to the input point set through only two MLP layers. However, when the input point set contains a large number of points, it may lead to incorrect feature assignment for some points. Therefore, this study introduced a feature point adaptive weighting module that calculates the weights of the features of points output by the FP layer across different channels. These weights are then multiplied with the original features, thereby enhancing the expression of the original features and improving the segmentation accuracy of the input point set.
The feature point adaptive weighting module designed in this study consists of 1 adaptive average pooling layer, 1 adaptive max pooling layer, 4 1D convolutional layers, 2 LeakyReLU activation function layers, and 1 Sigmoid activation function layer. The architectural diagram is shown in Figure 5.
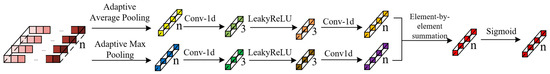
Figure 5.
Structure of the feature point adaptive weighting module.
Equation (6) represents the computational formula for the feature point adaptive weighting module:
where represents the Sigmoid activation function; denote the weights of the first and second convolutional layers within this module; and refer to the tensors resulting from adaptive average pooling and adaptive max pooling, respectively.
Furthermore, to enhance the classification capability of the fully connected (FC) layer in the network, this study also introduced a dense mapping block that incorporates a feature point adaptive weighting module. By progressively reducing the feature output dimensions and iteratively optimizing the feature weights at each layer, the accuracy of the network is further improved.
The dense mapping block designed in this study consists of 1D convolutional layers, 1D BatchNorm layers, ReLU activation function layers, feature point adaptive weighting modules, and Dropout layers, with a dropout probability of 0.1 for each neuron. The structure of the dense weighted semantic segmentation network, built based on PointNet++, is illustrated in Figure 6.
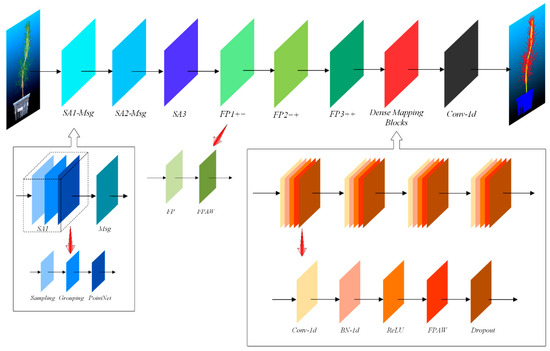
Figure 6.
Structure of the dense weighted semantic segmentation network constructed based on PointNet++.
In this study, a multi-angle image-based approach was employed to perform 3D reconstruction of P. massoniana. Subsequently, a series of data processing steps, including image distortion correction, point cloud denoising, and coordinate calibration, were conducted to obtain high-quality point cloud data. Moreover, to facilitate the rapid measurement of morphological indicators from the acquired P. massoniana point cloud, an improved PointNet++ algorithm was utilized for semantic segmentation. This allowed for the classification of the point cloud into three categories: pot, stem, and leaf.
The dataset preparation was performed using Cloud-Compare software, where each P. massoniana point cloud was manually divided into three parts. The training and testing sets were split in an 8:2 ratio. An example of the created dataset is shown in Figure 7.
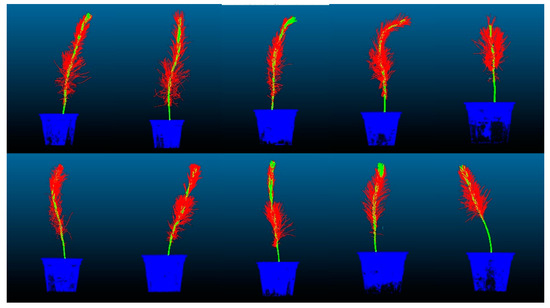
Figure 7.
Partial dataset of P. massoniana point cloud. In the figure, the point cloud in blue represents the pot with a label value of 0. The point cloud in green represents the stem with a label value of 1. The point cloud in red represents the leaves with a label value of 2.
The hardware and software studied were system: Windows 10; CPU: Intel I7-11700F 2.50 GHz; GPU: Nvidia GeForce RTX 3080Ti (12GB); and environment configuration: Py-Charm + Pytorch1.8 + Python 3.7.4 + Cuda 12.1, Agisoft Metashape, Cloud-Compare 2.12.3, MATLAB R2021b.
2.5. Multi-Iteration Plane Method Based on Laplacian Contraction
After obtaining the segmented stem point cloud of P. massoniana seedlings, extraction of the stem skeleton points is necessary to measure the stem length, ground diameter, and height-to-diameter ratio. The original Laplacian contraction algorithm tends to produce skeleton points with large intervals, leading to large errors when calculating the stem length. Therefore, this study proposed a multi-iteration plane method based on Laplacian contraction. By slicing the original stem point cloud into layers using the Laplacian contraction algorithm, new skeleton points are generated within each point cloud layer. These new skeleton points are positioned to minimize the sum of Euclidean distances between themselves and all other points in the corresponding point cloud layer. The refinement process improves the measurement accuracy of morphological indicators for P. massoniana seedlings. For complex morphological structures in certain P. massoniana samples, increasing the number of iterations allows for the extraction of skeleton points that accurately reflect the growth status of the stem.
2.5.1. Nearest-Neighbor Sorting
The skeleton points extracted by the Laplacian contraction algorithm are unordered, thus requiring sorting of the skeleton points before the multi-plane iteration.
The skeleton points extracted using the Laplacian contraction algorithm are denoted as the point set , and the sorted skeleton points are denoted as the point set . Initially, the point set is an empty set. Firstly, the point with the minimum -axis in the point set is selected as the starting point. is removed from the point set and appended to the point set . Subsequently, the updated point set is searched to find the point with the minimum distance () from the end point of the updated point set . is then removed from the point set and appended to the point set . This process is repeated, resulting in the correctly sorted point set . The distance is calculated using Equation (7):
where represent the coordinates of points .
2.5.2. Skeleton Refinement of P. massoniana Stem Point Cloud
After obtaining the sorted set of points, , firstly, select two points, and , and consider the vector passing through these two points as the normal vector, . Construct two planes, and , perpendicular to at these two points, respectively. Using and as plane constraints, obtain a subset of points, , representing the stem point cloud within these planes. Then, using the minimum bounding box of as a constraint, identify the point, , that minimizes the sum of Euclidean distances between and all points in . Next, take and as new reference points and repeat the aforementioned steps to obtain the second refined skeleton point, . Subsequently, compute the third skeleton point, , based on and . By iteratively repeating this process, a set of refined skeleton points, , can be obtained. The workflow of the multi-iteration plane method based on Laplacian contraction is illustrated in Figure 8.
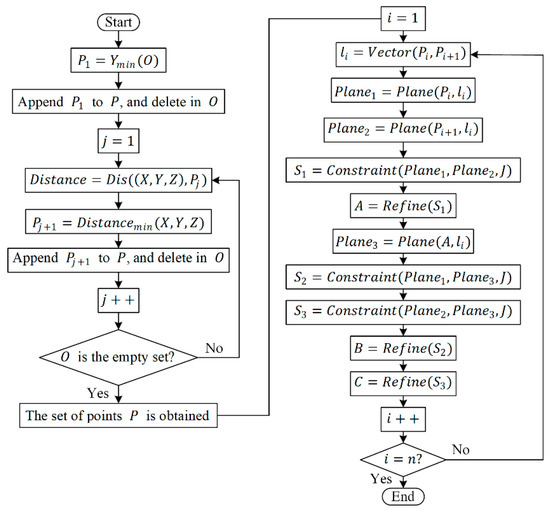
Figure 8.
The flowchart of the multi-iteration plane method. Note: The function finds the element in the point set with the minimum value. Prior to the algorithm’s initiation, is an empty set. The function calculates the Euclidean distance between two points in space. The function is used to determine the coordinates corresponding to the minimum distance. The function computes the normal vector of the line segment connecting these two points. The function identifies a plane passing through the input point and perpendicular to the input normal vector. represents the set of points in the stem of P. massoniana. The function is employed to find a new set of points by constraining the stem points within the input plane, obtained by using the minimal bounding box of the partial point set as the constraint. The function is computed as follows: first, compute , where represents the coordinates of the current element during the traversal of the input point set, represents the coordinates of the -th element within the input point set, and is the number of elements in the input point set. Then, identify the coordinates that minimize , which serves as the output of the function.
2.6. Acquisition of Morphological Indicators for P. massoniana Seedlings
The morphological indicators investigated in this study for P. massoniana primarily include plant height, stem length, ground diameter, and height-to-diameter ratio.
In this study, the true plant height of P. massoniana samples was measured using a measuring tape. The true ground diameter was measured using an electronic caliper. For measuring the true stem length of P. massoniana seedlings, a flexible ruler was placed along the curve of the stem, and then straightened to measure its length. The ratio of plant height to ground diameter is referred to as the height-to-diameter ratio of P. massoniana.
After calibration, the point cloud of P. massoniana exhibits a bottom plane parallel to the plane, while the direction of the stem is vertically aligned along the -axis. Therefore, the difference between the maximum and minimum values in the -axis direction of the stem and leaf point cloud represents the plant height, denoted as . By slicing the point cloud using two refined skeleton points at the bottom of the stem point cloud, the sum of the differences between the maximum and minimum values in the and -axis directions of the sliced point cloud, divided by two, gives the ground diameter, denoted as . The sum of the Euclidean distances between the refined skeleton points provides the stem length, denoted as . The ratio of plant height to ground diameter is defined as the height-to-diameter ratio, denoted as . These relationships are mathematically described by Equations (8)–(11):
where represents the point with the maximum -axis in the leaf point cloud; and correspond to the points with the maximum and minimum -axis values, respectively, in the stem point cloud; , , , and denote the points with the maximum and minimum - and -axis values in the stem point cloud slice; , , and denote the coordinates of the -th point in the refined skeleton points, with representing the total number of skeleton points; , , , and refer to the points with the maximum and minimum - and -axis values, respectively, in the leaf point cloud.
2.7. Evaluation Indicators
In this study, the accuracy of the semantic segmentation for the P. massoniana point cloud was evaluated using measures such as and Mean Intersection over Union (). The accuracy of skeleton extraction was assessed using the determination coefficient () for the stem length parameter of P. massoniana. The precision of three-dimensional reconstruction was evaluated according to Equations (12) and (13):
where represents the number of categories in the dataset. represents the number of accurately predicted point clouds. and denote the misclassified point clouds, where refers to the number of point clouds with a true label of but predicted as , and refers to the number of point clouds with a true label of but predicted as .
3. Results and Discussion
3.1. Camera Parameter Matrix
The parameters required for camera calibration were calculated and are presented in Table 2. The consistency between the resolution of the calibrated images and the actual resolution indicates the correctness of the camera calibration experiment results.
Table 2.
Camera parameters.
Figure 9 illustrates both the original images and the images after distortion parameter correction. Figure 9a,b represent the original images captured by the frontal and oblique cameras. Figure 9c,d represent distortion-corrected images. The inconsistency in the proportion of seedlings displayed is due to the fact that the seedlings in the corrected image are not the actual size. In this study, a calibration block was introduced to determine the scaling factor and restore it to its true size.
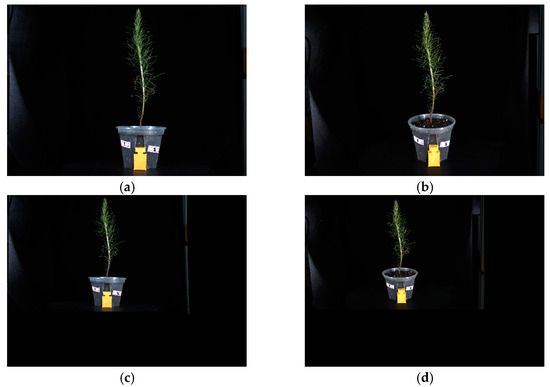
Figure 9.
Original image and distortion-corrected image. (a,b) represent the original images captured by the frontal and oblique cameras, respectively, while (c,d) represent the images after distortion correction.
3.2. P. massoniana Point Cloud
3.2.1. Original P. massoniana Seedling Point Cloud
To validate the significance of maintaining seedling stability during the acquisition of multi-angle images for three-dimensional reconstruction, this section compares the reconstruction results of two image acquisition methods.
Figure 10a shows the point cloud of P. massoniana reconstructed from the multi-angle images captured during continuous rotation of the turntable, depicting one full rotation of the seedling. In Figure 10b, the turntable rotated at a fixed angle of 5°, and the images were captured after waiting for the seedling to stabilize, resulting in the reconstructed point cloud of the seedling. It is evident that the point cloud in Figure 10a exhibited noticeable ghosting artifacts, resulting in significant measurement errors of the ground diameter. This is primarily attributed to the slender and tall stems of P. massoniana seedlings which, even with low-speed rotation, can shake. Conversely, the point cloud in Figure 10b demonstrates that waiting for the P. massoniana seedling to stabilize before image capture effectively reduces the ghosting artifacts caused by these jitters.
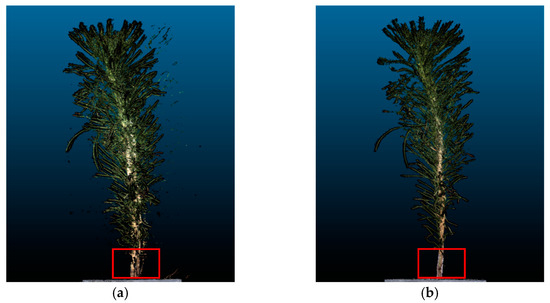
Figure 10.
Three-dimensional reconstruction results of two image acquisition methods. (a) Point cloud reconstructed under continuous rotation. (b) Point cloud reconstructed after stabilization.
A partial point cloud of P. massoniana seedlings obtained through 3D reconstruction is shown in Figure 11.
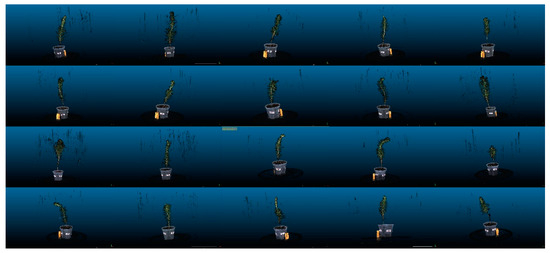
Figure 11.
Partial point cloud of P. massoniana seedlings after 3D reconstruction.
3.2.2. Point Cloud Denoising
In this section, threshold segmentation is applied to remove irrelevant noise points such as the background with black color. The filtering algorithm was selected to eliminate scattered outliers and abnormal points in the point cloud. After the above preprocessing, a higher accuracy and fewer outliers in the P. massoniana seedling point cloud can be obtained, and the complex branch and leaf structures at the top of the plants were also more clearly visible. Figure 12 illustrates the point cloud before and after denoising for a P. massoniana seedling.
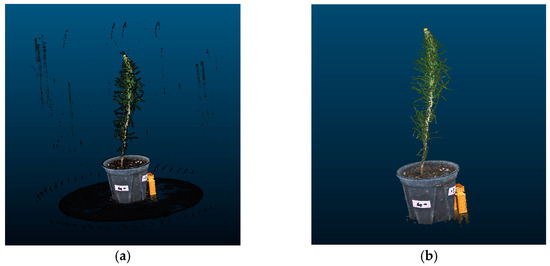
Figure 12.
P. massoniana point cloud before and after denoising. (a) Original point cloud of P. massoniana seedling. (b) Denoised point cloud of P. massoniana seedling.
3.2.3. Point Cloud Coordinate Calibration
To facilitate the extraction of morphological indicators from the P. massoniana point cloud for subsequent experiments, it is necessary to perform coordinate correction on the point cloud, aligning the basal plane of the P. massoniana with the plane. A P. massoniana point cloud before and after coordinate correction is shown in Figure 13.
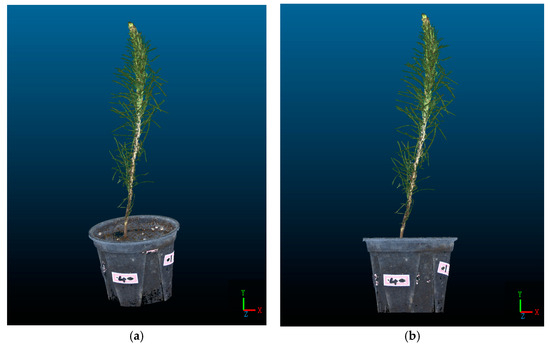
Figure 13.
Point cloud of P. massoniana seedling before and after coordinate correction. (a) Original point cloud of P. massoniana seedling. (b) The coordinate-corrected point cloud of P. massoniana seedling.
3.2.4. Comparisons with Previous Study
In 2019 [36], our team designed a non-contact morphological parameter extraction system for P. massoniana seedlings based on multi vision, including the establishment of a hardware experimental platform for seedling image acquisition and 3D reconstruction based on Delaunay triangulation algorithm. The reconstructed model diagram is shown in Figure 14. The difference between early surface reconstruction fitting and Figure 13b shows that the early details are clearly not refined enough, and the gaps between the pine needles of the seedlings could not be accurately fitted and segmented. The point cloud reconstruction method based on SFM and PMVS in this study had clearer images, and the subsequent extracted morphological index parameters were more accurate.
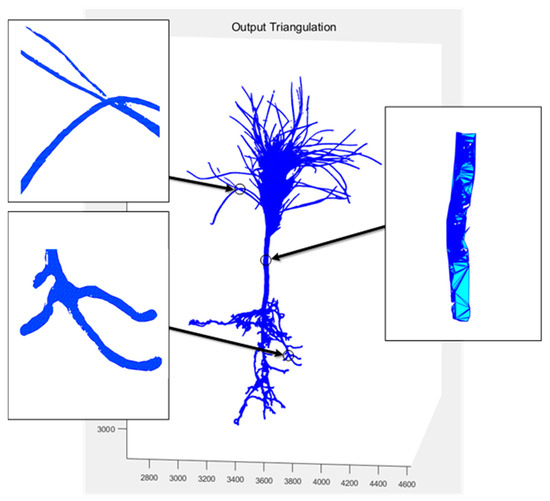
Figure 14.
3D model of surface fitting in previous study.
3.3. Dense Weighted Semantic Segmentation Model Based on PointNet++
By incorporating the feature point adaptive weighting module in the FP layer, the features are enhanced, enabling better capture of both local and global characteristics of P. massoniana point clouds. The addition of the dense mapping block in the FC layer, with progressively decreasing feature dimensions and adaptive adjustment of the weight for each feature point, further improves the accuracy of the network. The results of the PointNet++ model before and after the improvement are presented in Table 3.
Table 3.
Training results of the model.
The Accuracy, Loss, and mIOU curves during model training are illustrated in Figure 15.
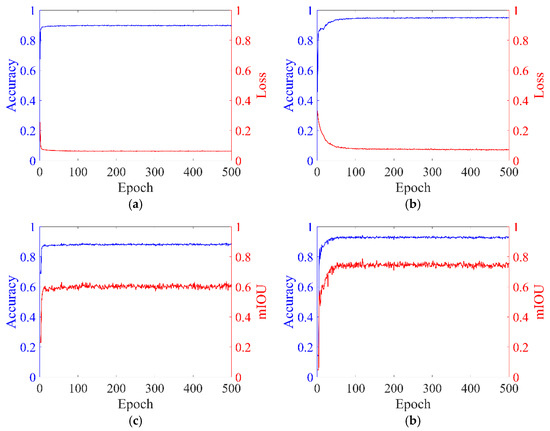
Figure 15.
Curves depicting model evaluation metrics. (a) Training Results of PointNet++. (b) Training Results of CDC-PointNet++. (c) Test Results of PointNet++. (b) Test Results of CDC-PointNet++.
The training set accuracy of the CDC-PointNet++ model reached 0.9448, demonstrating a 4.82% improvement compared to the original network. For the test set, the accuracy and mIoU achieved values of 0.9430 and 0.7872, respectively, representing improvements of 5.15% and 15.11% compared to the original network. The proposed feature point adaptive weighting module in this study enables adaptive learning of each point’s features, enhancing the original feature representation and providing a more comprehensive feature representation for the original network. Additionally, the proposed dense mapping block optimizes output features layer by layer, enhancing the network’s non-linearity, stability, and generalization ability, thereby improving the accuracy and mIoU of the final segmentation. The segmentation results of the dense weighted semantic segmentation model based on PointNet++ on the test set are visualized in Figure 16.

Figure 16.
Visualization of segmentation results.
3.4. Stem Point Cloud Skeleton Extraction
To obtain the stem length parameter of P. massoniana, this study employs the Laplacian contraction algorithm for skeleton extraction from the stem point cloud. By cumulatively calculating the Euclidean distance between adjacent points, the stem length parameter is determined. The extracted skeleton points are illustrated in Figure 17.
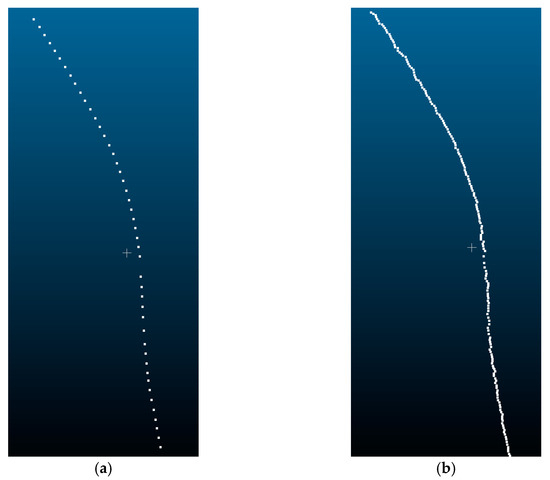
Figure 17.
Skeleton points of a P. massoniana stem point cloud. (a) Original skeleton points. (b) Refined skeleton points.
From Figure 17a, it can be observed that the extracted initial skeleton points have relatively large gaps between neighboring points. Moreover, due to the arc-shaped nature of P. massoniana stems, there is a large error when calculating the stem length parameter using Euclidean distances. To minimize this calculation error, this study employed a multi-iteration plane method based on Laplacian contraction to refine the initial skeleton points. The refined skeleton points are illustrated in Figure 17b.
The measured stem length parameters from the original skeleton points and the refined skeleton points are presented in Figure 18.
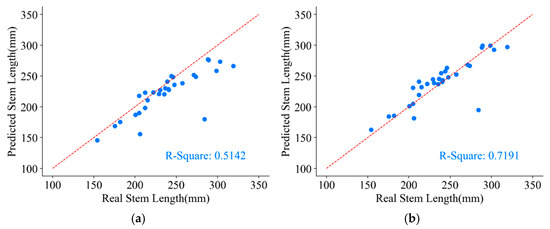
Figure 18.
Stem length parameter of a P. massoniana point cloud. (a) The stem length measured from the original skeleton points. (b) The stem length measured from the refined skeleton points.
As one of the challenging parameters to measure in plant morphological indicators, achieving high precision in stem length measurements is difficult. From Figure 18, it can be observed that the stem length parameter obtained from the original skeleton points underestimates the true values, with a coefficient of determination () of only 0.5142. This discrepancy arises from the large gaps between neighboring points in the original skeleton, rendering the direct use of Euclidean distances between neighboring points as a substitute for the arc length of P. massoniana unfeasible. However, after skeleton refinement, the value increases to 0.7191, resulting in a 20.49% improvement in stem length measurements compared to those obtained from the original skeleton points. This improvement is attributed to the fact that skeleton refinement reduces the distances between neighboring points, making the Euclidean distances between them more comparable to the arc length and thereby yielding stem length measurements that closely align with the true values.
3.5. Other Morphological Indicators of P. massoniana Seedlings
From the experiment, the predicted values and the actual values of the ground diameter, plant height, and height-to-diameter ratio parameters for 30 groups of P. massoniana seedlings obtained are shown in Figure 19.
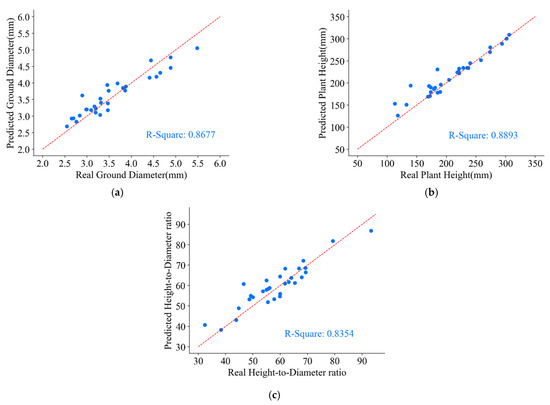
Figure 19.
Parameters of ground diameter, plant height, and height-to-diameter ratio for P. massoniana point cloud. (a) Predicted and real values of ground diameter. (b) Predicted and real values of plant height. (c) Predicted and real values of height-to-diameter ratio.
From Figure 19, it can be observed that the predicted ground diameter parameter of P. massoniana exhibited an accuracy of 0.8677 when compared to the ground truth values. The primary cause of inaccuracies in ground diameter measurements is the presence of some holes and outliers in the reconstructed point cloud of P. massoniana, which are difficult to eliminate through point cloud preprocessing. Furthermore, due to the positional relationship between stem and leaf point cloud and errors introduced by the manually annotated dataset, the semantic segmentation network failed to precisely segment the stem and leaf point cloud. In contrast, the predicted plant height parameter of P. massoniana demonstrated an accuracy of 0.8893 when compared to the ground truth values. This is because the plant height parameter measures the difference between the maximum and minimum -axis of the stem and leaf point cloud of P. massoniana. Notably, there were distinctive characteristics between the pot, the stem and leaf (the pot being at the bottom), enabling the semantic segmentation network to accurately segment the pot point cloud. Moreover, the for the predicted height-to-diameter ratio parameter of P. massoniana reached 0.8354. Additionally, during the measurement of P. massoniana morphological indicators, the use of calibration blocks to determine the scaling factor between the reconstructed seedling and the real seedling introduced errors that contributed to the predicted errors of P. massoniana seedling morphological indicators.
4. Conclusions
The aim of this study was to design a measurement method for morphological indicators of P. massoniana seedlings utilizing 3D reconstruction, semantic segmentation models, and skeleton extraction techniques.
- (1)
- For the 3D reconstruction of P. massoniana seedlings, an image acquisition platform was established to capture a multi-angle sequence of 2D images. After distortion correction, the images are used in SFM combined with PMVS to construct a 3D point cloud of P. massoniana seedlings. Preprocessing methods such as denoising and coordinate correction were applied to the original point cloud of P. massoniana.
- (2)
- The processed P. massoniana point cloud was used to create a dataset, and a dense weighted semantic segmentation network based on PointNet++ was proposed to enhance the representation of original features and improve the segmentation accuracy of the input point set. The experimental results demonstrated that the improved PointNet++ network accurately segments the pot, stem, and leaf of P. massoniana. The accuracy of the model on the training and testing sets reached 0.9448 and 0.9430, respectively, indicating its applicability and segmentation performance in point cloud segmentation.
- (3)
- To reduce measurement errors caused by large gaps between neighboring points, a multi-plane iterative method based on Laplacian contraction was employed to refine the skeleton points of the stem point cloud. After skeleton refinement, increased to 0.7191, representing a 20.49% improvement in stem length compared to measurements obtained from the original skeleton points. The predicted parameters of plant height, ground diameter, and height-to-diameter ratio for P. massoniana show good correlation with the ground truth values, with an average determination coefficient of 0.8641.
The proposed method and workflow are also applicable to other tree seedlings. This study replaces traditional manual measurement methods while meeting measurement accuracy and increases the stability of measurement data while reducing manual labor, providing a more accurate approach for rapid non-destructive measurements of seedling morphological indicators, as well as a reference for the precise sorting of P. massoniana seedlings. In the future, combined with measurements of the growth and changes in roots, comprehensive applications will be implemented according to the national seedling quality grading standards.
Author Contributions
Conceptualization, Y.L. (Yurong Li); methodology, Y.L. (Yurong Li); software, Y.L. (Yurong Li) and H.X.; validation, L.H.; formal analysis, Y.L. (Yurong Li) and H.X.; investigation, K.J.; resources, C.N.; data curation, Y.L. (Yurong Li) and H.X.; writing—original draft preparation, Y.L. (Yurong Li) and H.X.; writing—review and editing, Y.L. (Ying Liu); visualization, Y.L. (Yurong Li), H.X. and C.N.; supervision, Y.L. (Ying Liu); project administration, Y.L. (Ying Liu); funding acquisition, Y.L. (Ying Liu). All authors have read and agreed to the published version of the manuscript.
Funding
This research was funded by the National Natural Science Foundation of China (NSFC: 31570714) and the 2019 Jiangsu Province Key Research and Development Plan by the Jiangsu Province Science and Technology under grant BE2019112.
Data Availability Statement
The data are not publicly available because this study is still in progress.
Acknowledgments
We thank Zilong Zhuang, Wei Yu, Chenxi Zhou, Haiyan Zhou, Qi Sun, and Yinxi Shen for their help with the field work.
Conflicts of Interest
The authors declare no conflict of interest.
References
- Cloern, J.E.; Abreu, P.C.; Carstensen, J.; Chauvaud, L.; Elmgren, R.; Grall, J.; Greening, H.; Johansson, J.O.R.; Kahru, M.; Sherwood, E.T.; et al. Human activities and climate variability drive fast-paced change across the world’s estuarine-coastal ecosystems. Glob. Chang. Biol. 2016, 22, 513–529. [Google Scholar] [CrossRef] [PubMed]
- Huang, X.; Huang, C.; Teng, M.; Zhou, Z.; Wang, P. Net Primary Productivity of Pinus massoniana Dependence on Climate, Soil and Forest Characteristics. Forests 2020, 11, 404. [Google Scholar] [CrossRef]
- You, Y.; Huang, X.; Zhu, H.; Liu, S.; Liang, H.; Wen, Y.; Wang, H.; Cai, D.; Ye, D. Positive interactions between Pinus massoniana and Castanopsis hystrix species in the uneven-aged mixed plantations can produce more ecosystem carbon in subtropical China. For. Ecol. Manag. 2018, 410, 193–200. [Google Scholar] [CrossRef]
- Tian, M.F.; Zhang, B.G.; Wu, Z.G.; Yu, L.P.; Li, L.F.; Xi, X.D. Effects of Steam Heat-Treatment on Properties of Pinus massoniana Wood and Its Bonding Performance. J. Renew. Mater. 2021, 9, 789–801. [Google Scholar] [CrossRef]
- Zhang, S.; Gu, X.; Zhao, X.; Zhu, J.; Zhao, Y. Influences of Climatic Factors and Human Activities on Forest–Shrub–Grass Suitability in the Yellow River Basin, China. Forests 2023, 14, 1198. [Google Scholar] [CrossRef]
- Harayama, H.; Tsuyama, I.; Kitao, M.; Yamada, T.; Furuya, N.; Utsugi, H.; Sasaki, S. Effects of Seedling Size, Stock Type, and Mechanical Site Preparation Method on Initial Survival and Growth of Japanese Larch (Larix kaempferi) Seedlings. Forests 2023, 14, 784. [Google Scholar] [CrossRef]
- Grossnickle, S.C.; MacDonald, J.E. Seedling Quality: History, Application, and Plant Attributes. Forests 2018, 9, 283. [Google Scholar]
- Hou, J. Effect of seedling grade standard on improving the quality of licorice (Glycyrrhiza uralensis F.): Changes in the seven bioactive components and root biomass during two-year growth. Food Sci. Biotechnol. 2018, 27, 1245. [Google Scholar] [CrossRef]
- Cho, S.; Kim, T.; Jung, D.H.; Park, S.H.; Na, Y.; Ihn, Y.S.; Kim, K. Plant growth information measurement based on object detection and image fusion using a smart farm robot. Comput. Electron. Agric. 2023, 207, 107703. [Google Scholar] [CrossRef]
- Lati, R.N.; Filin, S.; Eizenberg, H. Estimation of Plants’ Growth Parameters via Image-Based Reconstruction of Their Three-Dimensional Shape. Agron. J. 2013, 105, 191–198. [Google Scholar] [CrossRef]
- Nasir, A.K.; Taj, M.; Khan, M.F. Evaluation of Microsoft Kinect Sensor for Plant Health Monitoring. In Proceedings of the 5th IFAC Conference on Sensing, Control and Automation Technologies for Agriculture (AGRICONTROL), Seattle, WA, USA, 14–17 August 2016; pp. 221–225. [Google Scholar]
- Qiu, R.C.; Wei, S.; Zhang, M.; Li, H.; Sun, H.; Liu, G.; Li, M.Z. Sensors for measuring plant phenotyping: A review. Int. J. Agric. Biol. Eng. 2018, 11, 1–17. [Google Scholar] [CrossRef]
- Gibbs, J.A.; Pound, M.; French, A.P.; Wells, D.M.; Murchie, E.; Pridmore, T. Approaches to three-dimensional reconstruction of plant shoot topology and geometry. J. Funct. Plant Biol. 2017, 44, 62–75. [Google Scholar] [CrossRef]
- Grift, T.E.; Oberti, R. Development of low-cost, root collar diameter measurement devices for pine seedlings. Comput. Electron. Agric. 2006, 52, 60–70. [Google Scholar] [CrossRef][Green Version]
- McGuinness, B.; Duke, M.; Au, C.K.; Lim, S.H. Measuring radiata pine seedling morphological features using a machine vision system. Comput. Electron. Agric. 2021, 189, 106355. [Google Scholar] [CrossRef]
- Suo, R.; Fu, L.S.; He, L.L.; Li, G.; Majeed, Y.; Liu, X.J.; Zhao, G.A.; Yang, R.Z.; Li, R. A novel labeling strategy to improve apple seedling segmentation using BlendMask for online grading. Comput. Electron. Agric. 2022, 201, 107333. [Google Scholar] [CrossRef]
- Hao, Z.B.; Lin, L.L.; Post, C.J.; Mikhailova, E.A.; Li, M.H.; Yu, K.Y.; Liu, J.; Chen, Y. Automated tree-crown and height detection in a young forest plantation using mask region-based convolutional neural network (Mask R-CNN). ISPRS J. Photogramm. Remote Sens. 2021, 178, 112–123. [Google Scholar] [CrossRef]
- Sun, X.M.; Fang, W.T.; Gao, C.Q.; Fu, L.S.; Majeed, Y.; Liu, X.J.; Gao, F.F.; Yang, R.Z.; Li, R. Remote estimation of grafted apple tree trunk diameter in modern orchard with RGB and point cloud based on SOLOv2. Comput. Electron. Agric. 2022, 199, 107209. [Google Scholar] [CrossRef]
- Zhang, H.C.; Ge, Y.F.; Xie, X.Y.; Atefi, A.; Wijewardane, N.K.; Thapa, S. High throughput analysis of leaf chlorophyll content in sorghum using RGB, hyperspectral, and fluorescence imaging and sensor fusion. Plant Methods 2022, 18, 60. [Google Scholar] [CrossRef]
- Li, X.; Pan, J.D.; Xie, F.P.; Zeng, J.P.; Li, Q.; Huang, X.J.; Liu, D.W.; Wang, X.S. Fast and accurate green pepper detection in complex backgrounds via an improved Yolov4-tiny model. Comput. Electron. Agric. 2021, 191, 106503. [Google Scholar] [CrossRef]
- Kolhar, S.; Jagtap, J. Convolutional neural network based encoder-decoder architectures for semantic segmentation of plants. Ecol. Inform. 2021, 64, 101373. [Google Scholar] [CrossRef]
- Tang, H.; Zhu, H.Y.; Fei, L.F.; Wang, T.W.; Cao, Y.C.; Xie, C. Low-Illumination Image Enhancement Based on Deep Learning Techniques: A Brief Review. Photonics 2023, 10, 198. [Google Scholar] [CrossRef]
- Jin, X.J.; Che, J.; Chen, Y. Weed Identification Using Deep Learning and Image Processing in Vegetable Plantation. IEEE Access 2021, 9, 10940–10950. [Google Scholar] [CrossRef]
- Li, Q.; Xue, Y. Real-time detection of street tree crowns using mobile laser scanning based on pointwise classification. Biosyst. Eng. 2023, 231, 20–35. [Google Scholar] [CrossRef]
- Zou, H.Y.; Sun, X.Y. 3D Face Recognition Based on an Attention Mechanism and Sparse Loss Function. Electronics 2021, 10, 2539. [Google Scholar] [CrossRef]
- Mirande, K.; Godin, C.; Tisserand, M.; Charlaix, J.; Besnard, F.; Hetroy-Wheeler, F. A graph-based approach for simultaneous semantic and instance segmentation of plant 3D point clouds. Front. Plant Sci. 2022, 13, 1012669. [Google Scholar] [CrossRef]
- Giang, T.T.H.; Ryoo, Y.J. Pruning Points Detection of Sweet Pepper Plants Using 3D Point Clouds and Semantic Segmentation Neural Network. Sensors 2023, 23, 4040. [Google Scholar] [CrossRef]
- Sun, G.X.; Wang, X.C. Three-Dimensional Point Cloud Reconstruction and Morphology Measurement Method for Greenhouse Plants Based on the Kinect Sensor Self-Calibration. Agronomy 2019, 9, 596. [Google Scholar] [CrossRef]
- Turgut, K.; Dutagaci, H.; Galopin, G.; Rousseau, D. Segmentation of structural parts of rosebush plants with 3D point-based deep learning methods. Plant Methods 2022, 18, 20. [Google Scholar] [CrossRef]
- Qi, C.R.; Yi, L.; Su, H.; Guibas, L.J. PointNet plus plus: Deep Hierarchical Feature Learning on Point Sets in a Metric Space. In Proceedings of the 31st Annual Conference on Neural Information Processing Systems (NIPS), Long Beach, CA, USA, 4–9 December 2017. [Google Scholar]
- Lhuillier, M.; Quan, L. Match propagation for image-based modeling and rendering. IEEE Trans. Pattern Anal. Mach. Intell. 2002, 24, 1140–1146. [Google Scholar] [CrossRef]
- Vogiatzis, G.; Hernandez, C. Video-based, real-time multi-view stereo. Image Vis. Comput. 2011, 29, 434–441. [Google Scholar] [CrossRef]
- Zhang, Z. A Flexible New Technique for Camera Calibration. IEEE Trans. Pattern Anal. Mach. Intell. 2000, 22, 1330–1334. [Google Scholar] [CrossRef]
- Zhao, F.Q. Point cloud denoising algorithm with geometric feature preserving. Multimed. Syst. 2022, 28, 1679–1687. [Google Scholar] [CrossRef]
- Qi, C.R.; Su, H.; Mo, K.C.; Guibas, L.J. PointNet: Deep Learning on Point Sets for 3D Classification and Segmentation. In Proceedings of the 30th IEEE/CVF Conference on Computer Vision and Pattern Recognition (CVPR), Honolulu, HI, USA, 21–26 July 2017; pp. 77–85. [Google Scholar]
- Li, Y.R.; Liu, Y.; Wang, L. Study on static index detection method of masson pine seedlings based on multi-information fusion. J. For. Eng. 2019, 4, 129–133. [Google Scholar] [CrossRef]


Disclaimer/Publisher’s Note: The statements, opinions and data contained in all publications are solely those of the individual author(s) and contributor(s) and not of MDPI and/or the editor(s). MDPI and/or the editor(s) disclaim responsibility for any injury to people or property resulting from any ideas, methods, instructions or products referred to in the content. |
© 2023 by the authors. Licensee MDPI, Basel, Switzerland. This article is an open access article distributed under the terms and conditions of the Creative Commons Attribution (CC BY) license (https://creativecommons.org/licenses/by/4.0/).