Article

Estimating Forest Aboveground Biomass Combining Pléiades Satellite Imagery and Field Inventory Data in the Peak–Cluster Karst Region of Southwestern China

1
College of Public Management, Guizhou University of Finance and Economics, Guiyang 550025, China
2
College of Big Data Application and Economics, Guizhou University of Finance and Economics, Guiyang 550025, China
3
School of Geography and Resources, Guizhou Education University, Guiyang 550018, China
4
School of Earth System Science, Tianjin University, Tianjin 300072, China
5
College of Life Sciences, Zhejiang Normal University, Jinhua 321004, China
6
State Key Laboratory of Environmental Geochemistry, Institute of Geochemistry, Chinese Academy of Sciences, Guiyang 550081, China
*
Author to whom correspondence should be addressed.
These authors contributed equally to this work.
Forests 2023, 14(9), 1760; https://doi.org/10.3390/f14091760
Submission received: 1 August 2023 / Revised: 29 August 2023 / Accepted: 29 August 2023 / Published: 30 August 2023
(This article belongs to the Topic Karst Environment and Global Change)

Abstract

:
The mountainous region of southwest China has the largest karst geomorphology in China and in the world. Quantifying the forest aboveground biomass in this karst region is of great significance for the investigation of carbon storage and carbon cycling in terrestrial ecosystems. In this study, the actual measured aboveground biomass was calculated based on the allometric functions of 106 quadrats from 2012 to 2015. A backpropagation artificial neural network (BPANN) inversion model was constructed by combining very high-resolution satellite imagery, field inventory data, and land use/land cover data to estimate the forest aboveground biomass in the Banzhai watershed, a typical peak–cluster karst basin in southern Guizhou Province. We used 70% of the actual measured aboveground biomass for training the BPANN model, 20% for accuracy verification, and 10% to prevent overtraining. The results show that the absolute root mean square error of the BPANN model was 11.80 t/ha, which accounted for 9.92% of the mean value of aboveground biomass. Based on the BPANN inversion model, the average value of the forests’ aboveground biomass was 135.63 t/ha. The results showed that our study presented a quick, easy, and relatively high-precision method for estimating forest aboveground biomass in the Banzhai watershed. This indicates that the Pléiades image-based BPANN model displayed satisfactory results for estimating the forests’ aboveground biomass in a typical peak–cluster karst basin. This method can be applied to the estimation of forest AGB in the karst mountainous areas of southwest China.

1. Introduction

Forests absorb most of the atmospheric carbon and have a considerable impact on the amount of carbon dioxide in the atmosphere and its year-to-year variation [1,2]. However, due to continued forest loss and climate change, it could soon also be a source of carbon [3,4]. The aboveground biomass (AGB) is the largest carbon pool and changes most rapidly after disturbance. The AGB is important for characterizing the Earth’s climate system and is therefore considered an important climate variable [5]. Quantifying forest AGB for the investigation of carbon storage and carbon cycling in terrestrial ecosystems is required for fighting climate change [6,7].
Traditional field measurements and remote sensing technology are two commonly used methods in forest AGB estimation [8,9]. Traditional methods cannot be applied to large areas because they are time-consuming and laborious [10,11,12]. By comparison, remote sensing technology can effectively estimate the forest AGB in a non-destructive way at multiple temporal and spatial scales [4,13]. Low- or middle-resolution remote sensing images are widely used among them [14,15,16]. Radar and SAR are used to predict forest AGB [17,18,19]. However, they are affected by terrain, surface moisture, and speckle noise and are difficult to map accurately in densely forested areas [4,20].
Lidar works well for estimating forest AGB because it can obtain more accurate forest height information [21,22]. Meanwhile, lidar data sets are only available in discontinuous footprints and sparsely along strips when using satellite sources of lidar [4]. In addition, the high cost also limits its application in large areas [13,23]. Numerous studies have demonstrated that hyperspectral imagery [24,25], multiangular remote sensing data [26,27], and very high-resolution satellite imagery (Pléiades, QuickBird, IKONOS, WorldView, GeoEye, etc.) combined with field inventory data have been successfully applied to estimate forest AGB, even for forest ecosystems with complex structures [28,29,30]. Currently, unmanned aerial systems (UAS) provide a tool for estimating forest AGB, which is an ideal complement to the existing ground- and satellite-based methods [31,32]. However, terrain models from UAS imagery of dense vegetation canopies, no matter which method, likely contain inaccuracies that bias structural metrics [31]. Therefore, scholars began combining multiple remote sensing data sources to provide more accurate forest AGB estimates [33,34,35] and encountered significant difficulty with spatial misalignment, which can cause problems for AGB estimation [4]. Scholars have conducted a comprehensive review of the existing literature in order to identify the most effective method for estimating AGB. The results show that there is no recognized best method for estimating forest AGB [4,8,27]. In addition, research shows that backpropagation artificial neural networks (BPANN) can estimate the forest AGB more accurately than the common methods of the multifactor parametric model and the single-factor parametric model [27,36,37].
The karst landscape of southwestern China is one of the most typical landscapes developed on carbonate bedrock in the world [38], especially in Guizhou Province, where large areas of karst landscapes are continuously and broadly distributed. Therefore, quantifying the spatial pattern of forest AGB, detecting changes occurring, and understanding their key drivers in the Karst Mountains is of great significance to improving the accuracy of forest AGB estimation and understanding the importance of karst ecosystems to the carbon cycle of terrestrial ecosystems [16,39]. However, most of the studies on forest AGB in the Karst Mountains have relied on limited methodologies. These include small area quadrats, a small number of forest quadrats [40,41], the National Forest Continuous Inventory (NFCI) data [42,43,44], and low- or middle-resolution satellite images [45,46], which were unable to estimate forest AGB precisely in karst regions [4]. Only a few studies focused on forest AGB based on high-resolution satellite images in the Karst Mountains area. Qian et al. [42] estimated the forest AGB by combining Sentinel-1A, Landsat 8 OLI, and NFCI data in Guizhou Province. They pointed out that although the problems of underestimation and overestimation have been partially solved, there were problems when the biomass was greater than 150 t/ha and less than 10 t/ha. Guo et al. [47] estimated the forest AGB in a typical plateau karst basin by combining Pléiades satellite imagery and field inventory data in Central Guizhou Province. According to that research, the BPANN inversion model exhibited satisfactory results for predicting forest AGB in typical plateau karst regions. However, previous studies have shown that the spatial distribution pattern of forest AGB in karst mountainous areas of Guizhou has strong variability, and the coefficient of variation reaches 163% [48].
Therefore, the accuracy of forest AGB predictions for carbon and environmental monitoring in the other karst landforms (e.g., peak–cluster karst landform, trough valley karst landform, canyon karst landform) should be enhanced. In this study, a BPANN model was constructed by combining very high-resolution satellite imagery and field inventory data for forest AGB mapping in the Banzhai watershed. This study aims to (1) analyze the spatial distribution pattern of forest AGB in typical peak–cluster karst regions and (2) explore a suitable model that can be used for estimating forest AGB in karst landscape areas of southwest China.

2. Materials and Methods

2.1. Study Area and Field Sampling

This study was conducted in the Maolan National Natural Reserve (25°09′–25°21′ N, 107°52′–108°05′ E) [49], located in Libo County, southern Guizhou Province, southwestern China (Figure 1a). The reserve is a typical peak–cluster karst depression landscape in a mountainous area covered by dolomite and limestone. It has an altitude ranging from 430 to 1082 m and is the largest and most well-preserved native karst forest ecosystem surviving in the world, where the exposed rocks can be found widely. The black limestone soils are shallow and discontinuous, but they are nutrient- and calcium-rich. However, soil moisture can easily leak through rock voids, causing specific droughts if there is not enough rainfall [50].
The annual average temperature is 15.3 °C. The average annual precipitation is 1750 mm, and rainfall is mainly concentrated from April to October. The average annual sunshine time is only 1272 h. The karst topography, with its humid and warm monsoon climate and specific edaphic and rocky microhabitats, makes the vegetation in this area different from other subtropical regions.
Evergreen trees mixed with a certain proportion of deciduous trees in the canopy and sub-canopy constitute a typical karst forest, which is a non-zonal soil climax widely distributed in the subtropical regions of southwest China. The dominant tree species of the forests include Platycarya strobilacea, Pistacia chinensis, Celtis tetrandra, Acer cinnamomifolium, Clausena dunniana, Cyclobalanopsis glauca, Pittosporum glabratum, and Symplocos adenophylla. Abundant biodiversity and rich, rare species (Paphiopedilum micranthum, Paphiopedilum barbigerum, Paphiopedilum emersonii, Taxus chinensis, Handeliodendron bodinieri, Manis pentadactyla, Syrmaticus ellioti, Ursus thibetanus, Panthera pardus, Moschus berezovskii, Macaca thibetana, etc.) can be found in this karst forest [51]. The Banzhai watershed is a typical basin in the peak–cluster karst landform area. While the study area was about 8443 hectares in this research, the average elevation is 827 m (Figure 1b). The physiognomy and vegetation structure of the Banzhai watershed are shown in Figure 1, encompassing parts c and d.

2.2. Processing of Pléiades Images

The Pléiades-1 satellite captures high-resolution remote sensing images. The Pléiades-1 satellite was successfully launched on 17 December 2011. Pléiades-1 has a panchromatic (pan) band (0.5 m resolution) and four multispectral bands (2 m resolution): near-infrared, blue, green, and red. We obtained the high-resolution Pléiades-1 satellite imagery on 28 May 2014 under clear weather conditions. The digital elevation model (DEM) data were derived from SPOT-5 images (10 m resolution).
The preprocessing of the Pléiades-1 satellite imagery includes image cropping, radiation calibration, geometric correction, atmospheric correction, and image fusion. All of the preprocessing was performed using ENVI 5.3 software. For details about image preprocessing, refer to previous studies [47,51].

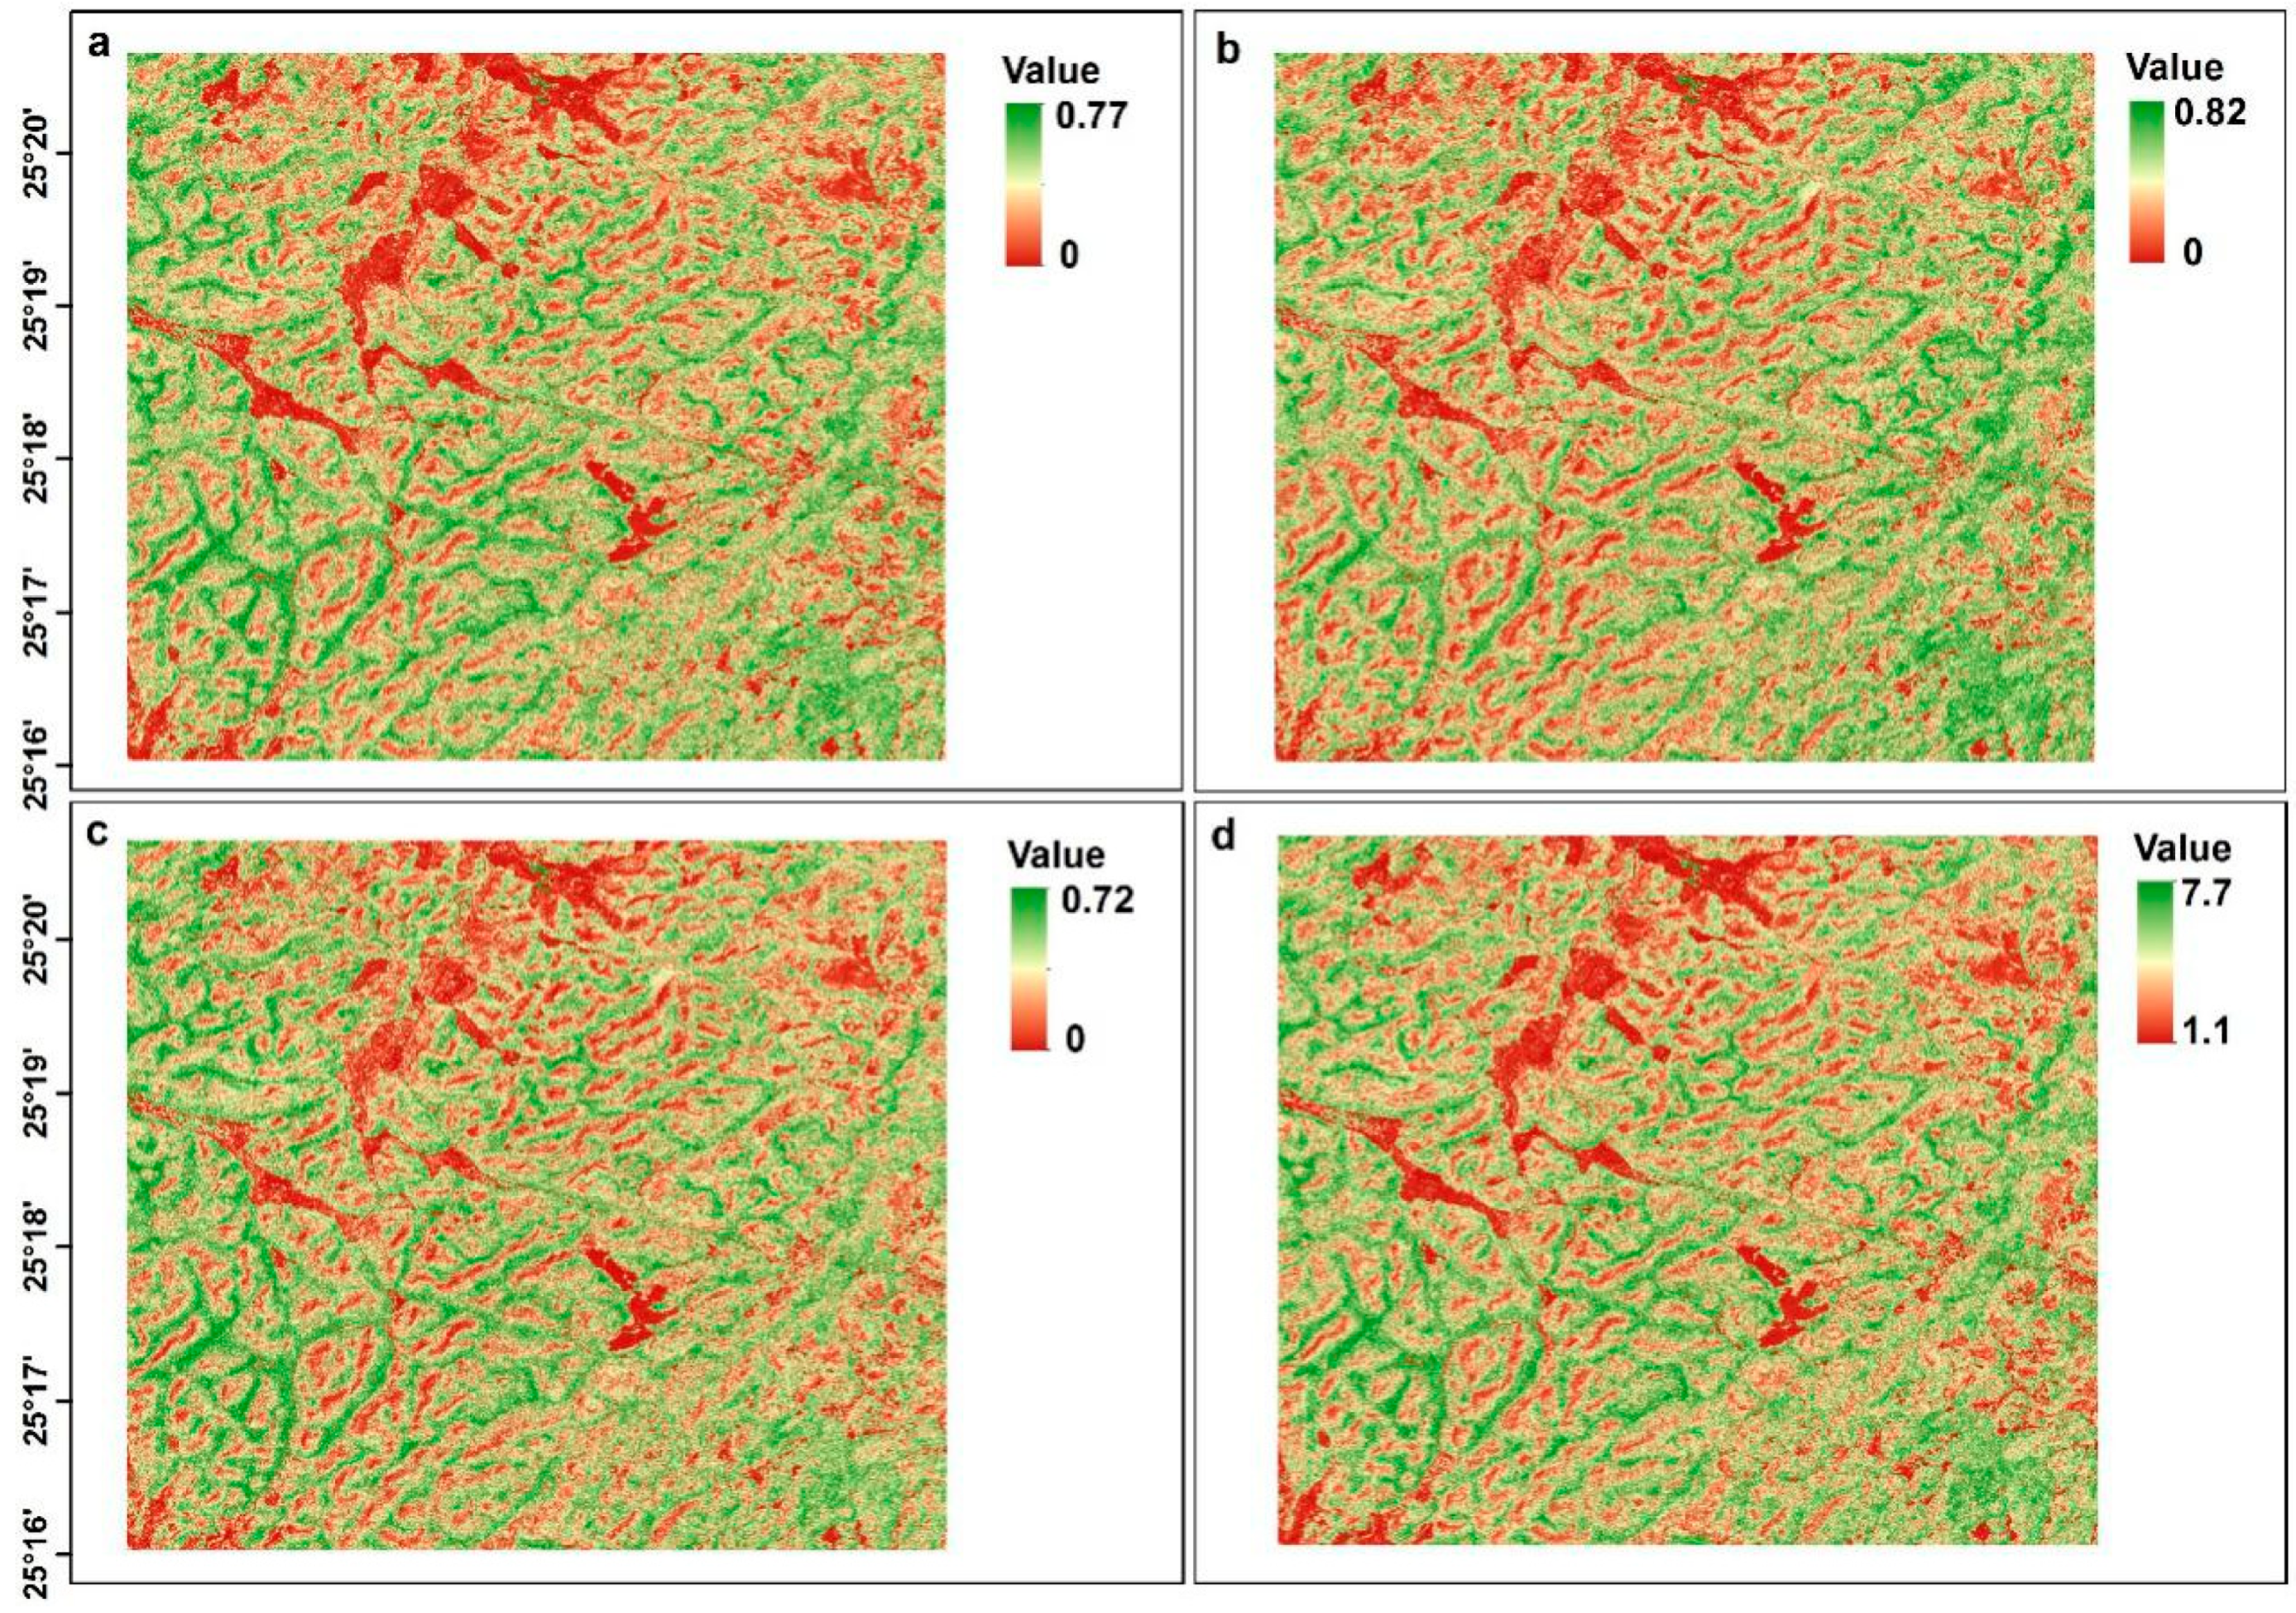
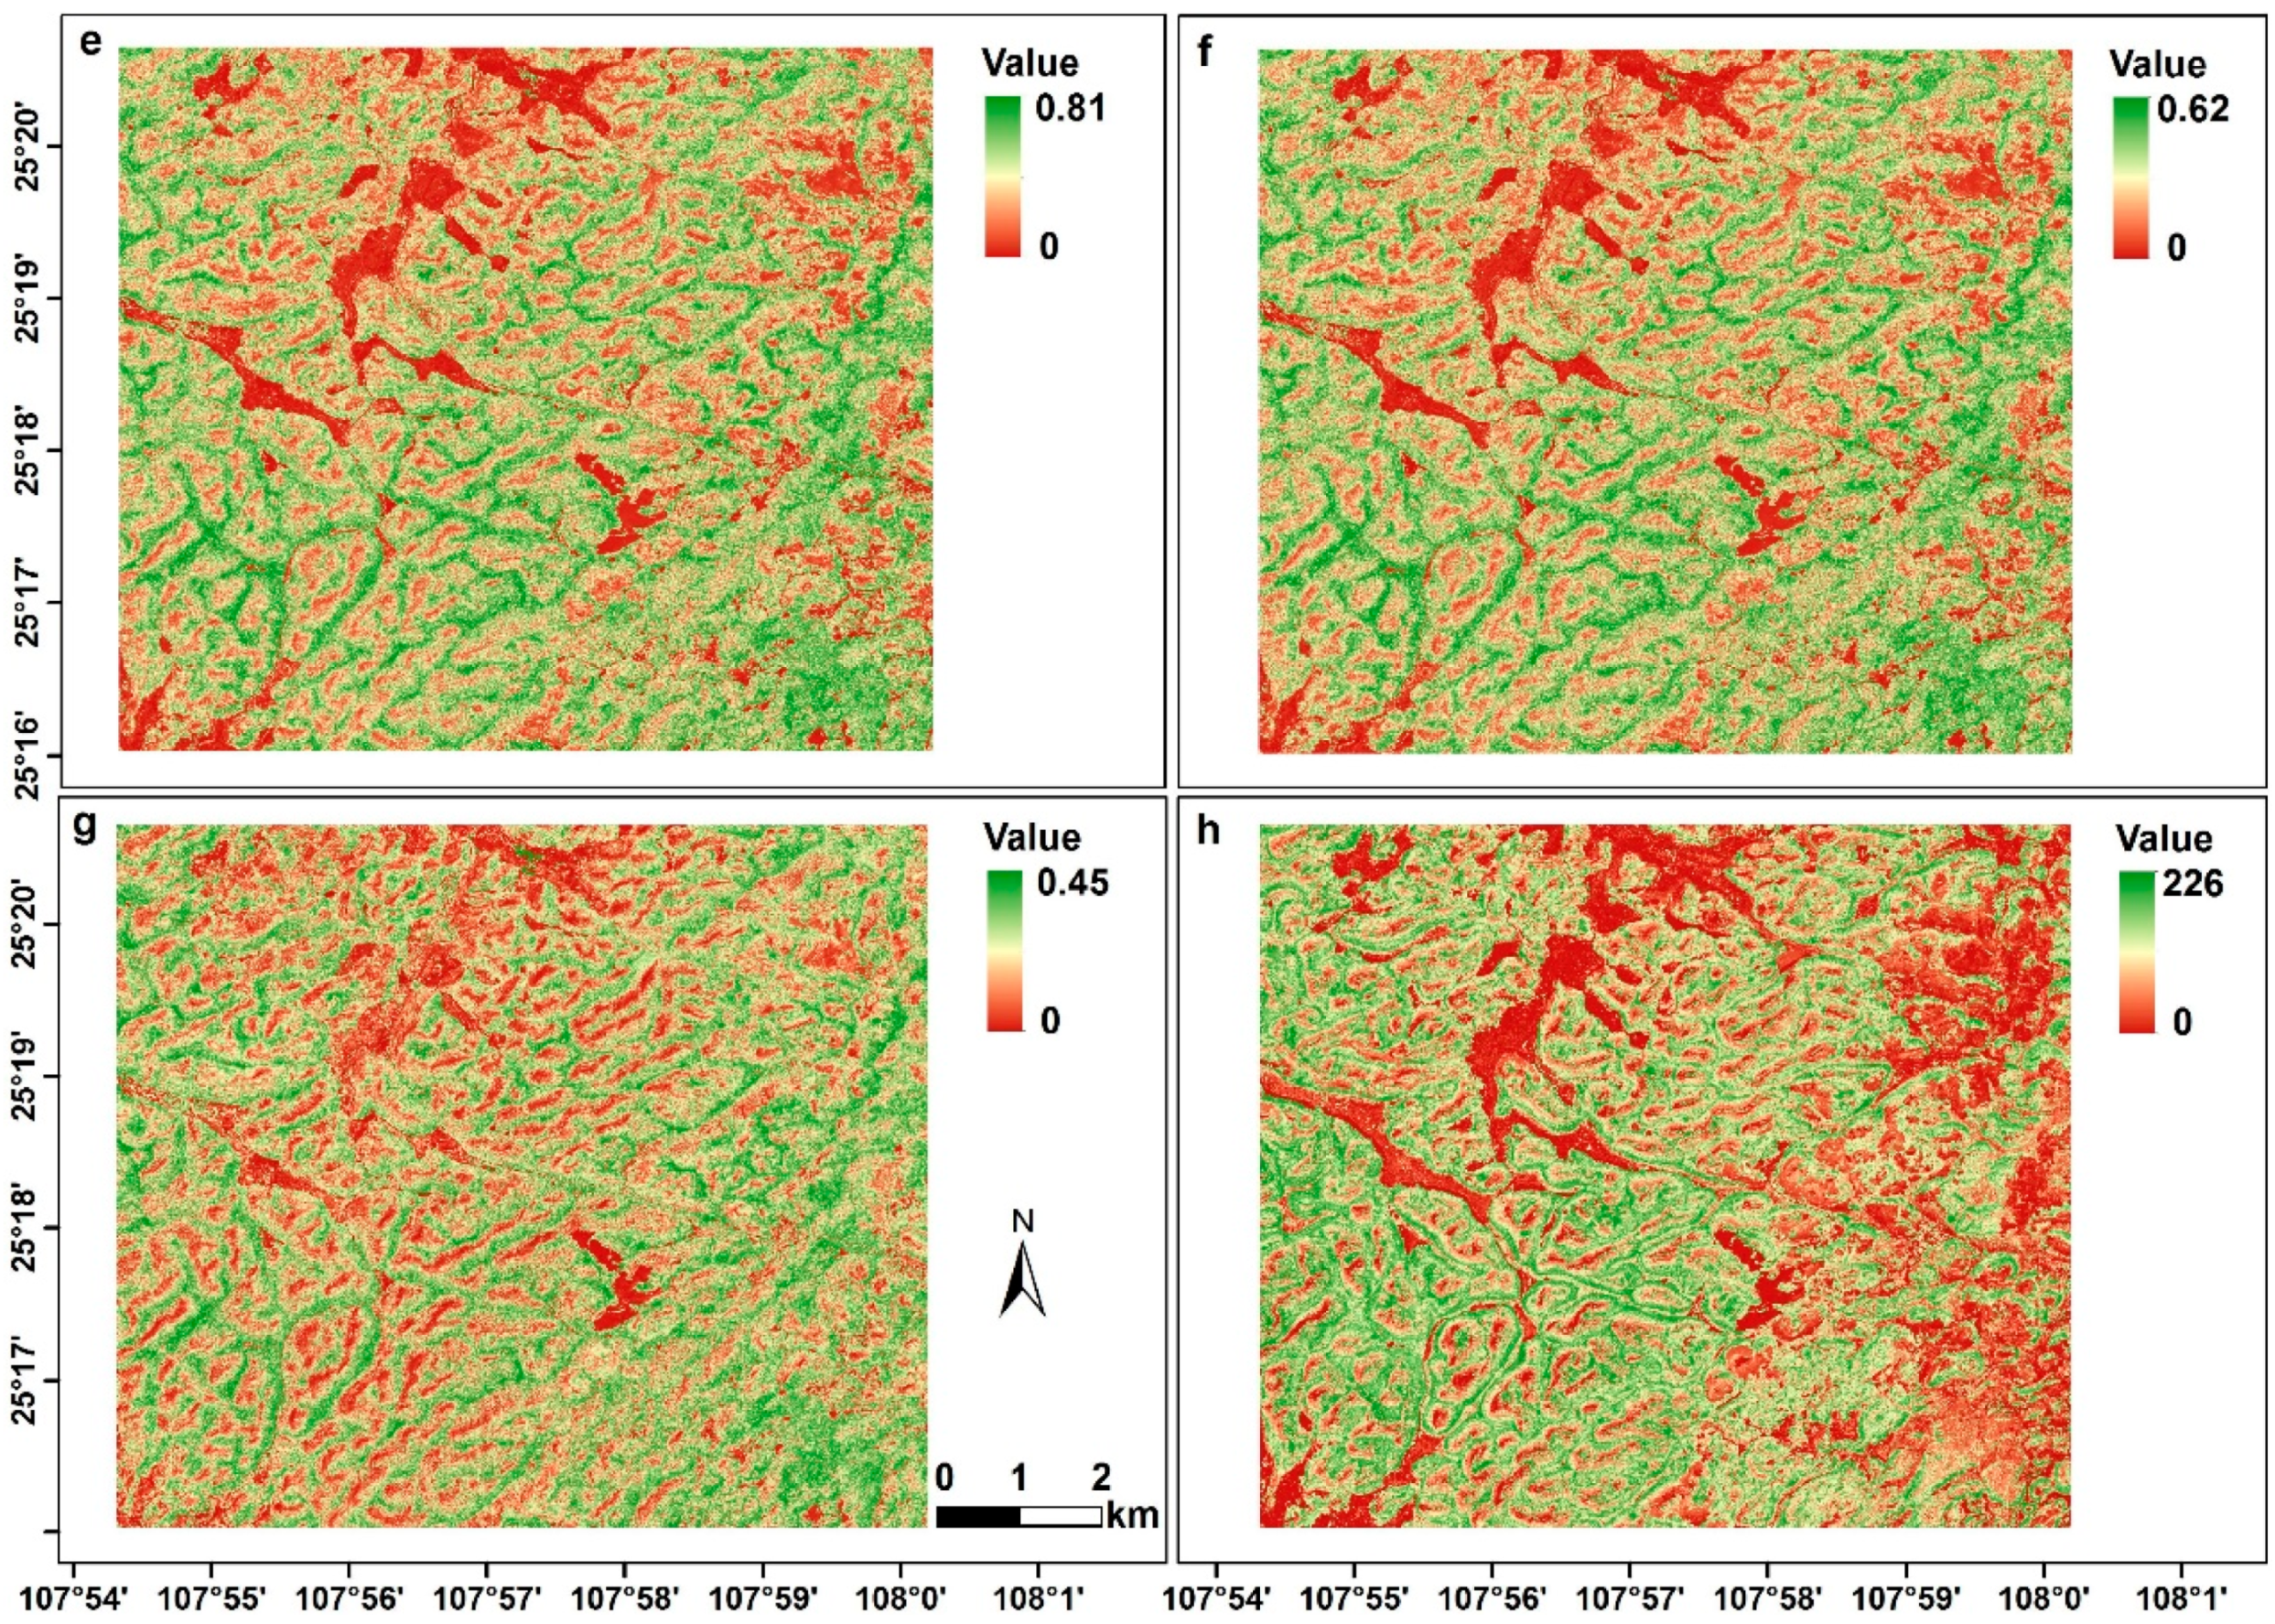
2.3. Vegetation Indices Derived from Pléiades-1 Images

The vegetation index (VI) has been widely used for estimating forest AGB [28]. Firstly, various VIs, such as ARVI (atmospherically resistant vegetation index), NDVI (normalized difference vegetation index), SAVI (soil-adjusted vegetation index), GNDVI (green normalized difference vegetation index), EVI (enhanced vegetation index), DVI (difference vegetation index), RVI (ratio vegetation index), etc., were derived from the Pléiades-1 imagery. The geomorphological variables (elevation, slope, aspect, etc.) were derived from the DEM using ENVI 5.3 software. Then, only the variables significantly associated with forest AGB were considered for further analysis. Finally, a total of 11 variables (NDVI, GNDVI, ARVI, SAVI, EVI, DVI, RVI, LULC, slope, red band, and blue band) were used as input variables to construct the BPANN inversion model in this research. The VI formulas were reported in the previous study [47].

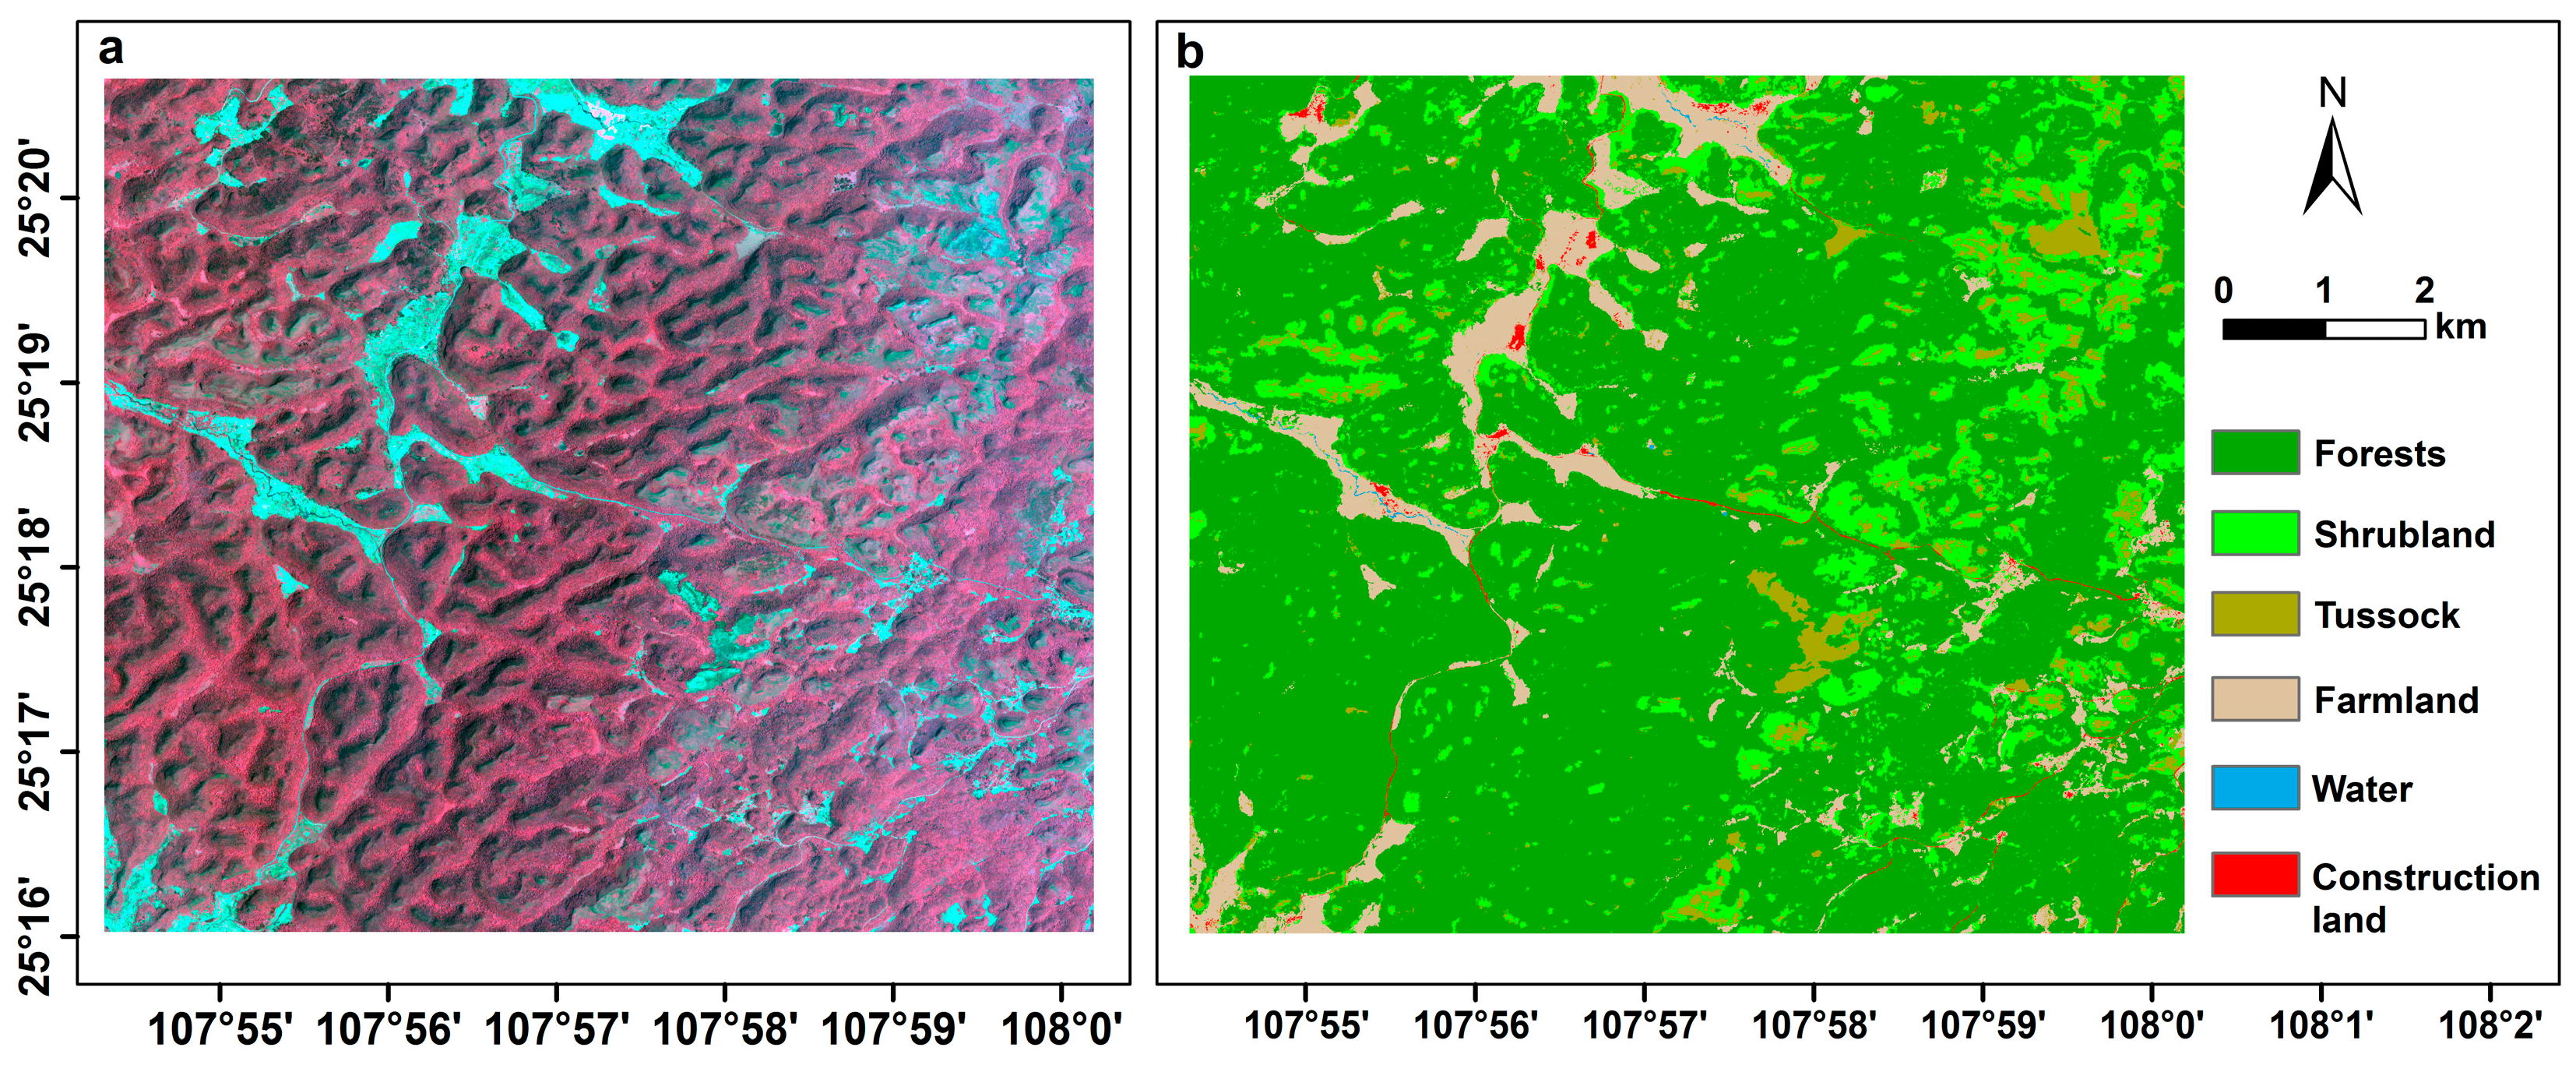
2.4. Interpretation of Pléiades-1

In this study, we mainly focused on the estimation of the forest’s AGB. The interpretation of Pléiades-1 satellite imagery was based on 352 field inventory data and GPS coordinates. Half of the samples (176) were used to construct the classification models, while the other half (176) were used to validate them using the confusion matrix. The pan-sharpening method was used to fuse the panchromatic and multispectral bands of the Pléiades-1 images. Then, the multi-resolution segmentation algorithm was used to generate image objects in the eCognition Developer 9.0 software package.
In our study, the average values of the VIs (NDVI, EVI, SAVI), geomorphological attributes (DEM, elevation, slope), spectral bands of Pléiades-1, and textural features (shape index, width, length/width, contrast, homogeneity, correlation, etc.) were selected as the input parameters. According to the input characteristics and measured samples, the classifier was trained and built using a random forest algorithm. Finally, six categories of land use/land cover (LULC) (Figure 2) were classified according to the classification system of GlobeLand30 [52], including forests, shrubland, tussock, farmland, construction land, and water.
The confusion matrix was used for evaluating the interpretation accuracy of LULC based on the field inventory data and GPS coordinates. The accuracy assessment showed that the total accuracy was 0.91 and the kappa value was 0.91. The result indicated that our interpretation and classification were acceptable.

2.5. Field Forest AGB Collection

A total of 106 field quadrats from 2012 to 2015 (Figure 1a) were collected in the Banzhai watershed [38,53,54]. There were 70 forest quadrats (20 m × 30 m or 30 m × 30 m), 20 shrubland quadrats (10 m × 10 m or 10 m × 20 m), and 16 tussock quadrats (10 m × 10 m).
The AGB of each plant in all of the field quadrats was calculated using allometric equations, which were developed using the standard tree method in this study region or surrounding areas [53,55]. In this study, the forest aboveground carbon storage was estimated using the average carbon concentration (48.05%) of wood and leaves in the karst landscape region of Guizhou [54].

2.6. BPANN Model Building

Studies have shown that artificial neural networks can deal with non-linear relationships effectively [56]. Among them, the BPANN has been widely used because a learning approach based on the least mean square error was used to overcome XOR (exclusive or) and other problems, including correlation among the input data [57]. In this study, the BPANN model was constructed based on eleven variables (NDVI, ARVI, GNDVI, EVI, SAVI, DVI, RVI, LULC, slope, red band, and blue band) as the input and the AGB as the output. A total of 70% of the AGB samples were used for training the BPANN model, 20% were applied to accuracy verification, and 10% were applied to prevent overtraining. The BPANN model training and validation were carried out using the MATLAB 2016a Neural Network Toolbox.
By comparing the root mean square error of the simulated and measured AGB, the main tuning parameters of the BPANN were continuously tuned to determine the optimal inversion model. The parameter settings have been introduced in detail [51]. Finally, the BPANN inversion model was used for estimating the overall AGB based on the 11 selected variables in the Banzhai watershed, and spatial mapping of the AGB in the Banzhai watershed was carried out.

3. Results

3.1. Performance of BPANN Model

The BPANN inversion model exhibited high simulation accuracy. The results showed that the average training R was 0.97, the average validation R was 0.89, the average test R was 0.92, and the average R in the whole dataset was 0.95 (Figure 3). The calculated root mean square error based on the measured and simulated AGB was 11.80 t/ha, which is only 9.92% of the average AGB. The correlation analyses of the actual measured AGB and simulated AGB are shown in Figure 4. All of the results indicate that the BPANN model designed in our study exhibited high precision and was suitable for predicting the forest AGB well in the Banzhai watershed.

3.2. VIs and Actual Measured AGB

The values of VIs, slope, red band, blue band, and the actual measured AGB are shown in Table 1. It is obvious that there was a positive correlation between VIs and the AGB, but there was a negative correlation between spectral bands (red and blue) and the AGB. The highest values of the seven VIs and actual measured AGB were focused on the forests, while the lowest values were mainly detected in the tussock.
The seven VI maps of the Banzhai watershed (Figure 5a–g) were derived from the Pléiades-1 image. As shown in Figure 2b and Figure 5a–g, the seven VIs maps followed the same trends: the majority of high values of the seven VIs were focused on the southeast and east, and most of the low values appeared in construction land. Meanwhile, a small number of intermediate values can be found almost throughout the study area. These spatial patterns were highly related to the distribution of LULC types in the study area.

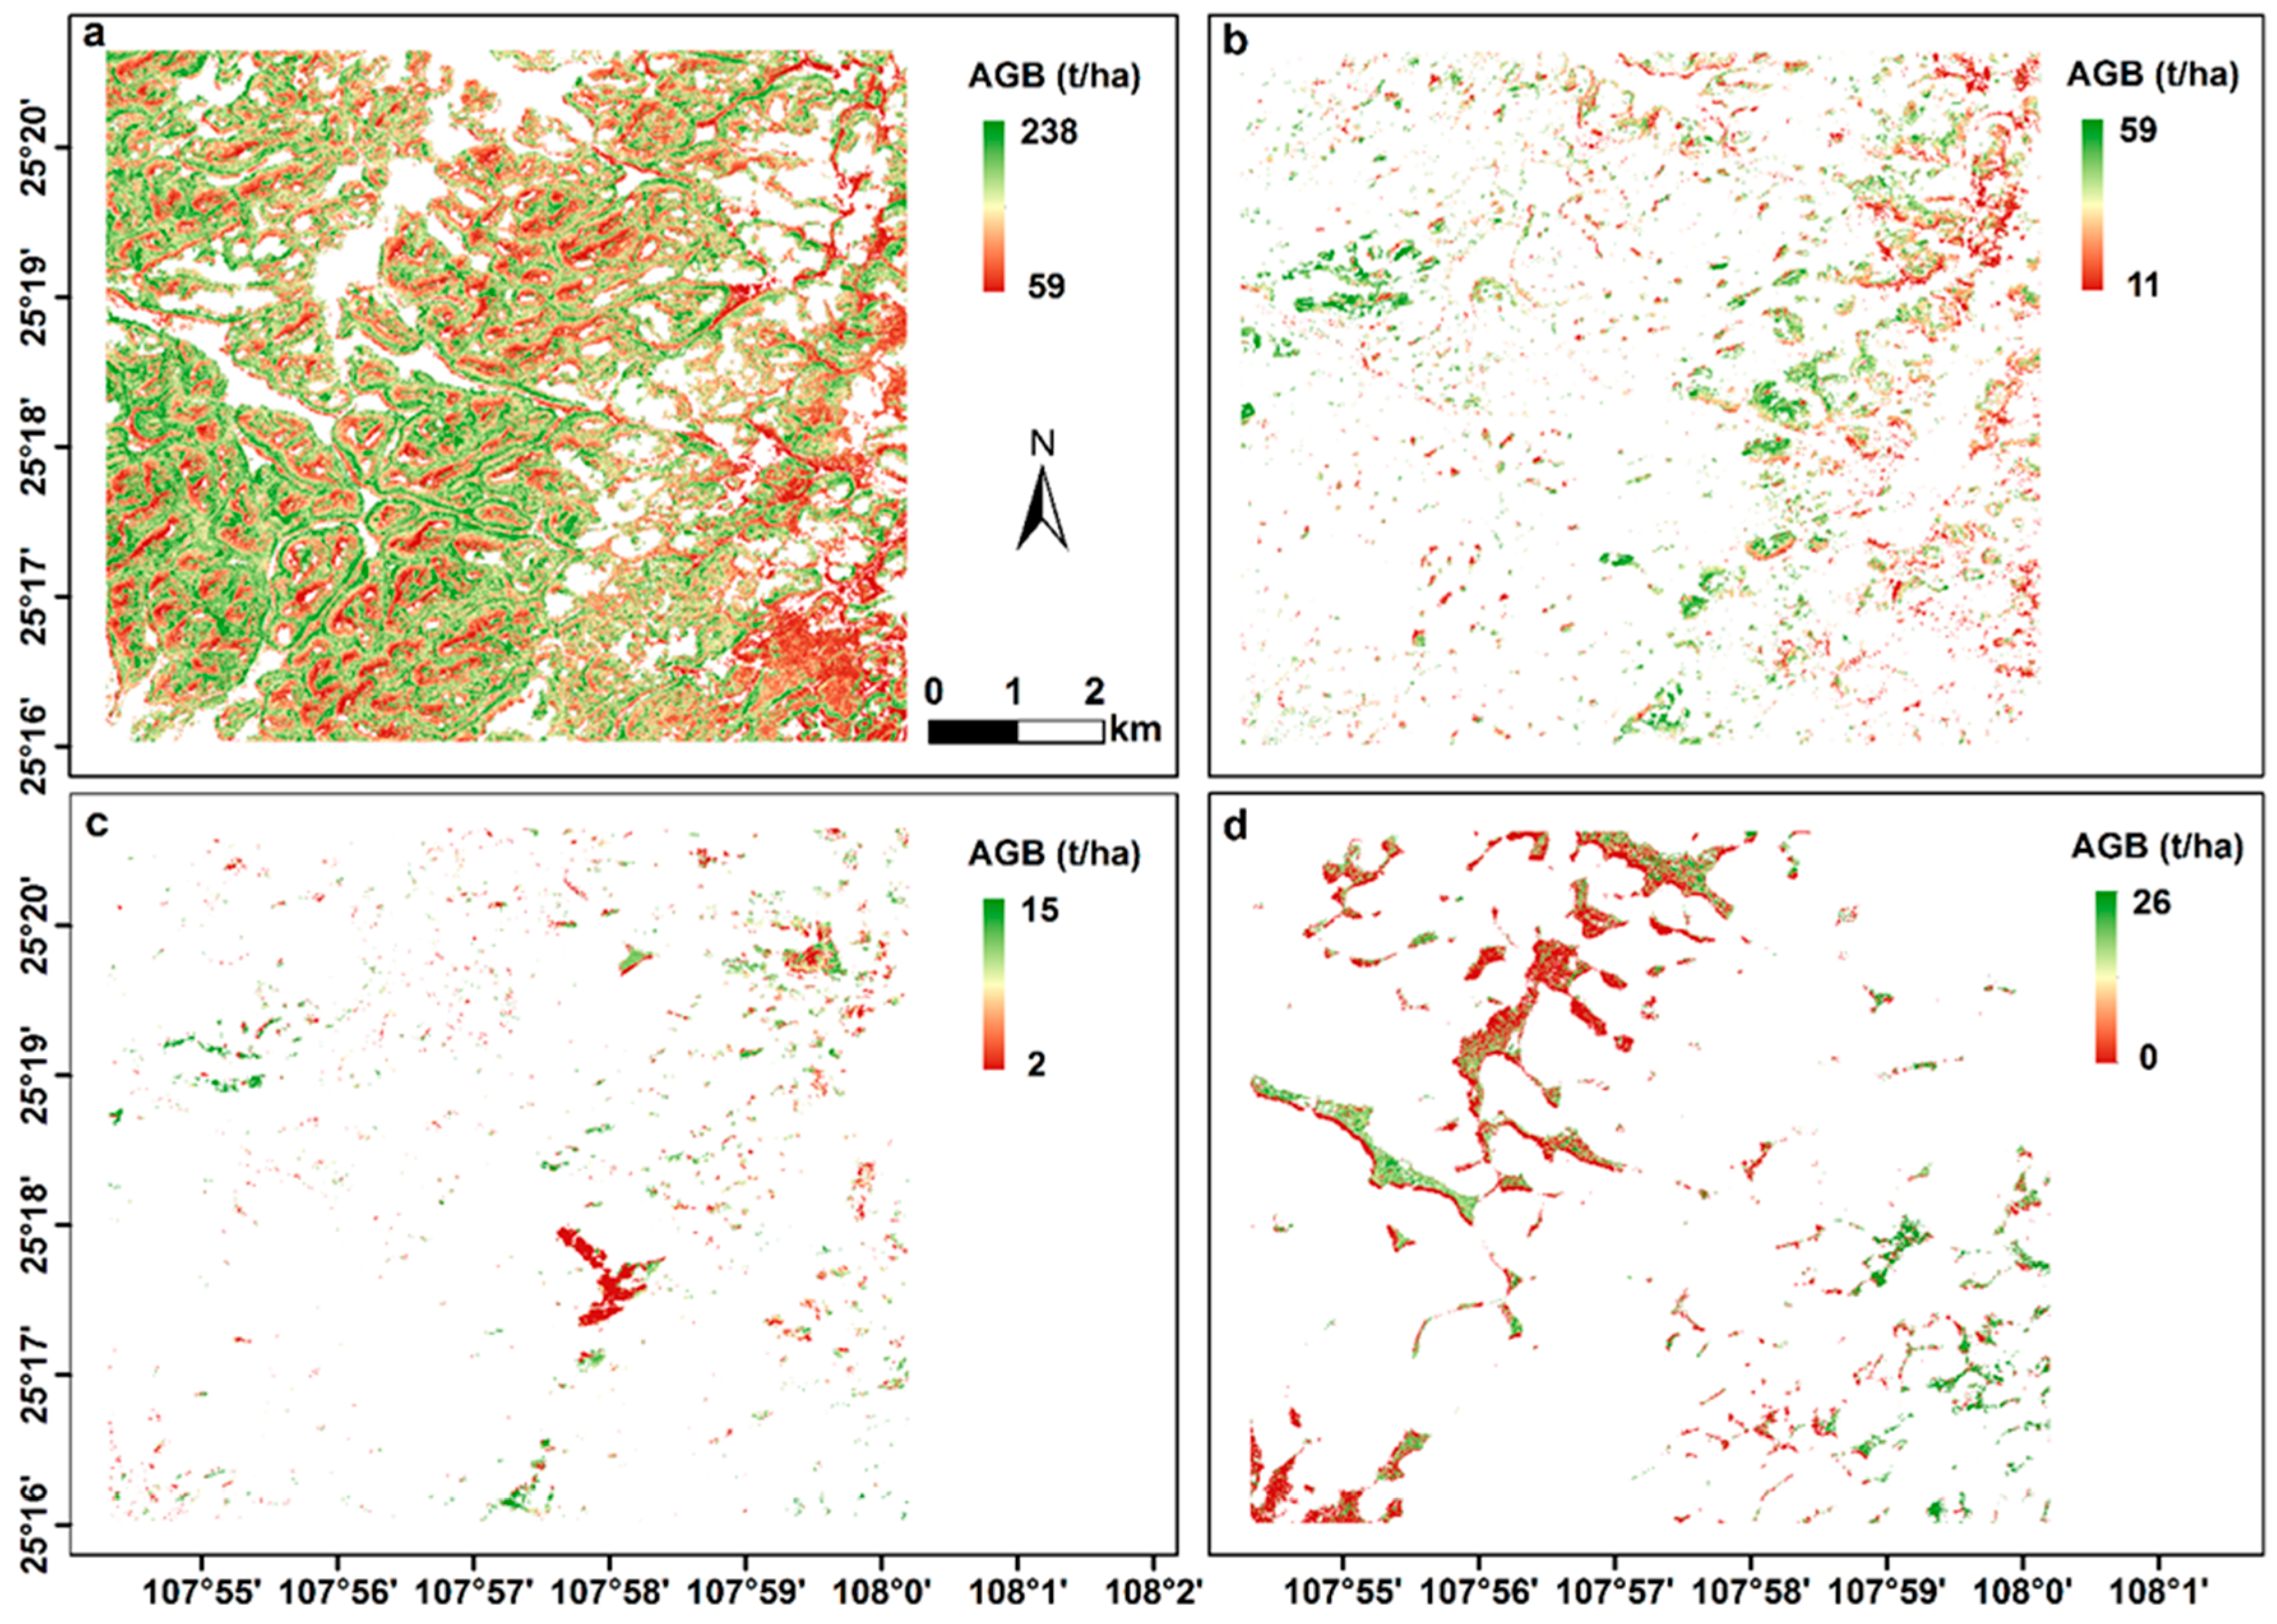
3.3. Spatial Pattern of Simulated AGB

The simulated AGB map of the Banzhai watershed was carried out based on the BPANN inversion model (Figure 5h). As shown in Figure 5h, the simulated AGB showed a similar spatial pattern to the vegetation index, especially at high altitudes (Figure 1b). The spatial distribution patterns of these simulated AGBs are also related to the LULC type (Figure 2).
The simulated AGB maps of different vegetation types are shown in Figure 6a–d. As shown in Figure 6, the simulated AGB exhibited the following spatial patterns: Most of the high values of the simulated AGB were mainly concentrated in forests (Figure 6a), and the medium values were mainly distributed in shrubland (Figure 6b). In contrast, the low values appeared in tussock (Figure 6c) and farmland (Figure 6d). As shown in Figure 1 and Figure 6, it is obvious that the patterns of the simulated AGB were almost consistent with the distributions of elevation in the Banzhai watershed.
The details of the simulated AGB and the area ratio of different vegetation types are shown in Table 2.

3.4. Spatial Pattern of AGB in Different Slopes

The simulated AGB maps of different slope gradients are shown in Figure 7a–f. As shown in Figure 7, high simulated AGB values were mainly exhibited at high slope angles (slope III, slope IV, slope V, and slope VI) on hilltops, with a simulated AGB average value of 213.05 ± 37.50 t/ha in the slope angle range from 16° to 35° (Figure 7c,d). The forests and shrubs in this study area were also mainly distributed here. Moreover, there were still some high AGB values (average 235.73 ± 33.02 tons/ha) on the steep slope at the mountain crest (above 36°) (Figure 7e,f), where the forests were also relatively well protected. Meanwhile, the low values (with an average of 99.27 ± 29.17 t/ha) mainly appeared in the low slope angle range from 0 to 15° (slope I and slope II) (Figure 7a,b), where construction land or farmland was widely distributed. It is obvious that elevation and slope were the decisive factors for the spatial distribution pattern of land use.
The total AGB was 0.921 Tg based on the BPANN model in the Banzhai watershed, with an area of 8443 ha. Among them, the forests’ AGB was 0.869 Tg, which accounted for 94.35% of the total AGB in the basin.

4. Discussion

The mountainous region of southwest China is the largest karst geomorphology in China and even in the world [38], especially in Guizhou Province, where the most typical and complex karst landforms are widely distributed. Therefore, quantitative research and analysis on the spatial pattern of its forest’s AGB and detecting changes occurring in the Karst Mountains of Guizhou are of great significance to understanding the importance of karst ecosystems to the carbon cycle of terrestrial ecosystems [15,30].
Many scholars have used various data and methods to estimate the forest AGB in Guizhou Province. Zheng et al. [58] constructed an AGB inversion model using the ETM+ (30 m resolution), field forest inventory data, and LULC in the southeast of Guizhou. According to that research, the range of the forest AGB was 40–200 t/ha. Zhang et al. [46] analyzed the carbon storage based on the ETM+ (30 m resolution) and Landsat TM in southwestern Guizhou. Additionally, the mean value of the forests’ AGB was 133.31 t/ha in 2009. This is higher than that calculated by Fan et al. [59] (87.62 ± 30.11 t/ha) based on the field measurements. Gao et al. [60] analyzed the carbon storage based on the Landsat ETM/TM imagery (30 m resolution) in Guizhou. The article states that the mean value of the forests’ AGB was 126.3 t/ha in 2010. However, the aforementioned research studies were based on low- or middle-resolution remote sensing imagery, which suggested it was unsuitable for estimating the AGB in complex forest areas due to its inability to solve the mixed pixel problem and its inability to successfully match on-site survey data [26,61,62].
Therefore, a BPANN model was constructed that combined very high-resolution satellite imagery, field inventory data, and LULC types for AGB mapping in the Banzhai watershed in this study. The mean value of the simulated forest AGB was 135.63 t/ha based on the BPANN inversion model. It was lower than the forest AGB (168.02 t/ha) calculated by Zhu et al. [55] using the field quadrat survey method in Maolan National Natural Reserve. Meanwhile, it is higher than the forest AGB (76.19 t/ha) predicted by Deng et al. [63] in Maolan National Natural Reserve. It is also higher than that calculated by Zhang et al. [48] (70.47 t/ha) in the adjacent Mulun National Natural Reserve in the Guangxi Provinces. These results can be attributed to the forest AGB in this study, which includes various forest types within the basin, while Zhu’s study was based on 30 sample trees with larger diameters at breast height in the climatic climax. Deng’s study was based on 18 small quadrats (each at 300 m2), and Zhang’s study was based on a 2 ha plot. Moreover, individual woody plants with a DBH < 1 were not tagged, and the different study areas and scales could also have caused differences.
The average value of the forest AGB in this study was higher than the value of the secondary forest AGB (88.70 t/ha) calculated on the basis of the field quadrats (20 m × 30 m) in the Houzhai River watershed [53]. It is also higher than the value of the secondary forest AGB (120.57 t/ha) simulated by Guo et al. [47] combining Pléiades satellite image and field inventory data in the Houzhai River watershed and also higher than that calculated by Liu et al. [41] (122.81 t/ha) using a direct harvest method in the Houzhai River watershed. Those variations were mainly due to the differences in the calculation of the on-site sample area. In this study, the horizontal projection method was used to calculate the field quadrat area. Meanwhile, Liu et al. [53] and Liu et al. [41] still used the small field quadrat area of the sloping hill. Moreover, Liu et al. [53] only estimated the AGB in the tree and shrub layers. Furthermore, our study region is located in Maolan National Natural Reserve, which is the largest and most well-preserved native karst forest ecosystem surviving in the world, while deforestation caused serious damage to the ecological environment in the Houzhai River watershed at the end of the 1950s [50]. All of the aforementioned reasons resulted in lower forest AGB estimates in the Houzhai River basin.
Meanwhile, it is noteworthy that the average value of forest AGB (135.63 t/ha) in this study was lower than that calculated by Liu et al. [40] (137.7 t/ha), based on field inventory quadrat data in the Houzhai River basin. It is mainly attributed to the sample plot being located on the mountaintop with less human disturbance, and the tree height, diameter at breast height, and forest coverage rate were higher than those in its surrounding areas. Therefore, the simulated AGB in this study was lower than that evaluated based on the 2 ha quadrat.
However, the mean value of the forest AGB in our study was higher than that obtained by Zhong et al. [64] (99.35 t/ha, northern Guizhou) and Fan et al. [59] (87.62 t/ha, southwestern Guizhou) using field measurements. This is mainly caused by differences in forest growth age. This was mainly caused by the difference in forest growth age. In this study, the trees were at their climatic climax, with a larger diameter at breast height, and the growth ages of the forest were more than 100 years. Meanwhile, the forests in the latter two study regions were only about 50 years old and had smaller diameters at the breast height of the trees.
Some other studies were conducted based on the NFCI data in Guizhou Province. The forest AGB in karst areas of Guizhou Province was estimated by Qian et al. [42] using Sentinel-1A, Landsat 8 OLI, and NFCI data. It was reported that the forest AGB was 54.95 t/ha in 2015. Qian et al. [65] analyzed the changes in forest AGB and its driving factors based on NFCI data (from 1984 to 2015) in Guizhou Province. According to that research, the forests’ AGB showed a trend of decreasing first and then increasing, which was 55.46 t/ha in 2015. Additionally, based on NFCI, DEM, and meteorological data from Guizhou Province in 2015, Zhang et al. [66] analyzed the spatial heterogeneity of forests’ AGB in Guizhou and discussed its influencing factors. It was reported that the nature forest AGB was 51.78 t/ha in 2015. It is worth noting that the average value of the forest AGB in our study was higher than that estimated by Qian et al. [42,65] and Zhang et al. [66]. Those variations should be attributed to differences in the land classification system in the NFCI data, which was only divided into two categories: forest land (including the shrub forest, bamboo forest, etc.) and non-forest land. The simulated forest AGB in our study was slightly higher than that estimated by Zhang et al. [67] (125.93 ± 70.99 t/ha) using 318 field measurements (62 sites were field survey data, 256 sites were NFCI data) in southwest China (Yunnan, Guangxi, and Guizhou). This variation was mainly due to the fact that there were all forest types in the tropical and subtropical regions in Zhang’s study.
In summary, the results of this study agree well with those of previous research. The BPANN model designed in our study presented a quick, easy, and relatively high-precision method of forest AGB estimation. This indicates that the BPANN inversion model displayed satisfactory results for simulating the forest AGB in this typical peak–cluster karst basin. This method can be applied to simulate the forest AGB in the karst mountainous areas of southwest China. However, combining very high-resolution satellite data with LiDAR data or UAS equipped with optical sensors will be an effective tool to simulate forest AGB [31]. Furthermore, greater collaboration in Computer Science, Statistics, Earth Science, and other fields can greatly improve the precision of forest AGB estimation.

5. Conclusions

Based on the newly constructed BPANN model in this study, the value of the total AGB was 0.921 Tg in the Banzhai watershed, with an area of 8443 ha. Among them, the value of the forest’s AGB was 0.869 Tg, which accounted for 94.35% of the total AGB in the basin, with an average value of 135.63 t/ha. The distribution range and spatial pattern of the forest AGB simulated by the BPANN inversion model agree well with the field observations. Overall, our study presented a quick, easy, and relatively high-precision method of forest AGB estimation. This indicates that the BPANN inversion model displayed satisfactory results for simulating forest AGB in the typical peak–cluster karst basin. This method can be applied to the estimation of forest AGB in the karst mountainous areas of southwest China.

Author Contributions

Conceptualization, Y.G. and J.N.; methodology, Y.G., Y.W. and L.L.; software, M.Z. and Y.G.; validation, M.Z., Y.X. and Y.G.; formal analysis, Y.G. and M.Z.; investigation, Y.G., Y.W. and L.L.; resources, Y.G. and J.N.; data curation, M.Z.; writing—original draft preparation, Y.G.; writing—review and editing, M.Z., Y.X. and J.N.; visualization, M.Z. and Y.G.; supervision, J.N.; project administration, Y.G. and J.N.; funding acquisition, Y.G. All authors have read and agreed to the published version of the manuscript.

Funding

This research was funded by the Scientific Research Startup Fund of Guizhou University of Finance and Economics (Approval No. 2018YJ59), by Guizhou Provincial Science and Technology Projects (QKHJC-ZK [2022] YB334), and by Guizhou Provincial Science and Technology Projects (QKHZC [2023] YB228).

Data Availability Statement

Not applicable.

Acknowledgments

We thank Changcheng Liu, Yuguo Liu, Ke Guo, and Gang Hu for providing quadrat data.

Conflicts of Interest

The authors declare no conflict of interest. The funders had no role in the design of the study; in the collection, analyses, or interpretation of data; in the writing of the manuscript; or in the decision to publish the results.

References

  1. Chazdon, R.L.; Broadbent, E.N.; Rozendaal, D.M.A.; Bongers, F.; Zambrano, A.M.A.; Aide, T.M.; Balvanera, P.; Becknell, J.M.; Boukili, V.; Brancalion, P.H.S.; et al. Carbon sequestration potential of second-growth forest regeneration in the Latin American tropics. Sci. Adv. 2016, 2, e1501639. [Google Scholar] [CrossRef]
  2. Friedlingstein, P.; Jones, M.W.; O’Sullivan, M.; Andrew, R.M.; Bakker, D.C.; Hauck, J.; Le Quéré, C.; Peters, G.P.; Peters, W.; Pongratz, J.; et al. Global carbon budget 2021. Earth Syst. Sci. Data 2022, 14, 1917–2005. [Google Scholar] [CrossRef]
  3. Mitchard, E.T. The tropical forest carbon cycle and climate change. Nature 2018, 559, 527–534. [Google Scholar] [CrossRef] [PubMed]
  4. Turton Amber, E.; Augustin Nicole, H.; Mitchard Edward, T.A. Improving Estimates and Change Detection of Forest Above-Ground Biomass Using Statistical Methods. Remote Sens. 2022, 14, 4911. [Google Scholar] [CrossRef]
  5. Herold, M.; Carter, S.; Avitabile, V.; Espejo, A.B.; Jonckheere, I.; Lucas, R.; McRoberts, R.E.; Næsset, E.; Nightingale, J.; Petersen, R.; et al. The role and need for space-based forest biomass-related measurements in environmental management and policy. Surv. Geophys. 2019, 40, 757–778. [Google Scholar] [CrossRef]
  6. Main-Knorn, M.; Cohen, W.B.; Kennedy, R.E.; Grodzki, W.; Pflugmacher, D.; Griffiths, P.; Hostert, P. Monitoring coniferous forest biomass change using a Landsat trajectory-based approach. Remote Sens. Environ. 2013, 139, 277–290. [Google Scholar] [CrossRef]
  7. Zhang, X.; Zhang, F.; Qi, Y.; Deng, L.; Wang, X.; Yang, S. New research methods for vegetation information extraction based on visible light remote sensing images from an unmanned aerial vehicle (UAV). Int. J. Appl. Earth Obs. Geoinf. 2019, 78, 215–226. [Google Scholar] [CrossRef]
  8. Fassnacht, F.E.; Hartig, F.; Latifi, H.; Berger, C.; Hernández, J.; Corvalán, P.; Koch, B. Importance of sample size, data type and prediction method for remote sensing-based estimations of aboveground forest biomass. Remote Sens. Environ. 2014, 154, 102–114. [Google Scholar] [CrossRef]
  9. Quan, X.W.; He, B.B.; Yebra, M.; Yin, C.M.; Liao, Z.M.; Zhang, X.T.; Li, X. A radiative transfer model-based method for the estimation of grassland aboveground biomass. Int. J. Appl. Earth Obs. 2017, 54, 159–168. [Google Scholar] [CrossRef]
  10. Chave, J.; Réjou-Méchain, M.; Búrquez, A.; Chidumayo, E.; Colgan, M.S.; Delitti, W.B.; Duque, A.; Eid, T.; Fearnside, P.M.; Goodman, R.C.; et al. Improved allometric models to estimate the aboveground biomass of tropical trees. Glob. Chang. Biol. 2014, 20, 3177–3190. [Google Scholar] [CrossRef]
  11. Liu, Q.; Yang, L.; Liu, Q.H.; Li, J. Review on remote sensing retrieval methods of forest aboveground biomass. J. Remote Sens. 2015, 19, 62–74. [Google Scholar]
  12. Crosby, M.K.; Matney, T.G.; Schultz, E.B.; Evans, D.L.; Grebner, D.L.; Londo, H.A.; Rodgers, J.C.; Collins, C.A. Consequences of Landsat Image Strata Classification Errors on Bias and Variance of Inventory Estimates: A Forest Inventory Case Study. IEEE J-Stars. 2016, 10, 243–251. [Google Scholar] [CrossRef]
  13. Shu, G.N.; Kanninen, M.; Atyi, R.E.; Sonwa, D.J. Assessment and prediction of above-ground biomass in selectively logged forest concessions using field measurements and remote sensing data: Case study in South East Cameroon. Forest Ecol. Manag. 2014, 329, 177–185. [Google Scholar]
  14. Tian, X.; Su, Z.B.; Chen, E.X.; Li, Z.Y.; Tol, C.V.; Guo, J.P.; Qisheng He, Q.S. Estimation of forest above-ground biomass using multi-parameter remote sensing data over a cold and arid area. Int. J. Appl. Earth Obs. 2012, 14, 160–168. [Google Scholar]
  15. Zolkos, S.G.; Goetz, S.J.; Dubayah, R.A. Meta-analysis of terrestrial aboveground biomass estimation using lidar remote sensing. Remote Sens. Environ. 2013, 128, 289–298. [Google Scholar] [CrossRef]
  16. Baccini, A.; Walker, W.; Carvalho, L.; Farina, M.; Sulla-Menashe, D.; Houghton, R.A. Tropical forests are a net carbon source based on aboveground measurements of gain and loss. Science 2017, 358, 230–234. [Google Scholar] [CrossRef]
  17. Benson, M.L.; Pierce, L.; Bergen, K.; Sarabandi, K. Model-Based Estimation of Forest Canopy Height and Biomass in the Canadian Boreal Forest Using Radar, LiDAR, and Optical Remote Sensing. IEEE Trans. Geosci. Remote Sens. 2010, 59, 4635–4653. [Google Scholar] [CrossRef]
  18. Solberg, S.; Hansen, E.H.; Gobakken, T.; Næssset, E.; Zahabu, E. Biomass and InSAR height relationship in a dense tropical forest. Remote Sens. Environ. 2017, 192, 166–175. [Google Scholar] [CrossRef]
  19. Shen, W.; Li, M.; Huang, C.; Tao, X.; Li, S.; Wei, A.S. Mapping annual forest change due to afforestation in Guangdong Province of China using active and passive remote sensing data. Remote Sens. 2019, 11, 490. [Google Scholar] [CrossRef]
  20. Stéphane, M.; Thuy, L.T. Forest disturbances and regrowth assessment using ALOS PALSAR data from 2007 to 2010 in Vietnam, Cambodia and Lao PDR. Remote Sens. 2016, 8, 217. [Google Scholar]
  21. Tsui, O.W.; Coops, N.C.; Wulder, M.A.; Marshall, P.L. Integrating airborne LiDAR and space-borne radar via multivariate kriging to estimate above-ground biomass. Remote Sens. Environ. 2013, 139, 340–352. [Google Scholar] [CrossRef]
  22. Cao, L.; Coops, N.C.; Innes, J.L.; Sheppard, S.R.J.; Fu, L.Y.; Ruan, H.H.; She, G.H. Estimation of forest biomass dynamics in subtropical forests using multi-temporal airborne LiDAR data. Remote Sens. Environ. 2016, 178, 158–171. [Google Scholar] [CrossRef]
  23. Su, H.Y.; Shen, W.J.; Wang, J.R.; Ali, A.; Li, M.S. Machine learning and geostatistical approaches for estimating aboveground biomass in Chinese subtropical forests. For. Ecosyst. 2020, 7, 64–84. [Google Scholar] [CrossRef]
  24. Laurin, G.V.; Chen, Q.; Lindsell, J.A.; Coomes, D.A.; Frate, F.D.; Guerriero, L.; Pirotti, F.; Valentini, R. Above ground biomass estimation in an African tropical forest with lidar and hyperspectral data. ISPRS J. Photogramm. 2014, 89, 49–58. [Google Scholar] [CrossRef]
  25. Almeida, D.R.; Broadbent, E.N.; Ferreira, M.P.; Meli, P.; Brancalion, P.H.S. Monitoring restored tropical forest diversity and structure through UAV-borne hyperspectral and lidar fusion. Remote Sens. Environ. 2021, 264, 112582. [Google Scholar] [CrossRef]
  26. Chopping, M.; Moisen, G.G.; Su, L.; Laliberte, A.; Rango, A.; Martonchik, J.V.; Peters, D.P.C. Large area mapping of southwestern forest crown cover, canopy height, and biomass using the NASA Multiangle Imaging Spectro-Radiometer. Remote Sens. Environ. 2009, 112, 2051–2063. [Google Scholar] [CrossRef]
  27. Lyu, X.; Li, X.; Gong, J.; Li, S.; Dou, H.; Dang, D.; Xuan, X.; Wang, H. Remote-sensing inversion method for aboveground biomass of typical steppe in Inner Mongolia, China. Ecol. Indic. 2021, 120, 106883. [Google Scholar] [CrossRef]
  28. Deng, S.Q.; Katoh, M.; Guan, Q.W.; Yin, N.; Li, M.Y. Estimating forest aboveground biomass by combining ALOS PALSAR and WorldView-2 data: A case study at Purple Mountain National Park, Nanjing, China. Remote Sens. 2014, 6, 7878–7910. [Google Scholar] [CrossRef]
  29. Pham, L.T.; Brabyn, L. Monitoring mangrove biomass change in Vietnam using SPOT images and an object-based approach combined with machine learning algorithms. ISPRS J. Photogramm. Remote Sens. 2017, 128, 86–97. [Google Scholar] [CrossRef]
  30. Xiao, J.; Chevallier, F.; Gomez, C.; Guanter, L.; Hicke, J.A.; Huete, A.R.; Ichii, K.; Ni, W.; Pang, Y.; Rahman, A.F.; et al. Remote sensing of the terrestrial carbon cycle: A review of advances over 50 years. Remote Sens. Environ. 2019, 233, 111383. [Google Scholar] [CrossRef]
  31. Poley, L.G.; Mcdermid, G.J. A Systematic Review of the Factors Influencing the Estimation of Vegetation Aboveground Biomass Using Unmanned Aerial Systems. Remote Sens. 2020, 12, 1052. [Google Scholar] [CrossRef]
  32. Zhu, Y.H.; Liu, K.; Myint, S.W.; Du, Z.; Wu, Z. Integration of GF2 Optical, GF3 SAR, and UAV Data for Estimating Aboveground Biomass of China’s Largest Artificially Planted Mangroves. Remote Sens. 2020, 12, 2039. [Google Scholar] [CrossRef]
  33. Minh, D.H.T.; Ndikumana, E.; Vieilledent, G.; McKey, D.; Baghdadi, N. Potential value of combining ALOS PALSAR and Landsat-derived tree cover data for forest biomass retrieval in Madagascar. Remote Sens. Environ. 2018, 213, 206–214. [Google Scholar] [CrossRef]
  34. Persson, H.J.; Jonzén, J.; Nilsson, M. Combining TanDEM-X and Sentinel-2 for large-area species-wise prediction of forest biomass and volume. Int. J. Appl. Earth Obs. Geoinf. 2021, 96, 102275. [Google Scholar] [CrossRef]
  35. Santoro, M.; Cartus, O.; Carvalhais, N.; Rozendaal, D.; Avitabile, V.; Araza, A.; De Bruin, S.; Herold, M.; Quegan, S.; RodríguezVeiga, P.; et al. The global forest above-ground biomass pool for 2010 estimated from high-resolution satellite observations. Earth Syst. Sci. Data 2021, 13, 3927–3950. [Google Scholar] [CrossRef]
  36. Pradhan, B.; Saro, L. Landslide susceptibility assessment and factor effect analysis: Backpropagation artificial neural networks and their comparison with frequency ratio and bivariate logistic regression modelling. Environ. Modell. Softw. 2010, 25, 747–759. [Google Scholar] [CrossRef]
  37. Vahedi, A.A. Artificial neural network application in comparison with modeling allometric equations for predicting above-ground biomass in the Hyrcanian mixed-beech forests of Iran. Biomass Bioenerg. 2016, 88, 66–76. [Google Scholar] [CrossRef]
  38. Liu, C.C.; Liu, Y.G.; Guo, K.; Wang, S.J.; Liu, H.M.; Zhao, H.W.; Qiao, X.G.; Hou, D.J.; Li, S.B. Aboveground carbon stock, allocation and sequestration potential during vegetation recovery in the karst region of southwestern China: A case study at a watershed scale. Agr. Ecosyst. Environ. 2016, 235, 91–100. [Google Scholar] [CrossRef]
  39. Toan, T.L.; Quegan, S.; Davidson, M.J.; Balzter, H.; Paillou, P.; Papathanassiou, K.; Plummer, S.; Rocca, F.; Saatchi, S.; Shugart, H.; et al. The BIOMASS mission: Mapping global forest biomass to better understand the terrestrial carbon cycle. Remote Sens. Environ. 2011, 115, 2850–2860. [Google Scholar] [CrossRef]
  40. Liu, L.B.; Wu, Y.Y.; Hu, G.; Zhang, Z.H.; Cheng, A.Y.; Wang, S.J.; Ni, J. Biomass of karst evergreen and deciduous broad-leaved mixed forest in central Guizhou province, southwestern China: A comprehensive inventory of a 2 ha plot. Silva Fenn. 2016, 50, 1492. [Google Scholar] [CrossRef]
  41. Liu, L.B.; Zhou, Y.C.; Cheng, A.Y.; Wang, S.J.; Cai, X.L.; Ni, J. Aboveground biomass estimate of a karst forest in central Guizhou Province, southwestern China based on direct harvest method. Acta Ecol. Sin. 2020, 40, 4455–4461. (In Chinese) [Google Scholar]
  42. Qian, C.H.; Qiang, H.Q.; Wang, F.; Li, M.Y. Estimation of Forest Aboveground Biomass in Karst Areas Using Multi-Source Remote Sensing Data and the K-DBN Algorithm. Remote Sens. 2021, 13, 5030. [Google Scholar] [CrossRef]
  43. Tian, X.L.; Xia, J.; Xia, H.B.; Ni, J. Forest biomass and its spatial pattern in Guizhou province. Chin. J. Appl. Ecol. 2011, 22, 287–294. (In Chinese) [Google Scholar]
  44. Du, M.F.; Li, M.J.; Zhao, W.J. Temporal and Spatial Variation of Forest Carbon Storage in Guizhou from 1995 to 2015. J. Zhejiang Forestry Sci. Tech. 2022, 42, 41–47. (In Chinese) [Google Scholar]
  45. Caldwell, I.M.; Maclaren, V.W.; Chen, J.M.; Ju, W.M.; Zhou, S.; Yin, Y.; Boland, A. An integrated assessment model of carbon sequestration benefits: A case study of Liping county, China. J. Environ. Manag. 2007, 85, 757–773. [Google Scholar] [CrossRef]
  46. Zhang, S.Y.; Bai, X.Y.; Wang, S.J.; Qin, L.Y.; Li, P.L.; Luo, G.J.; Li, Y. Spatial distribution patterns and the evolution process of carbon storage in a typical karst canyon area. J. Resour. Ecol. 2015, 6, 199–207. (In Chinese) [Google Scholar]
  47. Guo, Y.M.; Ni, J.; Liu, L.B.; Wu, Y.Y.; Guo, C.Z.; Xu, X.; Zhong, Q.L. Estimating aboveground biomass using Pléiades satellite image in a karst watershed of Guizhou Province, Southwestern China. J. Mt. Sci. Engl. 2018, 15, 103–117. [Google Scholar] [CrossRef]
  48. Zhang, L.J.; Du, H.; Yang, Z.Q.; Song, T.Q.; Zeng, F.P.; Peng, W.X.; Huang, G.Q. Topography and Soil Properties Determine Biomass and Productivity Indirectly via Community Structural and Species Diversity in Karst Forest, Southwest China. Sustainability 2022, 14, 7644. [Google Scholar] [CrossRef]
  49. Zhang, Z.H.; Hu, G.; Zhu, J.D.; Ni, J. Stand structure, woody species richness and composition of subtropical karst forests in Maolan, south-west China. J. Trop. For. Sci. 2012, 24, 498–506. [Google Scholar]
  50. Ni, J.; Luo, D.H.; Xia, J.; Zhang, Z.H.; Hu, G. Vegetation in karst terrain of southwestern China allocates more biomass to roots. Solid Earth 2015, 6, 799–810. [Google Scholar] [CrossRef]
  51. Zhu, Y.H.; Liu, K.; Liu, L.; Wang, S.G.; Liu, H.X. Retrieval of mangrove aboveground biomass at the individual species level with WorldView-2 Images. Remote Sens. 2015, 7, 12192–12214. [Google Scholar] [CrossRef]
  52. Arsanjani, J.J.; Tayyebi, A.; Vaz, E. GlobeLand30 as an alternative fine-scale global land cover map: Challenges, possibilities, and implications for developing countries. Habitat Int. 2016, 55, 25–31. [Google Scholar] [CrossRef]
  53. Liu, C.C.; Wei, Y.F.; Liu, Y.G.; Guo, K. Biomass of canopy and shrub layers of karst forests in Puding, Guizhou, China. Chin. J. Plant Ecol. 2009, 33, 698–705. (In Chinese) [Google Scholar]
  54. Liu, Y.G.; Liu, C.C.; Wang, S.J.; Guo, K.; Yang, J.; Zhang, X.S.; Li, G.Q. Organic carbon storage in four ecosystem types in the karst region of southwestern China. PLoS ONE 2013, 8, e56443. [Google Scholar] [CrossRef]
  55. Zhu, S.Q.; Wei, L.M.; Chen, Z.R.; Zhang, C.G. A preliminary study on biomass components of karst forest in Maolan of Guizhou Province, China. Acta Hytoecol. Sin. 1995, 19, 358–367. (In Chinese) [Google Scholar]
  56. Kumar, R.; Aggarwal, R.K.; Sharma, J.D. Comparison of regression and artificial neural network models for estimation of global solar radiations. Renew. Sustain. Energy Rev. 2015, 52, 1294–1299. [Google Scholar] [CrossRef]
  57. Dong, L.X.; Tang, S.H.; Min, M.; Veroustraete, F.; Cheng, J. Aboveground forest biomass based on OLSR and an ANN model integrating LiDAR and optical data in a mountainous region of China. Int. J. Remote Sens. 2019, 40, 6059–6083. [Google Scholar] [CrossRef]
  58. Zheng, G.; Chen, J.M.; Tian, Q.J.; Ju, W.M.; Xia, X.Q. Combining remote sensing imagery and forest age inventory for biomass mapping. J. Environ. Manag. 2007, 85, 616–623. [Google Scholar] [CrossRef]
  59. Fan, W.J.; Rong, L.; Zhang, Z.Q. Carbon distribution of main vegetation types of Mengzhai watershed in south China karst canyon area. J. Mt. Sci.-Engl. 2015, 33, 457–464. [Google Scholar]
  60. Gao, H.J.; Han, H.Q.; Zhang, C.Q.; Wang, H.Z. Eeffects of land use change on carbon storage in Wujiang river of Guizhou province from 2000 to 2010. J. Sichuan Agric. Univ. 2016, 34, 48–53. (In Chinese) [Google Scholar]
  61. Pflugmacher, D.; Cohen, W.B.; Kennedy, R.E.; Yang, Z.Q. Using Landsat-derived disturbance and recovery history and lidar to map forest biomass dynamics. Remote Sens. Environ. 2013, 151, 124–137. [Google Scholar] [CrossRef]
  62. Barrachina, M.; Cristóbal, J.; Tulla, A.F. Estimating above-ground biomass on mountain meadows and pastures through remote sensing. Int. J. Appl. Earth Obs. 2015, 38, 184–192. [Google Scholar] [CrossRef]
  63. Deng, W.; Che, J.; Mao, Y.J.; Xiao, Z.; Jing, Y.; Tang, X.X. Pattern and driving factors influencing the aboveground biomass of different forest layers of Maolan karst forest. J. Forest Environ. 2023, 43, 169–176. (In Chinese) [Google Scholar]
  64. Zhong, Y.X.; Zhou, Y.C.; Li, Z.J. Research on the Carbon Storage and Potential Carbon Sequestration of Vegetation in the Trough Valley of a Karst Area, Yinjiang. Earth Environ. 2014, 42, 82–89. (In Chinese) [Google Scholar]
  65. Qian, C.; Qiang, H.; Zhang, G.; Li, M. Long-term changes of forest biomass and its driving factors in karst area, Guizhou, China. Int. J. Distrib. Sens. Netw. 2021, 17, 127–134. [Google Scholar] [CrossRef]
  66. Zhang, T.; Ding, G.J.; Zhang, J.P.; Qi, Y.J. Contributions of Biotic and Abiotic Factors to the Spatial Heterogeneity of Aboveground Biomass in Subtropical Forests: A Case Study of Guizhou Province. Sustainability 2022, 14, 10771. [Google Scholar] [CrossRef]
  67. Zhang, H.; Song, T.Q.; Wang, K.L.; Yang, H.; Yue, Y.M.; Zeng, Z.X.; Peng, W.X.; Zeng, F.P. Influences of stand characteristics and environmental factors on forest biomass and root–shoot allocation in southwest China. Ecol. Eng. 2016, 91, 7–15. [Google Scholar] [CrossRef]
Figure 1. (a) Location and field quadrat sites; (b) elevation; (c) physiognomy; and (d) vegetation structure of the Banzhai watershed.
Forests 14 01760 g001
Figure 2. (a) Pléiades satellite image and (b) LULC map of Banzhai watershed.
Forests 14 01760 g002
Figure 3. Accuracy test of BPANN Model. (a) Training R; (b) validation R; (c) test R; and (d) all R.
Forests 14 01760 g003
Figure 4. Correlation analysis of actual measured AGB and simulated AGB.
Forests 14 01760 g004
Figure 5. VIs maps and a simulated AGB map in the Banzhai watershed. (a) NDVI; (b) EVI; (c) GNDVI; (d) RVI; (e) ARVI; (f) SAVI; (g) DVI; and (h) AGB (t/ha).
Forests 14 01760 g005aForests 14 01760 g005b
Figure 6. Simulated AGB maps of different vegetation types in the Banzhai watershed: (a) forests, (b) shrubland, (c) tussock, and (d) farmland.
Forests 14 01760 g006
Figure 7. Simulated AGB maps of different slope gradients in the Banzhai watershed. (a) Slope I, (b) slope II, (c) slope III, (d) slope IV, (e) slope V, and (f) slope VI.
Forests 14 01760 g007
Table 1. Input variables and the actual measured AGB (mean ± standard error) of the field quadrats.
VariableForestsShrublandTussock
ARVI0.65 ± 0.050.56 ± 0.100.53 ± 0.10
DVI0.23 ± 0.050.19 ± 0.030.18 ± 0.03
EVI0.50 ± 0.100.41 ± 0.070.39 ± 0.07
GNDVI0.56 ± 0.050.51 ± 0.040.49 ± 0.05
NDVI0.63 ± 0.050.56 ± 0.070.53 ± 0.07
RVI4.50 ± 0.703.63 ± 0.623.47 ± 0.65
SAVI0.40 ± 0.060.33 ± 0.050.32 ± 0.06
Slope angle33.35 ± 10.8936.54 ± 13.7224.37 ± 16.44
Red band649.66 ± 111.57725.01 ± 125.36797.92 ± 131.27
Blue band716.19 ± 33.22727.35 ± 45.39765.22 ± 49.56
Average AGB (t/ha)139.63 ± 49.6938.29 ± 12.8518.71 ± 6.72
AGB range (t/ha)60.92–261.1521.98–58.264.93–27.00
Note: ARVI (atmospherically resistant vegetation index); DVI (difference vegetation index); EVI (enhanced vegetation index); GNDVI (green normalized difference vegetation index); NDVI (normalized difference vegetation index); RVI (ratio vegetation index); SAVI (soil-adjusted vegetation index). The red band and blue band represent the reflectance values of the red band and blue band of Pléiades imagery, respectively. AGB (aboveground biomass).
Table 2. Simulated AGB of different vegetation types in the Banzhai watershed.
Vegetation TypesForestsShrublandTussockFarmland
Average AGB (t/ha)135.6339.8010.9311.08
AGB range (t/ha)59.00–238.0011.00–57.002.00–15.000.00–30.00
Total AGB (t)86,8746.7041,500.853471.887051.47
Area (ha)6405.211042.73317.74636.46
Area ratio (%)75.8612.353.767.54
Disclaimer/Publisher’s Note: The statements, opinions and data contained in all publications are solely those of the individual author(s) and contributor(s) and not of MDPI and/or the editor(s). MDPI and/or the editor(s) disclaim responsibility for any injury to people or property resulting from any ideas, methods, instructions or products referred to in the content.

