Article

Does Soundscape Perception Affect Health Benefits, as Mediated by Restorative Perception?

1
College of Landscape Architecture and Art, Fujian Agriculture and Forestry University, Fuzhou 350002, China
2
Engineering Research Center for Forest Park of National Forestry and Grassland Administration, Fuzhou 350002, China
3
School of Design, Fujian University of Technology, Fuzhou 350002, China
*
Author to whom correspondence should be addressed.
Forests 2023, 14(9), 1798; https://doi.org/10.3390/f14091798
Submission received: 24 July 2023 / Revised: 15 August 2023 / Accepted: 31 August 2023 / Published: 3 September 2023
(This article belongs to the Special Issue Forest, Trees, Human Health and Wellbeing)

Abstract

:
The purpose of this study was to investigate the connection between the soundscape of a forest park, restorative perception, and health benefits. In order to assess sound source perception, soundscape perception, restorative perception, and health benefits, 10 forest park environments in Fuzhou National Forest Park were chosen for sound walks. Correlation analysis, structural equation modeling, and mediating effects were used to analyze the relationships between the variables. The results showed that (1) the majority of natural sounds, like birdsong, had a positive correlation with soundscape perception with respect to being perceived as pleasant, harmonious, varied, and fluctuating; however, human-related and traffic noises had a negative correlation with perceptions of being pleasant and harmonious, and a positive correlation with perceptions of roughness. (2) The sound of running water and wind-blown leaves had strong favorable connections with emotional, cognitive, and behavioral restorative perceptions. The sound of birdsong was strongly correlated with restorative perceptions regarding emotional dimensions. The sound of wind held substantial favorable associations with emotional and cognitive restorative perceptions. Natural sounds, except for the sound of cicada chirping, had positive correlations with health benefits. The associations between human-related and mechanical sounds and restorative perception and health benefits were not statistically significant. (3) Soundscape pleasantness had a significant positive effect on restorative perceptions, and restorative perceptions had a significant positive effect on health benefits. The effect of soundscape pleasantness on health benefits was fully communicated through restorative perceptions. The annoyingness of a soundscape had no effect on restorative perception or health benefits. In the future, forest recreation activities based on soundscape perception could be carried out through the considered use of natural soundscape resources to promote health benefits.

1. Introduction

With the rapid development of urbanization, the pace of life is increasing, and suboptimal health status has become apparent in many people, posing a new threat to them. Suboptimal health status (SHS) is “the third state” between health and disease, and facilitates the development of chronic diseases. SHS individuals lack vitality and usually appear weak, despite not having a diagnosable illness [1]. Being chronically in a suboptimal health status can lead to the development of diseases. According to the World Health Organization, noncommunicable diseases (NCDs) such as cardiovascular diseases, cancer, diabetes and chronic respiratory diseases are the leading global cause of death and are responsible for 74% of deaths worldwide [2]. There is growing scientific evidence that “forest therapy” may be a new means of reducing stress and unwinding the body and mind because of its ability to facilitate wellness. By causing physiological relaxation and immune system recovery, it is able to achieve the effects of preventative medicine [3,4,5,6]. “Forest therapy” is taken from the Japanese art of “Shinrin-yoku”, which translates to “Forest Bathing”. According to the Japanese Forest Therapy Society, “Forest Therapy” is a research-based healing practice based on immersion in forests with the aim of promoting mental and physical health and disease prevention while at the same time, facilitating enjoyment and appreciation of forests [7]. Several studies have reported considerable therapeutic benefits from forest therapy. Compared to urban environments, forest environments promote recovery, create a more positive mood, give feelings of comfort, calmness and relaxation, increase parasympathetic nerve activity, inhibit sympathetic nerve activity, and reduce salivary cortisol [8]. In addition, forest therapy can increase natural killer (NK) cells activity [3]. The stress-reducing effects of forest therapy on different groups of people such as college students [9] and office workers [10] have been confirmed. For example, Rajoo et al. demonstrated that a half-day forest therapy program on 21 college students is able to decrease the students’ blood pressure, and the reductions were maintained for 5 days [9]. In 2016, the Chinese government published the plan, “Healthy China 2030”, which has raised public health to a national strategic height, thus promoting the development of forest tourism, forest therapy, and other industries.
The restorative benefits of time spent in nature have been explained by two key theories. The Attention Restorative Theory (ART) is concerned with how nature improves cognitive function, particularly attention. According to this theory, the natural environment serves as the primary stress reliever while also somewhat enhancing unconscious attention [11]. The Stress Reduction Theory (SRT) is concerned with how nature affects people’s emotional, physical, and social health. It is thought that stress can lead to unpleasant feelings and a decline in people’s cognitive and behavioral capacities. However, if the environment contains specific positive components, people will be able to effectively unwind, relieve, and transform negative emotions into positive ones, as well as restore cognitive and behavioral function, as evidenced by changes in their heart rate, blood pressure, skin conductance levels, and brain waves, among other things. These changes are often accompanied by sustained attention recovery [12,13]. ART focuses on the impact of the environment on the psychological resources of human cognition, but it cannot explain physiological and behavioral responses. SRT emphasizes the subjective and objective outcomes of recovery, primarily from physiological objective indicators, psychological subjective assessment, and behavioral improvement in three dimensions [14]. The two theories are frequently combined in current research to examine how the environment affects both physiological and psychological cognition. But research on the two theories is still surface-level and lacks the breadth and depth of studies on other multisensory perceptions and the ensuing physiological and psychological changes. As Ulrich points out, many sounds and smells in natural settings surely also influence our feelings [12], and there is growing research on how sound and smell are perceived [15,16]. More individuals are becoming aware of how crucial forest soundscapes are for understanding the surrounding environment, which is crucial for enhancing residents health and well-being [17,18].
Soundscapes exist through human perception of the acoustic environment [19]. According to current research on the benefits of sound environment restoration, natural sounds are more pleasant and can elicit positive feelings [20]. According to the research of Kariel et al., mountaineers prefer the pleasant sounds of wind, water, and animals, while anthropogenic sounds are annoying [21]. Wang et al.’s study used an aesthetic preference questionnaire to combine eight videos of urban green spaces with five natural sounds (birdsongs of single and multiple species, wind sounds, a frog croak, and running water sounds). It was revealed that the sounds of birds, wind, and water increased pleasure, while the sound of frogs caused annoyingness [22]. Moreover, sound perception can be used to improve human experience from a health standpoint [23]. Studies have confirmed that quiet and pleasant sounds can promote mental health, while annoying sounds can hinder it [24]. In recent years, three studies have employed the Short-version Revised Restoration Scale (SRRS) to assess the quality of audiovisual restoration. Zhao et al. [25] recruited college students to evaluate 20 urban park photographs with five sound combinations and found that adding birdsong to landscapes with natural water and high vegetation cover yielded higher restorative potential; the sound of running water introduced into the landscape was a better option; and adding wind sounds to landscapes with high vegetation cover improved restoration quality. Deng et al. [26] evaluated 15 combinations of four visual factors and four auditory factors and found that natural sounds such as the sound of running water, wind blowing through plants, and birdsong are positive predictors of recovery benefits, while human activities and their corresponding sounds are negative predictors of recovery benefits. Liu et al. [27] combined six blue spaces with 14 sounds and found that the sound of a river had a greater restorative quality than a fountain or stream, while the sound of sea waves had a lower restorative quality. Footsteps are inappropriate in blue areas with lush natural surrounds.
At present, most research on soundscapes and health focuses on the evaluation of a single sound source in the laboratory. However, a soundscape cannot be separated from its environment. “Sound, environment and human” are interrelated and interact with each other [19]. Therefore, this study involved forest health walking from the perspective of soundscape to explore the role of forest environments in promoting people’s health. The main objective of this study is to analyze the relationship between source perception, soundscape perception, restorative perception, and health benefits, and to model the relationships between soundscape perception, restorative perception, and health benefits through structural equation modeling (SEM), as well as to explore the possible mediating role of this potential variable of restorative perception. The results of the study are intended to provide new ideas on soundscape perception perspectives for the development of forest healing activities, and to provide a scientific basis for soundscape design and creation.

2. Materials and Methods

2.1. Study Area

The study was conducted in Fuzhou National Forest Park. It is “the largest natural oxygen bar in Fuzhou City”, located in Jin ‘an District, Fuzhou City, Fujian Province. The park is rich in landscape types and scenery resources including the Zhengxin Temple, millennia-old Banyan tree, and other natural landscape, attracting many recreational visitors wanting to experience the “forest bath”. The healing trail is approximately 3 km long and consists of 10 soundscape healing points (Figure 1), covering the main scenic spots and special parks within the park as a whole. The panorama of 10 points is shown in Figure 2.
Sample plot 1 is located in the Shade Botanical Garden, which is an understory landscape rich in vegetation. Sample plots 2 and 3 are located in the Bamboo Landscape Garden, where S2 is mainly characterized by recreational trails, and S3 has a high degree of artificiality, with substantial hard paving. Sample plots 4 and 5 are located in the Millennium Banyan Garden, where S4 is dominated by the open lawn in front of the Millennium Banyan, and S5 is a waterside open space in front of the Millennium Banyan; Sample plot 6 is located in the Peach Blossom Garden, which has a slightly undulating topography and is close to the Zheng Xin Temple. Sample plot 7 is located in the Crape Myrtle Garden, which has a landscape dominated by different varieties of crape myrtle, some of which are in bloom. Sample plot 8 is located at the Man Shui Bridge, with a landscape of falling water and panoramic views. Sample plot 9 is located in the Cherry Blossom Garden, which is a landscape in the woods with cherry blossoms and wooden paths. Sample plot 10 is located in the Hearing Springs Pavilion, with a more natural landscape of streams as its main environmental feature.

2.2. Participates

College students are at high risk of mental health problems and suboptimal health status, and studies have shown that college students are significantly more susceptible to academic stress and more likely to suffer from stress-related illnesses [28,29]. Studies with college students as experimental participants are extensive and scientific in nature [30,31]. Furthermore, based on the experience of forest therapy field studies, a sample size of around 30 is a medium sample size [9,32]. Therefore, 30 students (13 male and 17 female, with a mean age of 23.83 ± 2.28 years) with normal hearing and basic knowledge of soundscapes and landscapes were recruited for the experiment. They were told to pay attention to the sound environment and walk quietly without speaking. The experiment was conducted three times, with 10 people led by one of the researchers each time, stopping at 10 points to complete a questionnaire.

2.3. Questionnaire Design

2.3.1. Sound Sources

Through repeated visits to the park, 11 frequently occurring sounds were identified and classified into four sound categories [33], including natural sounds, sounds from human beings, mechanical sounds, and cultural sound. The category of natural sounds included running water, birdsong, chirping, cicada chirping, leaves rustling, and wind sound. Sounds from human beings included footsteps, conversation, and children’s frolicking. Traffic noise was classed as a mechanical sound. The temple’s bell was classed as a cultural sound. The participants were asked to use the 7-level Likert scale to select the sounds they heard at each point, using the sound source identification scale (ISO/TS 12913-2, 2018) [34]. The specific question was, “To what extend do you presently hear the following sounds in the current environment? (1—not at all, 2—almost inaudible, 3—a little, 4—moderately, 5—a lot, 6—very much, 7—dominates completely)”.

2.3.2. Soundscape Perceptions

According to previous research, pleasantness and eventfulness were two commonly used dimensions in evaluating soundscape perception. “Pleasant”, “comfortable”, and “harmonious” were frequently used to describe the pleasant experience. “Various”, “eventful”, and “dynamic” were frequently used to describe eventfulness [35,36]. The study selected “Pleasant”, “Harmonious” and “Various” for evaluation, in addition to combining the psychoacoustic parameters to evaluate the soundscape perception. Psychoacoustic parameters such as loudness, sharpness, roughness, and fluctuation strength can reflect people’s subjective auditory sensations as illustrated in Table 1 [37]. The psychoacoustic parameters were evaluated using words such as loud, harsh, rough, and fluctuant. In a word, seven indicators, pleasant, harmonious, various, loud, sharp, rough and fluctuant, were selected for soundscape perception evaluation. Participants indicated how much they agreed with the items on a 7-point Likert response format, ranging from 1, ‘completely disagree’, to 7, ‘completely agree’.

2.3.3. Perceived Restoration

The self-rating method of Short-version Revised Restoration Scale (SRRS) developed by Han was used to assess participants’ restorative potential [14]. The SRRS is made up of eight items that are evenly distributed among the four aspects of emotion, cognition, physiology, and behavior (Table 2). The scale has been used in many studies on related recovery evaluation and had high reliability and validity [25,27,38,39]. Participants indicated how much they agreed with the items on a 9-point Likert scale, ranging from 1, ‘completely disagree’, to 9, ‘absolutely agree’.

2.3.4. Perceived Health Benefits

The perceived health benefits scale was referenced on Liu’s study [40], including fatigue reduction, rejuvenation, relaxation, and concentration enhancement. Participants indicated how much they agreed with the items on a 7-point Likert scale, ranging from 1, ‘completely disagree’, to 7, ‘absolutely agree’.

2.4. Data Analysis

The data were processed in SPSS 24.0 and AMOS 24.0. Two points need to be explained: (1) There were just three locations with sound of running water (5, 8, 10). The relationship between it and soundscape perception, perceived restoration, and perceived health benefits was examined using data from these three places. (2) The succeeding investigation was excluded because the bell sound was only present in Site 6. Spearman’s rho correlation analysis was used to identify correlations between sound source perception, total soundscape perception, perceived restoration, and perceived health benefits. Then, in order to obtain a comprehensive picture of the relationships between overall soundscape perception, perceived restoration, and perceived health benefits, structural equation modeling (SEM) was conducted. Exploratory and confirmatory factor analysis were performed during the SEM procedure. The principal variables of soundscape perception were obtained using exploratory factor analysis (EFA). The confirmatory factor analysis (CFA) verified the factor structure of soundscape perception, perceived restoration, and perceived health benefits. Through the results of the EFA and CFA, the SEM for the correlations between soundscape perception, perceived restoration, and perceived health benefits was carried out. EFA was carried out utilizing SPSS 24.0. CFA and SEM analysis were performed using AMOS 24.0.

3. Results

3.1. Reliability

An exploratory factor analysis (EFA) was conducted before confirming soundscape perception reliability. To obtain the orthogonal factors, a principal component analysis with varimax rotation was used. The results of Bartlett’s test of sphericity (p = 0.000 < 0.001) and the Kaiser-Meyer-Olkin test (KMO = 0.679 > 0.6) indicated that the data were suitable for factor analysis. Two factors with eigenvalues greater than one were found, accounting for about 62.9% of the total variance. So, soundscape perception could be explained by two factors. Factors 1 and 2 explained 32.5% and 30.4% of variance, respectively. Factor 1 represented the pleasantness of the soundscape and showed high factor loading scores for pleasant, various, fluctuant, and harmonious. Factor 2 could be interpreted as the annoying quality of the soundscape and showed high factor loading scores for rough, sharp, loud (Table 3).
To confirm the reliability, the Cronbach’s alphas for the various variables were computed. The Cronbach’s Alpha was 0.736 (pleasantness of soundscape), 0.759 (annoyingness of soundscape), 0.733 (perceived restoration), and 0.943 (perceived health benefits). All the latent variables showed high Cronbach’s alpha values over 0.7, indicating good reliability [41].

3.2. Sound Sources Perception and Overall Soundscape Perception

The degree of sound source perception at the sample site is shown in Figure 3. In general, the degree of perception of natural sounds was the highest, with the higher perception degrees for birdsong (mean value = 4.643) and cicadas (mean value = 4.740); the perception degree of chirping was the second highest (mean value = 4.300). Running water was most noticeable in sample plots 5/8/10 and was perceived to a greater extent. Leaves rustling and wind sounds were lower. The overall perception of artificial sounds was very low, specifically footsteps, with a mean value of 1.320, conversations with a mean value of 1.390, and children’s frolicking with a mean value of 1.347, with children’s frolicking and conversation sounds being highly perceived in sample plot 5. Traffic sounds were almost absent in all sample plots. The bell sound was only present in sample site 6 with a value of 4.867.
The relationships between sound sources perception and overall soundscape perception were identified by conducting Spearman’s rho correlation analysis, as presented in Table 4. The perception of birdsong showed significantly positive relationships with soundscape perception in terms of fluctuant (p < 0.001), pleasant (p < 0.001), harmonious (p < 0.001), and various (p < 0.001), while being negatively related to sharp (p < 0.01) and rough (p < 0.05). The sound of chirping also had positive effects on fluctuant (p < 0.05), harmonious (p < 0.05), and various (p < 0.001). In addition, the sound of running water had positive effect on pleasant (p < 0.05), harmonious (p < 0.001), and loud (p < 0.001). Cicada chirping was positively correlated to fluctuant (p < 0.05), various (p < 0.001), and sharp (p < 0.001). The sound of leaves rustling was positively related to pleasant (p < 0.05), various (p < 0.001), and rough (p < 0.05), while the sound wind was positively related to fluctuant (p < 0.001), pleasant (p < 0.01), and rough (p < 0.001).
However, the sound of conversation and children’s frolicking both had negative effects on harmonious (p < 0.05) and were positively related to various (p < 0.001, p < 0.05). The sound of footsteps was positively related to various (p < 0.05) and rough (p < 0.05). Meanwhile, traffic noise showed a negative relationship with pleasant (p < 0.05) and a positive relationship with rough (p < 0.001). Generally, natural sounds had more pleasantness soundscape perception, compared with human sounds and mechanical sounds.

3.3. Relationships between Sound Source Perception, Perceived Restoration, and Perceived Health Benefits

Relationships were identified by conducting Spearman’s rho correlation analysis, as presented in Table 5. In terms of perceived restoration, the perception of birdsong showed positive relationship with emotional (p < 0.05). The sound of running water and leaves rustling were positively associated with emotional (p < 0.01, p < 0.001), cognitive (p < 0.05), and behavioral (p < 0.05). The sound of wind was also positively correlated with emotional (p < 0.01) and cognitive (p < 0.05). On the contrary, cicadas chirping showed a negative correlation with cognitive (p < 0.05) and behavioral (p < 0.05).
With regard to the perceived health benefits, birdsong and the sound of leaves rustling had a significant contribution on fatigue reduction (p < 0.05, p < 0.001), rejuvenation (p < 0.05, p < 0.001), relaxation (p < 0.05, p < 0.01), and concentration enhancement (p < 0.05, p < 0.001). Moreover, the sound of running water had a noticeable positive effect on fatigue reduction (p < 0.001), rejuvenation (p < 0.001), and relaxation (p < 0.01). The sound of wind also contributed to rejuvenation (p < 0.05) and concentration enhancement (p < 0.05). Consequently, frequent perception of most natural sounds such as running water, birdsong, leaves rustling and wind sound could improve the positive perceived restoration and perceived health benefits.

3.4. Relationships between Overall Soundscape Perception, Perceived Restoration and Perceived Health Benefits

The relationships between overall soundscape perception, perceived restoration and perceived health benefits based on Spearman’s rho correlation analysis are shown in Table 6. In terms of perceived restoration, the perception of various, fluctuant, pleasant, and harmonious showed positive relationship with emotional (p < 0.001), cognitive (p < 0.001), and behavioral (p < 0.001). Various and harmonious showed negative relationships with physiology (p < 0.01, p < 0.001). Sharp showed a negative relationship with cognitive (p < 0.05) and behavioral (p < 0.001). Sharp and rough showed positive relationships with physiology (p < 0.05).
In terms of perceived health benefits, various, fluctuant, pleasant, and harmonious showed positive significant relationships with all dimensions (p < 0.001), while a sharp soundscape could have a significant adverse, effect except with rejuvenation (p < 0.01). Additionally, loud showed a positive relationship with rejuvenation (p < 0.05).

3.5. Structural Equation Modeling (SEM)

3.5.1. Confirmatory Factor Analysis

In Section 3.1, the principal variables of soundscape perception were obtained using exploratory factor analysis (EFA), and all the latent variables showed high Cronbach’s alpha values over 0.7, indicating good reliability. For SEM, physiology was removed from the latent variables of perceived restoration, and better reliability could be achieved.
Convergent validity refers to the extent to which a set of measured variables reflects the latent construct. The results are shown in Table 7. All the observed variables displayed reasonably excellent convergent validity (Standardized factor loading ≥ 0.5, AVE ≥ 0.5, CR ≥ 0.6) except pleasantness of soundscape. The AVE for pleasantness of soundscape was found to be 0.424, which means that the outcome was just below the ideal level for AVE. However, Fornell and Larcker (1981) stated that there is no issue with convergent validity if CR is higher than 0.70 [35]. It was therefore employed in the analysis.

3.5.2. Concept Structural Equation Model

Based on the previous results, three main hypotheses (H1, H2, H3) related to soundscape perception, perceived restoration, and perceived health benefits in a given place, and five specific hypotheses were proposed as follows:
H1: 
Soundscape perception influences perceived restoration.
H1a: 
Pleasantness of soundscape is positively related to perceived restoration.
H1b: 
Annoyingness of soundscape is negatively related to perceived restoration.
H2: 
Soundscape perception influences perceived health benefits.
H2a: 
Pleasantness of soundscape is positively related to perceived health benefits.
H2b: 
Annoyingness of soundscape is negatively related to perceived health benefits.
H3: 
Perceived restoration influences perceived health benefits.
H3a: 
Perceived restoration is positively related to perceived health benefits.
A conceptual model of SEM describing the relationships among the latent constructs is illustrated in Figure 4.

3.5.3. Modified Structural Equation Model

The goodness-of-fit indices of the suggested concept model were calculated using the maximum likelihood approach [30]. Obtained values of the model and recommended values for assessing validity of the SEM are shown in Table 8. The values of GFI and RMSEA did not correspond to the favorable values. Thus, the model was adjusted in accordance with the output outcomes. The fundamental rules of model modification were then applied, adding modification paths to the model with higher Modification Index (MI) values. When the goodness-of-fit indices exceed the suggested levels following a particular phase, the modification procedure comes to an end. In order to fit the suggested values, three routes between the measurement errors of five observed variables were added to the conceptual model. The values of the goodness-of-fit indices for the modified model are shown in Table 8.
The modified model is illustrated in Figure 5. Pleasant had the best explanatory power for pleasantness of soundscape, effectively explaining 74.1% of the variation. While fluctuant, various, and harmonious explained, respectively, 28.6%, 23.3%, and 37.6%. Sharp had the greatest ability to explain annoyingness of soundscape, effectively explaining 79.4% of the variance, while loud and rough explained 33.5% and 46.3%, respectively. Each dimension of perceived restoration explained over 70.0% of the variance, with explanatory power in the order of emotion > behavior > cognition, and a significant positive correlation between the cognitive and behavioral dimensions. Relaxation (87.5%) and fatigue reduction (87.2%) had comparable explanatory power for variance in the perceived health benefit assessment, and rejuvenation (76.5%) and concentration enhancement (73.2%) had comparable explanatory power for variance.
The maximum likelihood approach was used to estimate the regression coefficients of the paths in the model, and the results are displayed in Table 9. For hypothesis H1, only soundscape pleasantness had a significant positive influence on restorative perception (β = 0.705, p < 0.001). Both paths did not achieve statistical significance for H2. For H3, there was a significant positive effect of restorative perception on health benefits (β = 0.966, p < 0.001). In terms of the three added hypotheses, H4a, H4b, and H4c, there was a highly substantial positive correlation between “various—fluctuant” (β = 0.251, p < 0.001), “various—loud” (β = 0.286, p < 0.001), and “cognitive-behavioral” (β = 0.461, p < 0.001).

3.5.4. Mediating Effect

There are two mediating effect paths in the model assumptions. The mediating factor between perceived health benefits and pleasantness of soundscape or annoyingness of soundscape was the perceived restoration. Bootstrapping (repeated sampling 2000 times) was used to examine the mediating effect, and the results are displayed in Table 10. The calculated value at a 95% confidence level had a confidence interval of 0, which indicated that the mediating effect was nonexistent. The computed value’s confidence interval did not contain 0 at the 95% level of assurance, indicating that the mediating effect was significant. There was a totally indirect effect between pleasantness of soundscape and perceived health benefits (0.681), indicating that improvements in pleasantness of soundscape do not directly enhance health benefits but rather do so indirectly through improvements in restorative perceptions. There was no mediating effect between annoyingness of soundscape and perceived health benefits.

4. Discussion

Soundscape perception, restorative perception, and health benefits were all affected differently by different types of sound sources. Overall, natural sounds had more positive effects on pleasurable soundscape perception, restorative perception, and health benefits. Previous studies have shown that nature-related sounds are more pleasant and people desire natural sounds such as birdsong, rustling leaves, and water flow, whereas human-related and mechanical sounds are more annoying [21,22]. Natural sound has a restorative effect on people, relieving stress, reducing anxiety and agitation, and contributing to emotional recovery [20,25,26,42]. Our findings support this trend, providing further evidence that natural sounds such as birdsong, running water, and wind-blown leaves could provide positive restorative experiences and provide health benefits for humans. Birdsong was most closely associated with the pleasantness of the soundscape, being related to the factors, fluctuant, pleasant, harmonious, and various [43]. At the same time, birdsong had a positive association with emotion, effectively promoting cognitive recovery and improving health benefits [44,45]. Water sounds had a significant positive correlation with the pleasantness of soundscapes, bringing people a harmonious and pleasant feeling. This was confirmed by previous research, which showed that the sound of water can reduce the annoyingness of noise and increase the enjoyment of urban green spaces [46]. The sound of running water makes people feel “comfortable”, “relaxed”, and “natural”; arouses positive emotions; generates attention to the environment; and promotes behaviors such as visiting and staying [47,48,49]. The sounds of wind and leaves rustling had a positive relationship with emotion, cognition, and behavior, promoting health benefits. Wind sounds can alleviate mental fatigue [42] and wind-induced vegetation sounds have a positive impact on human health and well-being [50]. However, not all natural sounds have a positive impact on people’s perception of restorative and health-related benefits. Cicada chirping was fluctuant and various but sharp, which can easily make people feel agitated in an otherwise quiet environment, and thus has a negative impact on cognition and behavior [51].
Pleasantness of soundscape had a significant positive effect with restorative perceptions, and restorative perceptions had a significant positive effect on health benefits. Soundscape pleasantness had no direct effect on the assessment of health benefits, but could indirectly influence health benefits through the mediating role of restorative perceptions. First, previous studies have shown that soundscape pleasantness had a large positive effect on perceived soundscape restorativeness, and that soundscape pleasantness was more influential than eventfulness [52]. And our study had similar findings; pleasantness of soundscape had a significant positive effect on restorative perceptions, with pleasant explaining much more than various. Secondly, our findings are consistent with Liu et al.’s study, which found that an environment providing restorative experiences can be effective in enhancing health benefits [40]. Furthermore, from a health-related perspective, sound perception can enhance the restorative perception of humans in the environment, which in turn has a positive impact on physical and mental health [53]. Our study found that soundscape pleasantness had to be fully mediated by restorative perceptions in order to exert a positive influence on health benefits. This suggests that the substantial effect of soundscape pleasantness on health benefits is a result of the transmission of positive restorative perceptual responses such as positive emotional arousal, restoration of cognitive attention to the environment, and behavioral (visit, stay) facilitation by the person in the environment. The findings are similar to Liu et al.’s findings [40], confirming that restorative perceptions have an indispensable role between the perception of environmental attributes (soundscape, visual) and health benefits. The result was also similar to Fisher et al.’s findings, wherein restorative quality served as a mediator between perceived biodiversity, sound, naturalness, and safety issues with well-being benefits [54]. It is worth noting that there was no significant correlation between annoyingness of soundscape and restorative perception or health benefits. There are two possible explanations. On the one hand, the forest park is dominated by natural sound and is rich in vegetation. Vegetation has a positive influence on the perception of environmental noise, especially arbors [55]. On the other hand, the high visual quality of the landscape in a forest park and a good visual environment will attenuate the negative effects of noise [56], and the visual landscape plays a mediating role in the process by which sound landscape perception affects restorative perception [52]. During the modification of the model, three new paths were added to meet the requirements of the goodness-of-fit metric. There was a significant positive correlation between “various—fluctuant” and “various -loud” in soundscape perception. It is plainly obvious that variety and fluctuation are significant factors in describing the pleasantness of a soundscape because previous research has shown a positive correlation between the two [43,51]. The perceived soundscape may appear louder as it becomes more various. There is a significant correlation between cognition and behavior in restorative perception, where improved cognition is accompanied by facilitated behavioral responses [14].
According to the study’s results, planning and design solutions based on the two aspects of pleasant soundscape creation and soundscape healing perception enhancement can be recommended. (1) Pleasant soundscape creation: According to the study’s findings, the pleasantness of a soundscape promoted restorative perception and thus had a positive impact on health benefits. Birdsong, running water, and wind-blown leaves were the key elements of the natural soundscape that had a beneficial impact. Thus, preserving and creating them is a vital way to promote health. For birdsong, priority should be given to the preservation and design of native tree species that attract birds, such as bird-feeding plants and nectariferous plants, in order to provide a source of food for birds and entice them to come to the site to forage for food and roost. Additionally, stones or wooden pegs can be placed in shallow water to attract birds. For the sound of running water, on the one hand, we can use physical methods to create the sound of running water, such as using stones to change the width of the stream, guiding the flow of water, or stopping the flow to produce more interesting sounds; on the other hand, we can create aquatic spaces with features like meditation decks, resting spots, water treads, and other comparable items to enable hearing the sound of the water. For the sound of wind and wind-blown leaves, making full use of the interaction between wind and plants, bamboo is a good choice. (2) Enhancement of soundscape healing perception experience: “Sound, environment, and people” are interrelated and interact with each other, and human perception is particularly important. Restorative perception is a key afferent factor for soundscape pleasantness and health benefits. Therefore, enhancing the perception of the participant is important for health promotion. On the one hand, this can be achieved by creating forest healing paths with sound as the primary focus, and constructing suitable healing points, such as birdsong forests and water-friendly trails, to enhance participants’ multi-sensory interactions. On the other hand, arrange corresponding supporting facilities, such as interpretive signs is another necessary step. In addition to arranging interpretation boards at important points to guide tourists to experience the soundscape independently, the diversity and fun of the interpretation system should also be considered, which can be equipped with intelligent interpretation hardware such as AR, VR, intelligent voice, QR codes for signage, and so on.

5. Limitations and Future Studies

(1) Factors influencing health in the forest environment play an essential part through sensory inputs; however, this study was conducted solely from the perspective of the soundscape, neglecting the influence of the other senses on the study’s outcomes. With future advancements in the research system, sensory variables such as vision, touch, and smell can be jointly incorporated in the study to comprehensively analyze the impact of site environmental perception aspects on the experiencer. Furthermore, controlling variables in outdoor studies is difficult. In the future, we may consider conducting research on single or multiple stimulus combinations for different stimuli through virtual reality (VR) technology [57], so that we can strictly control the independent variables and conduct in-depth research in a more purposeful way, and then investigate what factors cause the restorative effects.
(2) Research findings rely on self-reported perceptions, which might be influenced by biases such as social desirability bias or response bias. Future studies could use specialized measurement equipment to assess soundscapes and health benefits through objective data. In terms of soundscape evaluation, objective data from the bioacoustic sound index can be used to investigate the role of ecological sound in supporting health and well-being [58]. In terms of health evaluation, with the increasing popularity of portable physiological instruments, it is now possible to acquire numerous physiological indicators, such as skin conductance level (SCL), heart rate variability (HRV), functional near-infrared spectroscopy (fNIRS), etc. [59,60].
(3) Only 10 sample plots from Fuzhou National Forest Park were selected, which limited the study’s generalizability. Therefore, future studies should be conducted in various types of forest parks. Furthermore, forest soundscapes fluctuate periodically, and the same soundscape healing site can provide different effects in different seasons. Our study was conducted in the summer and is not generalizable to other seasons; therefore, there is merit in investigating seasonal differences in forest therapy.
(4) Although the use of college students as experimental participants is broad and scientific, the use of college students as public representatives brings with it significant limitations. In future studies, participants should be studied across a wider range of social and cultural backgrounds, as well as diverse life situations (e.g., healthy and unhealthy people). This would help to generate more convincing evidence for the design of forest healing environments.

6. Conclusions

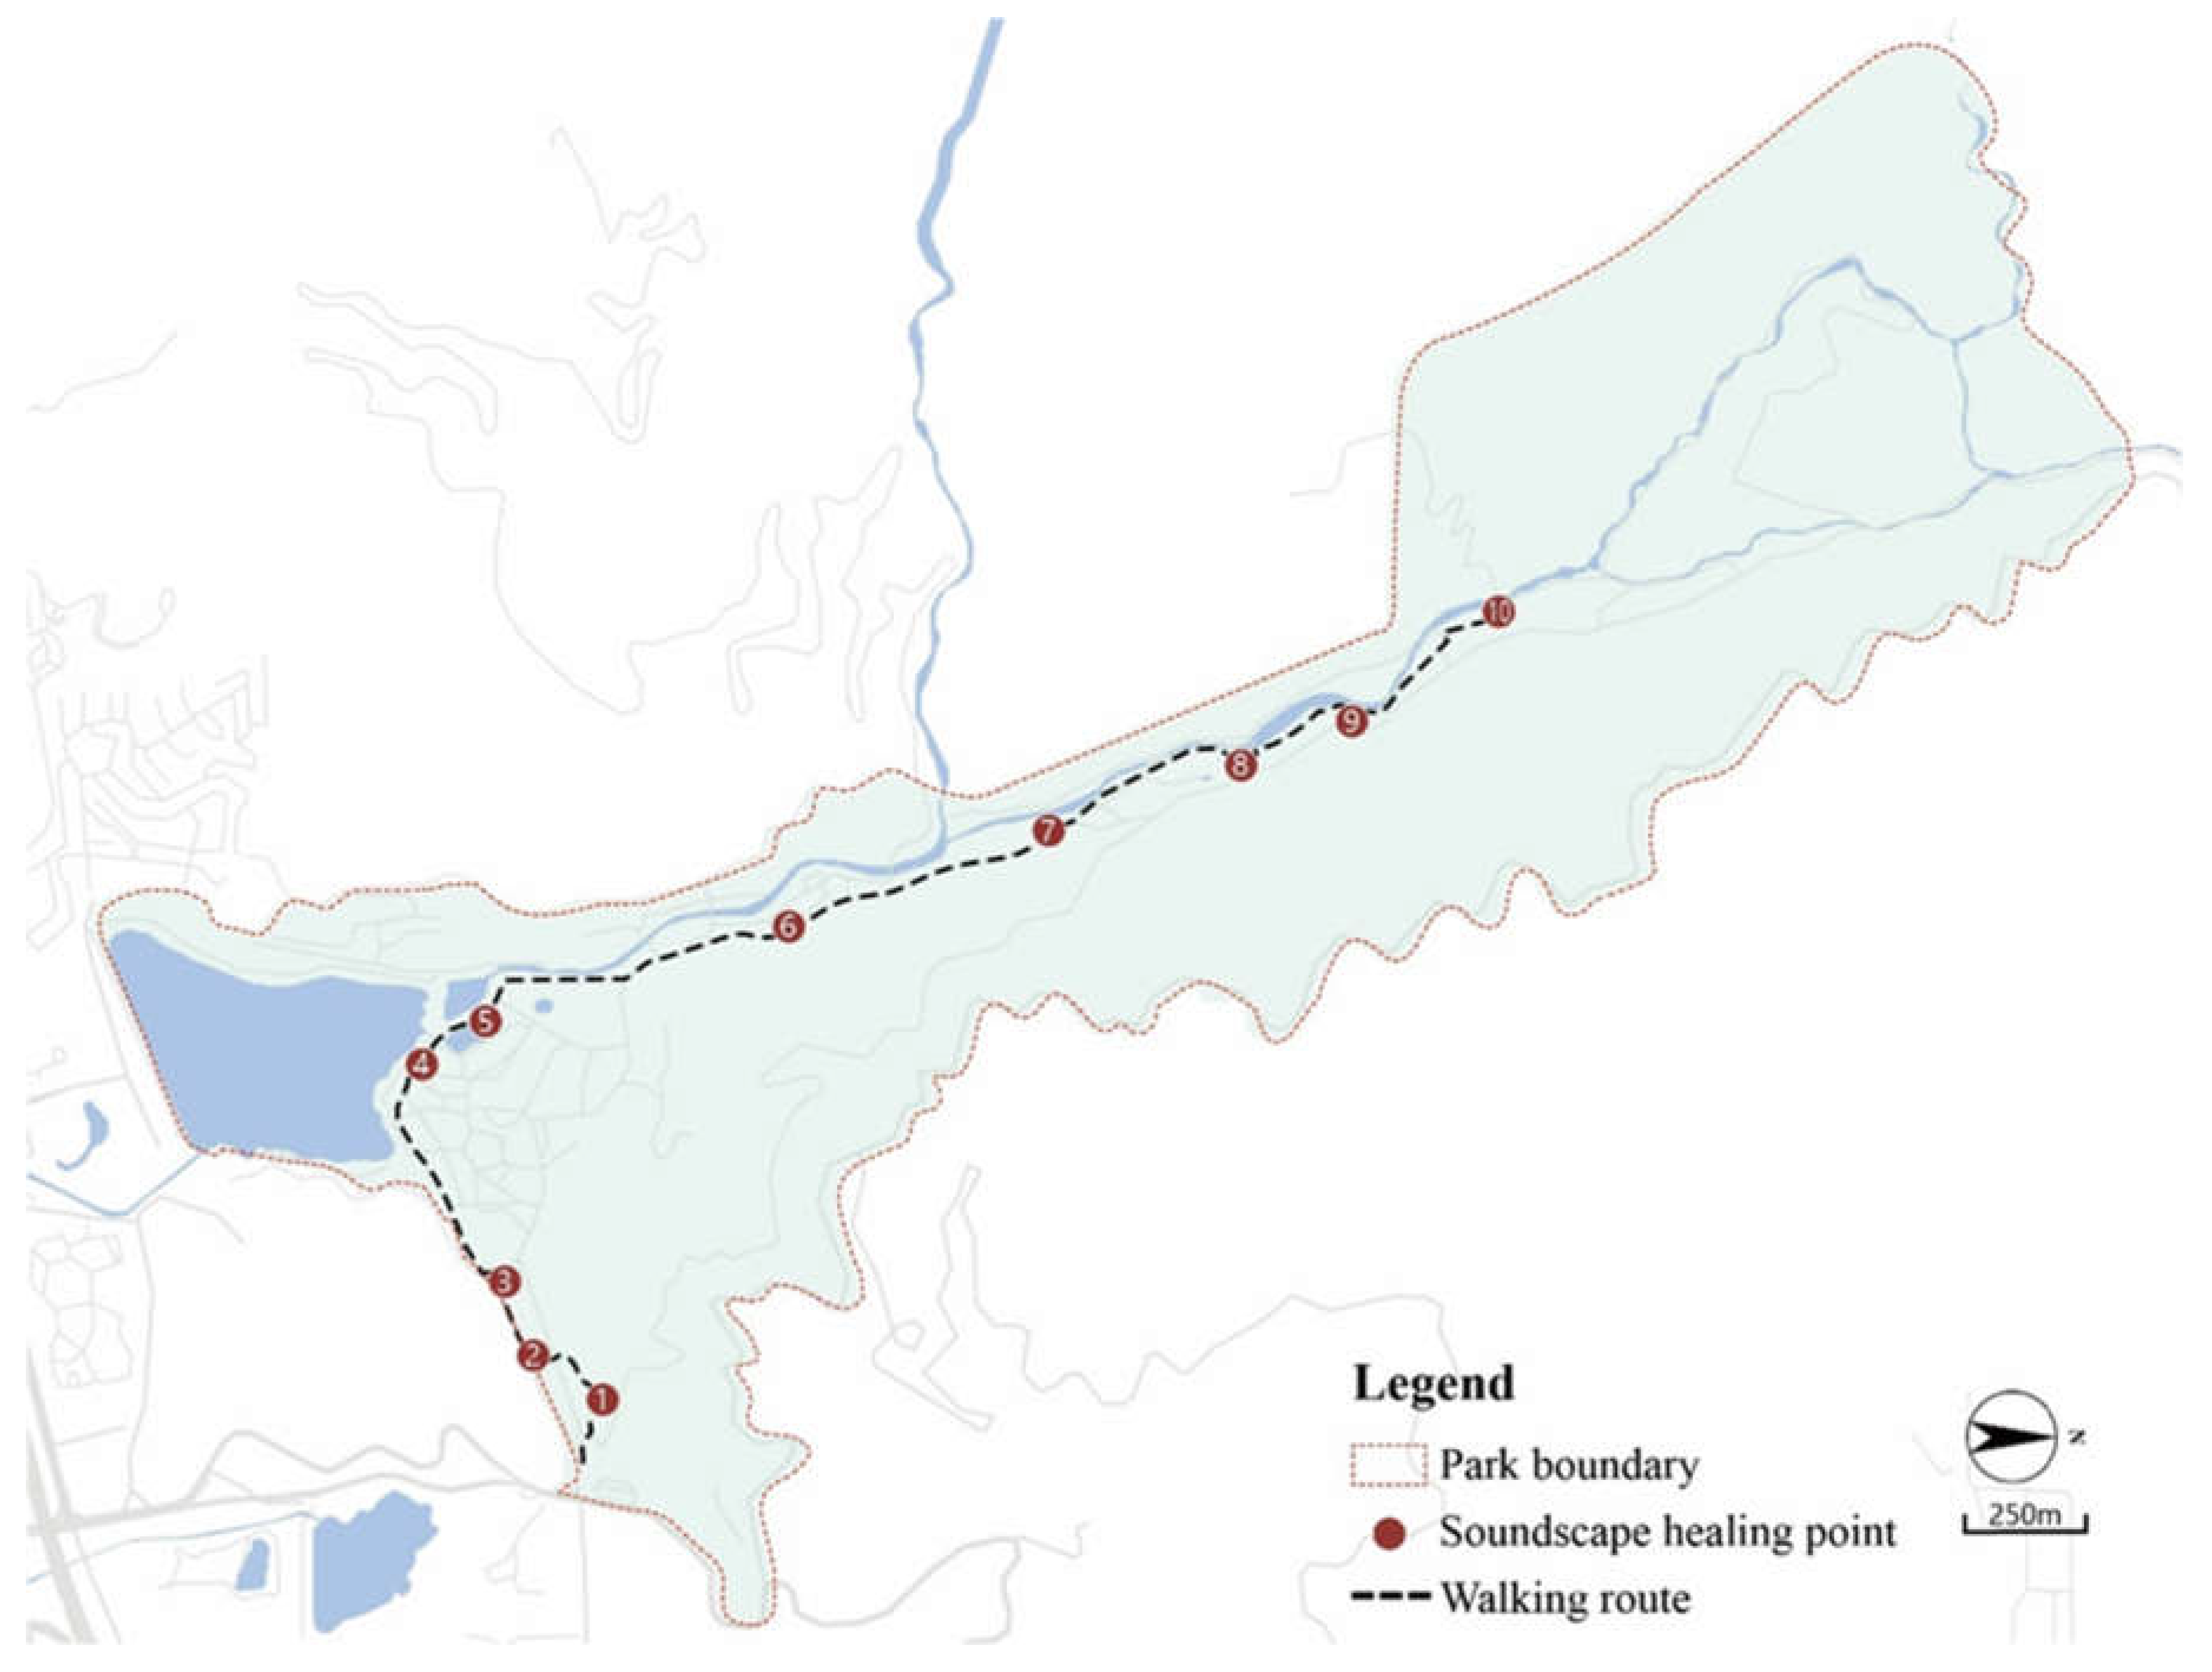
This study chose Fuzhou National Forest Park as the research location; invited 30 college students to participate in a forest acoustic walk; and collected data on sound source perception, soundscape perception, restorative perception, and health benefits using a sound source perception questionnaire, a soundscape perception questionnaire, SRRS, and a health benefits questionnaire. Correlation analysis was used to examine the relationship between soundscape, restorative perception, and health benefits. A relationship model for “soundscape perception—restorative perception—health benefits” was built using SEM. This study produced the following findings: (1) the majority of natural sounds were pleasant, harmonious, various, and fluctuant, which had a positive correlation with the pleasantness of soundscape; however, human-related and traffic noise had a negative correlation with pleasant and harmonious qualities and a positive correlation with the perception of roughness. (2) Natural sounds represented by birdsong, flowing water, and wind-blown leaves had positive effects on restorative perception. Natural sounds, except for the sound of cicadas, had positive correlations with health benefits. Neither human-related sound nor mechanical sound was significantly correlated with restorative perceptions or health benefits. (3) The perception of varied, fluctuating, pleasant, and harmonious qualities showed positive relationships with perceived restoration (except physiology) and perceived health benefits. The perception of sharpness showed a negative relationship with cognitive and behavioral benefits and perceived health benefits (except rejuvenation). SEM further revealed that the pleasantness of a soundscape had the potential to improve the perception of restoration and thus provide health benefits. The annoyingness of a soundscape had no effect on restorative perception or health benefits.

Author Contributions

Conceptualization, Y.Z. and M.W.; methodology, Y.Z. and N.H.; software, Y.Z.; validation, Y.Z., Y.W. and M.W.; formal analysis, Y.Z.; investigation, Y.Z., N.H., X.W., J.C., H.T., J.L. and Z.C.; data curation, Y.Z., N.H., H.T. and X.W.; writing—original draft preparation, Y.Z. and N.H.; writing—review and editing, Y.Z. and Y.W.; supervision, M.W. and J.D.; funding acquisition, J.D. and Y.W. All authors have read and agreed to the published version of the manuscript.

Funding

This research was funded by the Wuyi Mountain National Park Research Institute Construction Project, grant number KKy22049XA; Study of the Effects of Forest Environment on Mood and Cognitive Function in Wuyi Mountain National Park, grant number JAT220225; the Research Project on Ecological Conservation and Quality Development of National Parks, grant number KLE21013A; the Forest Park Engineering and Technology Research Centre of the State Forestry Administration of China, grant number PTJH15002.

Data Availability Statement

Not applicable.

Conflicts of Interest

The authors declare no conflict of interest.

References

  1. Xue, Y.; Liu, G.; Feng, Y.; Xu, M.; Jiang, L.; Lin, Y.; Xu, J. Mediating effect of health consciousness in the relationship of lifestyle and suboptimal health status: A cross-sectional study involving Chinese urban residents. BMJ Open 2020, 10, e039701. [Google Scholar] [CrossRef] [PubMed]
  2. WHO. Noncommunicable Diseases Progress Monitor 2022; World Health Organization: Geneva, Switzerland, 2022; p. 1. [Google Scholar]
  3. Li, Q. Effect of forest bathing trips on human immune function. Environ. Health Prev. Med. 2010, 15, 9–17. [Google Scholar] [CrossRef] [PubMed]
  4. Li, Q. Effects of forest environment (Shinrin-yoku/Forest bathing) on health promotion and disease prevention—The Establishment of “Forest Medicine”. Environ. Health Prev. Med. 2022, 27, 43. [Google Scholar] [CrossRef] [PubMed]
  5. Rajoo, K.S.; Karam, D.S.; Abdullah, M.Z. The physiological and psychosocial effects of forest therapy: A systematic review. Urban For. Urban Green. 2020, 54, 126744. [Google Scholar] [CrossRef]
  6. Kotera, Y.; Richardson, M.; Sheffield, D. Effects of Shinrin-Yoku (Forest Bathing) and Nature Therapy on Mental Health: A Systematic Review and Meta-analysis. Int. J. Ment. Health Addict. 2020, 20, 337–361. [Google Scholar] [CrossRef]
  7. Society, F.T. What Is Forest Therapy? Available online: https://www.fo-society.jp/therapy/index.html (accessed on 8 August 2023).
  8. Tsunetsugu, Y.; Lee, J.; Park, B.-J.; Tyrväinen, L.; Kagawa, T.; Miyazaki, Y. Physiological and psychological effects of viewing urban forest landscapes assessed by multiple measurements. Landsc. Urban Plan. 2013, 113, 90–93. [Google Scholar] [CrossRef]
  9. Rajoo, K.S.; Karam, D.S.; Abdul Aziz, N.A. Developing an effective forest therapy program to manage academic stress in conservative societies: A multi-disciplinary approach. Urban For. Urban Green. 2019, 43, 126353. [Google Scholar] [CrossRef]
  10. Song, C.; Ikei, H.; Miyazaki, Y. Sustained effects of a forest therapy program on the blood pressure of office workers. Urban For. Urban Green. 2017, 27, 246–252. [Google Scholar] [CrossRef]
  11. Kaplan, S. The restorative benefits of nature: Toward an integrative framework. J. Environ. Psychol. 1995, 15, 169–182. [Google Scholar] [CrossRef]
  12. Ulrich, R.S. Aesthetic and Affective Response to Natural Environment. In Behavior and the Natural Environment; Altman, I., Wohlwill, J.F., Eds.; Springer: Boston, MA, USA, 1983; pp. 85–125. [Google Scholar]
  13. Ulrich, R.S.; Simons, R.F.; Losito, B.D.; Fiorito, E.; Miles, M.A.; Zelson, M. Stress recovery during exposure to natural and urban environments. J. Environ. Psychol. 1991, 11, 201–230. [Google Scholar] [CrossRef]
  14. Han, K.-T. A reliable and valid self-rating measure of the restorative quality of natural environments. Landsc. Urban Plan. 2003, 64, 209–232. [Google Scholar] [CrossRef]
  15. Song, C.; Ikei, H.; Miyazaki, Y. Physiological effects of forest-related visual, olfactory, and combined stimuli on humans: An additive combined effect. Urban For. Urban Green. 2019, 44, 126437. [Google Scholar] [CrossRef]
  16. Hedblom, M.; Gunnarsson, B.; Iravani, B.; Knez, I.; Schaefer, M.; Thorsson, P.; Lundstrom, J.N. Reduction of physiological stress by urban green space in a multisensory virtual experiment. Sci. Rep. 2019, 9, 10113. [Google Scholar] [CrossRef] [PubMed]
  17. Annerstedt, M.; Jonsson, P.; Wallergard, M.; Johansson, G.; Karlson, B.; Grahn, P.; Hansen, A.M.; Wahrborg, P. Inducing physiological stress recovery with sounds of nature in a virtual reality forest--results from a pilot study. Physiol. Behav. 2013, 118, 240–250. [Google Scholar] [CrossRef]
  18. Chen, F.P.; Wang, Y.Q.; Li, H. The Exploration to the Function of the Forest Soundscape in Health Treatment. For. Econ. 2016, 9, 95–99. [Google Scholar]
  19. ISO/TS, 12913–1:2014; Acoustics—Soundscape—Part 1: Definition and Conceptual Framework. Technical Report. International Organization for Standardization: Geneva, Switzerland, 2014.
  20. Ratcliffe, E. Sound and Soundscape in Restorative Natural Environments: A Narrative Literature Review. Front. Psychol. 2021, 12, 570563. [Google Scholar] [CrossRef]
  21. Kariel, H.G. Mountaineers and the general public: A comparison of their evaluation of sounds in a recreational environment. Leis. Sci. 1980, 3, 155–167. [Google Scholar] [CrossRef]
  22. Wang, R.; Zhao, J. A good sound in the right place: Exploring the effects of auditory-visual combinations on aesthetic preference. Urban For. Urban Green. 2019, 43, 126356. [Google Scholar] [CrossRef]
  23. Aletta, F.; Oberman, T.; Kang, J. Associations between Positive Health-Related Effects and Soundscapes Perceptual Constructs: A Systematic Review. Int. J. Environ. Res. Public Health 2018, 15, 2392. [Google Scholar] [CrossRef]
  24. Erfanian, M.; Mitchell, A.; Aletta, F.; Kang, J. Psychological well-being and demographic factors can mediate soundscape pleasantness and eventfulness: A large sample study. J. Environ. Psychol. 2021, 77, 101660. [Google Scholar] [CrossRef]
  25. Zhao, J.; Xu, W.; Ye, L. Effects of auditory-visual combinations on perceived restorative potential of urban green space. Appl. Acoust. 2018, 141, 169–177. [Google Scholar] [CrossRef]
  26. Deng, L.; Luo, H.; Ma, J.; Huang, Z.; Sun, L.-X.; Jiang, M.-Y.; Zhu, C.-Y.; Li, X. Effects of integration between visual stimuli and auditory stimuli on restorative potential and aesthetic preference in urban green spaces. Urban For. Urban Green. 2020, 53, 126702. [Google Scholar] [CrossRef]
  27. Liu, F.; Liu, P.; Kang, J.; Meng, Q.; Wu, Y.; Yang, D. Relationships between landscape characteristics and the restorative quality of soundscapes in urban blue spaces. Appl. Acoust. 2022, 189, 108600. [Google Scholar] [CrossRef]
  28. Leppink, E.W.; Odlaug, B.L.; Lust, K.; Christenson, G.; Grant, J.E. The Young and the Stressed: Stress, Impulse Control, and Health in College Students. J. Nerv. Ment. Dis. 2016, 204, 931–938. [Google Scholar] [CrossRef] [PubMed]
  29. Haidar, S.A.; de Vries, N.K.; Karavetian, M.; El-Rassi, R. Stress, Anxiety, and Weight Gain among University and College Students: A Systematic Review. J. Acad. Nutr. Diet. 2018, 118, 261–274. [Google Scholar] [CrossRef]
  30. Wang, Y.; Chen, X.F. Application of psychophysical method in evaluation of foreign forest landscapes. Sci. Silvae Sin. 1999, 35, 110–117. [Google Scholar]
  31. Stamps, A.E. Demographic Effects in Environmental Aesthetics: A Meta-Analysis. J. Plan. Lit. 1999, 14, 155–175. [Google Scholar] [CrossRef]
  32. Rosa, C.D.; Larson, L.R.; Collado, S.; Profice, C.C. Forest therapy can prevent and treat depression: Evidence from meta-analyses. Urban For. Urban Green. 2021, 57, 126943. [Google Scholar] [CrossRef]
  33. Li, H.; Wang, Y.Q.; Chen, F.P. Evaluation of tourist survey of soundscape in meiling national forest park. Sci. Silvae Sin. 2018, 53, 9–15. [Google Scholar]
  34. ISO/TS, 12913–2:2018; Acoustics—Soundscape Part 2: Data Collection and Reporting Requirements. ISO: Geneva, Switzerland, 2018.
  35. Aletta, F.; Kang, J.; Axelsson, Ö. Soundscape descriptors and a conceptual framework for developing predictive soundscape models. Landsc. Urban Plan. 2016, 149, 65–74. [Google Scholar] [CrossRef]
  36. Hong, J.Y.; Jeon, J.Y. Influence of urban contexts on soundscape perceptions: A structural equation modeling approach. Landsc. Urban Plan. 2015, 141, 78–87. [Google Scholar] [CrossRef]
  37. Chen, K.A. Auditory Perception and Automatic Recognition of Environmental Sounds; Science Publishing & Media Ltd.: Beijing, China, 2014; pp. 206–207. [Google Scholar]
  38. Liu, Q.; Zhang, Y.; Lin, Y.; You, D.; Zhang, W.; Huang, Q.; van den Bosch, C.C.K.; Lan, S. The relationship between self-rated naturalness of university green space and students’ restoration and health. Urban For. Urban Green. 2018, 34, 259–268. [Google Scholar] [CrossRef]
  39. Memari, S.; Pazhouhanfar, M.; Nourtaghani, A. Relationship between perceived sensory dimensions and stress restoration in care settings. Urban For. Urban Green. 2017, 26, 104–113. [Google Scholar] [CrossRef]
  40. Liu, Q.Y.; Chen, Y.; Zhang, W.; Zhang, Y.J.; Huang, Q.T.; Lan, S.R. Tourists’environmental preferences, perceived restoration and perceived health at Fuzhou National Forest Park. Resour. Sci. 2018, 40, 381–391. [Google Scholar] [CrossRef]
  41. Landis, J.R.; Koch, G.G. The Measurement of Observer Agreement for Categorical Data. Biometrics 1977, 33, 159. [Google Scholar] [CrossRef]
  42. Abbott, L.C.; Taff, D.; Newman, P.; Benfield, J.A.; Mowen, A.J. The Influence of Natural Sounds on Attention Restoration. J. Park Recreat. Adm. 2016, 34, 5–15. [Google Scholar] [CrossRef]
  43. Hong, X.-C.; Wang, G.-Y.; Liu, J.; Song, L.; Wu, E.T.Y. Modeling the impact of soundscape drivers on perceived birdsongs in urban forests. J. Clean. Prod. 2021, 292, 125315. [Google Scholar] [CrossRef]
  44. Ratcliffe, E.; Gatersleben, B.; Sowden, P.T. Bird sounds and their contributions to perceived attention restoration and stress recovery. J. Environ. Psychol. 2013, 36, 221–228. [Google Scholar] [CrossRef]
  45. Ratcliffe, E.; Gatersleben, B.; Sowden, P.T. Associations with bird sounds: How do they relate to perceived restorative potential? J. Environ. Psychol. 2016, 47, 136–144. [Google Scholar] [CrossRef]
  46. Jeon, J.Y.; Lee, P.J.; You, J.; Kang, J. Acoustical characteristics of water sounds for soundscape enhancement in urban open spaces. J. Acoust. Soc. Am. 2012, 131, 2101–2109. [Google Scholar] [CrossRef]
  47. White, M.; Smith, A.; Humphryes, K.; Pahl, S.; Snelling, D.; Depledge, M. Blue space: The importance of water for preference, affect, and restorativeness ratings of natural and built scenes. J. Environ. Psychol. 2010, 30, 482–493. [Google Scholar] [CrossRef]
  48. Galbrun, L.; Calarco, F.M. Audio-visual interaction and perceptual assessment of water features used over road traffic noise. J. Acoust. Soc. Am. 2014, 136, 2609–2620. [Google Scholar] [CrossRef] [PubMed]
  49. Hsieh, C.-H.; Yang, J.-Y.; Huang, C.-W.; Chin, W.C.B. The effect of water sound level in virtual reality: A study of restorative benefits in young adults through immersive natural environments. J. Environ. Psychol. 2023, 88, 102012. [Google Scholar] [CrossRef]
  50. Chen, Z.; Hermes, J.; Liu, J.; von Haaren, C. How to integrate the soundscape resource into landscape planning? A perspective from ecosystem services. Ecol. Indic. 2022, 141, 126943. [Google Scholar] [CrossRef]
  51. Bian, Q.; Zhang, C.; Wang, C.; Yin, L.; Han, W.; Zhang, S. Evaluation of Soundscape Perception in Urban Forests Using Acoustic Indices: A Case Study in Beijing. Forests 2023, 14, 1435. [Google Scholar] [CrossRef]
  52. Guo, X.; Liu, J.; Albert, C.; Hong, X.-C. Audio-visual interaction and visitor characteristics affect perceived soundscape restorativeness: Case study in five parks in China. Urban For. Urban Green. 2022, 77, 127738. [Google Scholar] [CrossRef]
  53. Aletta, F.; Oberman, T.; Kang, J. Positive health-related effects of perceiving urban soundscapes: A systematic review. Lancet 2018, 392, S3. [Google Scholar] [CrossRef]
  54. Fisher, J.C.; Irvine, K.N.; Bicknell, J.E.; Hayes, W.M.; Fernandes, D.; Mistry, J.; Davies, Z.G. Perceived biodiversity, sound, naturalness and safety enhance the restorative quality and wellbeing benefits of green and blue space in a neotropical city. Sci. Total Environ. 2021, 755, 143095. [Google Scholar] [CrossRef]
  55. Chitra, B.; Jain, M.; Chundelli, F.A. Understanding the soundscape environment of an urban park through landscape elements. Environ. Technol. Innov. 2020, 19, 100998. [Google Scholar] [CrossRef]
  56. Liu, J.; Wang, Y.; Zimmer, C.; Kang, J.; Yu, T. Factors associated with soundscape experiences in urban green spaces: A case study in Rostock, Germany. Urban For. Urban Green. 2019, 37, 135–146. [Google Scholar] [CrossRef]
  57. Nukarinen, T.; Rantala, J.; Korpela, K.; Browning, M.H.E.M.; Istance, H.O.; Surakka, V.; Raisamo, R. Measures and modalities in restorative virtual natural environments: An integrative narrative review. Comput. Hum. Behav. 2022, 126, 107008. [Google Scholar] [CrossRef]
  58. Bradfer-Lawrence, T.; Gardner, N.; Bunnefeld, L.; Bunnefeld, N.; Willis, S.G.; Dent, D.H. Guidelines for the use of acoustic indices in environmental research. Methods Ecol. Evol. 2019, 10, 1796–1807. [Google Scholar] [CrossRef]
  59. Medvedev, O.; Shepherd, D.; Hautus, M.J. The restorative potential of soundscapes: A physiological investigation. Appl. Acoust. 2015, 96, 20–26. [Google Scholar] [CrossRef]
  60. Song, I.; Baek, K.; Kim, C.; Song, C. Effects of nature sounds on the attention and physiological and psychological relaxation. Urban For. Urban Green. 2023, 86, 127987. [Google Scholar] [CrossRef]
Figure 1. Healing trail and soundscape healing points. (Sample plot 1 is located in the Shade Botanical Garden, Sample plots 2 and 3 are located in the Bamboo Landscape Garden, Sample plots 4 and 5 are located in the Millennium Banyan Garden, Sample plot 6 is located in the Peach Blossom Garden, Sample plot 7 is located in the Crape Myrtle Garden, Sample plot 8 is located at the Man Shui Bridge, Sample plot 9 is located in the Cherry Blossom Garden, Sample plot 10 is located in the Hearing Springs Pavilion).
Forests 14 01798 g001
Figure 2. The panorama of ten soundscape healing points.
Forests 14 01798 g002
Figure 3. Degree of Sound sources perception.
Forests 14 01798 g003
Figure 4. A conceptual model of SEM for soundscape perception, perceived restoration and perceived health benefits.
Forests 14 01798 g004
Figure 5. The modified model of SEM for soundscape perception, perceived restoration and perceived health benefits. *** p < 0.001.
Forests 14 01798 g005
Table 1. The significance of psychoacoustic parameters.
IndicatorMeaning
LoudnessDescribes the loudness of the sound and indicates the intensity of the sound perceived by the human ear
SharpnessA weighted moment of loudness, a parameter that describes the proportion of high-frequency components in the sound spectrum, reflecting the sharpness of the sound
RoughnessPsychoacoustic parameters describing the degree of modulation of the sound signal, reflecting the size of the signal modulation amplitude, the distribution of modulation frequency and other characteristics
Fluctuation strengthDescribes the degree to which the human ear perceives slow-moving modulated sound, reflecting the degree to which the human ear subjectively perceives the loudness and undulation of the sound
Table 2. Short-version Revised Restoration Scale.
AspectsItems
EmotionalGood natured
Relaxed
PhysiologyMy breathing is becoming faster
My hands are sweating
CognitiveI am interesting in the presented scene
I feel attentive to the presented scene
BehavioralI would like to visit here more often
I would like to stay here longer
Table 3. The principle factors in the soundscape perception by the EFA.
Soundscape PerceptionFactor LoadingVariance Explained [%]
Factor 1: pleasantness of soundscape 32.5
Pleasant0.806
Various0.718
Fluctuant0.743
Harmonious0.727
Factor 2: annoyingness of soundscape 30.4
Loud0.755
Sharp0.863
Rough0.818
Table 4. Spearman’s rho correlation coefficients for the relationship between sound source perception and overall soundscape perception.
Sound SourcesFluctuantPleasantHarmoniousVariousLoudSharpRough
Running water−0.1120.225 *0.386 **0.0880.388 **0.116−0.007
Birdsong0.197 ***0.185 ***0.218 ***0.326 ***−0.103−0.168 **−0.124 *
Chirping0.137 *0.026 0.131 *0.260 ***0.0120.074 −0.049
Cicada chirping0.130 *−0.005 0.053 0.216 ***0.042 0.198 ***0.039
Leaves rustling0.107 0.137 *0.078 0.191 ***0.069 0.012 0.145 *
Wind sound0.202 ***0.165 **−0.019 0.016 0.029 0.092 0.202 ***
Footsteps0.090 0.032 −0.054 0.134 *−0.010 0.000 0.134 *
Conversation0.090 −0.028 −0.115 *0.192 ***−0.002 −0.015 0.101
Children’s frolicking0.077 −0.057 −0.118 *0.133 *−0.065 −0.104 0.043
Traffic noise0.013 −0.116 *−0.079 0.093 0.068 0.079 0.199 ***
Notes: * significance at the 0.05 level (2-tailed), ** significance at the 0.01 level (2-tailed), *** significance at the 0.001 level (2-tailed).
Table 5. Spearman’s rho coefficients of correlation between sound sources perception and perceived restoration or perceived health benefits.
Sound SourcesPerceived RestorationPerceived Health Benefits
EmotionalCognitiveBehavioralPhysiologyFatigue ReductionRejuvenationRelaxationConcentration Enhancement
Running water0.307 **0.234 *0.237 *−0.1950.366 ***0.302 **0.316 **0.192
Birdsong0.142 *0.0310.061−0.0320.128*0.126 *0.156 **0.130*
Chirping0.024−0.098−0.083−0.0170.0050.0220.0310.046
Cicada chirping−0.004−0.136 *−0.129 *−0.079−0.054−0.081−0.053−0.064
Leaves rustling0.240 ***0.122 *0.116 *0.0350.185 ***0.213 ***0.176 **0.191 ***
Wind sound0.158 **0.117 *0.0860.0140.0850.132 *0.1000.141 *
Footsteps0.062−0.019−0.0240.0900.0080.0590.0420.051
Conversation0.0440.0410.029−0.007−0.0060.0190.027−0.012
Children’s frolicking0.0450.0730.0920.0670.0050.0550.0570.038
Traffic noise0.007−0.008−0.031−0.077−0.026−0.039−0.003−0.042
Notes: * significance at the 0.05 level (2-tailed), ** significance at the 0.01 level (2-tailed), *** significance at the 0.001 level (2-tailed).
Table 6. Spearman’s rho coefficients of correlation between total soundscape perception and perceived restoration or perceived health benefits.
Soundscape PerceptionPerceived RestorationPerceived Health Benefits
EmotionalCognitiveBehavioralPhysiologyFatigue ReductionRejuvenation RelaxationConcentration Enhancement
Various0.483 ***0.399 ***0.376 ***−0.232 ***0.463 ***0.431 ***0.431 ***0.391 ***
Fluctuant0.333 ***0.254 ***0.290 ***−0.1030.277 ***0.219 ***0.299 ***0.297 ***
Pleasant0.572 ***0.489 ***0.493 ***−0.0730.495 ***0.496 ***0.527 ***0.530 ***
Harmonious0.407 ***0.293 ***0.347 ***−0.173 **0.432 ***0.396 ***0.413 ***0.365 ***
Loud0.0550.0670.0180.0480.0450.121 *0.0350.002
Sharp−0.091−0.131 *−0.183 ***0.132 *−0.160 **−0.109−0.160 **−0.162 **
Rough0.004−0.025−0.0550.125 *−0.105−0.053−0.098−0.065
Notes: * significance at the 0.05 level (2-tailed), ** significance at the 0.01 level (2-tailed), *** significance at the 0.001 level (2-tailed).
Table 7. Results of CFA for the reliability and construct validity.
Latent VariablesObserved VariablesCronbach’s AlphaStd. Factor LoadingCRAVE
Pleasantness of soundscapePleasant 0.7360.790.7430.4243
Various0.54
Fluctuant0.618
Harmonious0.632
Annoyingness of soundscapeLoud0.7590.5950.76980.534
Sharp0.884
Rough0.683
Perceived restorationEmotional0.9240.8370.92790.8114
Cognitive0.931
Behavioral0.931
Perceived health benefitsFatigue reduction0.9430.9390.9440.8087
Rejuvenation0.867
Relaxation0.941
Concentration enhancement0.846
Table 8. Goodness-of-fit indices of the concept and modified models and the recommended values.
Model Fit Indexχ2/dfGFIIFITLICFIRMSEA
Obtained values3.7630.8900.9380.9190.9370.093
Modified values2.8690.9170.9600.9460.9590.079
Recommended values<5.00>0.90>0.90>0.90>0.90<0.08
Table 9. Testing results of the hypothesis and standardized path loadings of the SEM.
Research HypothesisβS.E.C.R.p-Value
H1apleasantness of soundscape → perceived restoration0.7050.1558.474***
H1bannoyingness of soundscape → perceived restoration−0.060.085−1.0540.292
H2apleasantness of soundscape → perceived health benefits−0.0130.096−0.2350.814
H2bannoyingness of soundscape → perceived health benefits−0.0360.043−1.1180.263
H3aperceived restoration → perceived health benefits0.9660.05715.6***
H4avarious (e2) → fluctuant (e1)0.2510.0813.829***
H4bvarious (e2) → loud (e5)0.2860.0804.613***
H4ccognitive (e9) → behavioral (e10)0.4610.0655.004***
Notes: *** p < 0.001.
Table 10. Results of mediating effect test.
Hypothesis PathEffectPoint EstimateProduct of CoefficientsBootstrapping 2000 Times
Bias-Corrected 95% CIPercentile 95% CI
SEZLowerUpperLowerUpper
pleasantness of soundscape → perceived health benefitsDirect−0.0130.059−0.220−0.1460.088−0.1330.095
Indirect0.6810.06810.0150.0570.8470.5660.833
Total0.6680.0513.3600.5620.7600.5670.766
annoyingness of soundscape → perceived health benefitsDirect−0.0360.033−1.091−0.1030.029−0.1020.030
Indirect−0.0580.061−0.951−0.1780.057−0.1710.071
Total−0.0940.055−1.709−0.2000.012−0.1920.023
Disclaimer/Publisher’s Note: The statements, opinions and data contained in all publications are solely those of the individual author(s) and contributor(s) and not of MDPI and/or the editor(s). MDPI and/or the editor(s) disclaim responsibility for any injury to people or property resulting from any ideas, methods, instructions or products referred to in the content.

