3.2.1. Assessment Indicators
In addition to the mean pixel accuracy (mPA) metric, we also evaluated the performance of our Defog DeepLabV3+ model using the intersection over union (IoU) metric. This statistic calculates the percentage of overlap between anticipated segmentation results and their related ground truth labels. A value closer to 1 indicates better segmentation performance.
To ensure fairness in our evaluation, we computed the mean IoU to quantify our model. The equation for computing mean IoU is as follows:
where
Pi and
Gi denote the predicted result of the
i-th image and the corresponding ground truth label, respectively. This metric provides a more comprehensive evaluation of our model’s segmentation performance, which is critical for applications like forest fire detection and prevention.
In our experiments, the target is considered a positive sample if the IoU is 0.5 or above, and a negative otherwise. In addition, an additional metric from recall can be used, denoted as:
where
TP represents true positive cases and
FN represents false negative cases. It represents the ratio of right forecasts to total positive case predictions.
To ensure fairness in our evaluation, we computed the mean recall on the test set as another measure of our model’s performance. The equation for computing mean recall is similar to that of mean IoU. This metric provides a complementary evaluation of our model’s segmentation performance, as it focuses on the ability of our model to correctly identify positive cases.
3.2.2. Performance Assessment
The enhanced forest fire semantic segmentation model, built upon DeepLabV3+, integrates defogging optimization to generate defogging maps and forest fire segmentation simultaneously. In
Figure 9, the green box highlights the area with flames, which is the target for segmentation. Image a shows the original input images used in the foggy forest fire segmentation task. The experimental results highlighted in red in Image b demonstrate the commendable performance of the model. When compared with the ground truth labels in
Figure 9c, we observe that our model can accurately capture small, hidden small flames, such as flame areas 2, 3, 5 and 6. The flame edge segmentation is also very detailed, such as flame areas 1, 4, 7 and 8.
In the visual representation of images, flames have the characteristics of high luminance and high contrast [
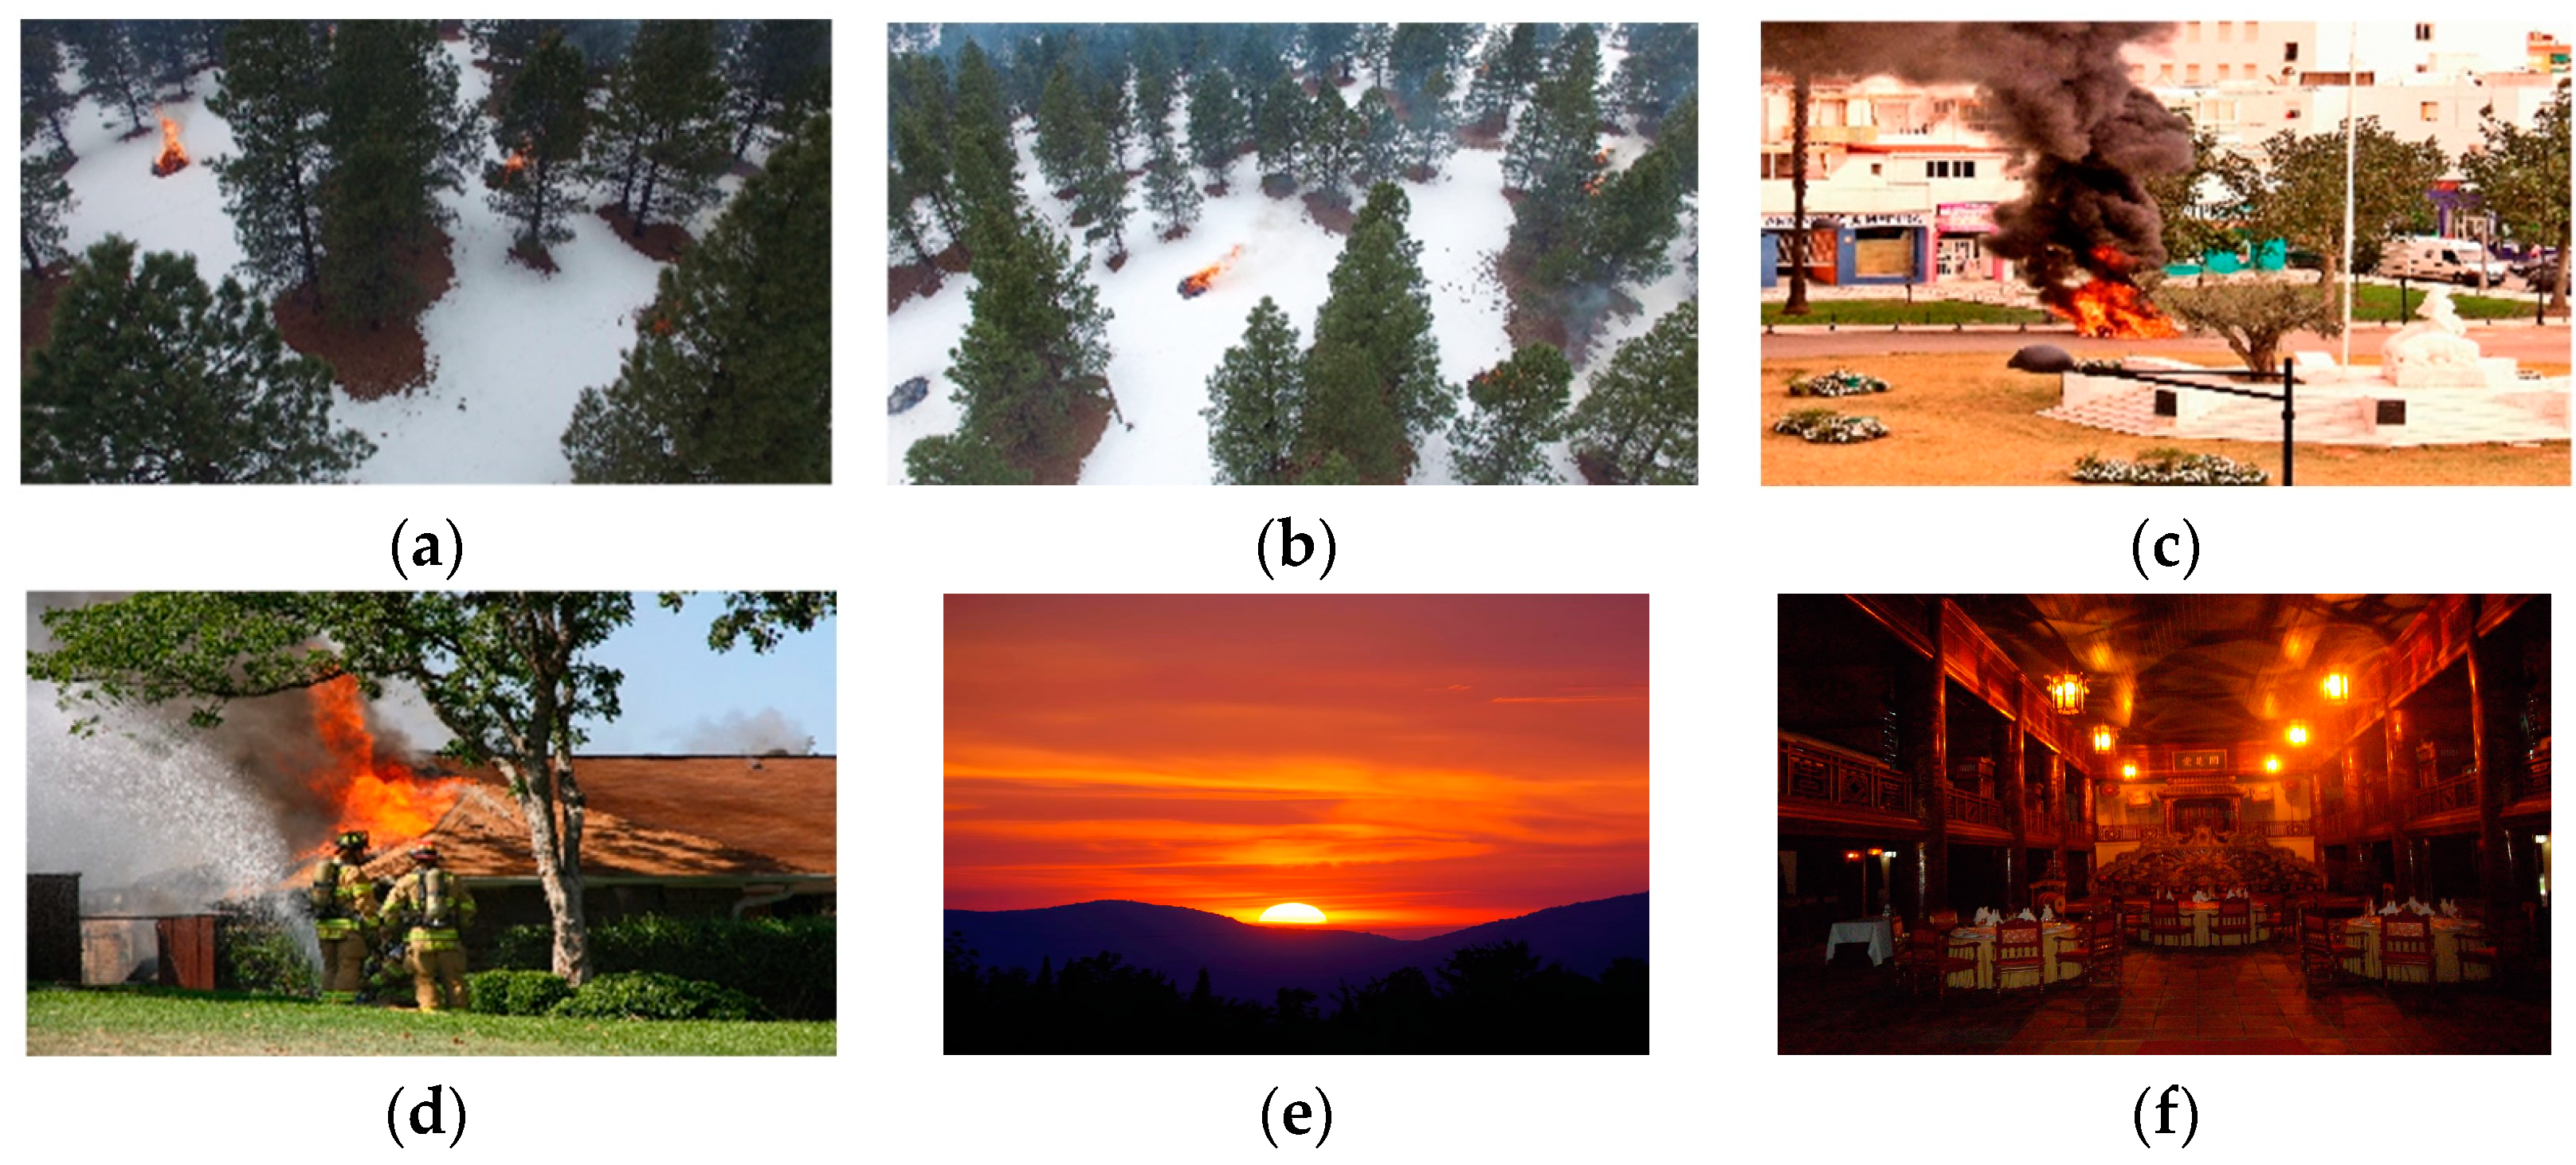
47]. This is similar to lamps, the sun, etc. Our model should be able to accurately identify flames and distinguish these flame-like objects. In
Figure 10, Image a from top to bottom is lanterns, the sun, the chandelier, and the fire hydrant. Although our model has a very small amount of misjudged pixels in Image b, such as area 1, 2 and 3, the similar objects are well distinguished from the flames. Specifically, our model achieves a high precision of 99.7% for flame segmentation, demonstrating superior performance in distinguishing flames from similar objects.
Our experiments used five-fold cross-validation, which is consistent with the data splitting ratio we agreed upon. First, the dataset was randomly divided into five equal-sized folds. Then, for each fold i, the i-th fold was used as the test set, and the other four folds were used as the training set. In this way, five models were obtained, and each model used different training and test sets.
Table 4 and
Figure 11 present the experimental findings. All models achieved high performance in terms of mPA, mIoU, and mRecall, with an average performance of 94.23%, 89.51%, and 94.04%, respectively. Furthermore, the model’s performance on the two test sets was not much different. This demonstrates the strong generalization performance of our model.
The confusion matrix for the model 1 test set is shown in
Figure 12, and the ROC curve drawn by moving the threshold is shown in
Figure 13, with the AUC calculated as 0.97 (±0.015) according to the curve. The model performs well with strong classification ability.
Furthermore,
Figure 14 shows the loss curves of our model during training for 100 epochs on the training and validation sets. It reflects that in model 1, the performance of the test set and the training set change with iterations. The overall smooth and downward trend, and gradually converge after about 80 epochs. This demonstrates how well our model can gradually improve the segmentation results by learning the properties of the input image.
To prove the superior performance of the Defog DeepLabV3+ model for forest fire segmentation, we compared our model with many cutting-edge deep-learning-based models, such as UNet, PSPNet [
42], and DeepLabV3+. We used the FFLAD dataset and configuration to train all models to guarantee it to be persuasive.
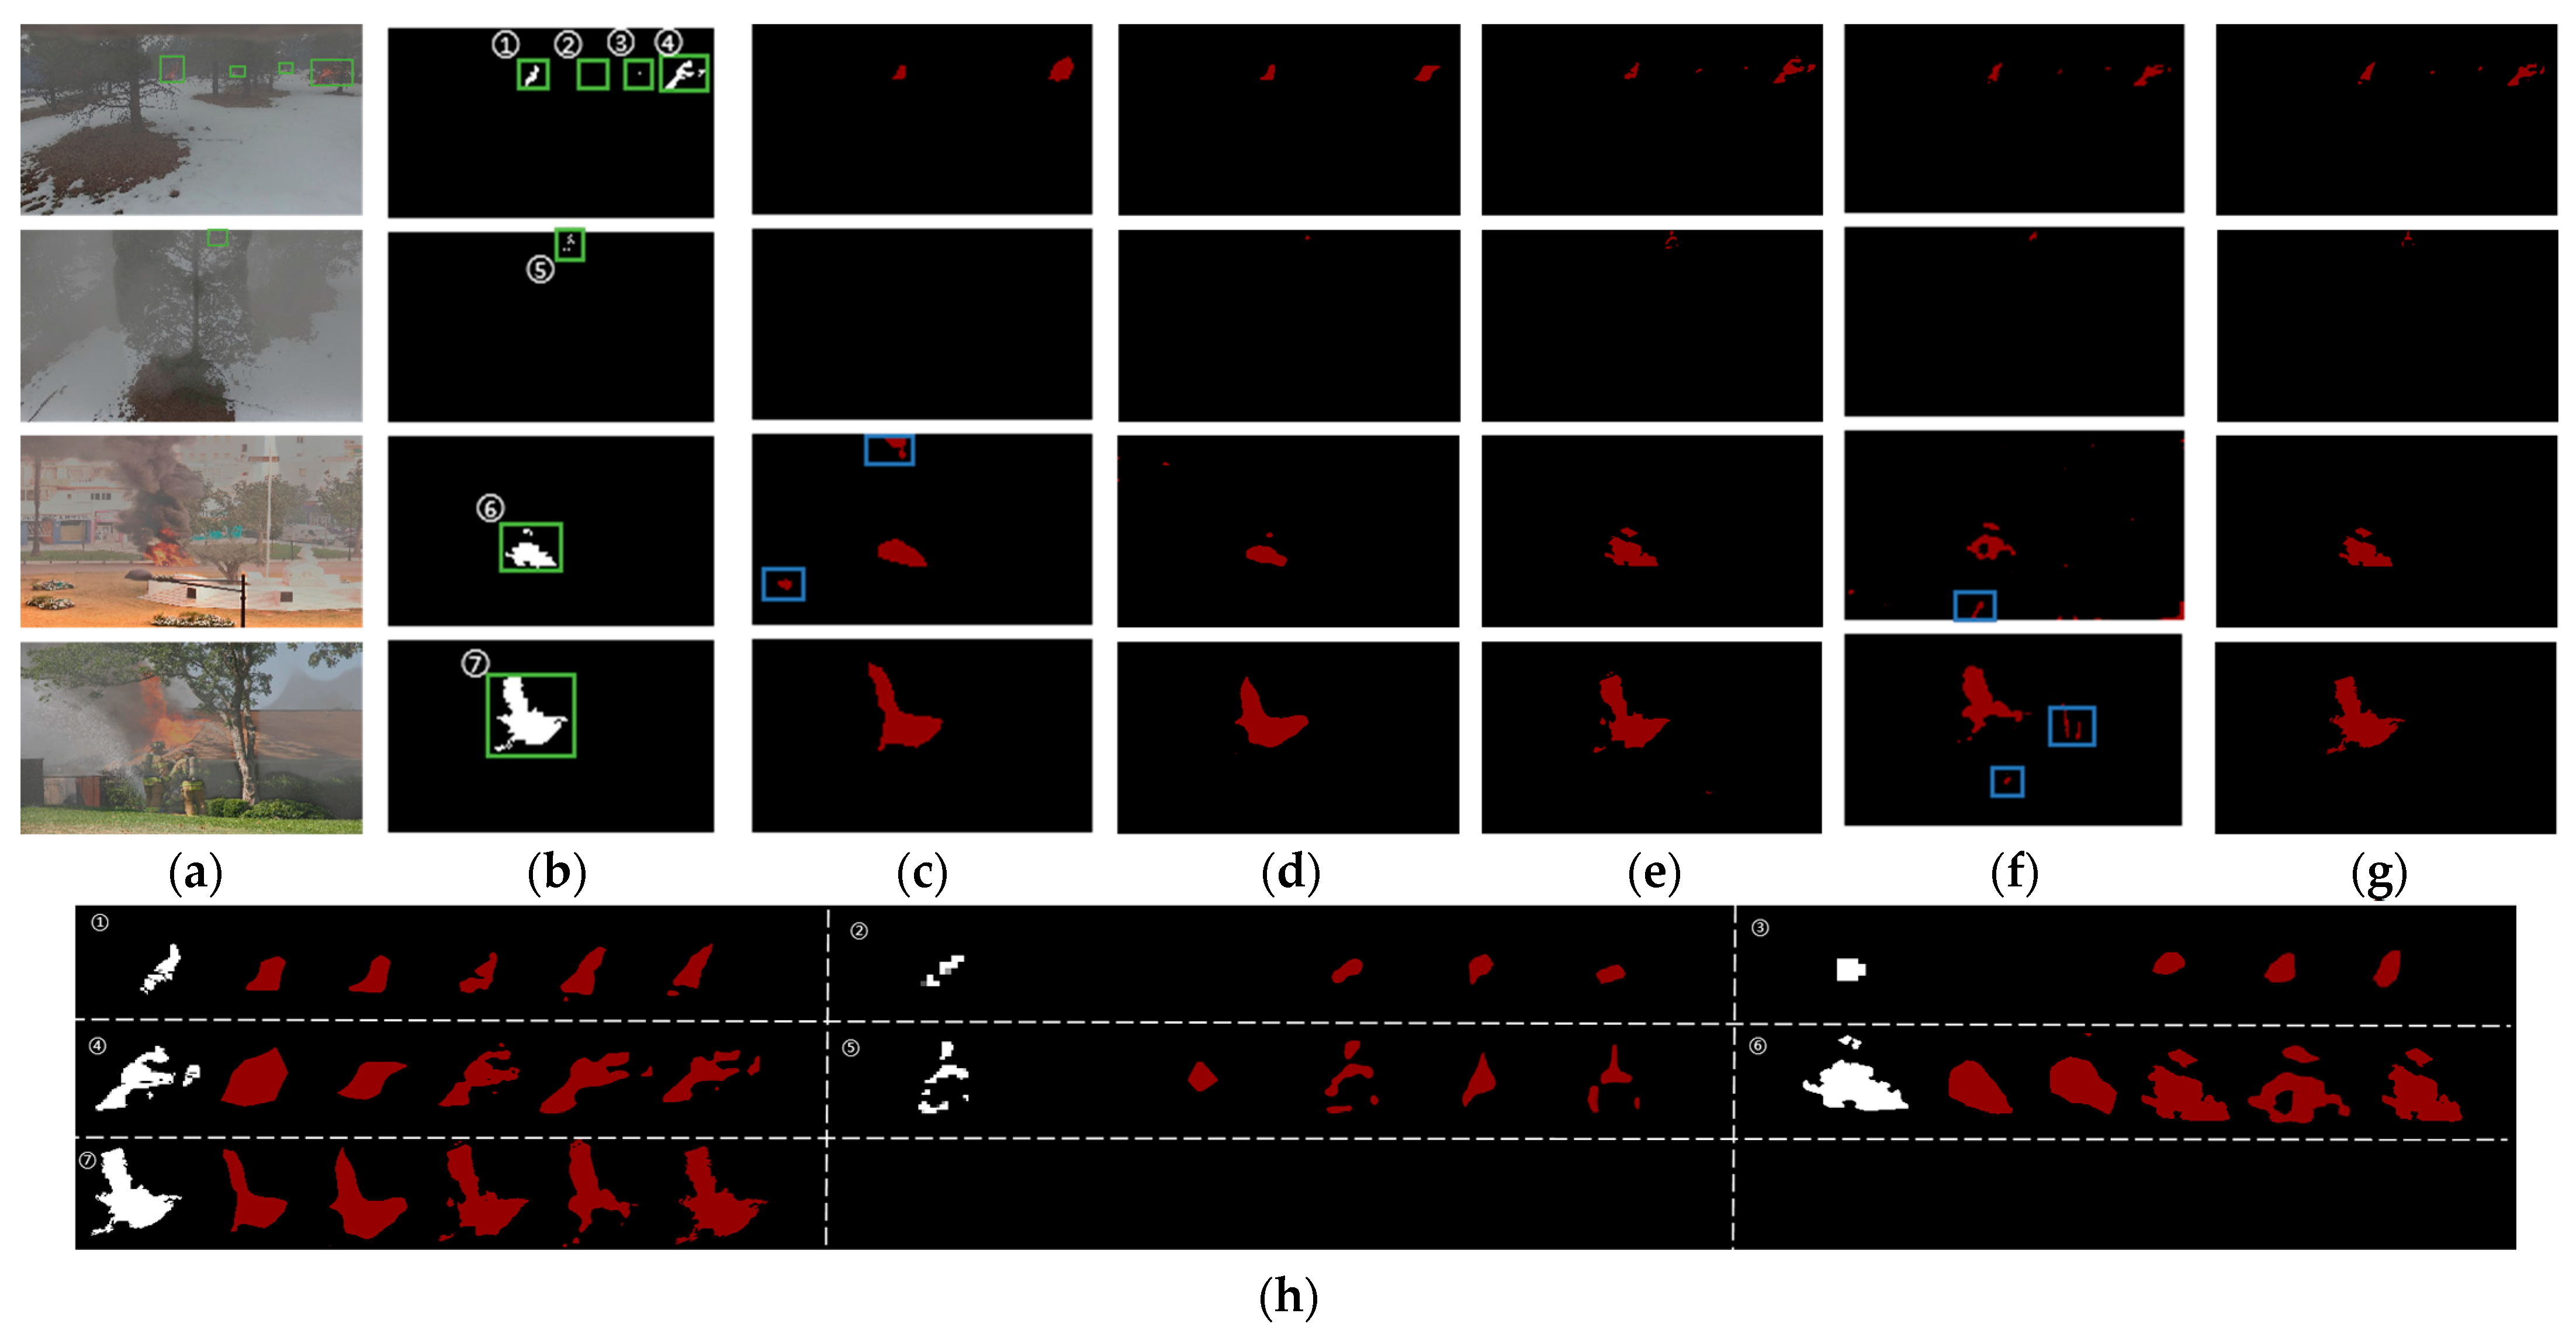
We chose four representative images and display them in
Figure 15. Most models produced relatively accurate segmentations for obvious targets that were distinguishable from the surrounding area and had low haze. However, for forest fires with small targets or high haze, shown with the green boxes in
Figure 15a,b, most models had a little under-segmentation, except UNet-agg, DeepLabv3+, and our Defog DeepLabV3+. For small and hidden flames such as flame areas 2, 3, and 5, PSPNet could not correctly identify them. Image h of flame area 5 shows that DeepLabV3+ is not very fine-grained for flame edges. Both PSPNet and DeepLabV3+ have serious false detections (marked in blue boxes). Our model outperformed other segmentation models, especially on images with large haze and complex scenarios.
Table 5 and
Figure 16 present the quantitative analysis of the compared models, where evaluation metrics such as mPA, mIoU, and mRecall were used to assess their performance. Our proposed model achieved the second-highest mPA and mIoU scores among the compared models, while also achieving the highest mRecall score in both of the test sets. These results suggest that the proposed model is able to accurately identify objects in the dataset, while also capturing the overall structure and context of the scene. Overall, the proposed model shows promise as an effective approach for semantic segmentation on this particular dataset. The combination of high mPA, mIoU, and mRecall scores indicates that the proposed model can achieve both accurate and comprehensive segmentation results, making it a valuable tool for applications that require precise object detection and segmentation.
To demonstrate the importance of introducing the attention mechanism in the segmentation branch of our model, we conducted a simple but necessary ablation experiment.
Table 6 displays the experiment’s outcomes, and they indicate that the introduction of the Dense Attention Refinement Module (DARA) significantly improves the mean intersection over union (mIoU) by about 1.5% in both cases. And
Figure 17 fully demonstrates the superiority of Model 3. This suggests that by carefully exploiting the inherent information of the features, our attention strategy may improve model accuracy.
In addition, we analyzed the importance of different pixel features after adding the DARA module through a heatmap. As shown in the
Figure 18,
Figure 18b was generated by the model and it shows the result of combining the feature map with the original image. The color of the heatmap represents the importance of different regions of the image to the model’s judgment. In this image, we can see that some areas are red or yellow, which means that these areas play an important role in the model and have a greater impact on the final prediction results. And some areas appear blue, which means that these areas have less influence on the final prediction results. The flame feature is more important than other parts in our model. This suggests that the DARA module can effectively capture the flame features. This analysis provides valuable insights for further improving the model and optimizing the segmentation results.
We estimated the model size and inference time of our proposed framework in addition to analyzing the segmentation performance of the comparable approaches. Compared to the original DeepLabV3+ model, our improved model (Defog DeepLabV3+) is slightly larger in terms of the total number of parameters, with an increase of about 46%. This increase is mainly due to the addition of a new defogging branch in our model.
In
Table 7 and
Figure 19, we can see that despite the increase in model size, the inference time of our improved model-B is almost the same as that of DeepLabV3+. This is because only the computation of the split branch is involved in the inference process. Therefore, the modest increase in computational overhead is worth the improvement in segmentation performance achieved by our proposed framework.
The evaluation of both model size and inference time is important for practical applications, as it provides information about the efficiency and feasibility of deploying the model in resource-constrained environments. Our evaluation’s findings show that the suggested structure successfully strikes a compromise between computational effectiveness and the efficiency of segmentation. This is essential for real-world applications like forest fire detection and prevention.
Finally, we performed sensitivity analysis on the model input parameters, including the batch size, initial learning rate, and number of iterations. The model performance was evaluated by the loss function on the test set, as shown in
Figure 20. As we can see from the figure, the batch size fluctuated around 0.07 with a range of 0.01, the initial learning rate was between 0.07 and 0.15, and the number of iterations converged to 0.073. It can be observed that these three parameters had little sensitivity to the model performance.


