Abstract
Dominant groups and rare groups often coexist in forests. Dominate plant families generally have more species diversity and occupy most of the biomass. However, their effects on community construction and species diversity maintenance remain to be studied. This study aims to investigate this question by using the two dominant plant families in a Chinese subtropical forest (Lauraceae and Fagaceae). In this study, 22 forest dynamic plots were established in the forest distribution area of Daming Mountain Nature Reserve at an elevation of 300–1400 m. We explored the elevational change in the community structure and its relationship with Lauraceae and Fagaceae using generalized additive models (GAM) and a regression analysis. Then we used a correlation analysis to describe the relationship between environmental factors and the community structure. Our results showed the species diversity index showed a hump-shape trend along the elevation, and the total basal area showed no significant change along the elevation. The richness of Lauraceae and Fagaceae showed a positive correlation with the species diversity, but only the richness of Fagaceae showed a positive correlated with the total basal area. Species diversity was positively correlated with soil total nitrogen and soil organic matter. Species diversity and the total basal area were negatively correlated with the soil pH. In summary, Lauraceae and Fagaceae are correlated for community structure, and this correlation is not affected by elevation. Fagaceae has played a more important role than Lauranceae. This study highlights the impact of dominant plant families on the forest community assembly along the elevational transect.
1. Introduction
Dominant species significantly influence species composition, diversity, ecosystem productivity and soil microbes in terrestrial ecosystems [1,2]. Dominant species determine community structure and ecosystem function through their abundance, height, cover, rhizomes or chemical components and can predict community stability under climate change [3,4,5]. Grime’s mass ratio hypothesis states that ecosystem functioning and stability are determined to an overwhelming extent by the dominant plants [6]. Eckberg et al. found that dominant species reduce the productivity and diversity of non-dominant plants by reducing photosynthetic availability [7], whereas Arnillas et al. [8] suggested that dominant species produce a more stable microclimate environment, reducing environmental stress and thus positively affecting non-dominant plants. Control experiments have shown a significant decrease in the above-ground biomass of the community after the removal of dominant species [9]. The intraspecific variation of dominant species also affects community species richness [10]. The change in dominant plants showed strong consistency in family and genus along elevations, while changes in specific dominant species were more pronounced along elevations [11]. However, we have little knowledge about how dominant plant families change with elevation and the consequences of community assemblage.
Elevation gradient is the best factor for evaluating species’ correspondence to habitat patterns and predicting the effects of environmental change on species diversity [12]. Changes in elevation gradient cause changes in environmental factors, such as temperature, humidity and light, and lead to a series of changes in species composition and diversity along the elevation gradient [13,14]. Due to the elevation gradient, montane forests are a complex ecosystem [15]. Thus, mountains provide a natural research site for studying the response between species diversity and environmental gradients [12].
Species diversity is an important indicator of community structure, plays an important role in the stability and sustainability of ecosystems [16] and significantly affects biodiversity–ecosystem functioning [17]. The study of elevation gradient patterns of species diversity and the main drivers could help us predict the impact of climate change on biodiversity and develop effective biodiversity conservation measures [18]. The distribution pattern of plant species diversity along environmental gradients is one of the topical issues in ecological research [19]. For example, community species diversity can be influenced by environmental factors such as temperature [20], soil [21], and light [22]. Changes in elevation gradient cause changes in environmental factors, such as temperature, humidity and light, and lead to a series of changes in species composition and diversity along the elevation gradient [13,14]. However, it has been shown that the elevational gradient of species diversity has different patterns in different regions that decrease with increasing elevation [23], increase with increasing elevation [24], and have a hump-shape pattern at the highest mid-elevation [25], etc. Whether there is a generalized relationship between species diversity and altitude is unclear [26]. Therefore, the mechanisms and factors influencing the altitudinal gradient pattern of species diversity need to be further investigated in depth.
Another important characteristic of community structure is the total basal area (TBA), the cross-sectional area of a stand at breast height calculated from the diameter at breast height, which is a simple measure widely used by foresters [27]. Basal area is a measure of stand biomass, productivity, carbon storage and dynamics [28]. It can reflect the successional stage, competition response and productive capacity of a plant community, which is also a surrogate for stand characteristics such as biomass and density [29]. Basal area increments can be used to assess tree growth [30]. The basal area is mainly influenced by community succession and the timing of stand growth [31]. The elevational gradient pattern of the basal area also varies in different climatic zones [32,33]. Therefore, understanding the factors influencing TBA is important for forest management.
In a subtropical forest in east Asia, the forest was dominated by some plant families; for instance, Fagaceae and Lauraceae plants are important components of subtropical broadleaf evergreen forests, widely distributed in tropical and subtropical regions [34] and have important ecological and economic values [35,36]. The Lauraceae has many uses, with tall trunks that can be used as garden plants, as well as trunks for timber, branches, leaves and fruits for food, and extracts as raw material for spices [37,38,39]. Fagaceae is one of the important ecological and economic species and is a key taxa group in global forest ecosystems, enriching terrestrial biodiversity [40]. In China, Fagaceae are economically important plants, edible plants and have some medicinal functions [41,42]. In this study, we selected forest plots with different elevation gradients on Daming Mountain to study the elevation gradient pattern of species diversity and the basal area of Daming Mountain and to explore the following scientific questions: (1) how species diversity and basal area change along elevations on Daming Mountain; (2) how environmental factors affect species diversity and TBA; and (3) how Lauraceae and Fagaceae plants impact species diversity and basal area along the elevational transect.
2. Materials and Methods
2.1. Study Area
The Guangxi Daming Mountain Nature Reserve (23°24′ to 23°30′ N, 108°20′ to 108°34′ E) is located in the south-central part of Guangxi. It is a national-level nature reserve with typical zonality, characterized by protecting the subtropical mountain forest ecosystem and cherishing endangered flora and fauna. Daming Mountain belongs to the southern subtropical monsoon climate zone, with an elevation of 115 m to 1760 m and an average elevation of 1200 m. The average annual temperature is 15.1 °C, the hottest temperature recorded is 21.9 °C, the coldest temperature recorded is 5.8 °C and the average annual rainfall is 2630 mm. The distribution of precipitation varies considerably, with June~August accounting for 45.3%~47.5% of annual rainfall, March~May for 23.1%~25.8%, September~November for 14.7%~20.1%, and December-February for 8.4%~10.7%. Soil texture was mainly clay loam and loamy clay with a pH value between 3.9 and 4.7 [43]. The main components of each forest vegetation type on Daming Mountain are those in the Lauraceae and Fagaceae, with warmth-loving species dominating the tree layer at low elevation, such as many kinds of Litsea elongata, Castanopsis hystrix and Machilus decursinervis, etc. As the altitude increases, other constituents in the Lauraceae and Fagaceae gradually increase, as well as those in the Theaceae, Hamamelidaceae, Aquifoliaceae, Symplocaceae and Magnoliaceae.
2.2. Data Sampling
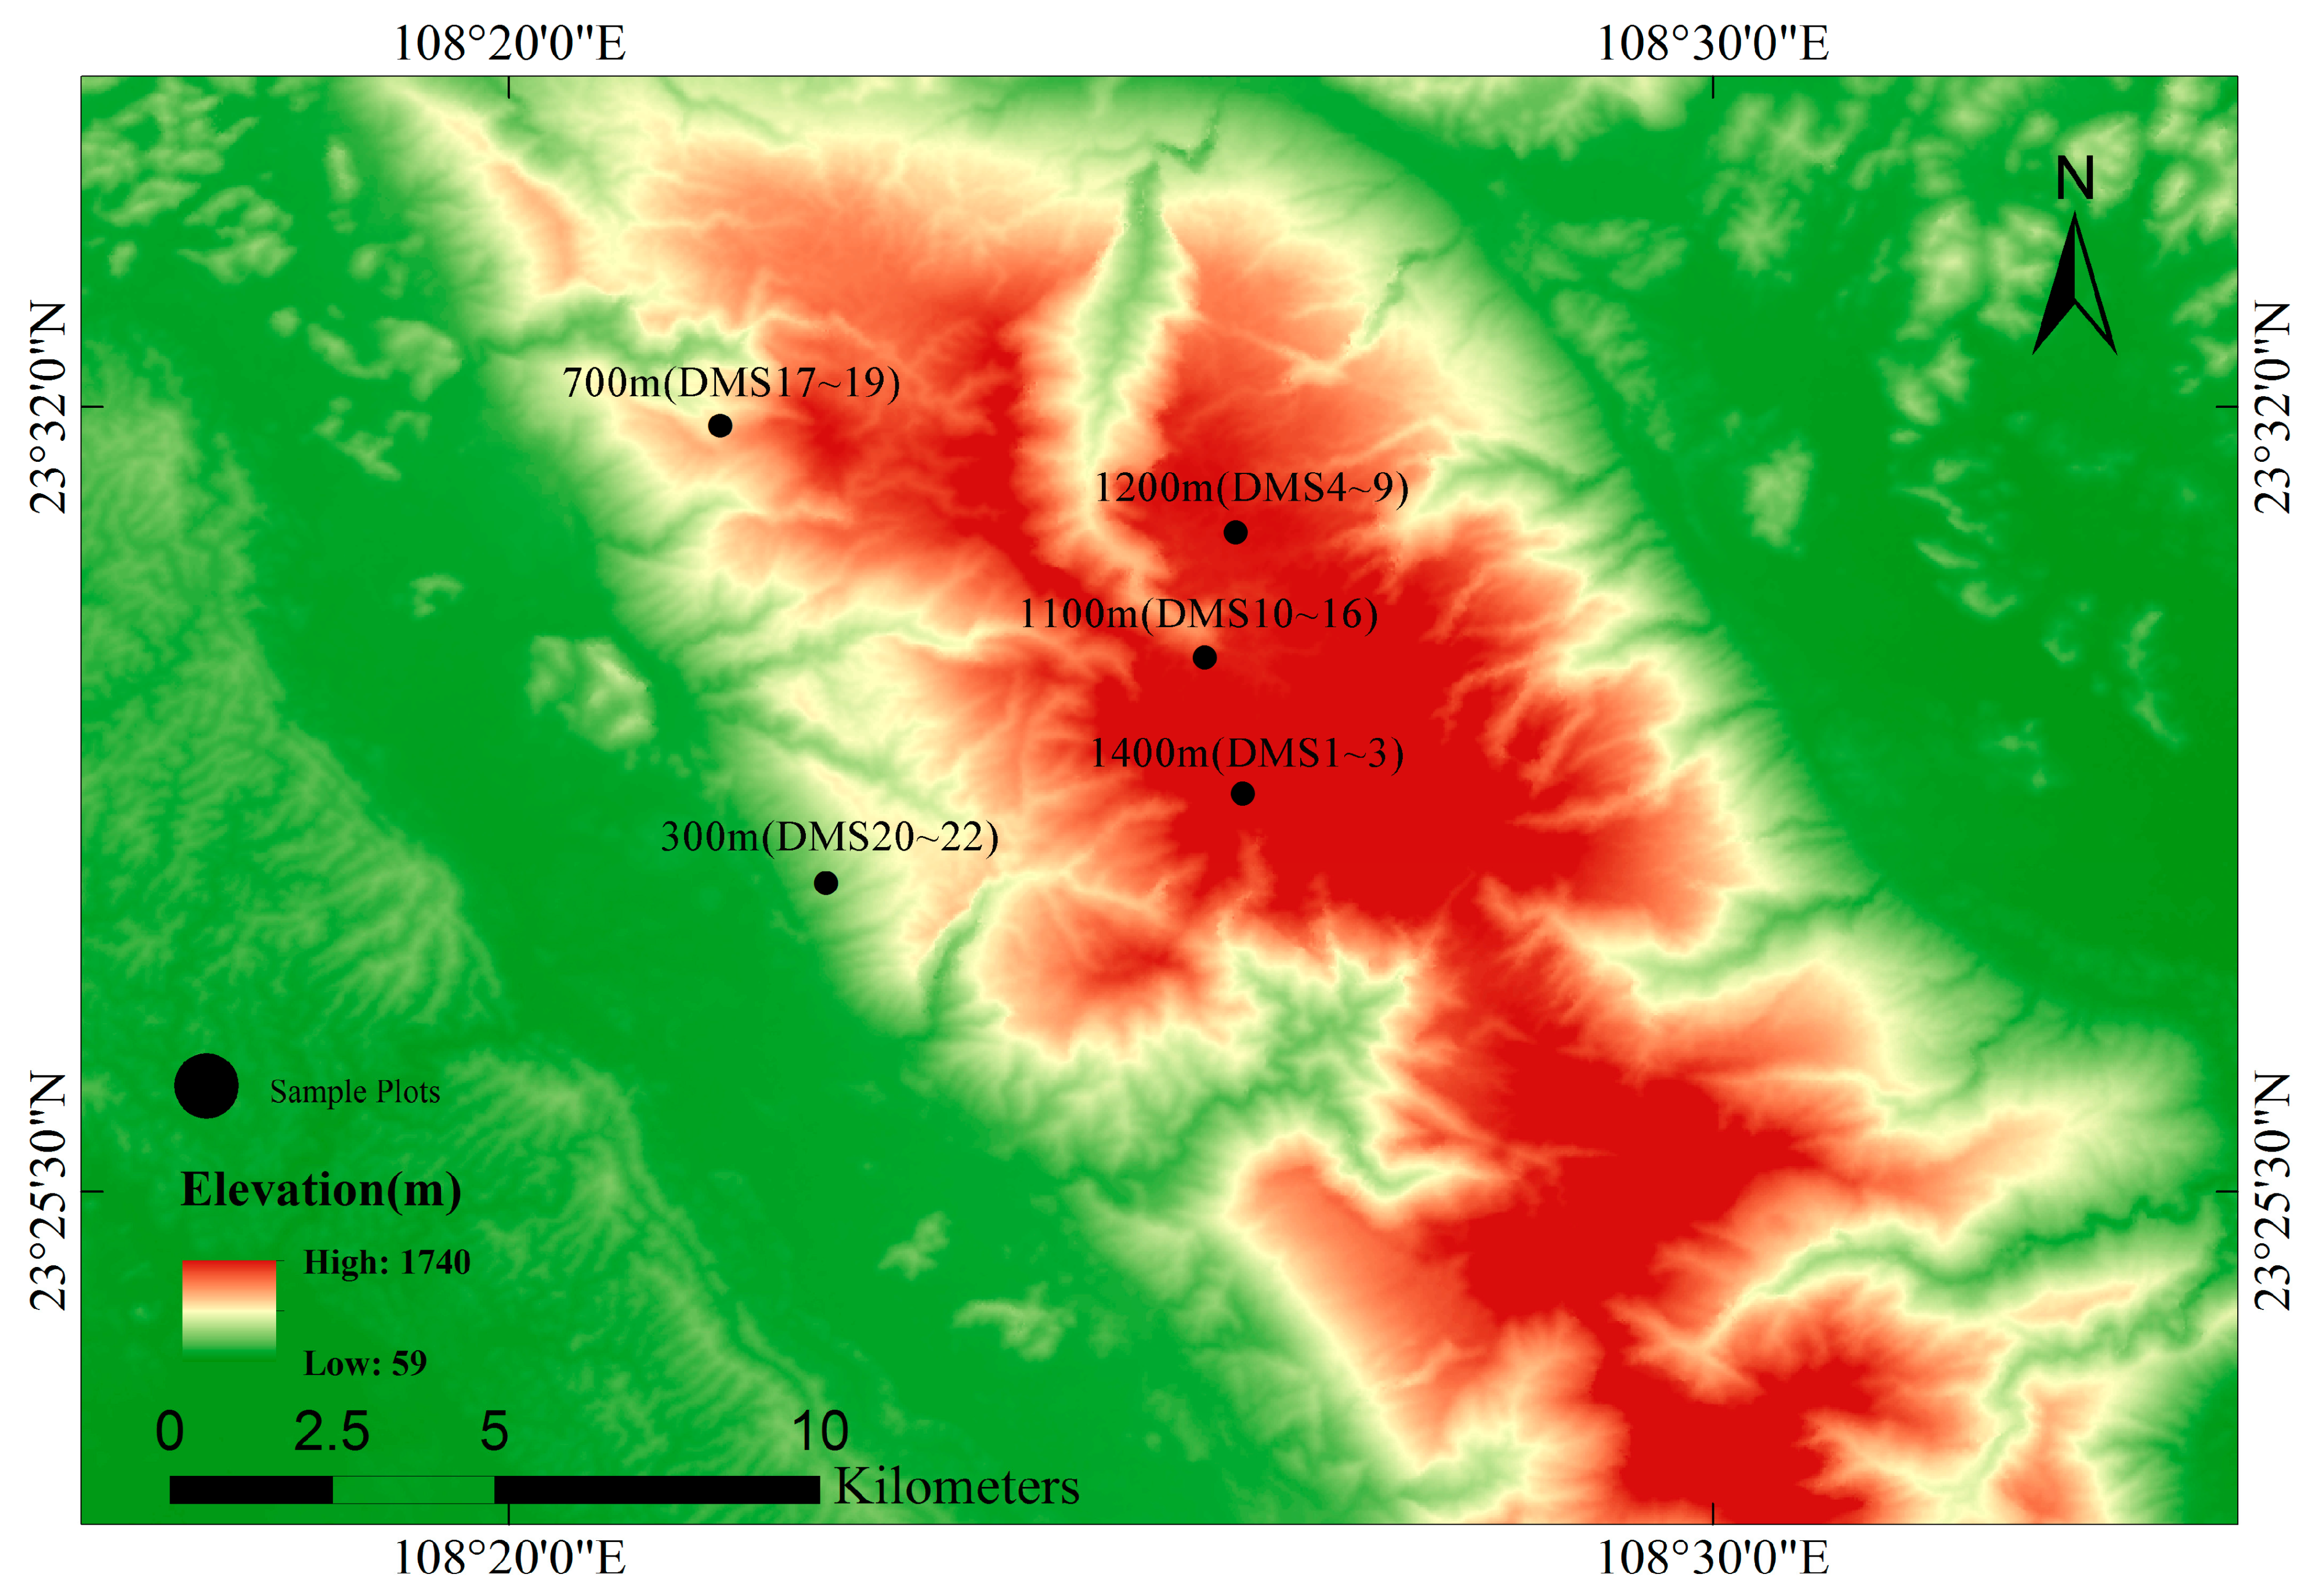
In 2017, 22 plots were established in the study area. Based on the vertical change in vegetation at different elevation gradients on Daming Mountain Nature Reserve, seven monitoring points were set up at 300 m, 700 m, 1100 m, 1200 m, 1300 m and 1400 m (Figure 1), which represent the different elevation gradients of subtropics forests. Each monitoring point was set up with 3–6 quadrats. The sample area was 20 m × 20 m (Table 1). Among them, DMS17~19 were originally illicium verum forest, which were protected for a shorter period of time and received more anthropogenic disturbances than the other sample plots. They were spaced approximately 50 m from each other to maximize the independence of samples. In the last decade, they have been part of a protected area for reasons related to land policy and are currently in the restoration phase. We recorded all individuals with a diameter at breast height greater (DBH) than or equal to 1 m. We measured the DBH and tree height of all individuals using diameter rulers and height measurement stalks. Finally, each individual was marked with a unique number. A camera with a fisheye lens was used to take an image up the center of each 20 × 20 m sample plot. The proportion of gaps in the photographs was calculated by HemiView 2.1.1, and the canopy density of the plots were obtained. We also recorded latitude, longitude and elevation at the center of each sample plot with a handheld GPS. We measured the slope of each plot using a gradiometer at the center of the plot.

Figure 1.
Map of Daming mountain showing the sampling sites along the elevational gradient in the study area.

Table 1.
Basic information about the forest plots.
The species of all trees were identified by a local botanical expert. All species were identified with reference to the list of plant species in China (2022 Edition) (http://www.sp2000.org.cn, accessed on 10 September 2022). All species encountered in the survey area were collected in triplicate and deposited at the College of Forestry, Guangxi University. The species found in this survey are listed in Supplementary Table S1.
We measured soil factors to explore how they affect species diversity and TBA. In August 2017, we collected soil samples at a depth of 0~20 cm at five randomly selected points in each 20 × 20 m plot and thoroughly mixed the samples before analysis. After removing stones and rhizomes from the soil samples, they were air-dried in a ventilated room to a constant weight. The soil pH, soil total nitrogen (TN), soil total phosphorus (TP) and soil total potassium (TK) contents were measured. Soil total nitrogen, soil total phosphorus and soil total potassium were measured using the Kjeldahl distillation method, vanadium molybdenum yellow colorimetric method and flame photometric method, respectively [44]. The pH of each sample was measured in 1:2.5 mixtures of soil and deionized water with a pH meter [45]. Each soil sample was measured three times, and the average value was used. The soil organic matter was measured via a drying method in a tubular furnace [46]. Soil bulk weight was determined using the ring-knife method [47]. We also analyzed the elevation gradient pattern of soil nutrients (Supplementary Figure S1).
2.3. Data Analysis
We calculated the basal area of each individual in the plots according to the formula [48]. The total basal area of each plot is the sum of the basal area of all individuals within that plot (20 × 20 m). In this study, we used the number of species to represent species richness. We recorded the number of species of Lauraceae, the number of species of Fagaceae and the total number of species in each sample plot. Species diversity was characterized using the Shannon–Wiener index and the Simpson index [49]. We used importance value index (IVI) to analyze the dominance of species in the 22 plots [50]. All indices and formulas in this study are listed in Supplementary Table S2.
Data processing and mapping were completed using Origin 2021 and R 4.1.0. The generalized additive models (GAM) were used to fit the elevation gradient pattern of diversity and basal area. GAM was used because it is a semi-parametric approach that permits data to determine the shape of the response curve by applying a smooth spline, allowing the exploration of the shapes of species response curves to environmental gradients [51]. The generalized additive models were realized by the “mgcv” package in R [52]. To explore the relationship between Lauraceae and Fagaceae in relation to species diversity and TBA, we performed regression analyses using the Origin 2021 software.
The relationship between dominant groups and community structure was analyzed using a linear model. The “corrplot” package in R was used to calculate the correlation between environmental factors and species diversity and basal area [53].
Species composition in communities can be affected by elevation [23]. Therefore, we conducted a partial correlation analysis to determine whether and how the Lauraceae and Fagaceae affected communities after removing the elevation factor. We estimated the binary relationship between Lauraceae and Fagaceae and the community by controlling elevation factors and using zero-order correlation and partial correlation (Spearson’s correlation). The 95% confidence interval was calculated using the estimated mean of the correlation coefficients and the standard error. The partial correlation analysis was performed using the “ppcor” R package [54].
3. Results
3.1. The Community Species Composition
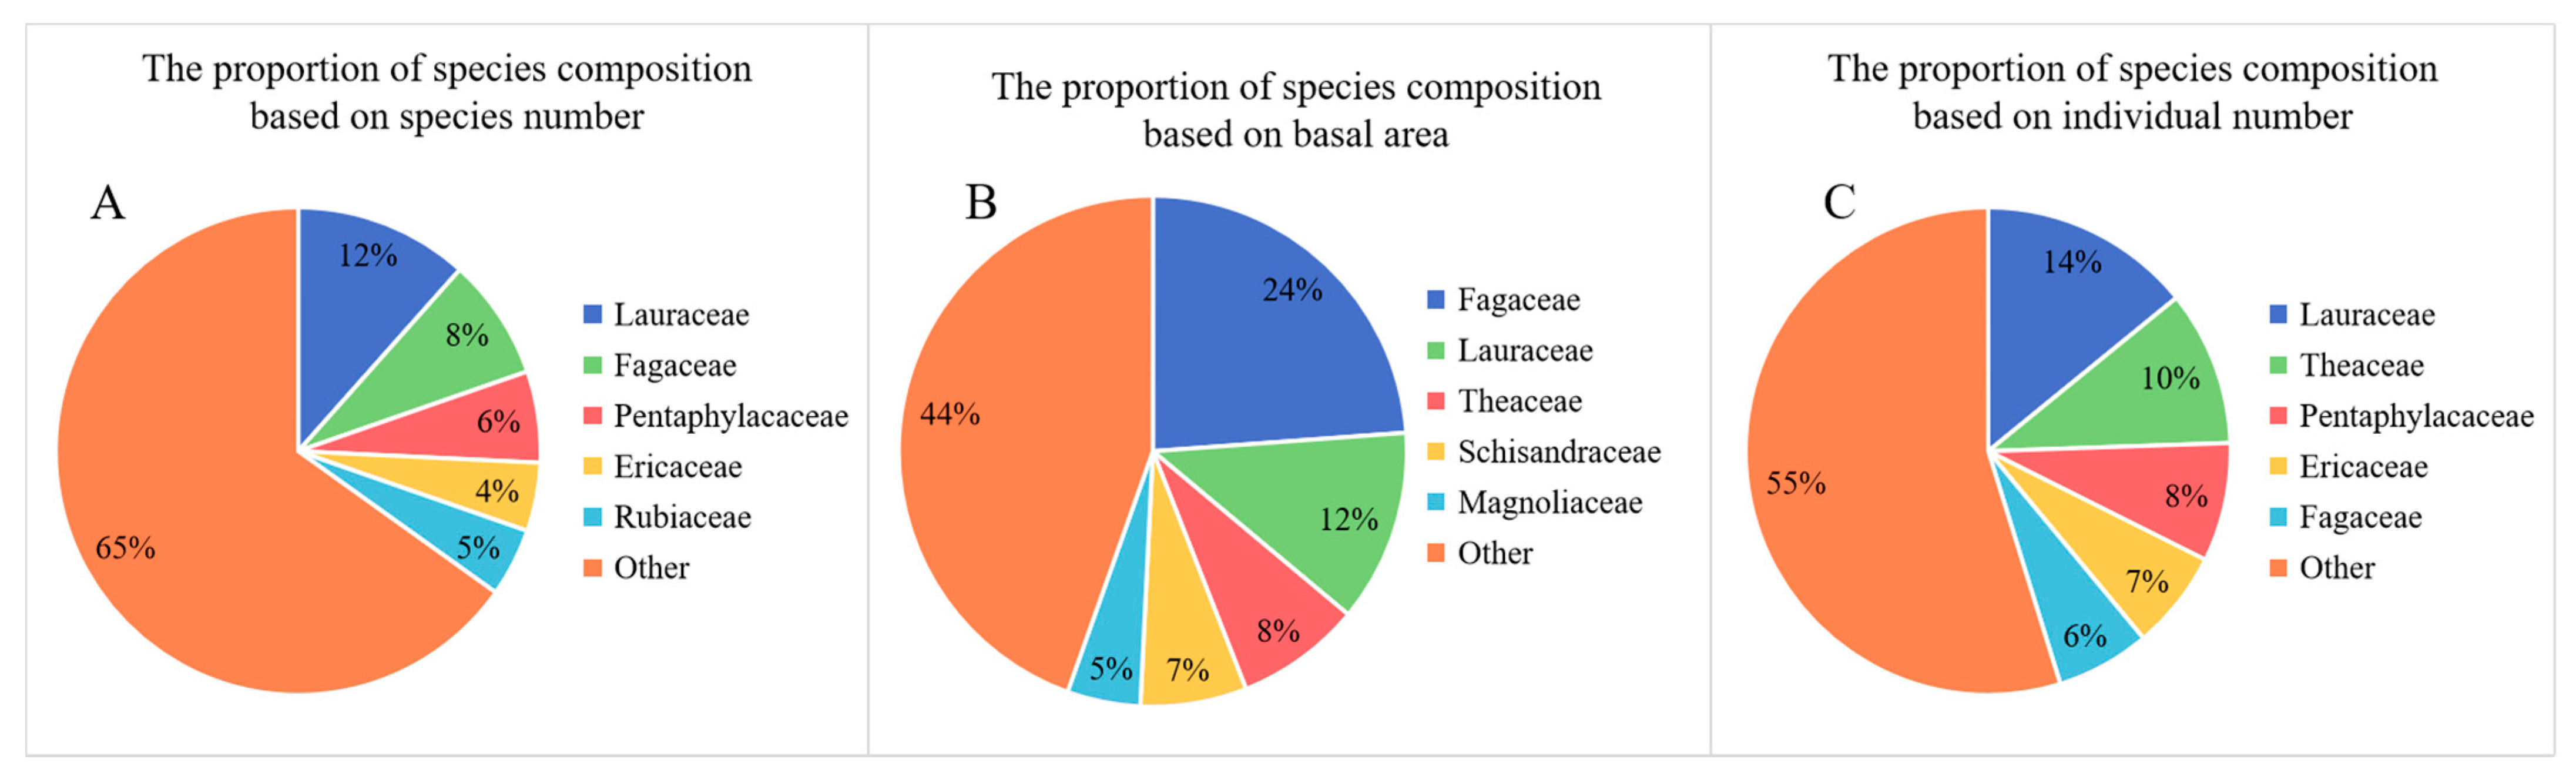
Daming Mountain is rich in species and has a high overall diversity. A total of 198 tree species belonging to 104 genera and 53 families were recorded in the 22 plots. The top three families in terms of number of species were Lauraceae (12%), Fagaceae (8%) and Pentaphylacaceae (6%) (Figure 2). Furthermore, the top three families in terms of individual numbers were Lauraceae (14%), Theaceae (10%) and Pentaphylacaceae (8%). This indicates that these three families are the dominant families in the forest community of Daming Mountain. The Fagaceae (24%) have the largest proportion of the TBA, followed by the Lauraceae (12%) and the Theaceae (8%).
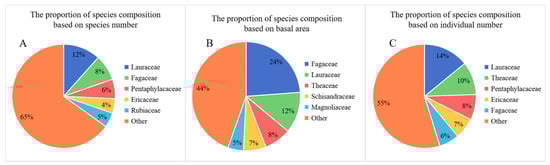
Figure 2.
The proportion of species composition for the dominate family in 22 plots based on (A) number of species; (B) number of individuals; (C) basal area.
The proportion of Lauraceae and Fagaceae in the community increases with an increase in elevation. The proportion of richness of both reaches its highest value at the 1200 m elevation zone (Lauraceae, 14.91%; Fagaceae, 9.65%). The proportion of the richness of Lauraceae is greater than that of Fagaceae in each elevation area. The number of Lauraceae species found in this survey was also greater than that of Fagaceae (Supplementary Table S1). The proportion of the basal area of Lauraceae increased with elevation, while the proportion of the basal area of Fagaceae decreased after reaching its maximum at medium elevation. The maximum proportion of basal area for Fagaceae was found at the 1100 m elevation zone (45.64%), while the maximum for Lauraceae was found at the 1400 m elevation zone (21.40%) (Table 2).
Table 2.
The proportion of species diversity and basal area of Lauraceae and Fagaceae in different elevational zones.
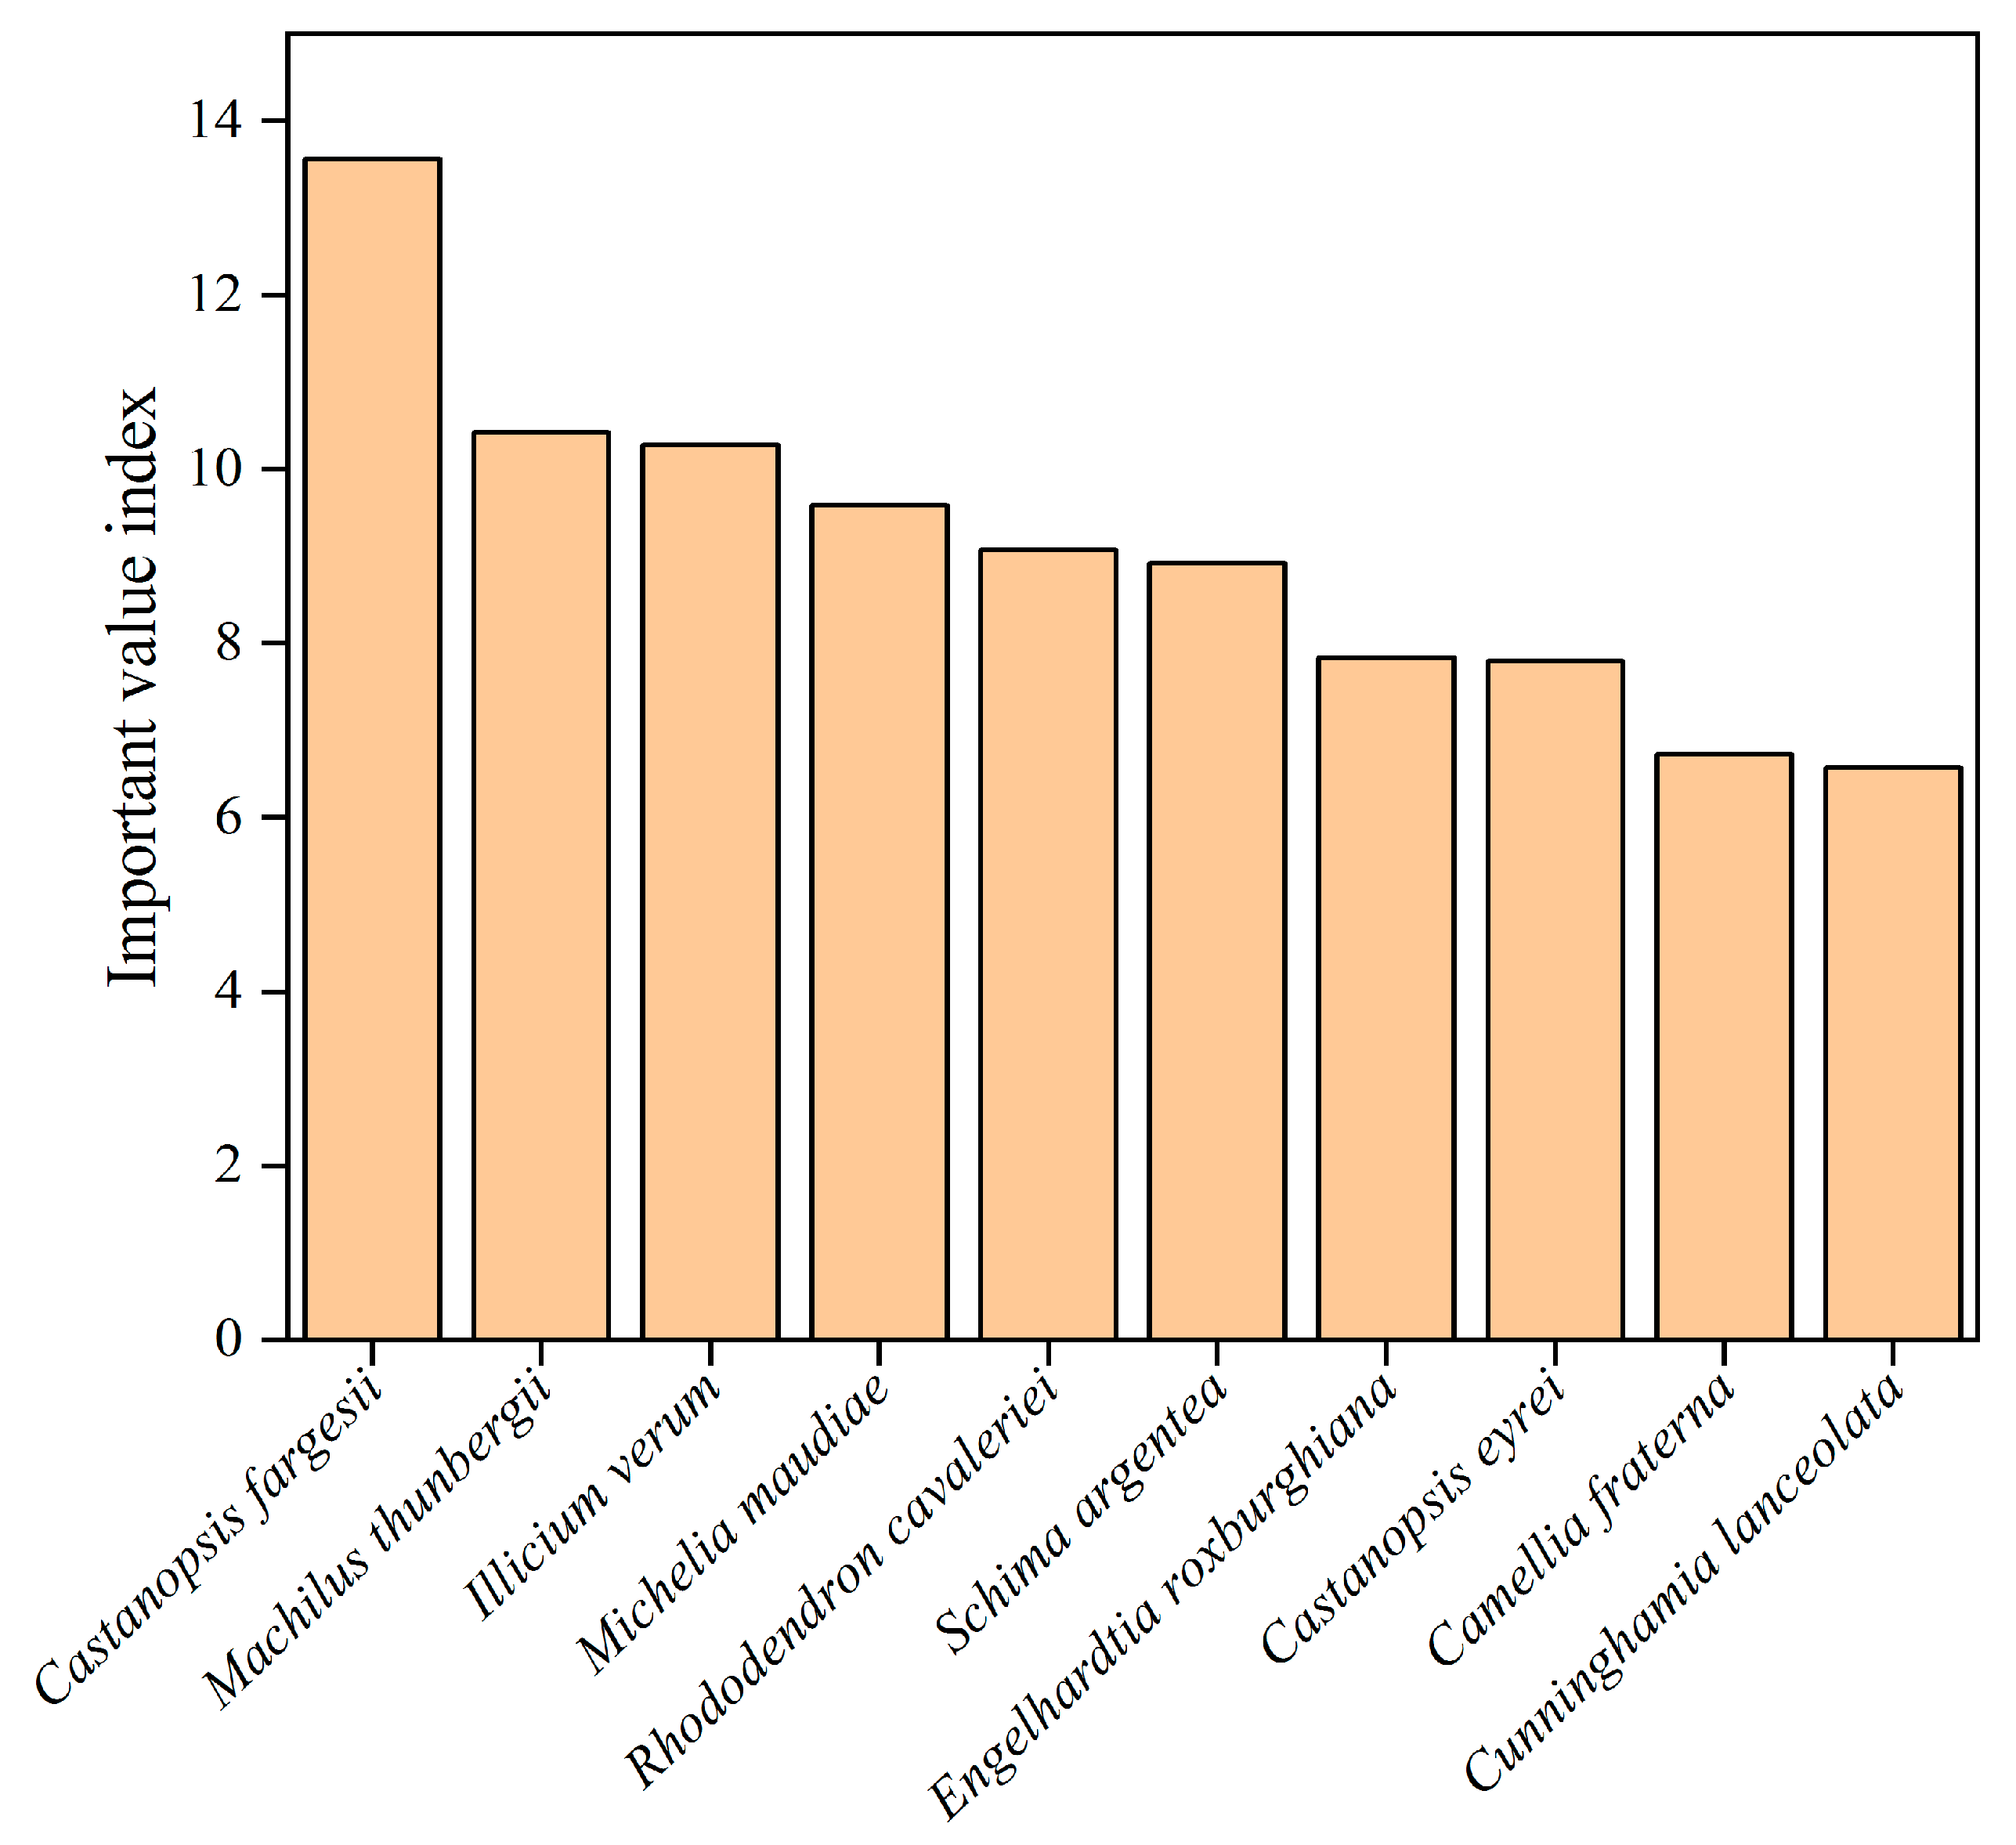
We used the importance value index to assess the dominance and importance of species in the study area. Castanopsis fargesii (13.56) has the highest mean IVI values in the study area, followed by Machilus thunbergii (10.42), Illicium verum (10.28), Michelia maudiae (9.59), Rhododendron cavaleriei (9.08), Schima argentea (8.92), Engelhardtia roxburghiana (7.84), Castanopsis eyrei (7.80), Camellia fraterna (6.73) and Cunninghamia lanceolata (6.57) (Figure 3).

Figure 3.
The species with the top 10 IVI on Daming Mountain.
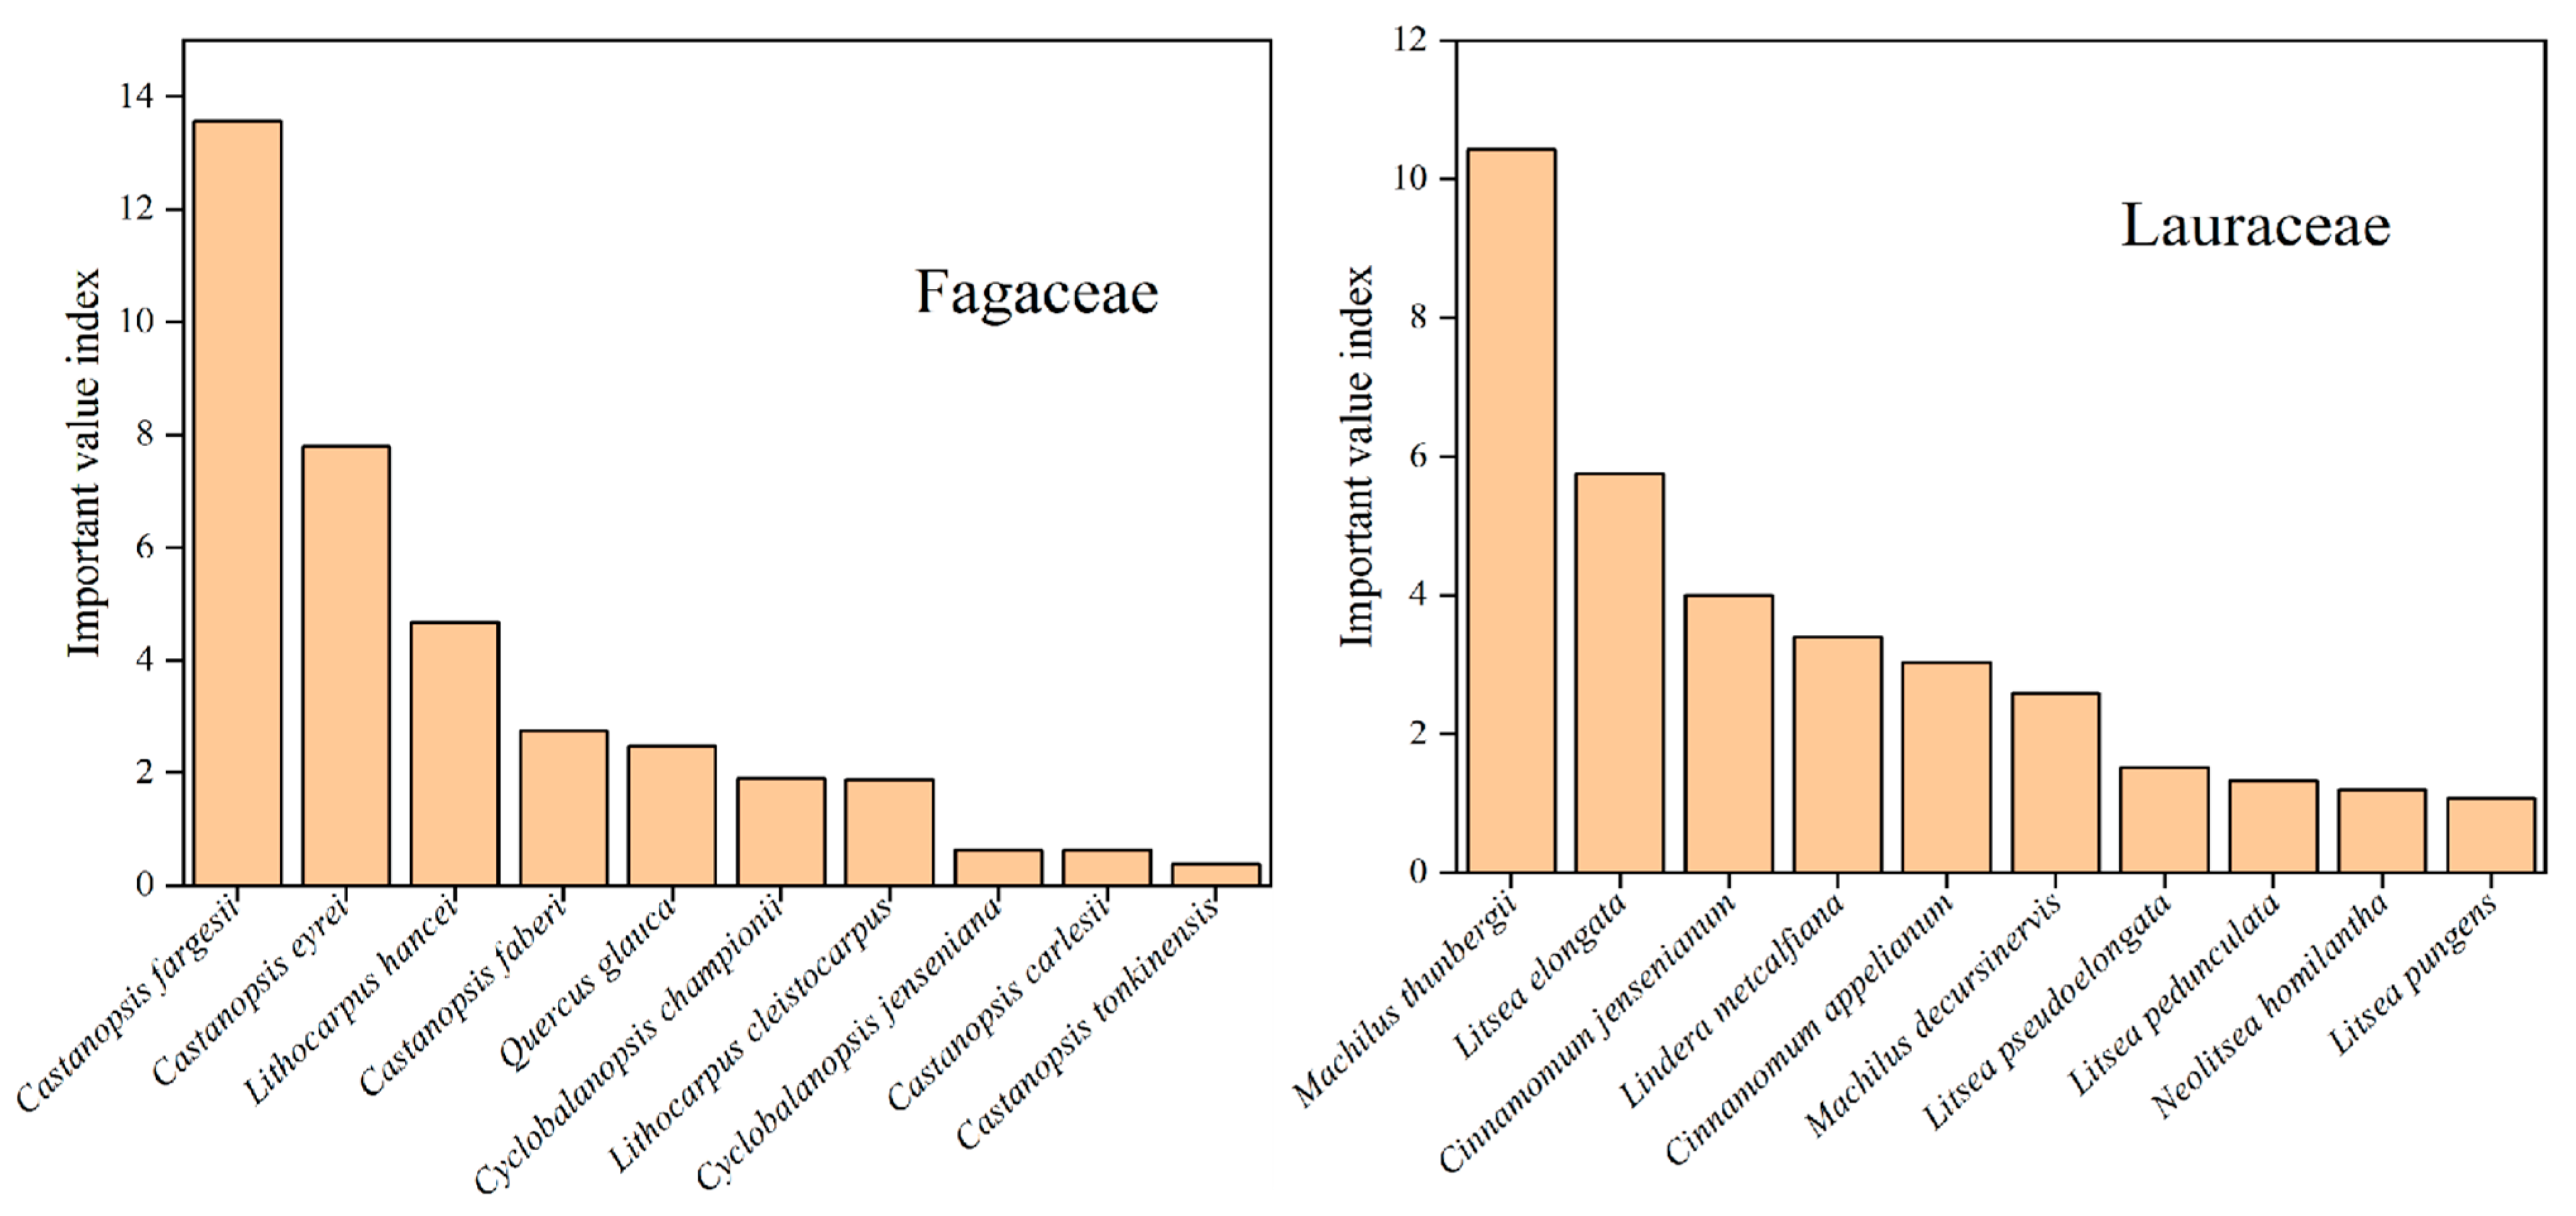
We also analyzed IVI for Lauraceae and Fagaceae on Daming Mountain (Figure 4). In the present study, it was found that the Lauraceae and Fagaceae with the highest IVI were Machilus thunbergii (10.42) and Castanopsis fargesii (13.56), respectively. Lauraceae and Fagaceae accounted for 13.33% and 12.55% of the total importance values in the study area, respectively (Supplementary Table S1). This suggests that both are important taxa in the study area.
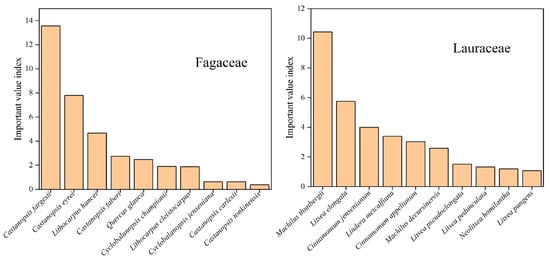
Figure 4.
The species of Lauraceae and Fagaceae with higher IVI on Daming Mountain.
3.2. Species Diversity and Basal Area of Different Elevation Communities
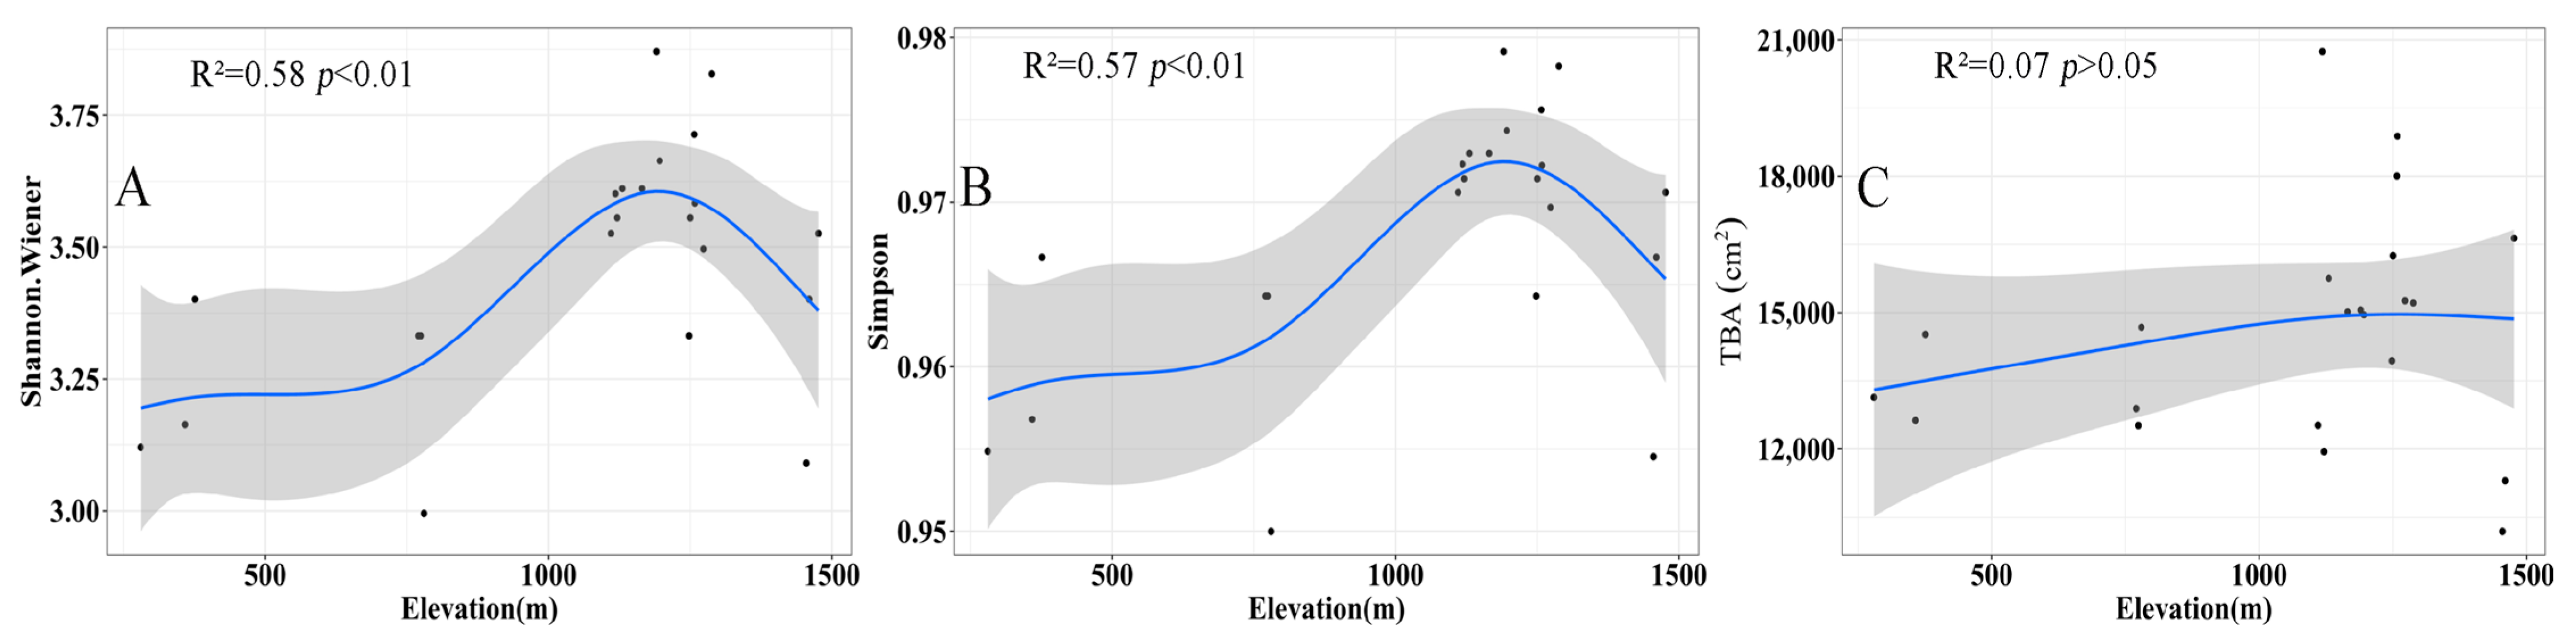
Along the elevation gradient, the Shannon–Wiener index and Simpson index show a hump-shape trend (Figure 5, R2 = 0.58, p < 0.01; R2 = 0.57, p < 0.01). Species diversity increases monotonically from 300 to 1100 m. It peaks at 1100 m and then descends along 1400 m. On the other hand, no significant difference existed in the TBA in different elevation areas (R2 = 0.07, p > 0.05).
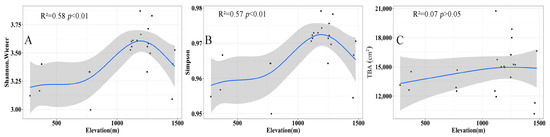
Figure 5.
The change in Shannon–Wiener index (A), Simpson index (B) and total basal area (cm2) (C) with the elevational gradient. In the figure, the black dots are actual measured values, the blue line is the fitted value and the shading is the 95% confidence interval.
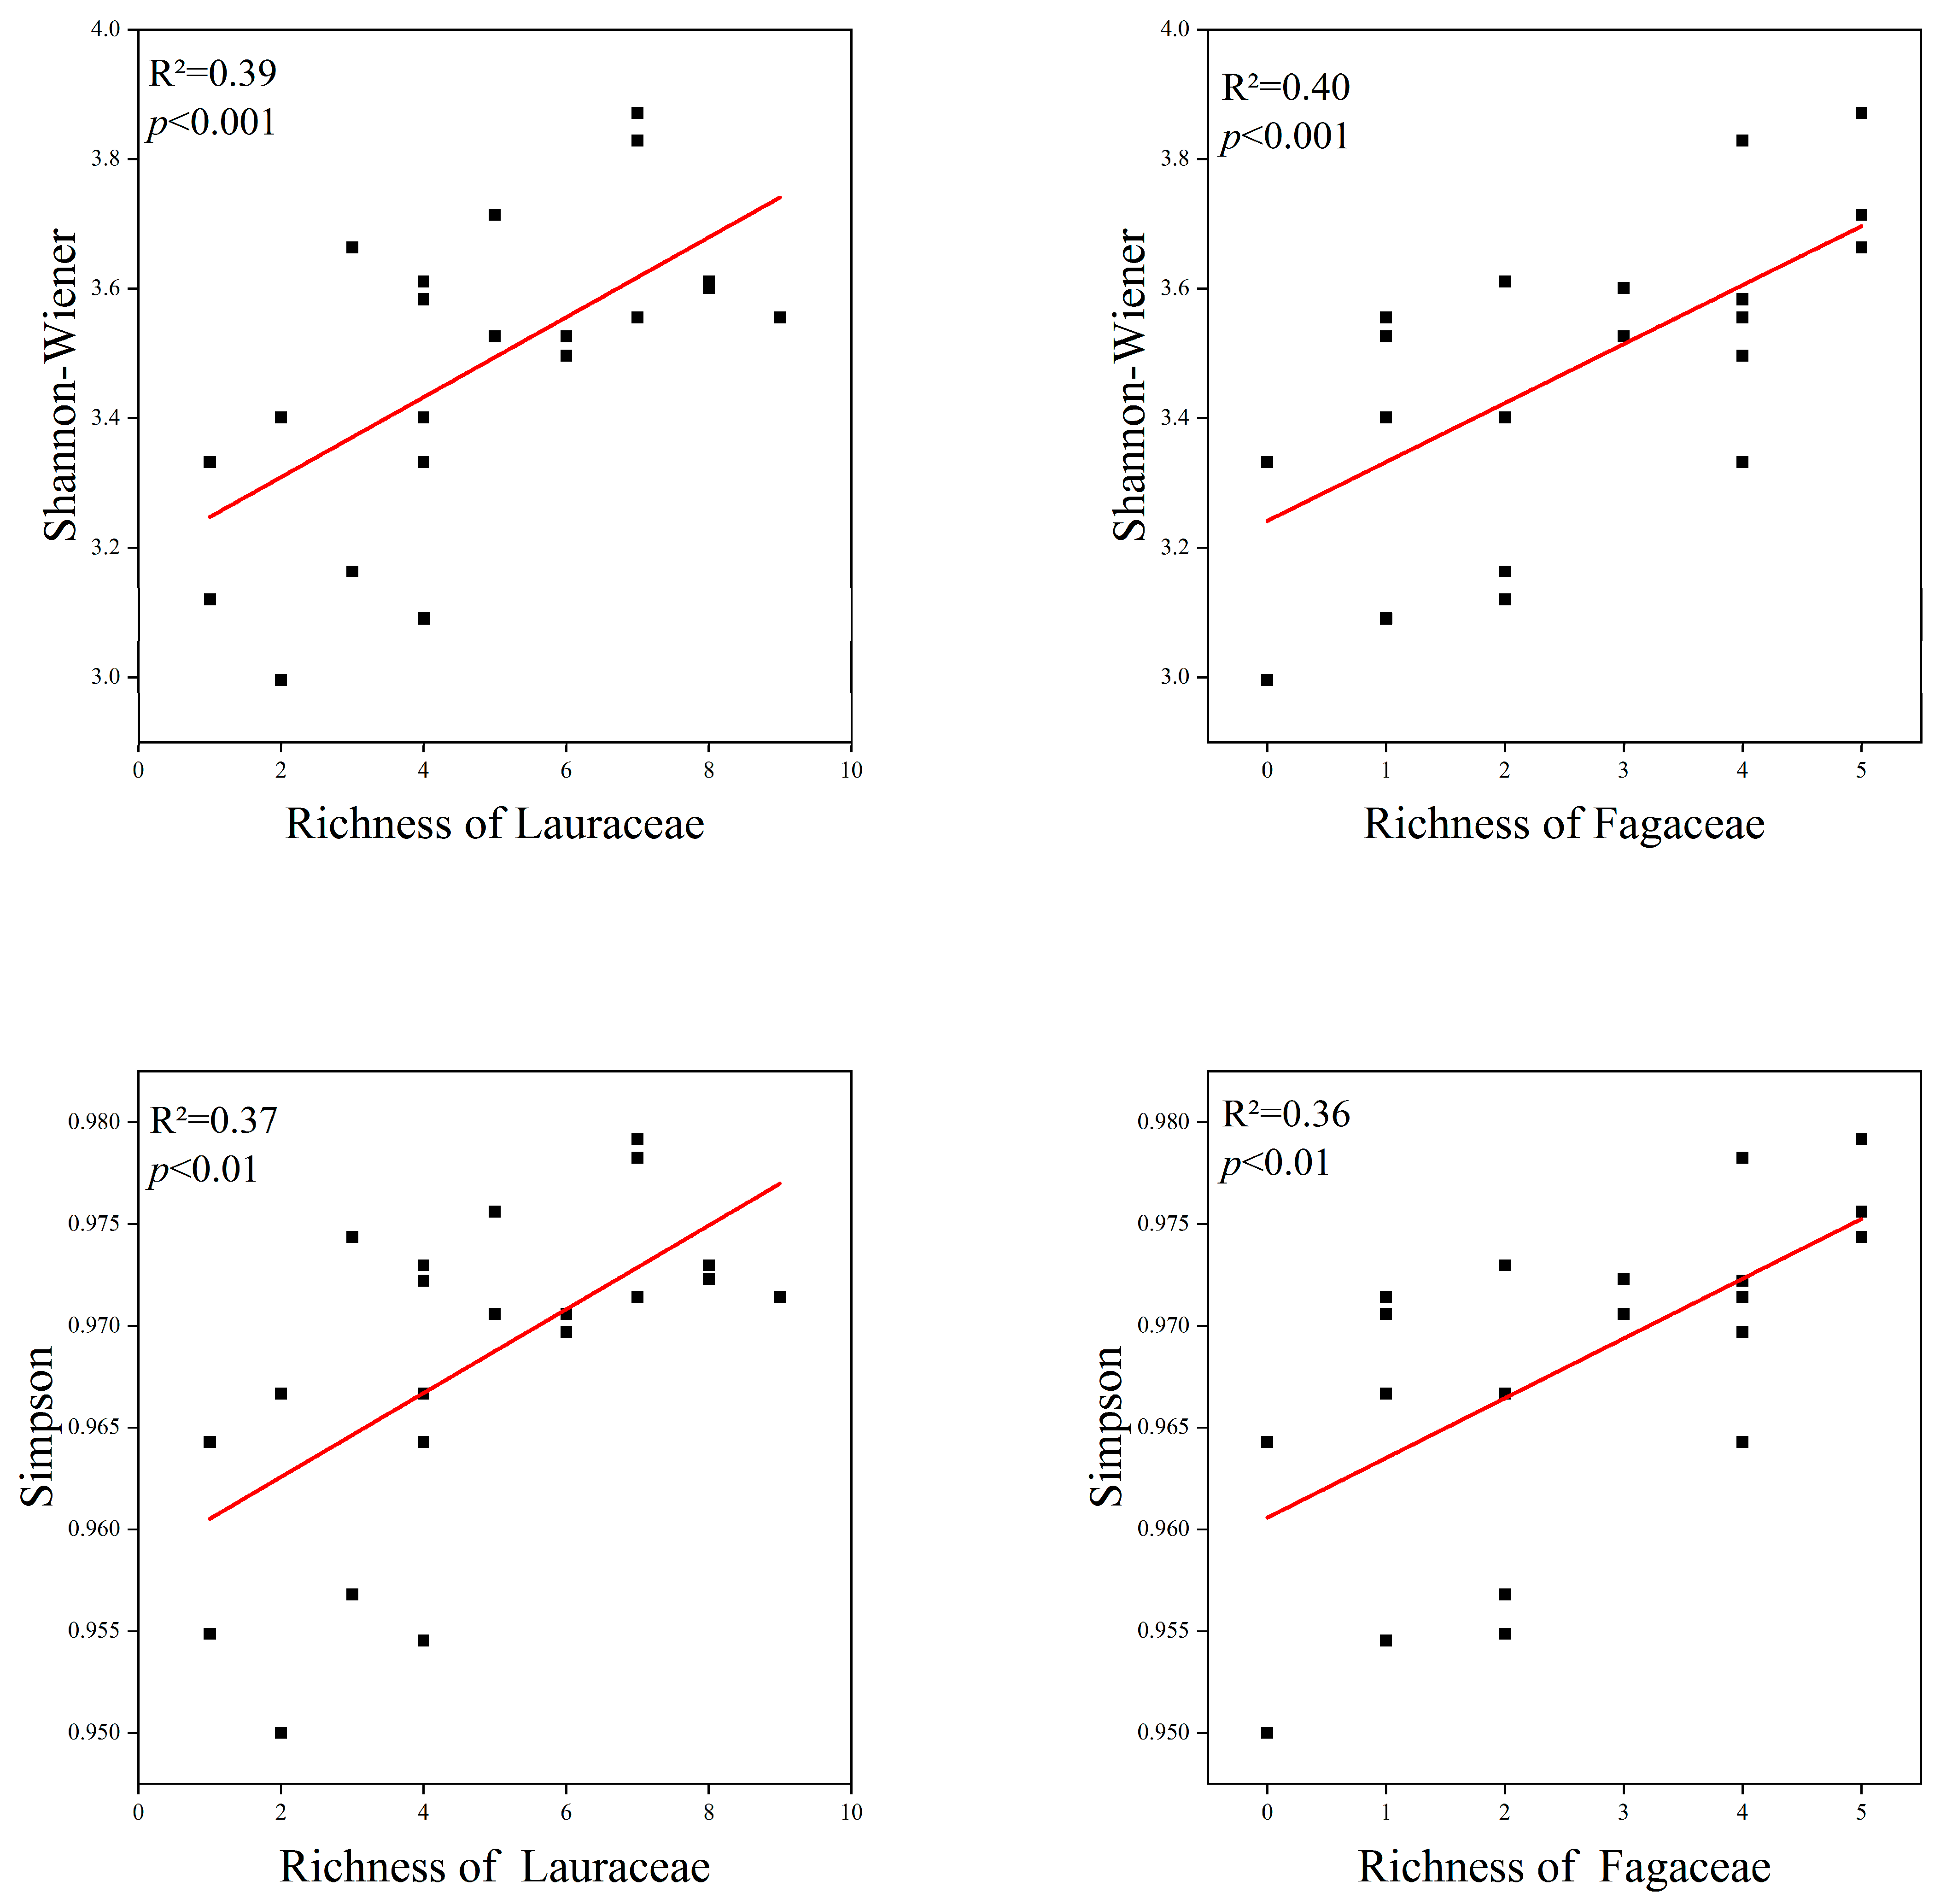
3.3. Relationship between Lauraceae, Fagaceae and Species Diversity
The species diversity is correlated with the Lauraceae and Fagaceae. The species richness of Lauraceae and Fagaceae showed a significant positive correlation with the species diversity of the communities. The Shannon–Wiener index and Simpson index showed similar trends. There was no significant difference in the correlation of Lauraceae and Fagaceae with species diversity (Figure 6).
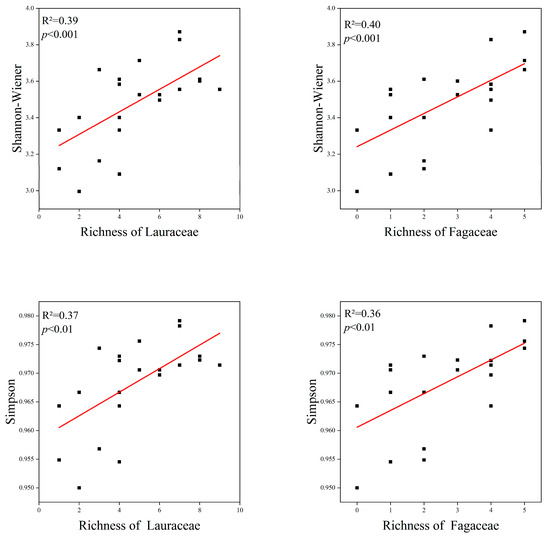
Figure 6.
Relationship between Lauraceae, Fagaceae and species diversity. The red lines depicts the regression model.
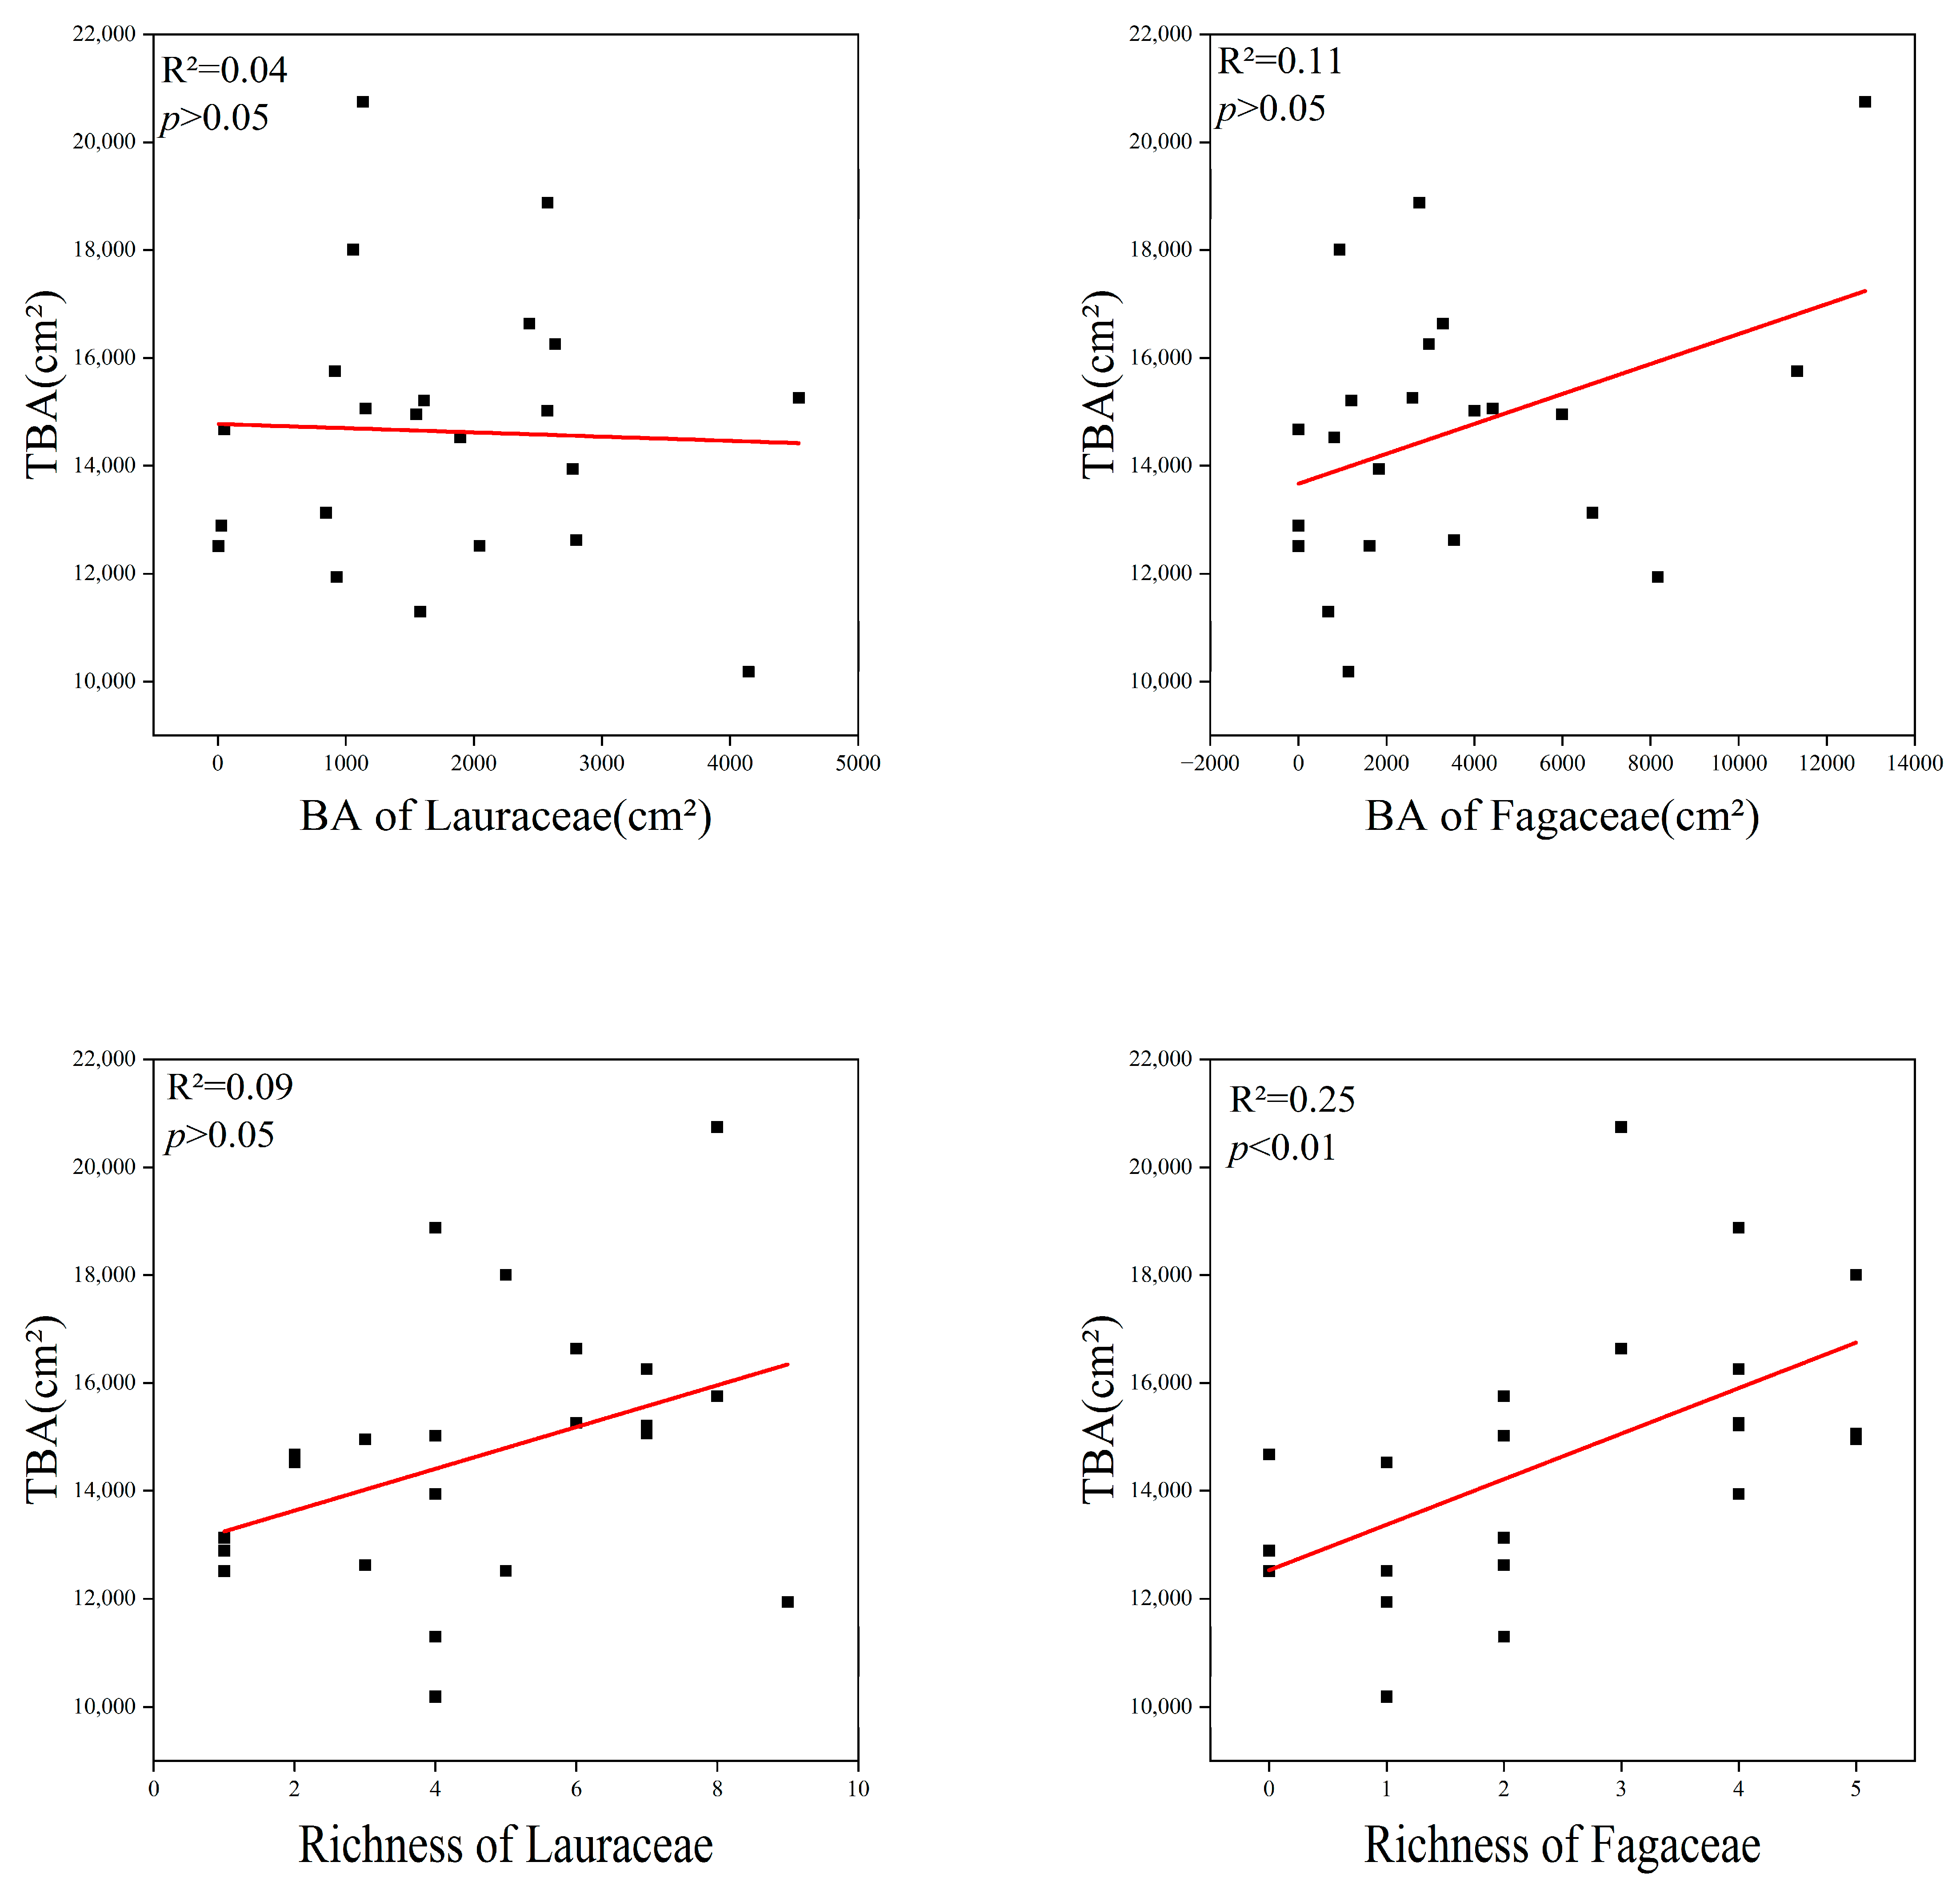
3.4. Relationship between Lauraceae, Fagaceae and TBA
The richness (R2 = 0.25, p < 0.01) of Fagaceae had a significant positive linear relationship with the TBA in the communities. This proves that Fagaceae species are the main contributors to TBA. However, there was no correlation between the sum of species numbers and the basal area of Lauraceae and the TBA of the communities (Figure 7).
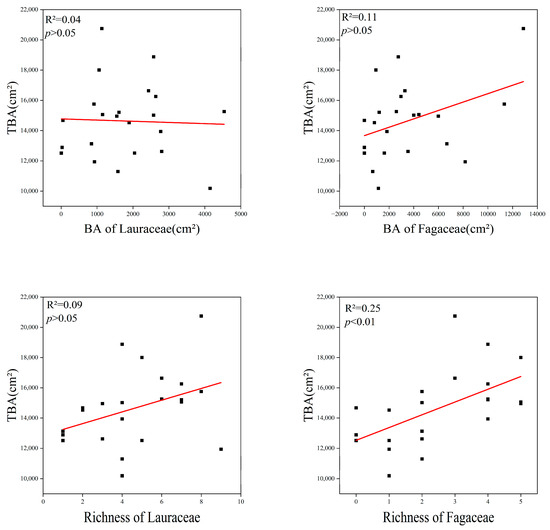
Figure 7.
Relationship between Lauraceae, Fagaceae and total basal area, TBA = total basal area; BA = basal area. The red lines depicts the regression model.
3.5. Influence of Plant Factors on Species Diversity and TBA
According to the partial correlation analysis, Lauraceae and Fagaceae were still able to exert a stabilizing influence on the community after removing the elevation factors (Figure 8). The positive correlation between the richness of Lauraceae and the richness of Fagaceae with species diversity (the zero-order correlation with Spearson’s r = 0.64 and 0.67, p < 0.01) was slightly decreased (r = 0.57 and 0.61) after removing the effect of elevation factors, but the correlation between FBA (r = 0.43, p < 0.05) and species diversity increased (r = 0.49). Furthermore, the positive correlation between the richness of Lauraceae with TBA (r = 0.45, p < 0.05) was no longer significantly correlated (r = 0.35, p < 0.05) after removing the effect of elevation factors. However, the richness of Fagaceae (r = 0.64, p < 0.01) remained significantly positively correlated with TBA (r = 0.60).
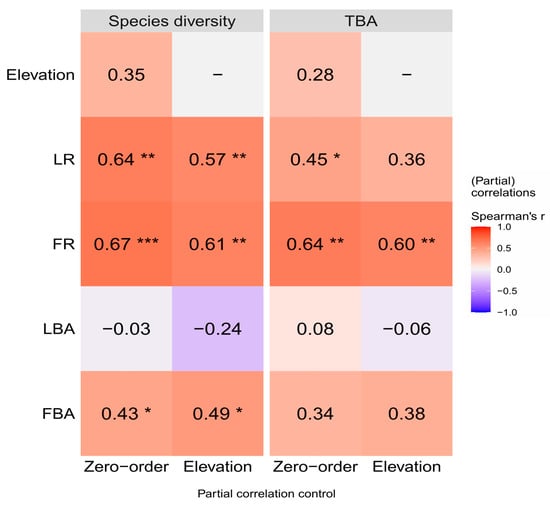
Figure 8.
Partial correlations (Spearson’s r) between Species diversity, TBA and the plant index on Daming Mountain. The intensity of colors and numbers indicate the strength of the correlation. Significant levels are *: p < 0.05, **: p < 0.01 and ***: p < 0.001. Species diversity, the Shannon–Wiener index; TBA, total basal area; LR, richness of Lauraceae; FR, richness of Fagaceae; LBA, total basal area of Lauraceae; FBA, total basal area of Fagaceae.
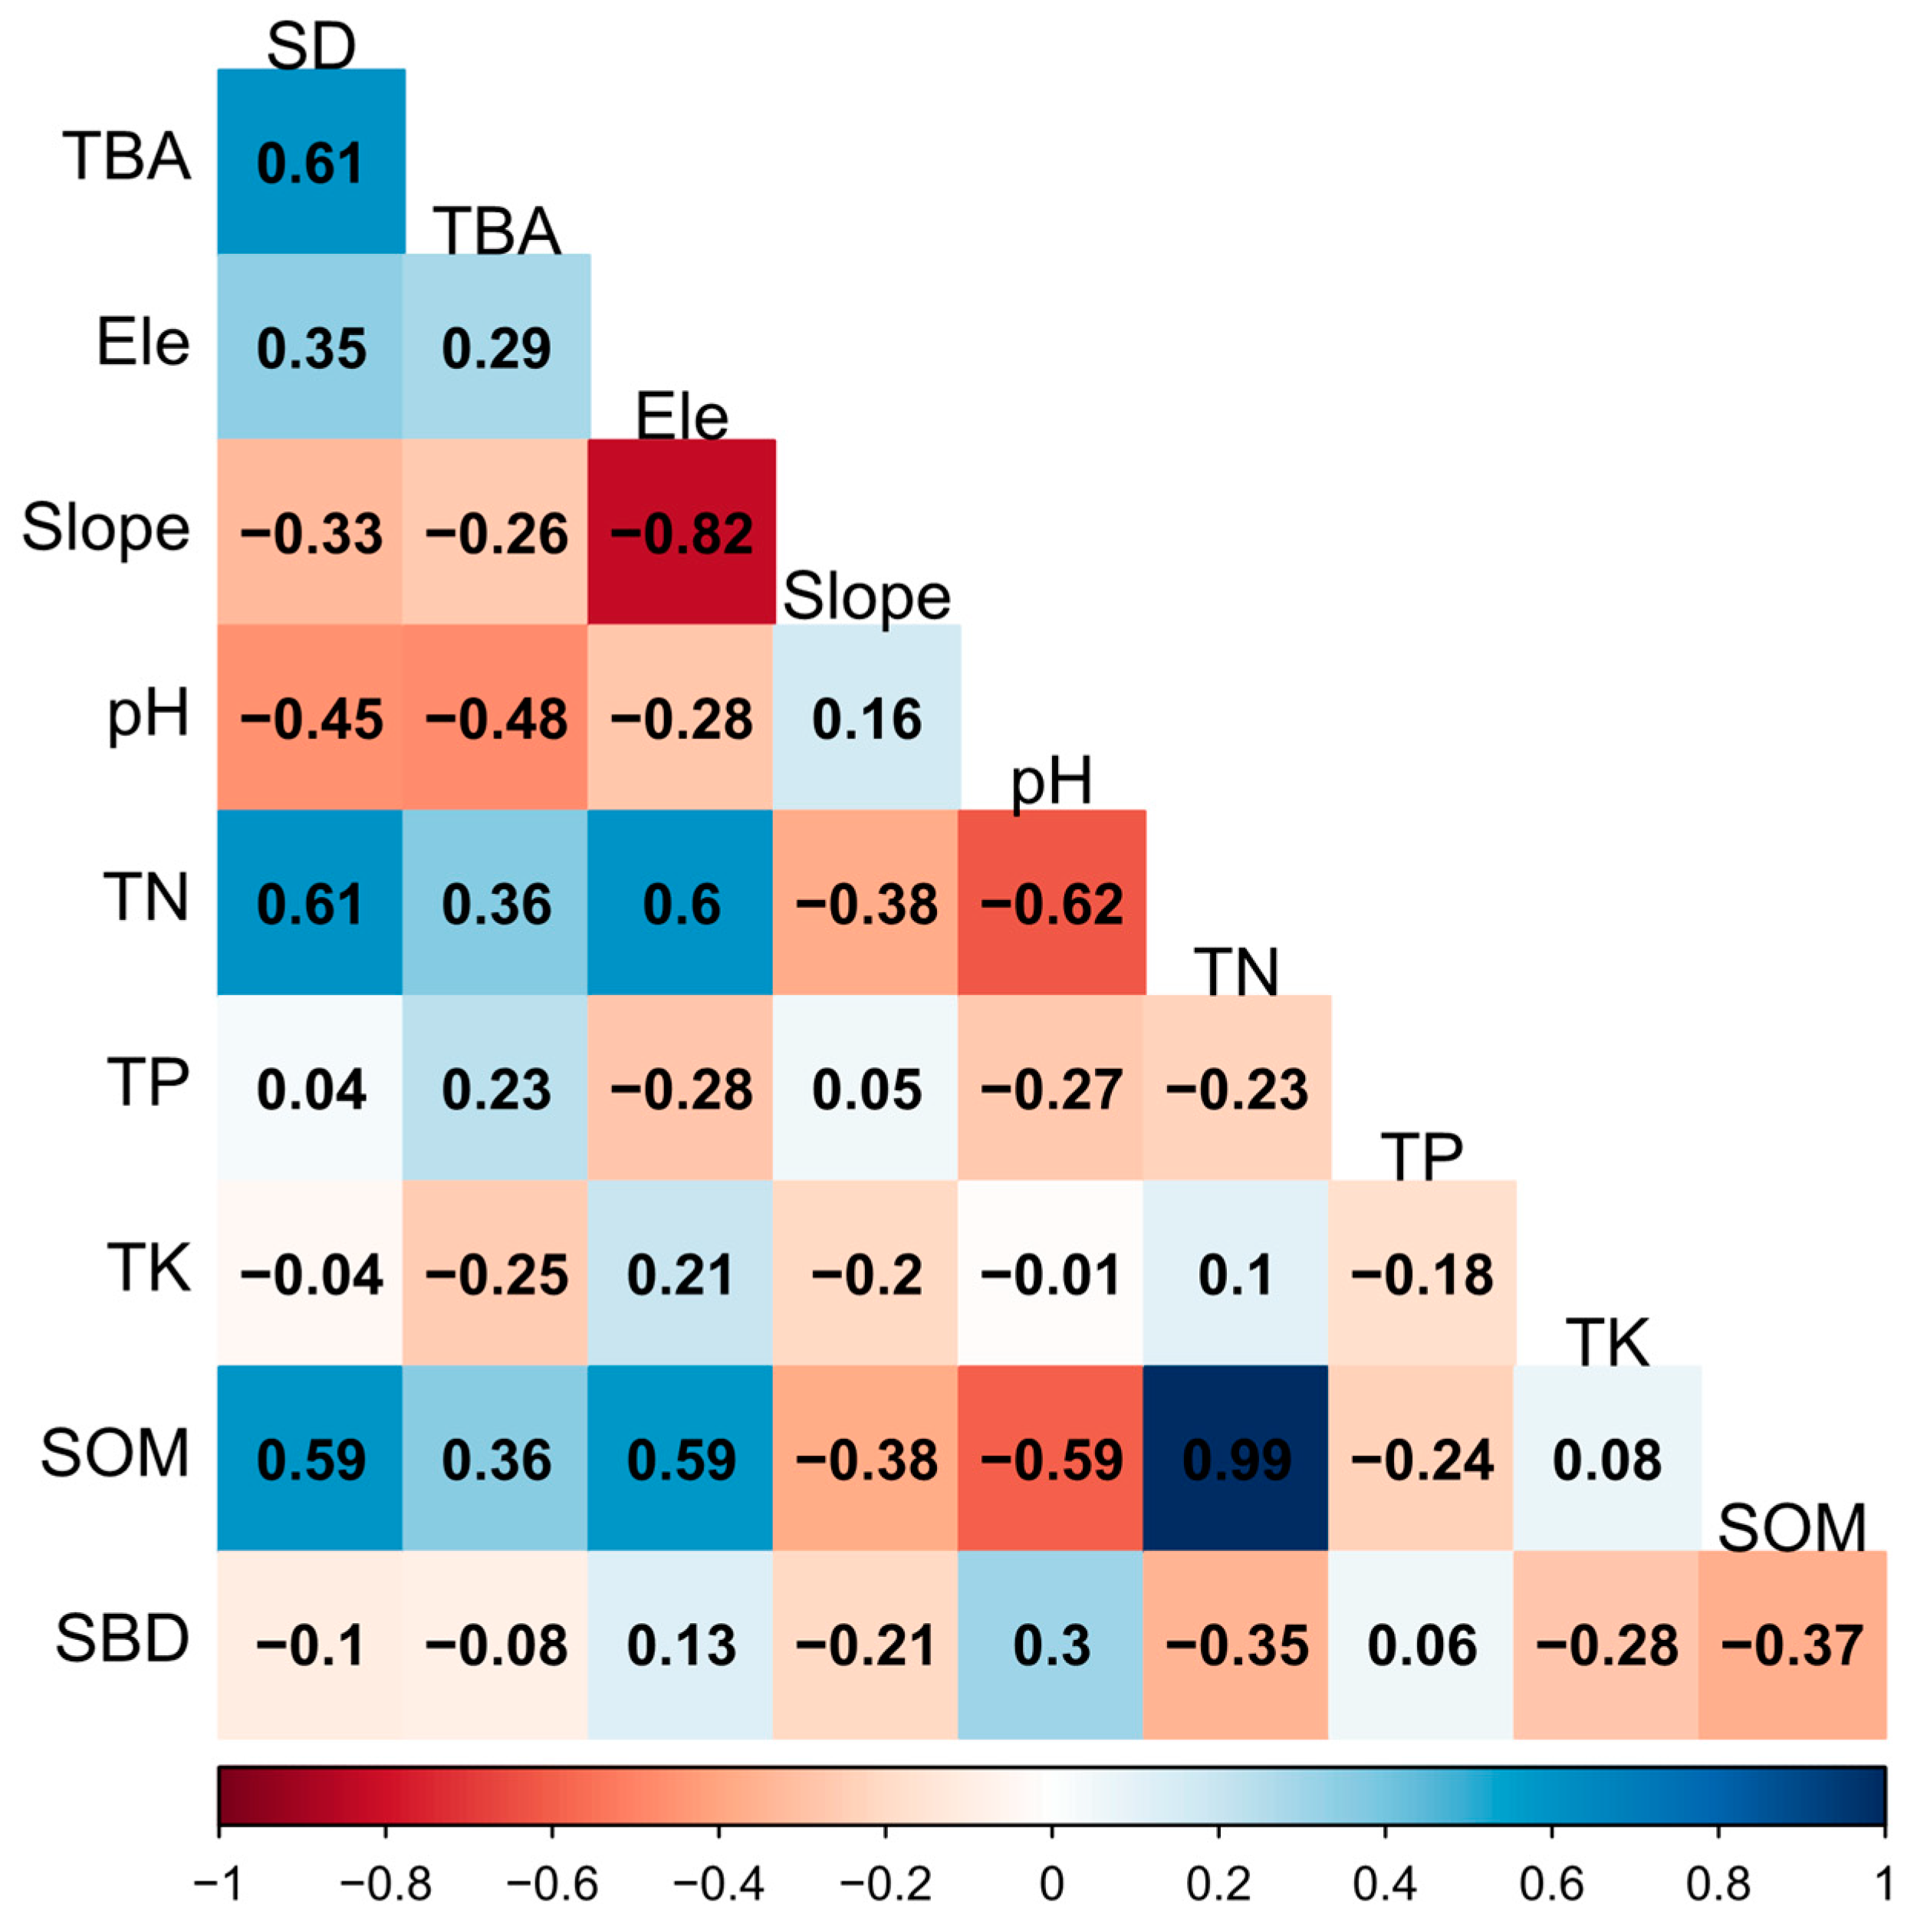
3.6. Relationship between Species Diversity, TBA and Environmental Factors
We analyzed the relationship between species diversity and TBA with environmental factors using a Spearman correlation analysis (Figure 9). The species diversity was significantly positively correlated with soil total nitrogen and soil organic matter. The TBA was significantly negatively correlated with soil pH and had no significant relationship with any other environmental factor. Meanwhile, it can be seen that species diversity and TBA had a significant positively correlation.
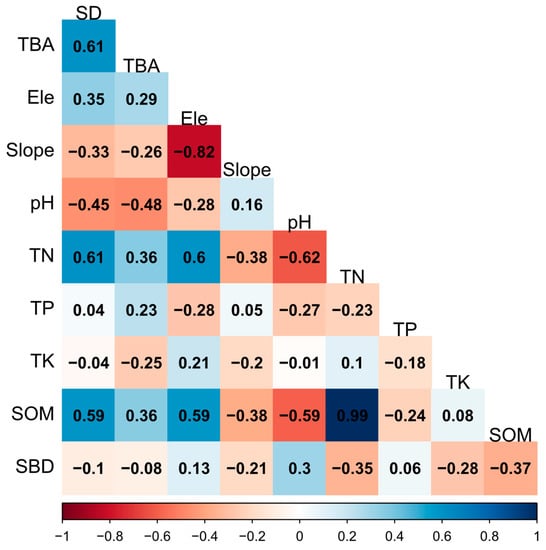
Figure 9.
The Spearman correlation analysis results among the species diversity and the total basal area with elevation and environmental factors. Positive correlations are shown in blue, while negative correlations are represented by red. The correlation coefficients are proportional to the color intensity. TBA, total basal area; SD, species diversity, here we use the Shannon–Wiener Index; pH, soil pH; TK, soil total potassium; TN, soil total nitrogen; TP, soil total phosphorus; SOM, soil organic matter; SBD, soil bulk weight; Ele, elevation; Slope, slope of the center of the plot.
4. Discussion
4.1. Response of Community Structure to Dominate Plant Families
Lauraceae and Fagaceae showed a significant positive correlation with species diversity. This may be due to the high diversity of Lauraceae and Fagaceae on Daming Mountain [55]. In this study, we found a total of 25 species of Lauraceae belonging to 6 genera and 16 species of Fagaceae belonging to 3 genera (Supplementary Table S1). This is one of the reasons for the correlation of the Lauraceae and Fagaceae with species diversity. We analyzed the effect of elevational gradient on the abundance of Lauraceae and Fagaceae (Supplementary Figure S2) and found the same trend as for species diversity. This also proves their correlation. This result may be caused by the high rainfall on Daming Mountain at mid-elevation [56]. Both Lauraceae and Fagaceae have high diversity in humid and warm environments [57,58]. Our result was in line with Kamimura et al., who showed that the number of individuals in Lauraceae was positively correlated with community richness [59]. This suggests that species diversity on Daming Mountain is affected by the Lauraceae and Fagaceae.
Fagaceae is a major contributor to basal area in subtropical forests [60]. This is consistent with our results. The specific ecological traits that favor adaptation to cool montane habitats and the long evolutionary history may have led to the unique importance in terms of biomass of Fagaceae [61]. Moreover, some Fagaceae species have high seed yields, high germination capacity and fast growth rates that drive the production of more biomass [62].
4.2. Response of Community Structure to Elevation
Elevation plays an important role in driving the spatial distribution of plants [63]. In this study, species diversity had a hump-shaped trend with elevation, showing a peak at 1100 m. The hump-shaped distribution in species richness is the most commonly observed pattern in many taxa of various ecosystems. Species diversity tends to rise with increasing elevation, reaching a maximum at medium elevation and then declining with increasing elevation [64]. The hump-shaped species diversity patterns have been found in other regions, such as on Dhauladhar mountain [25], Bolivian Andes [26] and Mount Kenya [65]. The elevational gradients in species diversity result from a combination of ecological and evolutionary processes rather than the presumed independent effects of one overriding force [66]. The higher diversity of plants recorded at mid-elevation is likely due to the optimum climatic conditions that allow many species to coexist [67]. Probably the most important climatic factors determining species distributions in mountains are water availability and temperature [68]. For example, in the Himalayas, a survey found that temperature and water availability are the main drivers of plant species diversity patterns at different elevations [69]. Extreme weather, such as low temperatures, can occur at high elevations, which affects the survival of species [70]. Water availability can also determine species diversity [71]. Precipitation is higher in the middle elevation zones of Daming Mountain than in the lower and higher elevation zones [56]. High precipitation means high water utilization, which increases the length of the growing season and promotes plant growth, survival and renewal, thus increasing species diversity [72]. The greater susceptibility of lower elevations to perceived disturbance also contributes to their lower species diversity [12]. The mid-domain effect (MDE) may be another reason for the hump-like elevation gradient pattern of species diversity [73,74]. The mid-domain effect is the increasing overlap of species ranges toward the center of a shared geographic domain due to geometric boundary constraints in relation to the distribution of species range sizes and midpoints [73]. Previous studies have shown that the MDE was a robust predictor of observed species diversity and was substantial in explaining elevational biodiversity patterns [75,76,77].
There was no significant change in TBA with elevation. This may be because the 700 m plot received disturbance. There is a difference in the rate of recovery of forest attributes after a disturbance occurs, with species diversity recovering faster than biomass [78]. The regression analysis was repeated after removing the sample plots from the 700 m elevation zone, and we found no significant relationship between basal area and elevation (Supplementary Figure S3). Therefore, we presume that the diversity of species in the herbaceous and shrub layers has been restored thanks to the conservation of the reserve’s closure. Within this time of conservation, TBA may also exhibit a hump-shape trend with an elevation in species diversity. The 700 m plots have a shorter duration of protection and are more susceptible to human disturbance than the other sample plots due to their location. We believe that these factors have contributed to the 700 m plots’ slower rate of recovery. The pattern of elevation gradients in the thoracic high cross-sectional area of the Daming Mountain community is likely to shift to a hump-shape trend. A gently sloping terrain is more conducive to the growth of large trees [79]. The 1200 m plots are more gently sloping, allowing more large trees to survive (Table 1).
4.3. Response of Community Structure to Environmental Factors
Soil nutrients determine plant growth rates and also significantly influence the diversity of species in a community [80]. In this study, we found that total soil nitrogen and soil organic are positively correlated with species diversity (Figure 8). This is consistent with previous research that found that increases in soil organic matter and soil total nitrogen positively affect species diversity [81]. Moreover, the two dominant families on Daming Mountain (Lauraceae and Fagaceae) are better suited to growing in acidic soils [82,83]. Thus, soil pH is negatively correlated with species diversity and the TBA on Daming Mountain.
4.4. Implications
This study expands and enriches conservation methods and ideas for nature reserves. In the management of nature reserves, there tends to be a greater focus on the search for and protection of rare species. However, research has shown that rare species are not a significant contributor to species diversity [84,85]. In the process of long-term evolution and succession, one or more dominant species will appear in the community, and these dominant species will often become the key species or umbrella species in the community. As our study explains, dominant plants have an effect on both species diversity and TBA. Therefore, in the construction of nature reserves, it is important to emphasize the conservation of common species and dominant species. We hope that this study will serve as a reference for biodiversity conservation in other regions.
The limitation of this study is that it was conducted in only one nature reserve. Lauraceae and Fagaceae are important in subtropical forests. However, there are fewer studies on the mechanisms of their effects. Furthermore, we have also only found a correlation, and the reasons behind it need to be explored. Future studies should be conducted in different regions to consider their variation across more gradients (elevation, latitude, etc.). Furthermore, the mechanisms and causes should be studied to provide a theoretical basis for the management of nature reserves.
5. Conclusions
The Lauraceae and Fagaceae hold great economic and ecological value to people [35,36]. However, few studies have analyzed in detail the contribution of these two families to subtropical forests. Our results indicate Lauraceae and Fagaceae are key taxa that drive species diversity and the total basal area of the plant community. Moreover, Fagaceae has played more important role than Lauraceae. However, our study lacks an exploration of the mechanisms behind this. It is of great significance to study the dynamics of dominant plant families for forest management and community conservation.
Supplementary Materials
The following supporting information can be downloaded at: https://www.mdpi.com/article/10.3390/f14091860/s1, Figure S1: Patterns of elevational gradients in soil nutrients. Figure S2: Patterns of elevational gradients in richness of Lauraceae and Fagaceae. Figure S3: Regression after removal of 700 m. Table S1: List of species in this study. Table S2: All indices and formulas in this study.
Author Contributions
Conceptualization, Y.L. and X.S.; methodology, Y.L. and X.S.; investigation D.J. and Q.H.; classified the vegetation data sets, D.J., Q.H., R.L. and W.Z.; formal analysis, J.L.; writing—original draft preparation, J.L. and A.B.; writing—review and editing, Y.L. and X.S.; supervision, Y.L.; project administration, Y.L. All authors have read and agreed to the published version of the manuscript.
Funding
This research was funded by the National Natural Science Foundation of China (Grant No. 31200330).
Data Availability Statement
Not applicable.
Acknowledgments
We sincerely thank Daming Mountain Nature Reserve for its support and help in our work. We are grateful to Donghai Huang for his help in the field work. We also are grateful to reviewers and editors for their work in provided insightful comments and suggestions to this paper.
Conflicts of Interest
The authors declare no conflict of interest.
References
- Liu, X.; Li, X.; Li, X.; Ma, W.; Guo, Q.; Zhu, X.; Xing, F. Dominant Plant Identity Determines Soil Extracellular Enzyme Activities of Its Entire Community in a Semi-Arid Grassland. Appl. Soil Ecol. 2021, 161, 103872. [Google Scholar] [CrossRef]
- Zhang, G.; Wang, X.; Wu, X.; Gao, H.; Xiao, S.; Zhang, W.; Shang, J.; Qiao, F.; Liu, G.; Chen, T.; et al. Dominant Woody Plants Alter Soil Microbial Community Composition during Succession. Glob. Ecol. Conserv. 2021, 31, e01852. [Google Scholar] [CrossRef]
- Avolio, M.L.; Forrestel, E.J.; Chang, C.C.; La Pierre, K.J.; Burghardt, K.T.; Smith, M.D. Demystifying Dominant Species. New Phytol. 2019, 223, 1106–1126. [Google Scholar] [CrossRef] [PubMed]
- Yang, X.; Wang, X.; Xiao, S.; Liu, Z.; Zhou, X.; Du, G.; Liu, K.; Wang, Y.; Chen, S.; Nielsen, U.N. Dominant Plants Affect Litter Decomposition Mainly through Modifications of the Soil Microbial Community. Soil Biol. Biochem. 2021, 161, 108399. [Google Scholar] [CrossRef]
- Frieswyk, C.B.; Johnston, C.A.; Zedler, J.B. Identifying and Characterizing Dominant Plants as an Indicator of Community Condition. J. Great Lakes Res. 2007, 33, 125–135. [Google Scholar] [CrossRef]
- Grime, J.P. Benefits of Plant Diversity to Ecosystems: Immediate, Filter and Founder Effects. J Ecol. 1998, 86, 902–910. [Google Scholar] [CrossRef]
- Eckberg, J.N.; Hubbard, A.; Schwarz, E.T.; Smith, E.T.; Sanders, N.J. The Dominant Plant Species Solidago Canadensis Structures Multiple Trophic Levels in an Old-field Ecosystem. Ecosphere 2023, 14, e4393. [Google Scholar] [CrossRef]
- Arnillas, C.A.; Borer, E.T.; Seabloom, E.W.; Alberti, J.; Baez, S.; Bakker, J.D.; Boughton, E.H.; Buckley, Y.M.; Bugalho, M.N.; Donohue, I.; et al. Opposing Community Assembly Patterns for Dominant and Nondominant Plant Species in Herbaceous Ecosystems Globally. Ecol. Evol. 2021, 11, 17744–17761. [Google Scholar] [CrossRef]
- Akhmetzhanova, A.A. Assessment of Phytomass Changes in an Alpine Geranium-Hedysarum Meadow after the Removal of Dominants: The Results of a Ten-Year Experiment. Russ. J. Ecol. 2010, 41, 38–43. [Google Scholar] [CrossRef]
- Crutsinger, G.M.; Strauss, S.Y.; Rudgers, J.A. Genetic Variation within a Dominant Shrub Species Determines Plant Species Colonization in a Coastal Dune Ecosystem. Ecology 2010, 91, 1237–1243. [Google Scholar] [CrossRef]
- Arellano, G.; Macía, M.J. Local and Regional Dominance of Woody Plants along an Elevational Gradient in a Tropical Montane Forest of Northwestern Bolivia. Plant Ecol. 2014, 215, 39–54. [Google Scholar] [CrossRef]
- Song, X.; Cao, M.; Li, J.; Kitching, R.L.; Nakamura, A.; Laidlaw, M.J.; Tang, Y.; Sun, Z.; Zhang, W.; Yang, J. Different Environmental Factors Drive Tree Species Diversity along Elevation Gradients in Three Climatic Zones in Yunnan, Southern China. Plant Divers. 2021, 43, 433–443. [Google Scholar] [CrossRef] [PubMed]
- Shimono, A.; Zhou, H.; Shen, H.; Hirota, M.; Ohtsuka, T.; Tang, Y. Patterns of Plant Diversity at High Altitudes on the Qinghai-Tibetan Plateau. J. Plant Ecol. 2010, 3, 1–7. [Google Scholar] [CrossRef]
- Zhao, C.-M.; Chen, W.-L.; Tian, Z.-Q.; Xie, Z.-Q. Altitudinal Pattern of Plant Species Diversity in Shennongjia Mountains, Central China. J. Integr. Plant Biol. 2005, 47, 1431–1449. [Google Scholar] [CrossRef]
- Meng, H.; Li, K.; Nie, M.; Wan, J.-R.; Quan, Z.-X.; Fang, C.-M.; Chen, J.-K.; Gu, J.-D.; Li, B. Responses of Bacterial and Fungal Communities to an Elevation Gradient in a Subtropical Montane Forest of China. Appl. Microbiol. Biotechnol. 2013, 97, 2219–2230. [Google Scholar] [CrossRef] [PubMed]
- Hooper, D.U.; Adair, E.C.; Cardinale, B.J.; Byrnes, J.E.K.; Hungate, B.A.; Matulich, K.L.; Gonzalez, A.; Duffy, J.E.; Gamfeldt, L.; O’Connor, M.I. A Global Synthesis Reveals Biodiversity Loss as a Major Driver of Ecosystem Change. Nature 2012, 486, U105–U129. [Google Scholar] [CrossRef]
- Edlinger, A.; Saghaï, A.; Herzog, C.; Degrune, F.; Garland, G. Towards a Multidimensional View of Biodiversity and Ecosystem Functioning in a Changing World. New Phytol. 2020, 228, 820–822. [Google Scholar] [CrossRef]
- Zhao, Z.; Feng, X.; Zhang, Y.; Wang, Y.; Zhou, Z. Species Richness, Endemism, and Conservation of Wild Rhododendron in China. Glob. Ecol. Conserv. 2023, 41, e02375. [Google Scholar] [CrossRef]
- Zhang, X.; Zhang, B.; Yao, Y.; Liu, J.; Wang, J.; Yu, F.; Li, J. Variation Model of North-South Plant Species Diversity in the Qinling-Daba Mountains in China. Glob. Ecol. Conserv. 2022, 38, e02190. [Google Scholar] [CrossRef]
- Hamberg, L.J.; Fraser, R.A.; Robinson, D.T.; Trant, A.J.; Murphy, S.D. Surface Temperature as an Indicator of Plant Species Diversity and Restoration in Oak Woodland. Ecol. Indic. 2020, 113, 106249. [Google Scholar] [CrossRef]
- Li, C.; Wang, B.; Fang, Z.; Yu, H.; Huang, J. Plant Species Diversity Is Driven by Soil Base Cations under Acid Deposition in Desert Coal-Mining Region in Northwestern China. Ecol. Indic. 2022, 145, 109682. [Google Scholar] [CrossRef]
- Floder, S.; Burns, C.W. The Influence of Fluctuating Light on Diversity and Species Number of Nutrient-Limited Phytoplankton1. J. Phycol. 2005, 41, 950–956. [Google Scholar] [CrossRef]
- Bhat, J.A.; Kumar, M.; Negi, A.K.; Todaria, N.P.; Malik, Z.A.; Pala, N.A.; Kumar, A.; Shukla, G. Species Diversity of Woody Vegetation along Altitudinal Gradient of the Western Himalayas. Glob. Ecol. Conserv. 2020, 24, e01302. [Google Scholar] [CrossRef]
- Mseddi, K.; Alghamdi, A.; Abdelgadir, M.; Sharawy, S.; Chaieb, M.; Miller, T. Phytodiversity Distribution in Relation to Altitudinal Gradient in Salma Mountains—Saudi Arabia. Glob. Ecol. Conserv. 2021, 27, e01525. [Google Scholar] [CrossRef]
- Sharma, N.; Kala, C.P. Patterns in Plant Species Diversity along the Altitudinal Gradient in Dhauladhar Mountain Range of the North-West Himalaya in India. Trees For. People 2022, 7, 100196. [Google Scholar] [CrossRef]
- Kessler, M. Patterns of Diversity and Range Size of Selected Plant Groups along an Elevational Transect in the Bolivian Andes. Biodivers. Conserv. 2001, 10, 1897–1921. [Google Scholar] [CrossRef]
- Page, L.M.; Cameron, A.D.; Clarke, G.C. Influence of Overstorey Basal Area on Density and Growth of Advance Regeneration of Sitka Spruce in Variably Thinned Stands. For. Ecol. Manag. 2001, 151, 25–35. [Google Scholar] [CrossRef]
- Midgley, J.J.; Niklas, K.J. Does Disturbance Prevent Total Basal Area and Biomass in Indigenous Forests from Being at Equilibrium with the Local Environment? J. Trop. Ecol. 2004, 20, 595–597. [Google Scholar] [CrossRef]
- Lam, T.Y.; Guan, B.T. Modeling Stand Basal Area Growth of Cryptomeria Japonica D. Don under Different Planting Densities in Taiwan. J. For. Res. 2020, 25, 174–182. [Google Scholar] [CrossRef]
- Poage, N.J.; Tappeiner, J.C. Long-Term Patterns of Diameter and Basal Area Growth of Old-Growth Douglas-Fir Trees in Western Oregon. Can. J. For. Res. 2002, 32, 1232–1243. [Google Scholar] [CrossRef]
- Gilman, A.C.; Letcher, S.G.; Fincher, R.M.; Perez, A.I.; Madell, T.W.; Finkelstein, A.L.; Corrales-Araya, F. Recovery of Floristic Diversity and Basal Area in Natural Forest Regeneration and Planted Plots in a Costa Rican Wet Forest. Biotropica 2016, 48, 798–808. [Google Scholar] [CrossRef]
- Acharya, B.K.; Chettri, B.; Vijayan, L. Distribution Pattern of Trees along an Elevation Gradient of Eastern Himalaya, India. Acta Oecologica 2011, 37, 329–336. [Google Scholar] [CrossRef]
- Homeier, J.; Breckle, S.-W.; Günter, S.; Rollenbeck, R.T.; Leuschner, C. Tree Diversity, Forest Structure and Productivity along Altitudinal and Topographical Gradients in a Species-Rich Ecuadorian Montane Rain Forest: Ecuadorian Montane Forest Diversity and Structure. Biotropica 2010, 42, 140–148. [Google Scholar] [CrossRef]
- Hinsinger, D.D.; Strijk, J.S. Toward Phylogenomics of Lauraceae: The Complete Chloroplast Genome Sequence of Litsea Glutinosa (Lauraceae), an Invasive Tree Species on Indian and Pacific Ocean Islands. Plant Gene 2017, 9, 71–79. [Google Scholar] [CrossRef]
- Brown, S.P.; Clark, S.L.; Ford, E.; Mirza, N.; Odeh, A.; Schlarbaum, S.E.; Jumpponen, A.; Baird, R. Convergent Shifts in Soil Fungal Communities Associated with Fagaceae Reforestation in the Southern Appalachian Mountains. For. Ecol. Manag. 2023, 531, 120805. [Google Scholar] [CrossRef]
- Wu, T.-Y.; Yeh, K.-T.; Hsu, H.-C.; Yang, C.-K.; Tsai, M.-J.; Kuo, Y.-F. Identifying Fagaceae and Lauraceae Species Using Leaf Images and Convolutional Neural Networks. Ecol. Inform. 2022, 68, 101513. [Google Scholar] [CrossRef]
- Chen, H.; Morrell, P.L.; Ashworth, V.E.T.M.; de la Cruz, M.; Clegg, M.T. Tracing the Geographic Origins of Major Avocado Cultivars. J. Hered. 2008, 100, 56–65. [Google Scholar] [CrossRef]
- Salleh, W.M.N.H.; Ahmad, F.; Yen, K.H.; Zulkifli, R.M. Essential Oil Compositions of Malaysian Lauraceae: A Mini Review. Pharm. Sci. 2016, 22, 60–67. [Google Scholar] [CrossRef]
- Zhang, J.; Huang, T.; Zhang, J.; Shi, Z.; He, Z. Chemical Composition of Leaf Essential Oils of Four Cinnamomum Species and Their Larvicidal Activity Against Anophelus sinensis (Diptera: Culicidae). J. Essent. Oil Bear. Plants 2018, 21, 1284–1294. [Google Scholar] [CrossRef]
- Kremer, A.; Abbott, A.G.; Carlson, J.E.; Manos, P.S.; Plomion, C.; Sisco, P.; Staton, M.E.; Ueno, S.; Vendramin, G.G. Genomics of Fagaceae. Tree Genet. Genomes 2012, 8, 583–610. [Google Scholar] [CrossRef]
- Cheng, Y.-B.; Liu, F.-J.; Wang, C.-H.; Hwang, T.-L.; Tsai, Y.-F.; Yen, C.-H.; Wang, H.-C.; Tseng, Y.-H.; Chien, C.-T.; Chen, Y.-M.; et al. Bioactive Triterpenoids from the Leaves and Twigs of Lithocarpus Litseifolius and L. Corneus. Planta Med. 2018, 84, 49–58. [Google Scholar] [CrossRef]
- Shang, A.; Liu, H.-Y.; Luo, M.; Xia, Y.; Yang, X.; Li, H.-Y.; Wu, D.-T.; Sun, Q.; Geng, F.; Gan, R.-Y. Sweet Tea (Lithocarpus polystachyus Rehd.) as a New Natural Source of Bioactive Dihydrochalcones with Multiple Health Benefits. Crit. Rev. Food Sci. Nutr. 2022, 62, 917–934. [Google Scholar] [CrossRef]
- Wang, X.; Yu, S.; Zhou, L.; Fu, S. Soil Microbial Characteristics and the Influencing Factors in Subtropical Forests. Acta Ecol. Sin. 2016, 36, 8–15. [Google Scholar] [CrossRef]
- Fu, W.; Dong, J.; Ding, L.; Yang, H.; Ye, Z.; Zhao, K. Spatial Correlation of Nutrients in a Typical Soil-Hickory System of Southeastern China and Its Implication for Site-Specific Fertilizer Application. Soil Tillage Res. 2022, 217, 105265. [Google Scholar] [CrossRef]
- Hong, S.; Piao, S.; Chen, A.; Liu, Y.; Liu, L.; Peng, S.; Sardans, J.; Sun, Y.; Peñuelas, J.; Zeng, H. Afforestation Neutralizes Soil PH. Nat. Commun. 2018, 9, 520. [Google Scholar] [CrossRef] [PubMed]
- Wang, C.; Cheng, T.; Tang, S.; Li, M.; Zhang, D.; Pan, X. Protective-Mechanism-Exclusive Thermal Stability Modes of Soil Organic Matter: Novel Implication for Wildfire Effect on Soil Organic Carbon. Sci. Total Environ. 2023, 861, 160734. [Google Scholar] [CrossRef] [PubMed]
- Lee, M.-H.; Park, J.-H.; Matzner, E. Sustained Production of Dissolved Organic Carbon and Nitrogen in Forest Floors during Continuous Leaching. Geoderma 2018, 310, 163–169. [Google Scholar] [CrossRef]
- Bettinger, P.; Boston, K.; Siry, J.P.; Grebner, D.L. Valuing and Characterizing Forest Conditions. In Forest Management and Planning; Elsevier: Amsterdam, The Netherlands, 2017; pp. 21–63. ISBN 978-0-12-809476-1. [Google Scholar]
- Magurran, A.E. Ecological Diversity and Its Measurement; Springer: Dordrecht, The Netherlands, 1988. [Google Scholar]
- Molla, T.; Asfaw, Z.; Muluneh, M.G.; Worku, B.B. Diversity of Woody Species in Traditional Agroforestry Practices in Wondo District, South-Central Ethiopia. Heliyon 2023, 9, e13549. [Google Scholar] [CrossRef]
- Pandey, B.; Pan, K.; Dakhil, M.A.; Liao, Z.; Timilsina, A.; Khanal, M.; Zhang, L. Contrasting Gymnosperm Diversity Across an Elevation Gradient in the Ecoregion of China: The Role of Temperature and Productivity. Front. Ecol. Evol. 2021, 9, 679439. [Google Scholar] [CrossRef]
- Wood, S.N. Stable and Efficient Multiple Smoothing Parameter Estimation for Generalized Additive Models. J. Am. Stat. Assoc. 2004, 99, 673–686. [Google Scholar] [CrossRef]
- McKenna, S.; Meyer, M.; Gregg, C.; Gerber, S. S-CorrPlot: An Interactive Scatterplot for Exploring Correlation. J. Comput. Graph. Stat. 2016, 25, 445–463. [Google Scholar] [CrossRef]
- Li, Z.; Li, Z.; Tong, X.; Zhang, J.; Dong, L.; Zheng, Y.; Ma, W.; Zhao, L.; Wang, L.; Wen, L.; et al. Climatic Humidity Mediates the Strength of the Species Richness–Biomass Relationship on the Mongolian Plateau Steppe. Sci. Total Environ. 2020, 718, 137252. [Google Scholar] [CrossRef]
- Shi, G.-L.; Xie, Z.-M.; Li, H.-M. High Diversity of Lauraceae from the Oligocene of Ningming, South China. Palaeoworld 2014, 23, 336–356. [Google Scholar] [CrossRef]
- Huang, G.; Huang, Z.; Huang, L.; Zheng, X.; Zhou, H. The Climate Characteristics and Study on Weather Index of Daming Mountain Scenic Region in Guangxi. J. Meteorol. Res. Appl. 2015, 36, 76–79. [Google Scholar]
- Cheuk, M.L.; Fischer, G.A. The Impact of Climate Change on the Distribution of Castanopsis (Fagaceae) Species in South China and Indo-China Region. Glob. Ecol. Conserv. 2021, 26, e01388. [Google Scholar] [CrossRef]
- Zhou, R.; Ci, X.; Hu, J.; Zhang, X.; Cao, G.; Xiao, J.; Liu, Z.; Li, L.; Thornhill, A.H.; Conran, J.G.; et al. Transitional Areas of Vegetation as Biodiversity Hotspots Evidenced by Multifaceted Biodiversity Analysis of a Dominant Group in Chinese Evergreen Broad-Leaved Forests. Ecol. Indic. 2023, 147, 110001. [Google Scholar] [CrossRef]
- Kamimura, V.D.A.; Moraes, P.L.R.D.; Ribeiro, H.L.; Joly, C.A.; Assis, M.A. Tree Diversity and Elevational Gradient: The Case of Lauraceae in the Atlantic Rainforest. Flora 2017, 234, 84–91. [Google Scholar] [CrossRef]
- Hernández Gordillo, A.L.; Vilchez Mendoza, S.; Ngo Bieng, M.A.; Delgado, D.; Finegan, B. Altitude and Community Traits Explain Rain Forest Stand Dynamics over a 2370-m Altitudinal Gradient in Costa Rica. Ecosphere 2021, 12, e03867. [Google Scholar] [CrossRef]
- Culmsee, H.; Leuschner, C.; Moser, G.; Pitopang, R. Forest Aboveground Biomass along an Elevational Transect in Sulawesi, Indonesia, and the Role of Fagaceae in Tropical Montane Rain Forests. J. Biogeogr. 2010, 37, 960–974. [Google Scholar] [CrossRef]
- Ding, Y.; Zang, R.; Lu, X.; Huang, J. The Impacts of Selective Logging and Clear-Cutting on Woody Plant Diversity after 40 Years of Natural Recovery in a Tropical Montane Rain Forest, South China. Sci. Total Environ. 2017, 579, 1683–1691. [Google Scholar] [CrossRef]
- Zhu, Z.-X.; Nizamani, M.M.; Sahu, S.K.; Kunasingam, A.; Wang, H.-F. Tree Abundance, Richness, and Phylogenetic Diversity along an Elevation Gradient in the Tropical Forest of Diaoluo Mountain in Hainan, China. Acta Oecologica 2019, 101, 103481. [Google Scholar] [CrossRef]
- Haq, S.M.; Calixto, E.S.; Rashid, I.; Srivastava, G.; Khuroo, A.A. Tree Diversity, Distribution and Regeneration in Major Forest Types along an Extensive Elevational Gradient in Indian Himalaya: Implications for Sustainable Forest Management. For. Ecol. Manag. 2022, 506, 119968. [Google Scholar] [CrossRef]
- Zhou, Y.; Ochola, A.C.; Njogu, A.W.; Boru, B.H.; Mwachala, G.; Hu, G.; Xin, H.; Wang, Q. The Species Richness Pattern of Vascular Plants along a Tropical Elevational Gradient and the Test of Elevational Rapoport’s Rule Depend on Different Life-forms and Phytogeographic Affinities. Ecol. Evol. 2019, 9, 4495–4503. [Google Scholar] [CrossRef] [PubMed]
- Lomolino, M.V. Elevation Gradients of Species-Density: Historical and Prospective Views: Elevation Gradients of Species-Density. Glob. Ecol. Biogeogr. 2001, 10, 3–13. [Google Scholar] [CrossRef]
- Aynekulu, E.; Aerts, R.; Moonen, P.; Denich, M.; Gebrehiwot, K.; Vågen, T.-G.; Mekuria, W.; Boehmer, H.J. Altitudinal Variation and Conservation Priorities of Vegetation along the Great Rift Valley Escarpment, Northern Ethiopia. Biodivers. Conserv. 2012, 21, 2691–2707. [Google Scholar] [CrossRef]
- Kessler, M.; Kluge, J.; Hemp, A.; Ohlemüller, R. A Global Comparative Analysis of Elevational Species Richness Patterns of Ferns: Global Analysis of Fern Transects. Glob. Ecol. Biogeogr. 2011, 20, 868–880. [Google Scholar] [CrossRef]
- Manish, K.; Pandit, M.K.; Telwala, Y.; Nautiyal, D.C.; Koh, L.P.; Tiwari, S. Elevational Plant Species Richness Patterns and Their Drivers across Non-Endemics, Endemics and Growth Forms in the Eastern Himalaya. J. Plant Res. 2017, 130, 829–844. [Google Scholar] [CrossRef]
- Gao, J.; Liu, Y. Climate Stability Is More Important than Water-Energy Variables in Shaping the Elevational Variation in Species Richness. Ecol. Evol. 2018, 8, 6872–6879. [Google Scholar] [CrossRef]
- Kluge, J.; Kessler, M.; Dunn, R.R. What Drives Elevational Patterns of Diversity? A Test of Geometric Constraints, Climate and Species Pool Effects for Pteridophytes on an Elevational Gradient in Costa Rica: Drivers of Pteridophyte Richness. Glob. Ecol. Biogeogr. 2006, 15, 358–371. [Google Scholar] [CrossRef]
- Ali, A.; Lin, S.-L.; He, J.-K.; Kong, F.-M.; Yu, J.-H.; Jiang, H.-S. Climatic Water Availability Is the Main Limiting Factor of Biotic Attributes across Large-Scale Elevational Gradients in Tropical Forests. Sci. Total Environ. 2019, 647, 1211–1221. [Google Scholar] [CrossRef]
- Colwell, R.K.; Lees, D.C. The Mid-Domain Effect: Geometric Constraints on the Geography of Species Richness. Trends Ecol. Evol. 2000, 15, 70–76. [Google Scholar] [CrossRef] [PubMed]
- Dani, R.S.; Divakar, P.K.; Baniya, C.B. Diversity and Composition of Plants Species along Elevational Gradient: Research Trends. Biodivers. Conserv. 2023, 32, 2961–2980. [Google Scholar] [CrossRef]
- Lee, C.-B.; Chun, J.-H.; Cho, H.-J.; Song, H.-K. Altitudinal Patterns of Plant Species Richness on the Ridge of the Baekdudaegan Mountains, South Korea: Area and Mid-Domain Effect. For. Sci. Technol. 2012, 8, 154–160. [Google Scholar] [CrossRef]
- Murphy, H.T.; VanDerWal, J.; Lovett-Doust, J. One, Two and Three-Dimensional Geometric Constraints and Climatic Correlates of North American Tree Species Richness. Ecography 2011, 34, 267–275. [Google Scholar] [CrossRef]
- Wang, X.-H.; Kent, M.; Fang, X.-F. Evergreen Broad-Leaved Forest in Eastern China: Its Ecology and Conservation and the Importance of Resprouting in Forest Restoration. For. Ecol. Manag. 2007, 245, 76–87. [Google Scholar] [CrossRef]
- Poorter, L.; Craven, D.; Jakovac, C.C.; Van Der Sande, M.T.; Amissah, L.; Bongers, F.; Chazdon, R.L.; Farrior, C.E.; Kambach, S.; Meave, J.A.; et al. Multidimensional Tropical Forest Recovery. Science 2021, 374, 1370–1376. [Google Scholar] [CrossRef]
- Sandoya, V.; Saura-Mas, S.; Granzow-de la Cerda, I.; Arellano, G.; Macía, M.J.; Tello, J.S.; Lloret, F. Contribution of Species Abundance and Frequency to Aboveground Forest Biomass along an Andean Elevation Gradient. For. Ecol. Manag. 2021, 479, 118549. [Google Scholar] [CrossRef]
- Viani, R.A.G.; Rodrigues, R.R.; Dawson, T.E.; Oliveira, R.S. Savanna Soil Fertility Limits Growth but Not Survival of Tropical Forest Tree Seedlings. Plant Soil 2011, 349, 341–353. [Google Scholar] [CrossRef]
- Yaseen, M.; Fan, G.; Zhou, X.; Long, W.; Feng, G. Plant Diversity and Soil Nutrients in a Tropical Coastal Secondary Forest: Association Ordination and Sampling Year Differences. Forests 2022, 13, 376. [Google Scholar] [CrossRef]
- Rogers, R. TEMPERATE ECOSYSTEMS|Fagaceae. In Encyclopedia of Forest Sciences; Elsevier: Amsterdam, The Netherlands, 2004; pp. 1419–1427. ISBN 978-0-12-145160-8. [Google Scholar]
- Rohwer, J.G. Lauraceae. In Flowering Plants · Dicotyledons; Kubitzki, K., Rohwer, J.G., Bittrich, V., Eds.; Springer: Berlin/Heidelberg, Germany, 1993; pp. 366–391. ISBN 978-3-642-08141-5. [Google Scholar]
- Lennon, J.J.; Koleff, P.; Greenwood, J.J.D.; Gaston, K.J. Contribution of Rarity and Commonness to Patterns of Species Richness: Richness Patterns and Rarity/Commonness. Ecol. Lett. 2003, 7, 81–87. [Google Scholar] [CrossRef]
- Pool, T.K.; Grenouillet, G.; Villéger, S. Species Contribute Differently to the Taxonomic, Functional, and Phylogenetic Alpha and Beta Diversity of Freshwater Fish Communities. Divers. Distrib. 2014, 20, 1235–1244. [Google Scholar] [CrossRef]

Disclaimer/Publisher’s Note: The statements, opinions and data contained in all publications are solely those of the individual author(s) and contributor(s) and not of MDPI and/or the editor(s). MDPI and/or the editor(s) disclaim responsibility for any injury to people or property resulting from any ideas, methods, instructions or products referred to in the content. |
© 2023 by the authors. Licensee MDPI, Basel, Switzerland. This article is an open access article distributed under the terms and conditions of the Creative Commons Attribution (CC BY) license (https://creativecommons.org/licenses/by/4.0/).