Article

Influence of Varied Phosphorus Fertilizer Ratios on the Rhizosphere Soil Microbial Community in Idesia polycarpa Seedlings

1
College of Forestry, Henan Agricultural University, Zhengzhou 450046, China
2
National Forestry and Grassland Administration Key Laboratory for Central Plains Forest Resources Cultivation, Zhengzhou 450046, China
3
Henan Province Engineering Technology Research Center for Idesia, Zhengzhou 450046, China
4
Key Laboratory of Vegetation Restoration and Management of Degraded Ecosystems, South China Botanical Garden, Chinese Academy of Sciences, Guangzhou 510650, China
5
Pingxiang Forestry Science Research Institute, Pingxiang 337000, China
*
Author to whom correspondence should be addressed.
These authors contributed equally to this work.
Forests 2024, 15(10), 1686; https://doi.org/10.3390/f15101686
Submission received: 6 September 2024 / Revised: 19 September 2024 / Accepted: 23 September 2024 / Published: 25 September 2024

Abstract

:
Phosphorus (P) is crucial for tree growth and development, and it significantly influences the rhizosphere microbial community. However, the effects of phosphorus addition on the microbial communities in the rhizosphere soil of Idesia polycarpa remain understudied. In this study, two-year-old “Yuji” Idesia polycarpa seedlings were used to investigate the effects of phosphorus fertilization at four different levels of 0 g (control, CK), 0.92 g (low phosphorus, LP), 1.83 g (medium phosphorus, MP), and 2.75 g (high phosphorus, HP) per plant. The fertilizers were applied every 40 days over 120 days. MiSeq high-throughput sequencing of the 16S rRNA and ITS1 genes was employed to analyze the microbial community composition and diversity of bacteria and fungi in the rhizosphere soil under different phosphorus levels. The results showed that compared with CK treatment, the application of phosphorus fertilizer changed the physicochemical properties of the soil. The LP treatment significantly increased the soil pH, while the HP treatment group exhibited the highest soil-available phosphorus (AP) content. LP treatment significantly increased the number of microbial OTUs in the early and rapid growth stages and the richness and diversity of microbial communities. In addition, the bacterial community structure was significantly correlated with soil pH and AP, while the fungal community had no significant effect. The primary metabolic pathway function of bacteria in the rhizosphere soil of Idesia polycarpa seedlings is mainly metabolism, while fungi are mainly biosynthesis. Compared with CK treatment, 20 differential metabolic pathways were screened out in the bacterial community. Only two differential metabolic pathways were screened out in the fungal community by LP treatment at 120 days. In summary, applying low-level phosphate fertilizer is conducive to promoting the diversity of rhizosphere soil microorganisms. Therefore, potted planting of Idesia polycarpa seedlings is more suitable for applying low phosphorus levels.

1. Introduction

Idesia polycarpa Maxim, a deciduous and excellent woody tree species whose pulp oil content is 44% [1], is native to East Asia [2]. The oil contains various fatty acids, but linoleic acid is the most abundant, with a content of more than 80% [3]. Relevant studies have also found that it has antioxidant [4] and drug application value [5,6]. Wood has been an indispensable material for thousands of years and is extensively used in daily life and industry [7]. Idesia polycarpa is a high-quality and fast-growing timber tree species suitable for pulp manufacturing, fiberboard, plywood, particleboard, and other artificial board production. According to the compressive strength, it fully meets the requirements of China for plywood (Class II, ≥0.7 MPa). It holds significant potential for industrial promotion in forestry development and the furniture industry [8,9]. Regarding soil nutrient management of Idesia polycarpa forest land, fertilization is an important measure to increase forest land nutrients rapidly. Reasonable fertilization can improve forest growth and increase yields. Current research on Idesia polycarpa mainly concentrates on its breeding, cultivation, harvesting, processing, and utilization. However, there is a lack of studies investigating the impact of specific elements on its growth and development.
The micro-region with the most significant impact on root exudates is the rhizosphere [10], one of the main areas for microbial survival and a key place for energy exchange between plant roots and soil [11]. Rhizosphere microorganisms can form a stable structure in the rhizosphere microhabitat and have a certain degree of influence on the physicochemical properties of the surrounding soil, thus increasing the soil organic matter content [12]. Soil microorganisms are the primary agents responsible for transforming soil-available nutrients and serve as the primary source and reservoir of these nutrients within the soil [13]. Studies have reported that fertilization can change soil nutrient status and properties, thus altering soil microbial diversity [14,15]. It is evident that soil nutrient status and physicochemical properties significantly influence microbial diversity.
Phosphorus (P) is one of the essential macronutrients for plants [16]. It plays a crucial role in plant growth, development, and reproduction and is one of the limiting nutrient elements for plant growth [17]. The physicochemical properties of soil serve as fundamental indicators for assessing soil fertility [18], which mainly provides nutrients for plants and directly reflects the fertility level of soil [19]. The composition and metabolic function of soil microbial communities are closely linked to variations in soil P levels [20]. Changes in nutrient inputs can lead to sensitive shifts in microbial communities [21], which alter the concentrations of organic and inorganic substances in the soil through a series of chemical reactions, thereby influencing the phosphorus cycling process [22]. Applying P fertilizer to the soil is anticipated to induce alterations in the microbial community composition and the soil environment within the designated area [23]. Research indicates that phosphorus application can directly supplement soil nutrients while concurrently influencing the soil’s physicochemical attributes, including pH levels, thereby impacting the composition of microorganisms [24]. At varying phosphorus levels, soils treated with phosphorus fertilizers exhibited higher concentrations of available phosphorus compared to those without phosphorus fertilization. In addition, different fertilizers also had certain effects on the number, activity, and community structure of soil microorganisms [25,26]. Long-term application of organic fertilizers significantly increases the diversity of soil microorganisms and changes their flora structure [27,28]. Similarly, scholars believe the appropriate amount of phosphorus can improve the rhizosphere soil microenvironment, thereby increasing crop yield [29]. In contrast, short-term phosphorus fertilizer application did not induce changes in soil microbial community structure [30].
The seedlings of Idesia polycarpa have a high market potential, and this species is mainly propagated by seedling cultivation; thus, the production of vigorous seedlings is significant. Our previous results [31] showed that phosphorus is one of the essential nutrients during the growth and development of Idesia polycarpa seedlings. Thus, we carried out a short-term (120-day) pot experiment with four different phosphorus levels. This study hypothesized that different levels of phosphorus would impact the physicochemical properties of the rhizosphere soil and would, in turn, be manifested in the structure, diversity, and functional potential of the microbiomes. Secondly, there is a correlation between the physicochemical parameters of the rhizosphere and the microbial community composition. This study aimed to determine the phosphorus demand in Idesia polycarpa seedlings to optimize nutrient management and improve growth and industrial development. It provides a guide for adequate fertilization and high-yield cultivation.

2. Materials and Methods

2.1. Experimental Site Overview and Experimental Design

This study was conducted at the experimental research station (112°42′–114°14′ E, and 34°16′–34°58′ N) of the College of Forestry, Henan Agricultural University, Zhengzhou, Henan Province, China. The site experiences an annual average temperature of 14.2 °C, with a minimum temperature of −17.9 °C, a frost-free period of 215 days, an average annual precipitation of 650.1 mm, and approximately 2400 h of sunshine per year [32,33]. Soils in Zhengzhou have low organic matter content, high adequate phosphorus levels, and a coarse texture. The trial site’s soil texture is classified as sandy loam.
The volume ratio of soil substrate used for potting was a mixture of charcoal soil/vermiculite = 1:1 (1.1 kg:0.42 kg), at which time the effective phosphorus content was 215.20 mg P kg−1. Two-year-old ‘Yuji’ Idesia polycarpa seedlings were selected as the test material, which was sown and cultivated in 2021, then transplanted in June 2022, with as much as possible removed from the original planted soil. The soil was removed as much as possible from the original planting. The formulation design was based on our research results [31], recommending fertilizer rates of 2.4 g/plant for nitrogen (N), 1.83 g/plant for phosphorus (P), and 1.29 g/plant for potassium (K). In this experiment, urea, calcium–magnesium phosphate fertilizer, and potassium oxide fertilizer were applied. The experiment consisted of four phosphate fertilizer treatments, each applied to 15 plants: CK (control) with no phosphorus fertilizer (0 g/plant), low phosphorus (LP) at 0.5 times the recommended amount (0.92 g/plant), medium phosphorus (MP) at 1.83 g/plant, and high phosphorus (HP) at 1.5 times the recommended amount (2.75 g/plant) (Table 1). Each treatment was replicated three times to account for variability across the factors. Fertilization was carried out every 40 days over 120 days, with applications on day 0 (11 June), day 40 (21 July), and day 80 (31 August). Sampling occurred at 40, 80, and 120 days, with fertilization following each sampling. Plants were watered for 30 min daily, for 15 min in the morning and 15 min in the evening.

2.2. Measurement Items and Methods

2.2.1. Assessment of Soil Physicochemical Properties

Rhizosphere soil samples were collected from June to August 2022. Three healthy seedlings were randomly selected from each collection, and the entire root was excavated and carefully shaken to obtain rhizosphere soil samples. Part of the soil samples from each treatment were put into sterile bags and stored in an ultralow-temperature refrigerator at −80 °C for microbial sequencing. Another part of the soil was dried to determine the physicochemical properties.
To determine the rhizosphere soil pH, the dried soil was passed through a sieve with a pore size of 2 mm, and 10 g of the soil sample (accurate to 0.01 g) was weighed, placed in a 50 mL beaker, and 25 mL distilled water was added using a magnetic stirrer (85-2, Jiangsu Jinyi Instrument Technology Co., Ltd., Changzhou, China) to stir violently for 2 min. After standing for 30 min, soil pH was measured using an acidity meter (LC-PH-3S, Shanghai LiChen Bangxi Instrument Equipment Co., Ltd., Shanghai, China) within 1 h.
Referring to the molybdenum antimony colorimetric method [34], 0.25 g (accurate to 0.01 g) of dried soil that had passed through a 0.15 mm pore-size sieve was weighed and leached with NaHCO3, and the soil AP content was assessed utilizing a UV spectrophotometer (E1, Peakch Instruments Co., Ltd., Shanghai, China).

2.2.2. Sampling and High-Throughput Sequencing of Rhizosphere Soil

For DNA sequencing, 0.2–0.5 g of soil was added to a centrifuge tube with extraction lysate and ground at 60 Hz. Nucleic acids were extracted using an OMEGA Soil DNA Kit (D5635-02) (Omega Bio-Tek, Norcross, GA, USA). The quality of the extracted DNA was assessed using 0.8% agarose gel electrophoresis, while the quantity and quality were determined with a Nanodrop NC 2000 spectrophotometer (Thermo Fisher Scientific, Waltham, MA, USA) and agarose gel electrophoresis, respectively. PCR amplification of the V3–V4 region of the bacterial 16S rRNA gene was conducted using the forward primer 338F (5′-barcode+ACTCCTACGGGAGGCAGCA-3′) and the reverse primer 806R (5′-GGACTACHVGGGTWTCTAAT-3′). The forward primer ITS5 (GGAAGTAAAAGTCGTAACAAGG) and reverse primer ITS2 (GCTGCGTTCTTCATCGATGC) were used for fungal ITSV1 region amplification. PCR was performed using NEB Q5 high-fidelity DNA polymerase in a 25 μL reaction volume, which included 0.25 μL of Q5 high-fidelity DNA polymerase, 5 μL of 5× buffer, 5 μL of 5× high GC buffer, 2 μL of 10 mM dNTPs, 1 μL of 10 μM forward and reverse primers, 2 μL of DNA template, and 8.75 μL of ddH2O.
The bacterial PCR conditions were as follows: pre-denaturation at 98 °C for 5 min, followed by 25 cycles of 98 °C for 30 s, 53 °C for 30 s, and 72 °C for 45 s, with a final extension at 72 °C for 5 min. The fungal PCR conditions included pre-denaturation at 98 °C for 5 min, followed by 28 cycles at 98 °C for 30 s, 55 °C for 45 s, and 72 °C for 45 s, with a final extension at 72 °C for 5 min. Both reactions were stored at 12 °C. PCR amplicons were purified using Vazyme VAHTSTM DNA Clean Beads (Vazyme, Nanjing, China) and quantified with a Quant-iT PicoGreen dsDNA Assay Kit (Invitrogen, Carlsbad, CA, USA). Aliquots of the amplicons were mixed for library construction, which was performed using a TruSeq Nano DNA LT Library Prep Kit from Illumina. Double-end sequencing (2 × 250 bp) was conducted on the Illumina NovaSeq platform using a NovaSeq 6000 SP Reagent Kit (500 cycles) at Shanghai Parsonage Biotech (Shanghai, China).
The raw sequence data have been uploaded to the National Center for Biotechnology Information (NCBI) database under accession number PRJNA1136253.

2.3. Bioinformatics and Statistical Analysis

The biological information of the microbiome was analyzed using QIIME2 version 2019.4. The analysis process was based on the official guidelines provided by QIIME2 (https://docs.qiime2.org/2019.4/tutorials/, accessed on 7 July 2024), with modifications implemented to optimize the performance of the dataset. Raw sequence data were decoded using the demux plugin; primer excision was conducted using the cutadapt plugin [35]; and data processing, such as quality control, denoising, merging, and de-chimerization, was performed using DADA2 [36]. Clustering into operational units (OTUs) was performed according to a 97% similarity level [37]. The OTU classification was performed by comparing the Silva database (https://greengenes.lbl.gov/, accessed on 7 July 2024) [38] with the UNITE database (https://unite.ut.ee, accessed on 7 July 2024) [39].
We used scikit-bio to calculate the Chao1 richness index [40], Simpson index [41], and Shannon index [42,43] to analyze the community structure at each taxonomic level, providing insights into the microbial community composition. OTU abundance data across all samples were utilized to create Venn diagrams using R scripts and the VennDiagram package [44], and the alpha diversity indices were analyzed with R and ggplot2 packages. Microbial metabolic functions were predicted using PICRUSt2, and differences in species abundance between samples were assessed using the ropls R package. Bacterial and fungal functions were predicted based on the KEGG and MetaCyc databases [45]. Correlations between microbial abundance and physicochemical indicators were analyzed according to the official tutorial (https://www.bioincloud.tech/standalone-task-ui/cor_heatmap, accessed on 17 March 2024).
The physicochemical data were processed using Microsoft Excel 2021 (available online: https://www.microsoft.com, accessed on 19 July 2024), and data significance analyses were performed using IBM SPSS v. 26 (available online: https://www.ibm.com, accessed on 19 July 2024). For significance testing, we applied one-way analysis of variance (ANOVA) and Waller–Duncan (W) multiple comparison methods.

3. Results

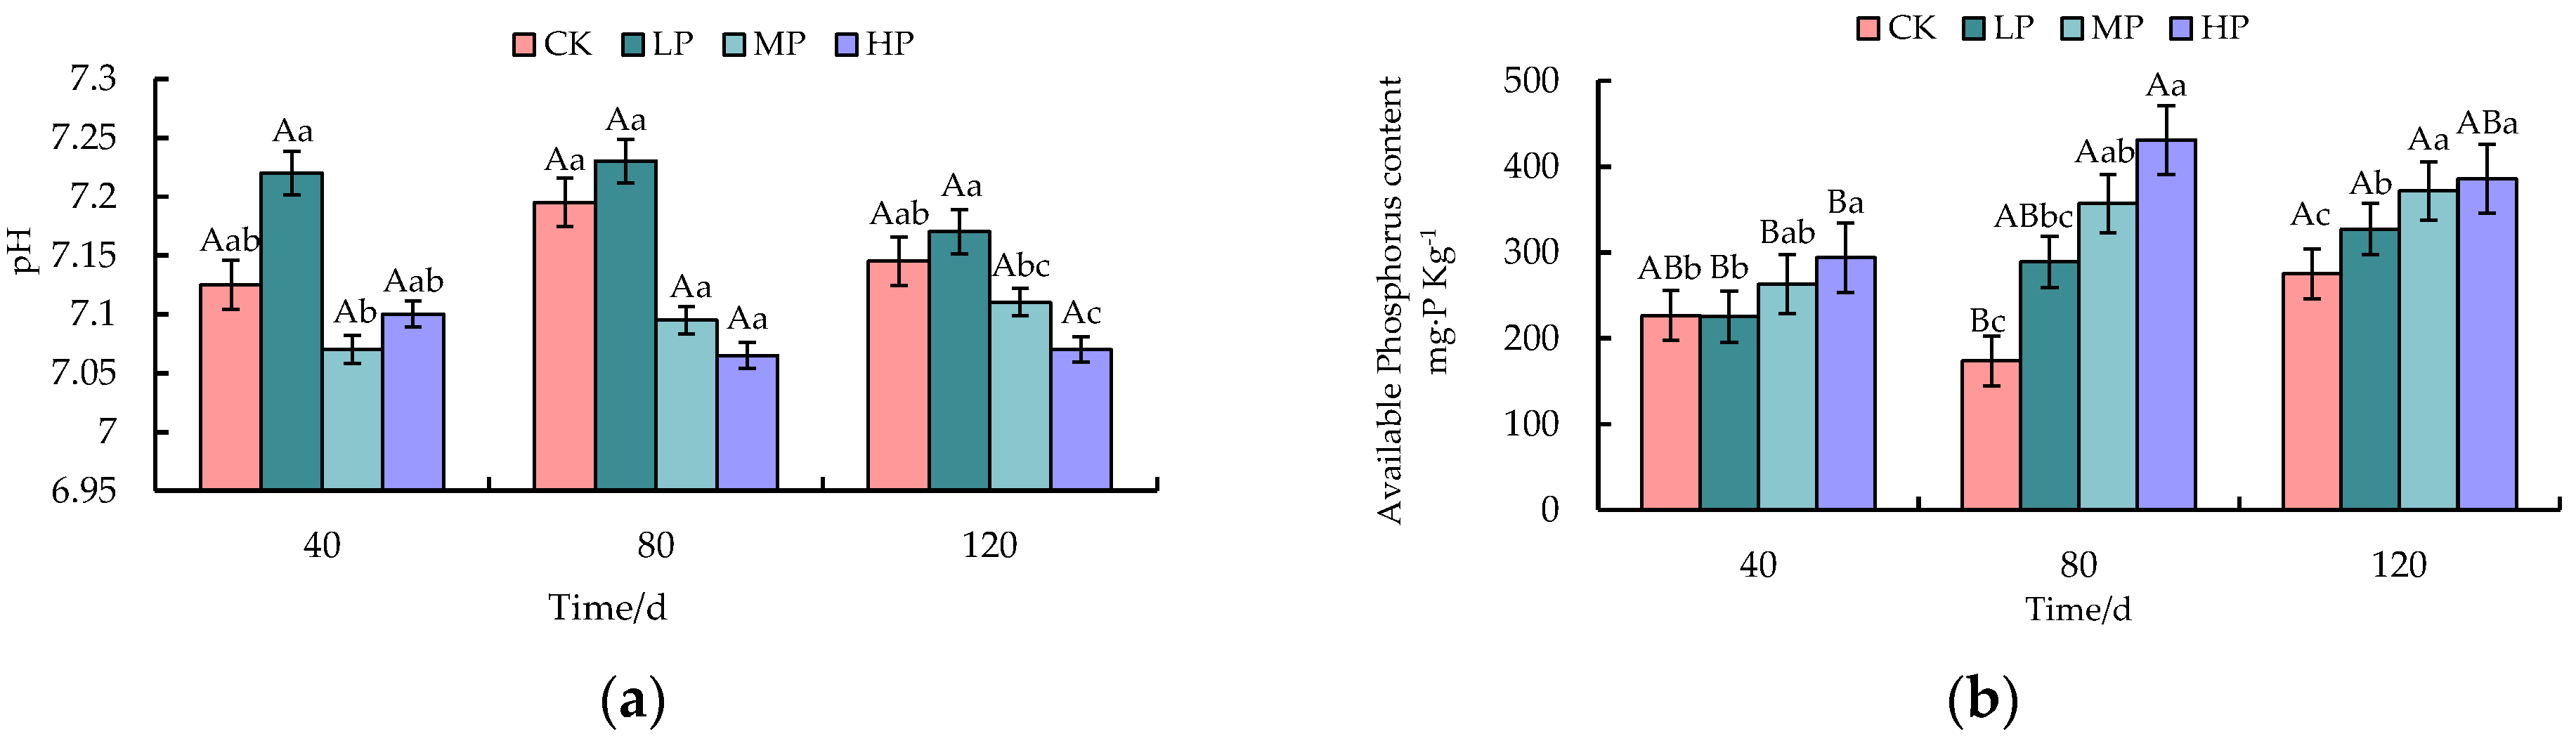
3.1. Effects of Different Phosphorus Levels on Soil Physicochemical Properties of Idesia polycarpa Seedlings

The application of phosphorus affected the soil pH level. The soil under the LP treatment had a higher pH, while that under the HP treatment had the lowest pH compared to other treatments. On the other hand, soil pH showed a reduction in both the MP and HP treatments relative to the CK treatment. The soil’s available phosphorus content increased with the increase in phosphorus application level and duration (Figure 1).

3.2. Effects of Different Phosphorus Levels on Microbial Community Composition in Rhizosphere Soil of Idesia polycarpa

After denoising, an effective bacterial and fungal sequence averaged 1,275,419 and 933,217 across the four P levels at three time points. Additionally, all sequence counts decreased with time. The effective sequences were clustered to OTUs, and data were tabulated for Venn diagrams per time point. In a similar trend, the LP treatment had the highest number of unique bacterial OTUs among the four phosphorus levels across the three periods, with an increase of 19.21% and 9.26% compared to CK (Figure 2a,c). At 120 days, although the numbers of unique OTUs decreased across all phosphorus levels, the HP treatment showed the highest numbers of OTUs with an increase of 12.76% compared to CK (Figure 2b,e). This indicates that more phosphorus fertilization may enhance the bacterial diversity of rhizosphere soil. The shared OTUs were significantly different in each stage, with the highest number of shared OTUs at 120 days, totaling 1620 in number.
The fungal OTU showed the highest number of OTUs to LP and MP by comparing the four phosphorus levels in the three periods, which increased by 43.58% and 23.37% compared to CK (Figure 2d,f). The number of shared OTUs differed in each period, with the highest variety of OTUs shared at 120 d, amounting to 145 (Table 2).

3.3. Impact of Phosphorus Levels on the Relative Abundance of Microorganisms in Rhizosphere Soil of Idesia polycarpa Seedlings

3.3.1. Relative Abundance of Bacteria

The measured microbial communities were classified according to their relative abundance, which was divided into Dominant (>10%), Subdominant (1%~10%), Common (0.1%~1%), and Rare (<0.1%). Using sequencing, the number of species detected at each classification level (Table 3) and the number of bacterial species at each level gradually increased with time. The bacterial communities with each phosphorus level in the top ten relative abundance levels of the phrasal classification level were selected, and the resulting cumulative bar graph is shown in Figure 3. The main dominant bacteria of all phosphorus application levels were Proteobacteria (35%, 31.45%, 35.92%), Chloroflexi (19.97%, 26.29%, 16.33%), Actinobacteria (13.12%, 10.99%, 11.18%), and Bacteroides.

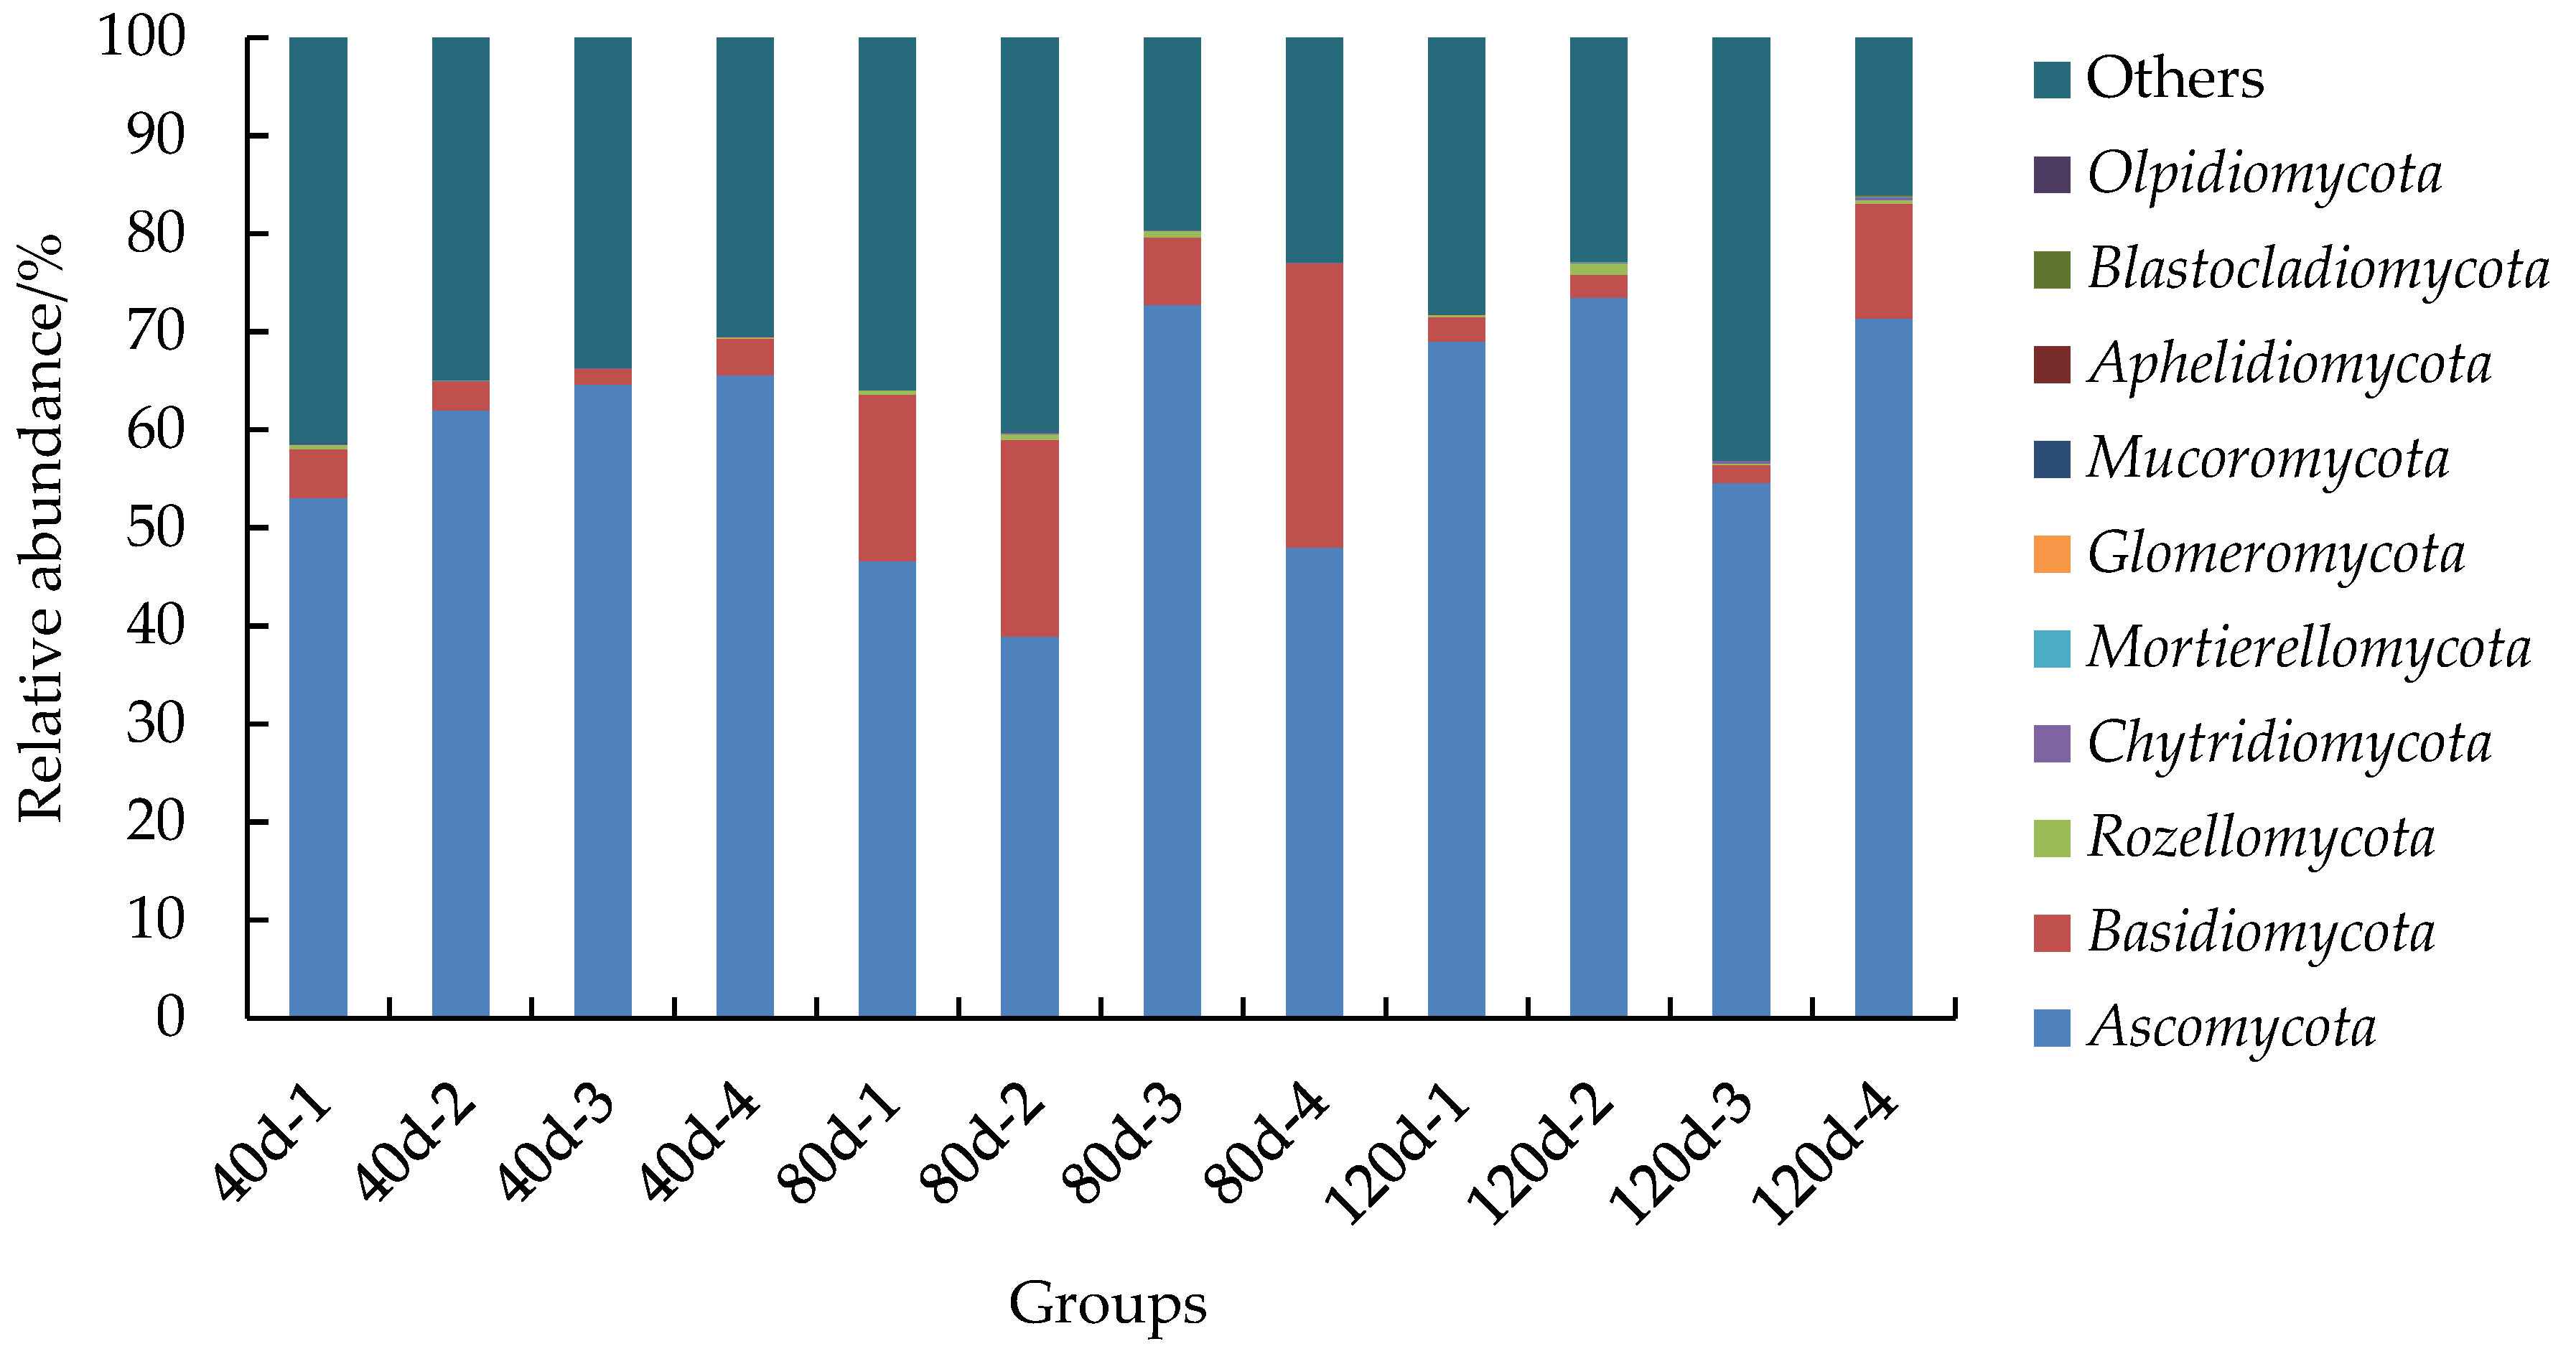
3.3.2. Relative Abundance of Fungi

Species numbers at each taxonomic level, except at the phylum level, decreased at 80 days and then increased at 120 days. At the fungal phylum level, Ascomycota and Basidiomycota were the most abundant, with Ascomycota being the dominant phylum (Table 4). As phosphorus levels increased, abundance generally rose progressively with higher fertilizer application. At 80 days, the abundance in the LP treatment was lower than in CK, while the MP and HP treatments were higher than in CK. At 120 days, the LP and HP treatments showed higher levels than CK, whereas the MP treatment was lower. At 80 days, MP and HP abundances were higher than CK, but at 40 days, the relative abundance of Basidiomycota in phosphorus-treated soils was lower than that of CK. At 120 days, the LP and MP treatments had lower relative abundances than CK, whereas the HP treatment showed higher abundances. At 80 days, the relative abundances in LP and MP were significantly lower than that of CK, with HP also being lower. At 40 days, relative abundances in LP, MP, and HP were significantly below CK levels. By 120 days, LP and HP treatments exhibited more pronounced changes than CK, while the MP treatment showed a smaller effect (Figure 4).

3.4. Analysis of Soil Microbial Community Diversity of Idesia polycarpa Seedlings at Different Phosphorus Levels

Regarding the diversity of the bacterial community in the rhizosphere soil of Idesia polycarpa seedlings, Pielou’s evenness represents the evenness. Except for the HP sample at 80 d and the MP sample at 120 d, which were lower than the corresponding CK value, the rest of the phosphorus levels were higher than the corresponding CK value. Compared with CK, the evenness of CK was increased, with LP exhibiting the highest evenness. The coverage for each phosphorus level exceeded 98%, indicating that the sequencing results effectively reflect the actual bacterial community in the sample. The Chao1 index, which characterizes richness, showed that a higher value corresponds to more extraordinary species richness. At 40 d, community richness in LP and MP was higher than in CK, while in HP, it was lower than in CK. At 80 d, LP exhibited higher community richness. The Shannon and Simpson indices, which characterize diversity, showed that larger values correspond to higher community diversity. At 40 d, both indices showed that the community diversity of LP, MP, and HP was greater than that of CK. At 80 d, the bacterial community diversity of LP and MP increased compared with CK, the HP decreased, and the LP was significantly higher than the HP. Moreover, at 120 d, the LP value was higher than the CK value (Table 5).
At 40 days, the evenness of fungal communities at all phosphorus levels was lower than that of the CK sample. By 80 days, the MP treatment had lower evenness than CK, whereas the LP and HP treatments displayed higher evenness. The phosphorus level and HP remained lower than that of CK. The coverage of each phosphorus level at all time points exceeded 99%. The Chao1 index, indicating richness, showed that fungal community richness at each phosphorus level at 40 days was lower than that of CK, decreasing by 5.21%, 14.18%, and 25.17%, respectively. At 80 days, richness at all phosphorus levels was higher than that of CK, while at 120 days, LP and HP had lower richness than CK, and MP showed higher richness. Overall richness followed the following trend: 40 days > 120 days > 80 days. The Shannon and Simpson indices, representing community diversity, revealed that diversity at each phosphorus level was lower than that of CK at 40 days. At 80 days, LP and HP had higher diversity than CK, and this trend continued at 120 days. The phosphorus level in HP was lower than that of CK, while MP showed higher diversity (Table 6).

3.5. Correlation Analysis of AP and pH Value of Rhizosphere Soil of Idesia polycarpa on Bacteria and Fungi in Different Periods

The correlation heatmap analysis of environmental factors and microbial phyla-level data revealed associations between bacterial and microbial community structures and various environmental factors, including nutrient elements and soil physical properties. The findings revealed significant correlations within the bacterial community at 40 d, where AP displayed a notably positive correlation with Epsilonbacteraeota, Fusacterobia, and Dadabacteria while exhibiting a negative correlation with Kiritimatiellaeota and WS2. Conversely, the pH value demonstrated a positive correlation with WS4 and a significant negative correlation with Fusobacteria (Figure 5a). For fungi within the community at 40 d, AP exhibited negative correlations with the most dominant fungal phyla yet displayed positive correlations with Glomeromycota and negative correlations with Chytridiomycota. Conversely, the pH value demonstrated opposite trends relative to AP concerning dominant fungal phyla, with positive correlations observed with Chytridiomycota and negative correlations with Ascomycota and Rozellomycot (Figure 5b). In the bacterial community at 80 d, available phosphorus (AP) exhibited negative correlations with the most dominant bacterial phyla. Notably, AP showed significant positive correlations with Gemmatimonadetes and Chloroflexi while demonstrating significant negative correlations with Kiritimatiellaeota, Nitrospirae, Cyanobacteria, and Latescibacteia. Conversely, the pH value displayed an opposite trend compared to AP concerning dominant bacterial phyla. Specifically, it was significantly positively correlated with Kiritimatiellaeota and negatively correlated with Chloroflexi (Figure 5c).
Regarding the fungal community at 80 d, AP showed positive correlations with Mucoromycota and negative correlations with Rozellomycota. The pH value exhibited trends opposite to AP regarding dominant bacterial phyla. It was positively correlated with Rozellomycota and negatively correlated with Mucoromycota (Figure 5d). In the correlation analysis of bacterial communities at 120 d, AP was significantly negatively correlated with most dominant bacterial phyla, among which were Elusimicrobia, Kiritimatiellaeota, Omnitrophicaeota, Hydrogenedentes, Verrucomicrobia, and Chlamydiae. The AP showed a significantly positive correlation with Epsilonbacteraeota and was positively correlated with Dadabacteria. The pH value was the opposite of the dominant bacterial phyla relative to AP, which was significantly positively correlated with Kiritimatiellaeota and Omnitrophicaeota, while Elusimicrobia and Verrucomicrobia were positively correlated. In addition, Proteobacteria (Epsilonbacteraeota) and TA06 were negatively correlated (Figure 5e). In the correlation analysis of fungal communities at 120 d, AP was positively correlated with Chytridiomycota, Blastocladiomycota, Mortierellomycota, and Basidiomycota, and showed negative correlation with Olpidiomycota and Ascomycota. In addition, correlation analysis of fungal communities with pH results showed that pH was correlated with Rozellomycota, Ascomycota, and Olpidiomycota. A negative correlation was found in pH with Chytridiomycota, Blastocladiomycota, and Basidiomycota (Figure 5f).

3.6. Prediction and Analysis of Soil Microbial Community Function of Idesia polycarpa Seedlings at Different Phosphorus Levels

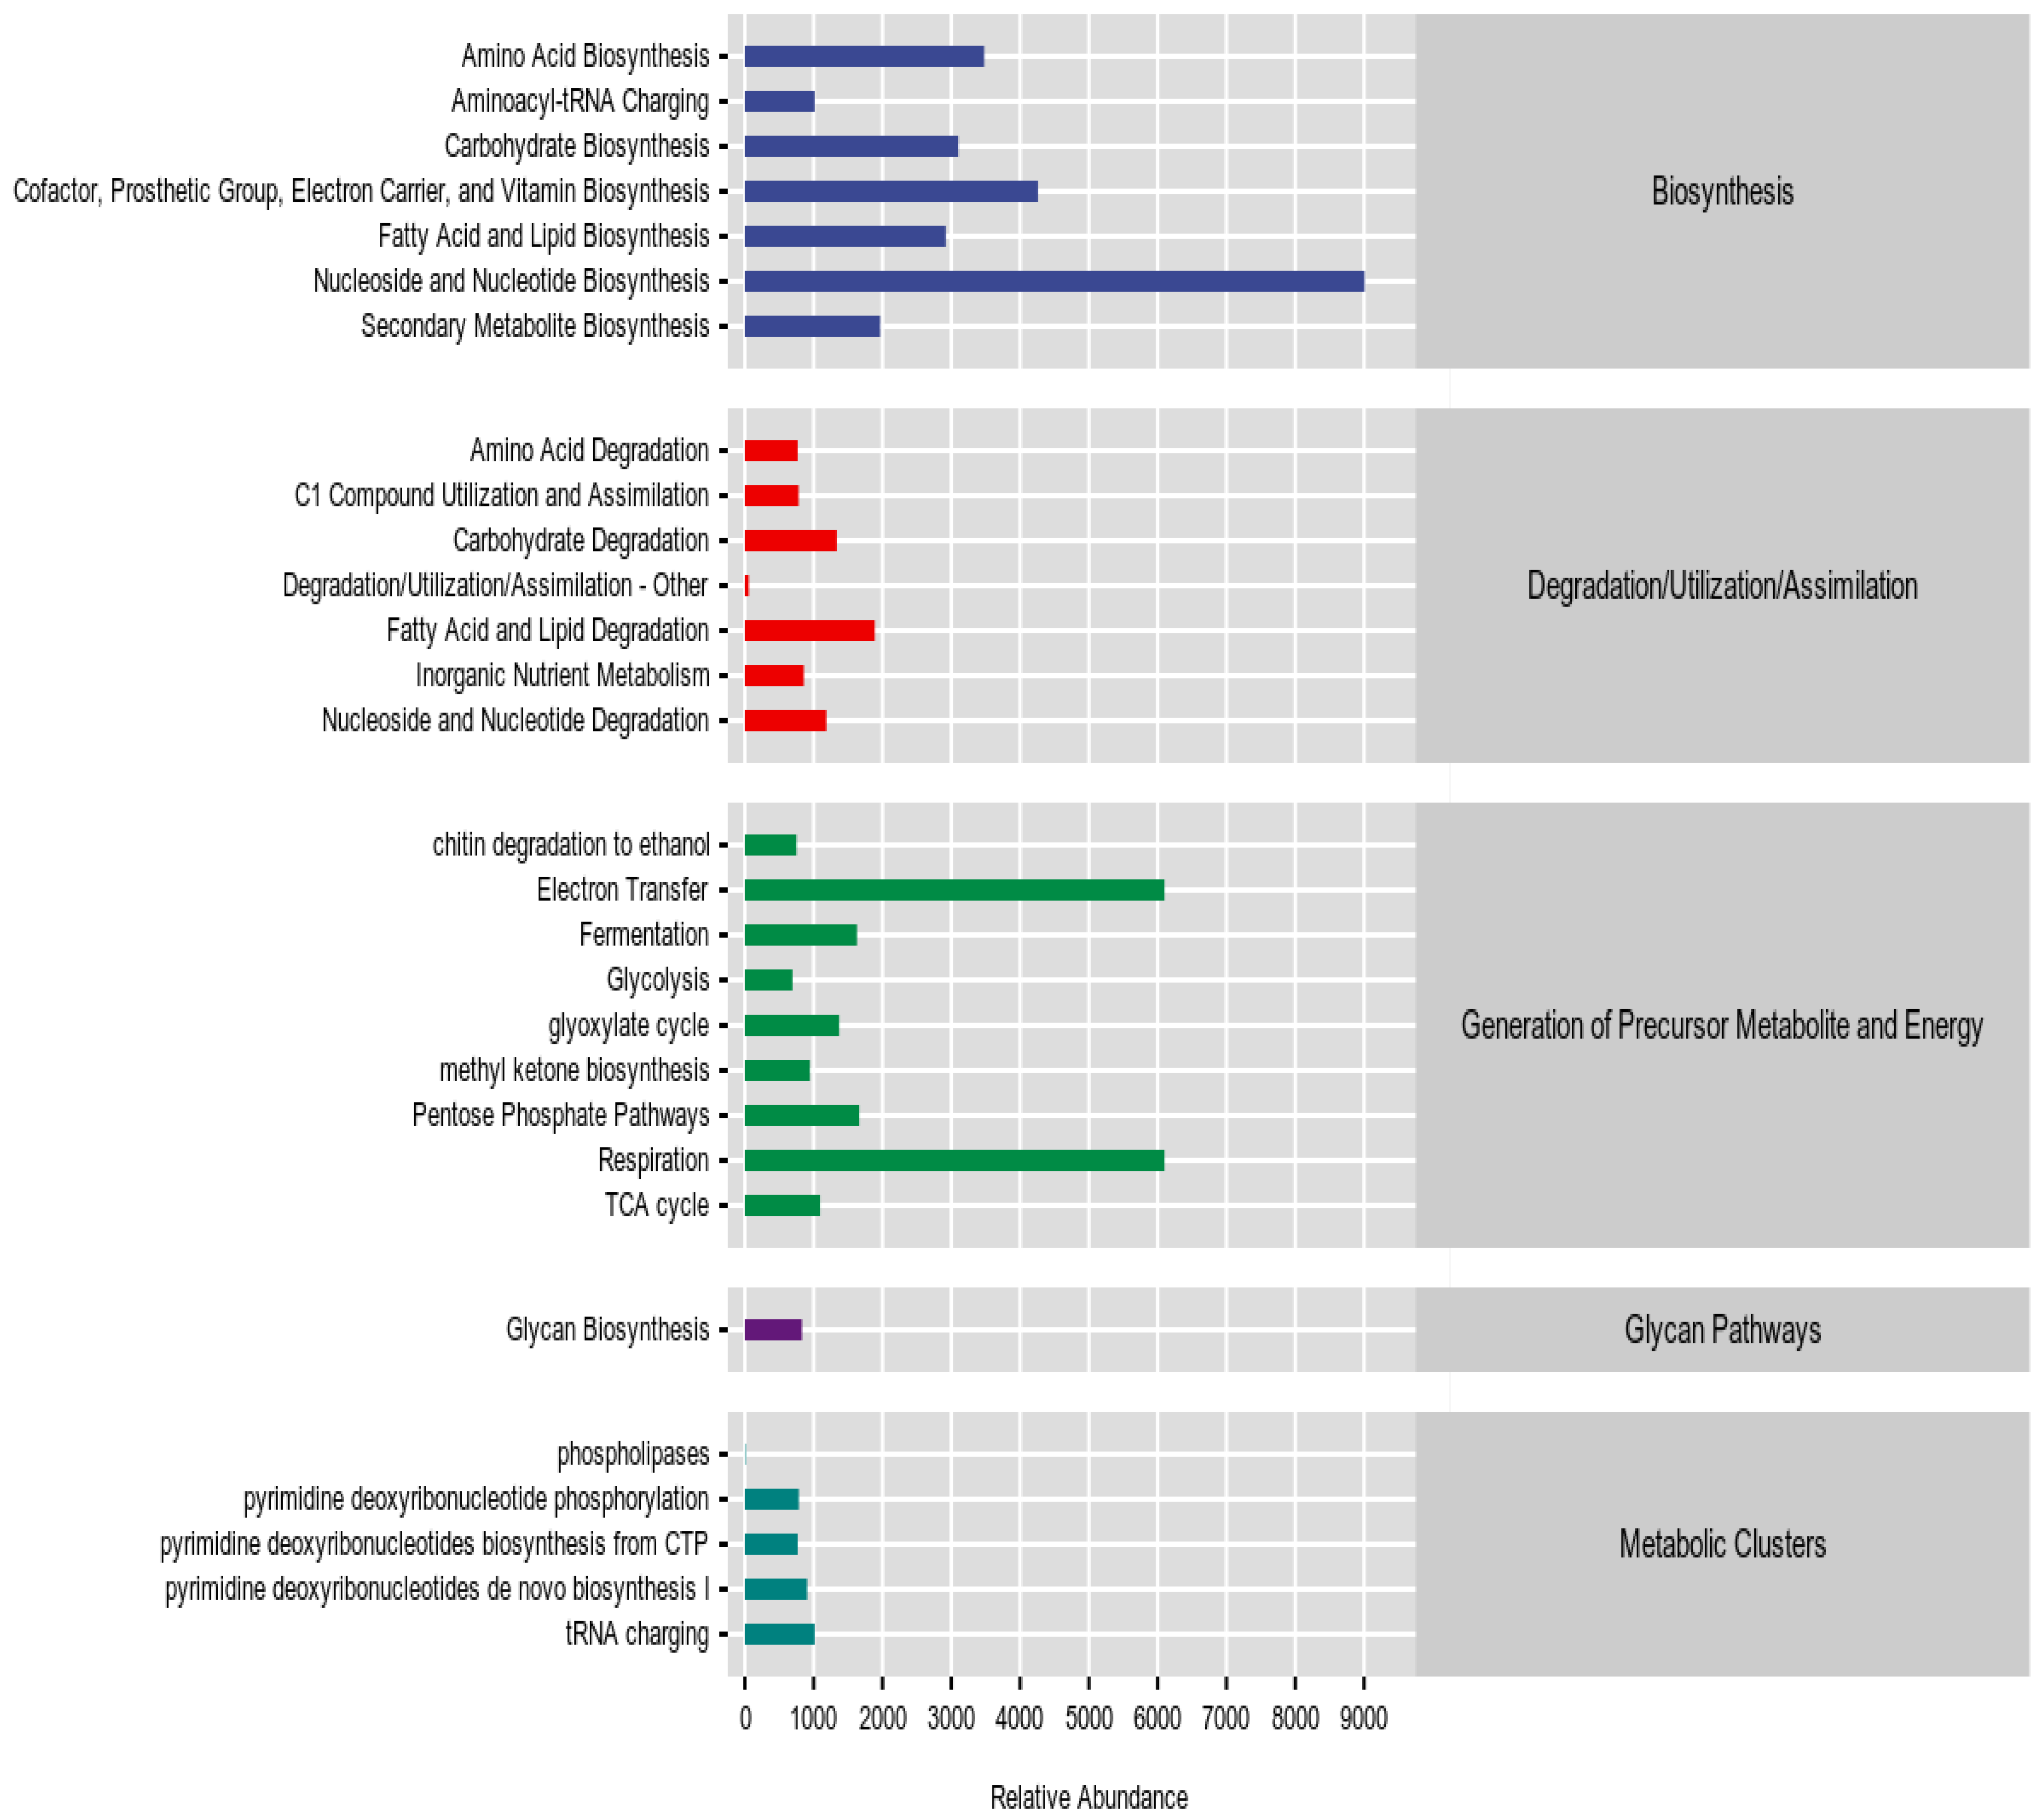
3.6.1. Metabolic Pathway Analysis

The bacterial community was analyzed using the KEGG database, and the results were categorized into six primary metabolic pathways: cellular processes, environmental information processing, genetic information processing, human diseases, metabolism, and organismal systems. Among these, metabolism and genetic information processing were the predominant pathways. At 40 days, the average abundance of these two pathways constituted 81.27% and 11.85% of the total functional classification, respectively. By 80 days, their average abundances were 81.34% and 12.03%; at 120 days, they were 81.32% and 11.92%. Although the proportion of these pathways increased slightly over time, the changes were insignificant (Figure 6).
Using the MetaCyc database, we analyzed the fungal community in the rhizosphere soil of Idesia polycarpa seedlings and identified five key metabolic pathways: biosynthesis, degradation/utilization/assimilation, Generation of Precursor Metabolite and Energy, Glycan Pathways, and Metabolic Clusters. Among these, the most prominent pathways were biosynthesis, Generation of Precursor Metabolite and Energy, and degradation/utilization/assimilation. At 40 days, their average abundances were 44.96%, 35.51%, and 11.99% of the total functional classification, respectively. At 80 days, these abundances were 45.11%, 34.79%, and 12.45%, and at 120 days they were 46.01%, 33.79%, and 12.95%. The biosynthesis and degradation/utilization/assimilation functions increased while the Generation of Precursor Metabolite and Energy function decreased (Figure 7).

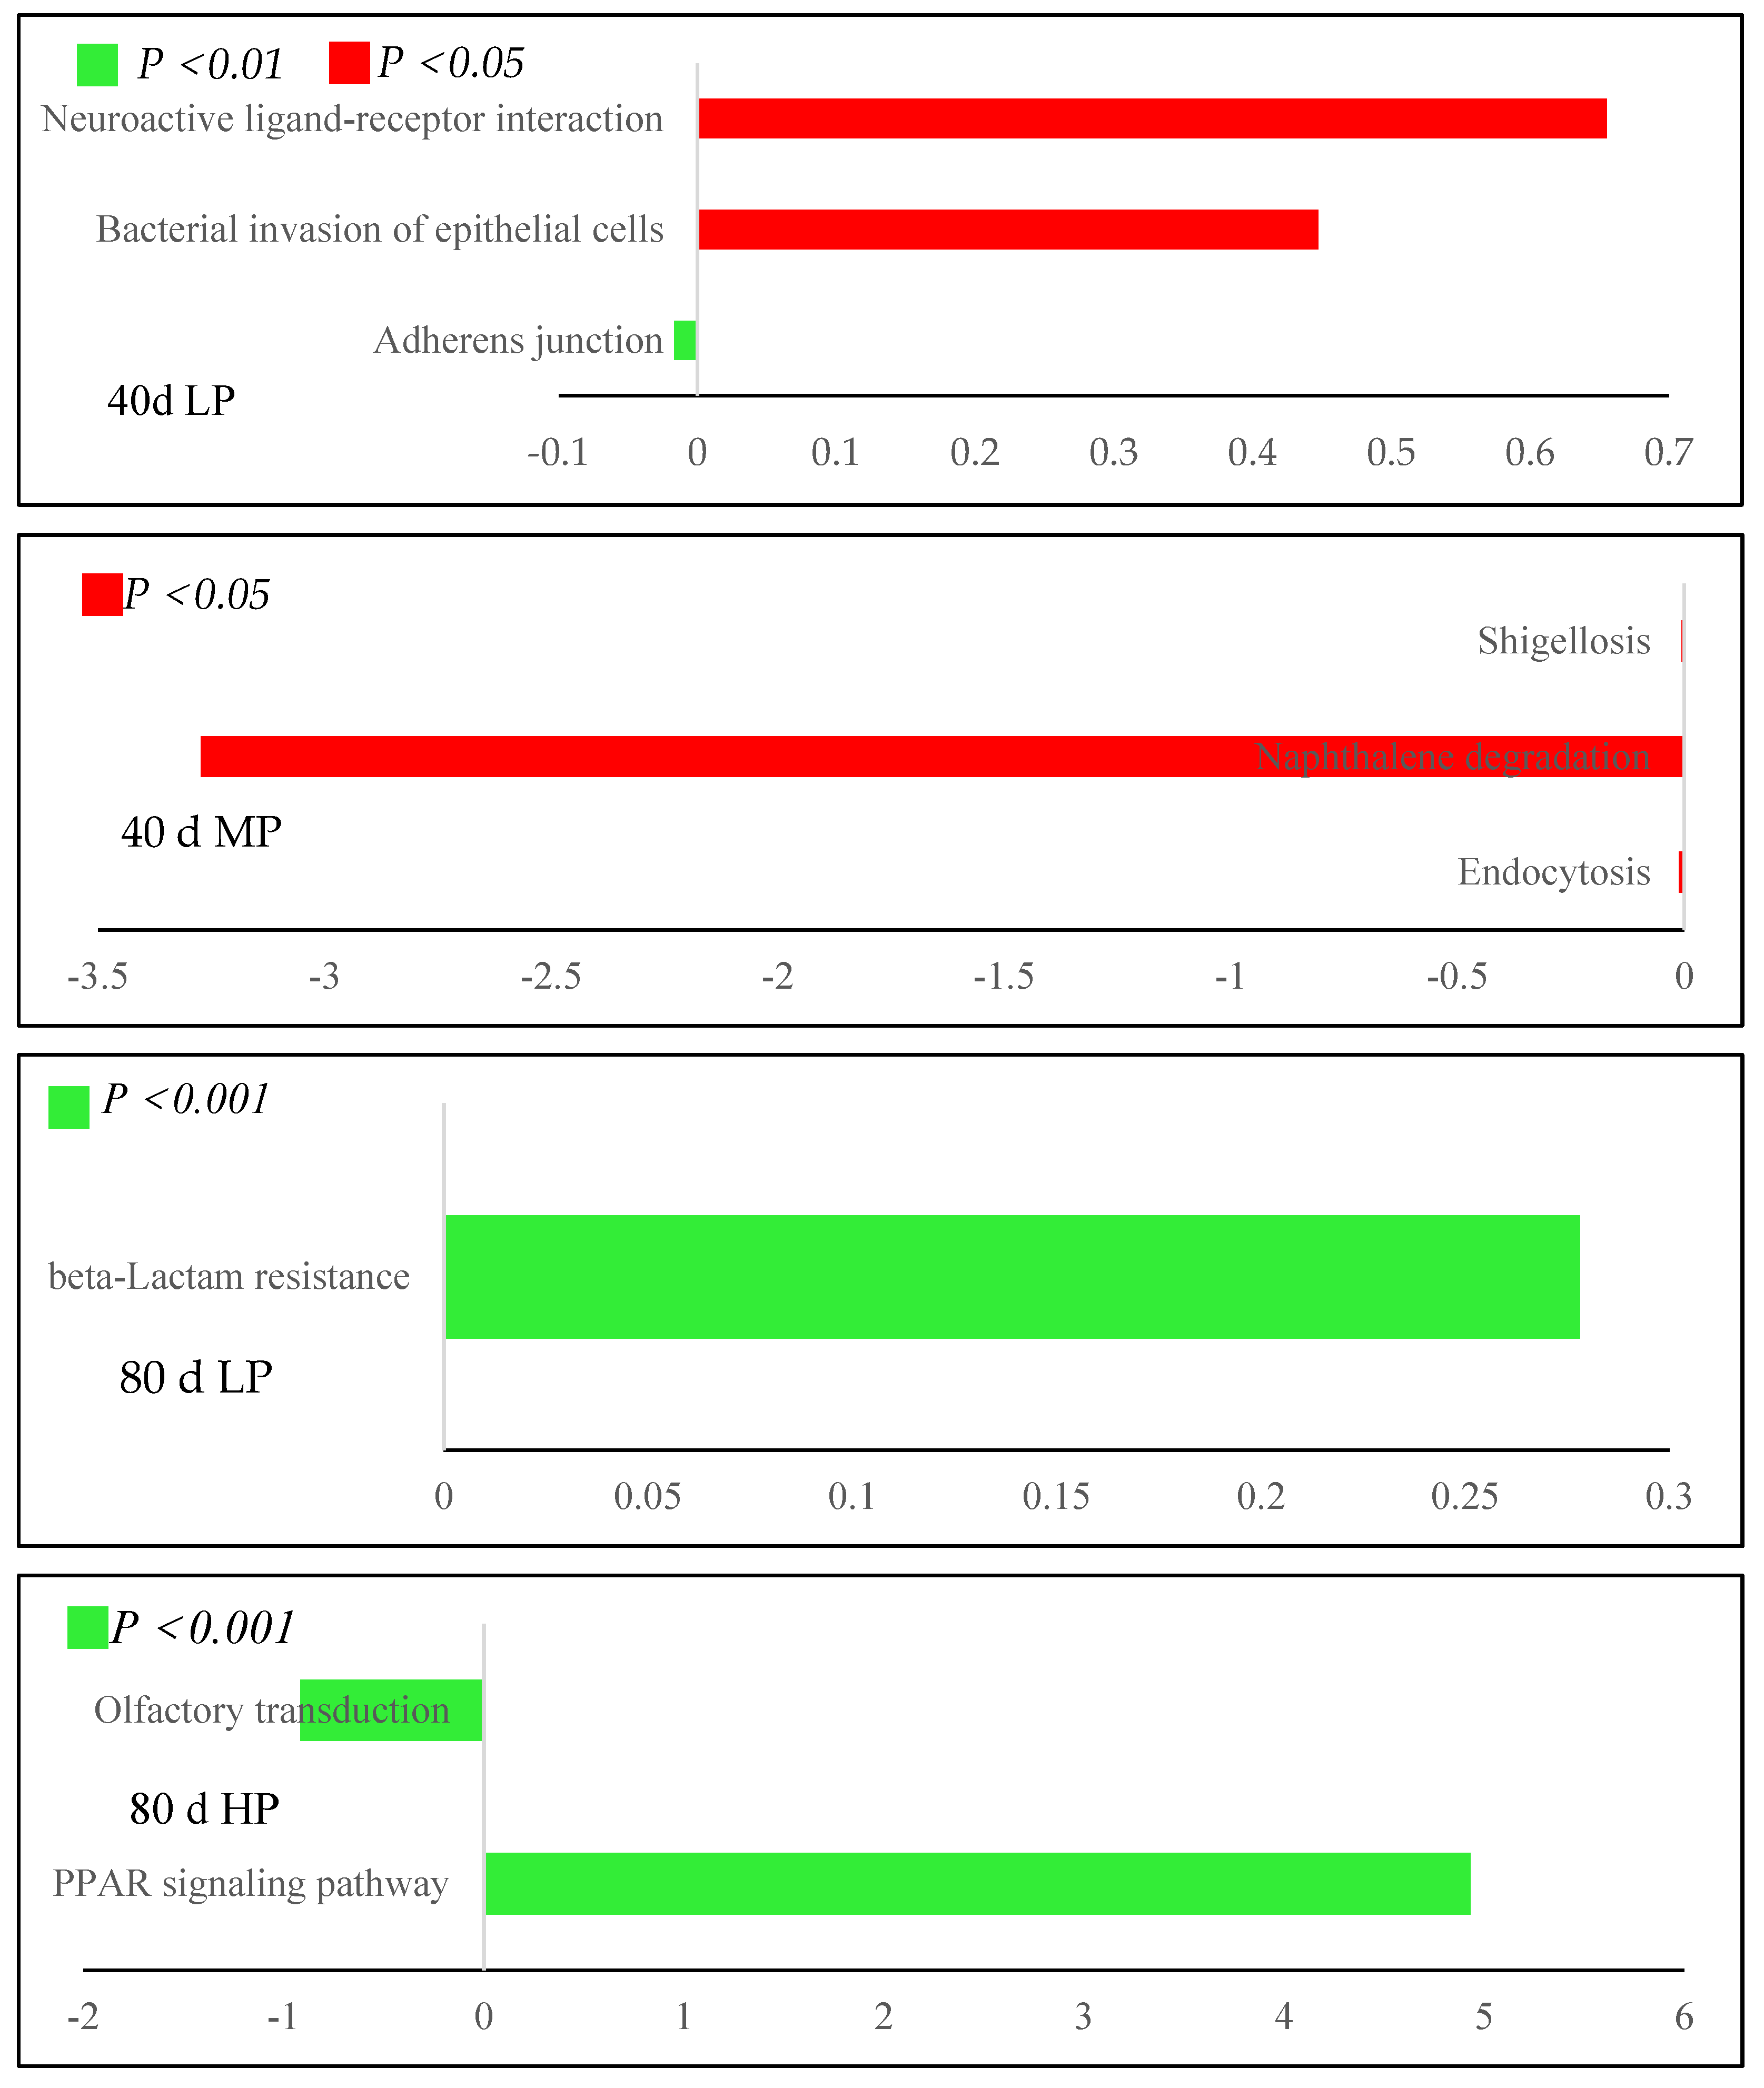
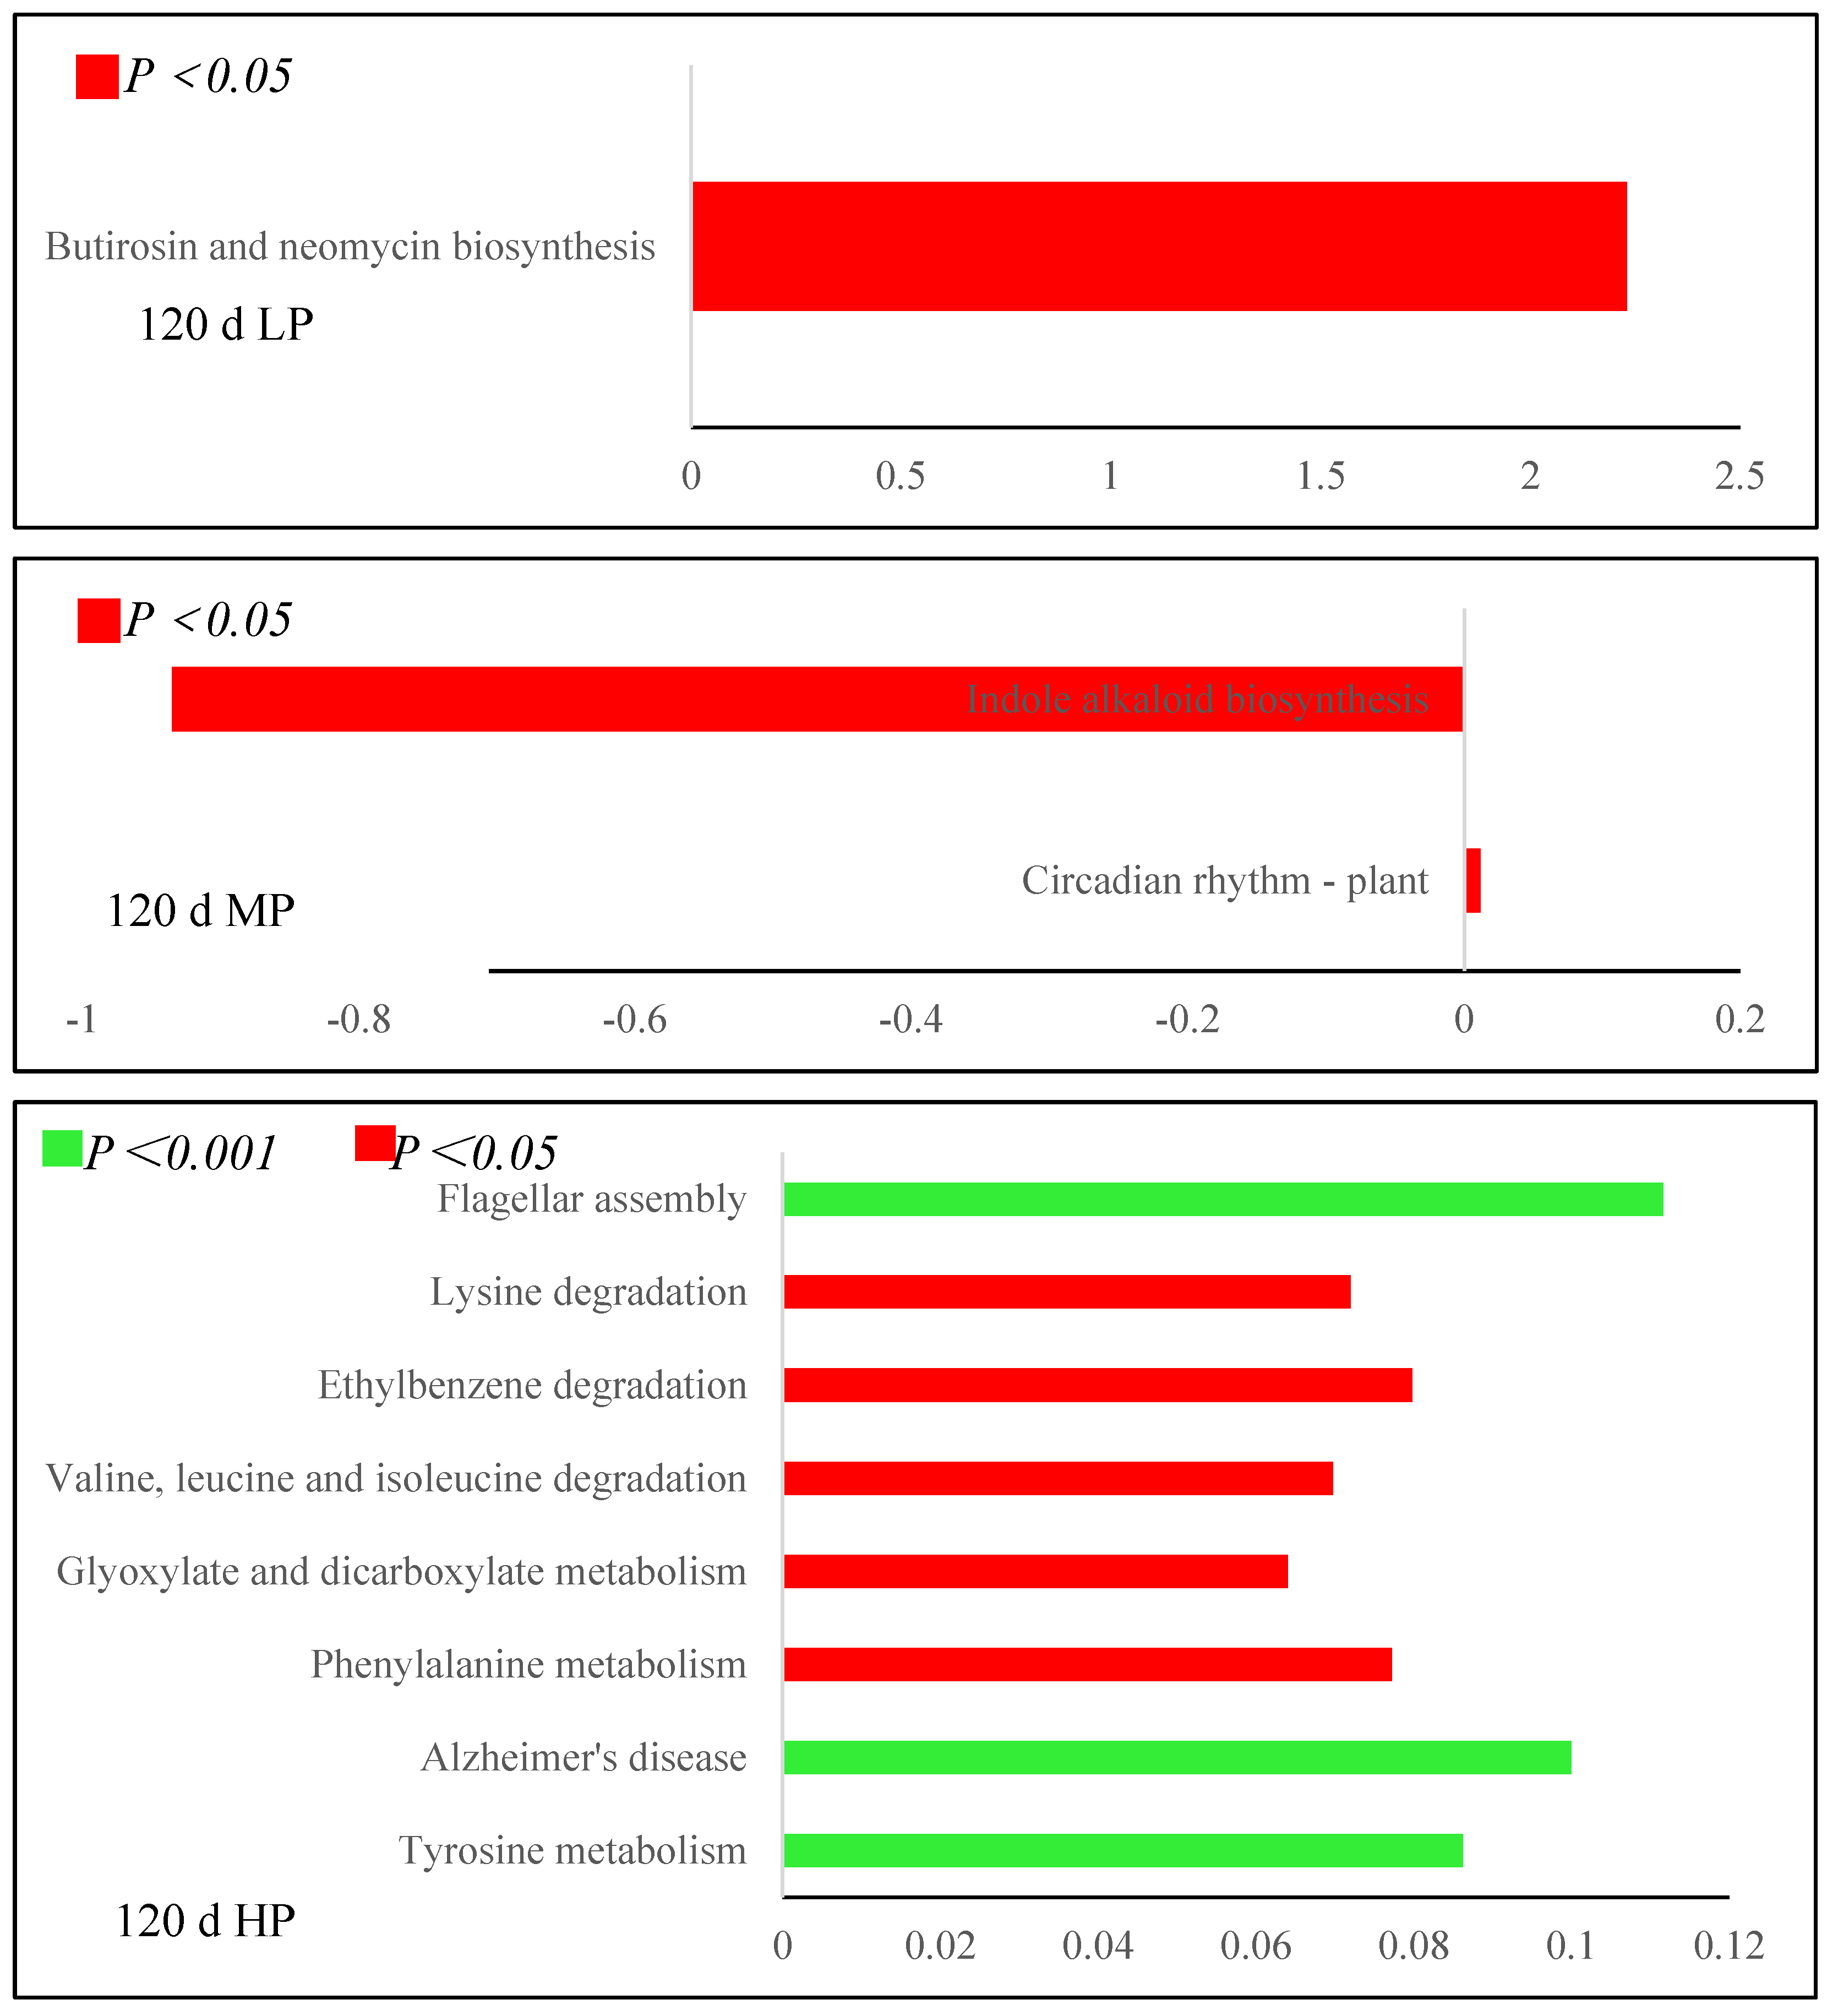
3.6.2. Metabolic Pathway Difference Analysis

The extensive dataset on existing metabolic pathways was meticulously analyzed using the metagenomeSeq method, enabling a comparative assessment between each phosphorus level group and the control (CK). This approach allowed us to identify microbial functional categories exhibiting significant differences across various phosphorus levels. The results showed differences in bacterial metabolic pathways (Figure 8). Compared with the CK sample, the functions of neuroactive ligand–receptor interaction and bacterial invasion of the epithelial cell pathway in LP significantly increased, and the genes related to the Adherens junction pathway significantly decreased. The functional genes related to Endocytosis, Naphthalene degradation, and the Shigellosis pathway in MP were significantly lower than those in CK. The HP did not detect metabolic pathways with significant differences between groups. At 80 d, the LP treatment group exhibited a notable upsurge in the abundance of functional genes associated with the beta-lactam resistance pathway. Moreover, the functional genes linked to the PPAR signaling pathway in HP were significantly elevated compared to those in the CK sample.
In contrast, those associated with the Olfactory transduction pathway showed a significant decrease. At 120 d, a significant increase in functional genes related to the Butirosin and neomycin biosynthesis pathway was observed in LP compared to CK. Similarly, the functional genes associated with the Circadian rhythm–plant pathway in MP were significantly higher than in CK. In contrast, those related to the Indole alkaloid biosynthesis pathway were notably lower. In HP, functional genes linked to Flagellar assembly, Tyrosine metabolism, and the Alzheimer’s disease pathway were significantly elevated relative to CK. Additionally, the Phenylalanine metabolism, Glyoxylate and dicarboxylate metabolism, Valine, leucine and isoleucine degradation, Ethylbenzene degradation, and Lysine degradation pathways exhibited significantly higher functional gene expression levels compared to CK.
In the fungal community, at 120 d, LP revealed two significantly distinct metabolic pathways. Specifically, functional genes associated with the gamma-glutamyl cycle and gluconeogenesis I pathway were significantly higher in LP than in CK. No significant differences were detected in metabolic pathways at other time points or phosphorus levels (Figure 9).

4. Discussion

Our study suggests that applying varying proportions of phosphorus at different growth stages can change the physicochemical properties of seedling rhizosphere soil. The pH level of rhizosphere soil plays a crucial role in influencing soil nutrients and the activity of soil microorganisms, consequently impacting plant growth and development [46]. Compared to the CK group, the rhizosphere soil treated with LP exhibited the highest increase in overall pH among all treatment groups. The pH of MP and HP decreased, but there was no significant difference in the pH value of the four treatment groups. Unlike the whole, the pH of HP was significantly lower than that of CK at 120 d. No significant disparity between phosphorus levels and the control (CK) was observed for the remaining study period. This phenomenon could potentially stem from variations in plant growth exudates across different growth stages [47]. The addition of phosphorus enhanced the soil’s available phosphorus content, exhibiting an upward trajectory correlating with increased phosphorus application. This increase can be attributed to the substantial phosphorus content present in phosphorus fertilizer. As fertilizer application intensifies, so does the influx of phosphorus into the soil. Consequently, the soil’s capacity to retain phosphorus weakened, leading to enhanced phosphorus release into the matrix [48]. Nonetheless, owing to the prolonged residual duration of phosphorus fertilizer, the phosphorus applied in a given year may not be entirely utilized and instead persists in the soil in alternate forms, rendering it less readily absorbed and utilized by crops [49], and this observation aligns with the findings of our study. Based on the pH value and available phosphorus (AP) content results, further investigation into the effects of applying varying phosphorus levels on Idesia polycarpa seedlings is warranted.
The soil microbial community structure is intricate and pivotal in nutrient cycling, particularly in regulating plant phosphorus efficacy [50]. Our study findings revealed a decrease in bacterial operational taxonomic units (OTUs) over time, with LP consistently exhibiting the highest increases at each time point, while HP displayed weakening or inhibitory effects. Alpha index analysis indicated that during early growth and rapid growth stages, low phosphorous to MP enhanced the richness and diversity of bacterial communities, with marginal changes observed in HP. However, increased phosphorus towards the end of the growth phase reduced bacterial community richness. Conversely, fungal community richness and diversity decreased with early phosphorus application, with inhibition intensifying as phosphorus levels increased. LP notably increased fungal community richness and diversity during the rapid growth stage of Idesia polycarpa seedlings, surpassing other phosphorus levels in terms of richness and diversity.
By conducting correlation analyses between the levels of predominant bacterial and fungal phyla and the physicochemical properties of rhizosphere soil, we determined that the microbial community structure of Idesia polycarpa seedlings is notably influenced by soil pH and AP. Specifically, the abundance of bacterial phyla was influenced by soil pH at 80 and 120 d, while AP impacted bacterial phyla levels at 40 d. Regarding fungal phyla levels, soil pH influenced them at 40 and 80 d, whereas AP affected them at 120 d. The above findings align with previous studies [51], highlighting physicochemical properties such as pH [52] and AP as crucial environmental factors influencing microbial species and structure [53].
Recent studies on inorganic and organic fertilizers have consistently highlighted key bacterial phyla, including Proteobacteria, Acidobacteria, Chloroflexi, and Actinobacteria, as prevalent across various soil samples. Their combined relative abundance typically exceeds 70% within bacterial communities [54,55]. For this study, the top ten dominant bacterial phyla, based on relative abundance, were selected for analysis. Results indicated a high degree of similarity in the bacterial phyla with the highest relative abundance across different phosphorus levels. Notably, Proteobacteria in the soil can harness light energy for energy conversion and material metabolism [56], while Actinobacteria and Bacteroidetes exhibit phosphorus-dissolving effects. Chloroflexi can hydrolyze polysaccharides like cellulose, xylan, and chitin, which are vital for plant residue degradation and play a significant role in nitrate decomposition [57]. Analysis across different time points revealed no significant difference in the dominant bacterial flora under varying phosphorus levels, with Proteobacteria exhibiting the highest average relative abundance. Our findings corroborate similar observations made by Hou regarding Chloroflexi, Actinobacteria, and Bacteroidetes [58]. Similarly, in a study on the impact of phosphate fertilizers on cotton, the dominant fungal phyla were consistent with our findings, with Ascomycota comprising 60.02% of the total relative abundance. This was followed by Basidiomycota as the second-ranked phylum with an average relative abundance of 8.70% across different phosphorus application levels [59]. Nie [60] and Chen [61] demonstrated that the soil fungal community is predominantly composed of Basidiomycetes and Ascomycota, aligning with the findings of this study.

5. Conclusions

Phosphate fertilizer application improved the soil pH and AP levels of Idesia polycarpa seedlings in rhizosphere soil. The LP treatment significantly increased soil pH, while the HP treatment increased AP levels. Moreover, the LP treatment also substantially increased the number of OTUs and the richness and diversity of microbial communities. Additionally, phosphate fertilization significantly altered the composition of the bacterial community, which had a close association with the soil pH and AP levels. In functional prediction, the metabolic process is the bacterial community’s first and most significant function in rhizosphere soil, while the fungal community mainly participates in the biosynthetic process. Notably, 20 differential metabolic pathways exist in the bacterial community compared to CK treatment, and only two were found to be differential in the fungal community under LP treatment. These results suggest that LP application should be prioritized for optimal growth in Idesia polycarpa seedlings.

Author Contributions

Conceptualization, S.W., S.R., T.Z. and Z.L. (Zhi Li); methodology, S.W., S.R., T.Z. and Z.L. (Zhi Li); software, Q.Y., Y.Y., C.M., H.Z. and H.P.; formal analysis, S.W., S.R., T.Z., Q.Y., Y.Y., C.M., H.Z. and H.P.; investigation, S.W., S.R., T.Z., Q.Y., Y.Y., C.M., H.Z. and H.P.; resources, Y.W., Z.L. (Zhen Liu), Q.C., X.G., L.D. and Z.L. (Zhi Li); visualization, S.R., Y.W., Z.L. (Zhen Liu), Q.C., X.G., L.D. and Z.L. (Zhi Li); project administration, Y.W., Z.L. (Zhen Liu), Q.C., X.G., L.D. and Z.L. (Zhi Li); funding acquisition, Z.L. (Zhi Li); writing—original draft preparation, S.W. and S.R.; writing—review and editing, S.R. and Z.L. (Zhi Li). All authors have read and agreed to the published version of the manuscript.

Funding

This research was funded by the Henan Province Postdoctoral Research Project of China (202002053); The Teaching Reform Research and Practice Project of Henan Agricultural University (2022XJGLX054); Postgraduate Education Reform and Quality Improvement Project of Henan Province (YJS2023AL048/YJS2024AL062); The Numerous Experts Participate in Science and Education Service Action Project of Henan Agricultural University (2024SFBQW30); Science and Technology Plan of Pingxiang City, Jiangxi Province, China (202002).

Data Availability Statement

Data will be made available on request.

Acknowledgments

We are grateful to the reviewers for their constructive comments and valuable suggestions, which have helped improve the quality of the paper. We also thank all our laboratory members for their help in this experiment.

Conflicts of Interest

The authors declare no conflicts of interest.

References

  1. Zhu, Z. Research on the Ecological Characteristics and Reproduction Technology of Idesia polycarpa. Master’s Thesis, Nanjing Forestry University, Nanjing, China, 2005. [Google Scholar]
  2. Liu, G.; Liang, Z. Review on the research of Idesia polycarpa. Jiangsu For. Sci. Technol. 2005, 5, 50–53. [Google Scholar] [CrossRef]
  3. Wang, Y.; Wang, D.; Liu, Z. Analysis of oil content and fatty acid GC/MS in Idesia polycarpa seeds from different provenances. J. Henan Agric. Univ. 2011, 45, 530–533. [Google Scholar] [CrossRef]
  4. Baek, S.H.; Kim, D.; Lee, C. Idescarpin isolated from the fruits of Idesia polycarpa inhibits melanin biosynthesis. J. Microbiol. Biotechnol. 2006, 16, 667–672. [Google Scholar]
  5. Lee, M.; Lee, H.H.; Lee, J.K. Anti-adipogenic activity of compounds isolated from Idesia polycarpa on 3T3-L1 cells. Bioorg. Med. Chem. Lett. 2013, 23, 3170–3174. [Google Scholar] [CrossRef]
  6. Huang, L.; Zeng, Y.; Li, F. Polyphenolic compounds from Idesia polycarpa Maxim fruits ameliorate non-alcoholic fatty liver disease by modulating lipid metabolism in oleic acid-induced HepG2 cells and high-fat diet-induced mice. J. Funct. 2023, 108, 1756–4646. [Google Scholar] [CrossRef]
  7. Guo, J.; Wang, C.; Li, C.; Liu, Y. Effect of acetylation on the physical and mechanical performances of mechanical densified spruce wood. Forests 2022, 13, 1620. [Google Scholar] [CrossRef]
  8. Chen, Y.; Hu, X.; Chen, G. Wood properties of Idesia polycarpa. J. Northwest A&F Univ. 2023, 51, 40–48+58. [Google Scholar]
  9. Li, H.; Wang, Y.; Xie, W. Preparation and characterization of soybean protein adhesives modified with an environmental-friendly tannin-based resin. Polymers 2023, 15, 2289. [Google Scholar] [CrossRef]
  10. Deng, Z.; Gao, M.; Wang, Y. Effects of chemical fertilizer reduction combined with organic fertilizer application on bacterial community structure in rhizosphere/non-rhizosphere soil of lemon. Chin. J. Environ. Sci. 2023, 44, 1074–1084. [Google Scholar] [CrossRef]
  11. Shao, Q.; Dong, C.; Han, Y. Research progress in the rhizosphere microbiome of plants. J. Plant Nutr. Fert. 2021, 27, 144–152. [Google Scholar]
  12. Dengzeng, Z.M.; Ma, W.; Zhou, Q. Research progress of rhizosphere soil microorganisms at home and abroad based on bibliometric analysis. Soil Fert. Sci. China. 2022, 302, 236–246. [Google Scholar] [CrossRef]
  13. Niu, X.; Sun, X.; Chen, D. Soil microorganisms, nutrients and enzyme activity of Larix kaempferi plantation under ages in mountainous region of eastern Liaoning Province, China. Chin. J. Appl. Ecol. 2015, 26, 2663–2672. [Google Scholar] [CrossRef]
  14. Li, Y.; Tremblay, J.; Bainard, L.D. Long-term effects of nitrogen and phosphorus fertilization on soil microbial community structure and function under continuous wheat production. Environ. Microbiol. 2020, 22, 1066–1088. [Google Scholar] [CrossRef]
  15. Xun, W.; Zhao, J.; Xue, C. Significant alteration of soil bacterial communities and organic carbon decomposition by different long-term fertilization management conditions of extremely low-productivity arable soil in South China. Environ. Microbiol. 2016, 18, 1907–1917. [Google Scholar] [CrossRef] [PubMed]
  16. Schachtman, D.P.; Reid, R.J.; Ayling, S.M. Phosphorus uptake by plants: From soil to cell. Plant Physiol. 1998, 116, 447–453. [Google Scholar] [CrossRef] [PubMed]
  17. Deng, H.; Wang, Y.; Guo, J. Absorption and utilization of phosphorus by plants. Rural Sci. Tech. 2022, 13, 71–75. [Google Scholar] [CrossRef]
  18. Saleem, M.; Hu, J.; Jousset, A. More than the sum of its parts: Microbiome biodiversity as a driver of plant growth and soil health. Annu. Rev. Ecol. Evol. Syst. 2019, 50, 145–168. [Google Scholar] [CrossRef]
  19. Wu, J.Q. Effects of Vegetation Degradation on Soil Physicochemical Properties and Enzyme Activities in Gahai Wet Meadow. Ph.D. Thesis, Gansu Agricultural University, Lanzhou, China, 2021. [Google Scholar] [CrossRef]
  20. Ren, B.; Hu, Y.; Bu, R. Vertical distribution patterns and drivers of soil bacterial communities across the continuous permafrost region of northeastern China. Ecol. Process. 2022, 11, 1–13. [Google Scholar] [CrossRef]
  21. Wang, B.; Xu, M.; Wen, S. The effect of long term fertilizer application on phosphorus in red upland soil. Chin. Agric. Sci. Bull. 2007, 3, 254–259. [Google Scholar] [CrossRef]
  22. Zhang, Z.Y.; Zhang, P.; Lin, Q. Response of bacterial communities in rubber plantations to different fertilizer treatments. 3 Biotech 2019, 9, 293. [Google Scholar] [CrossRef]
  23. Gryta, A.; Frąc, M.; Oszust, K. Genetic and metabolic diversity of soil microbiome in response to exogenous organic matter amendments. Agronomy 2020, 10, 546. [Google Scholar] [CrossRef]
  24. Peng, Q.; He, H.; Fan, C. The interaction of phosphate and selenite in alkaline soil and accumulation by alfalfa (Medicago sativa L.). Arch. Agron. Soil Sci. 2020, 67, 122–135. [Google Scholar] [CrossRef]
  25. Liu, J.; Ma, Q.; Hui, X. Long-term high-P fertilizer input decreased the total bacterial diversity but not phoD-harboring bacteria in wheat rhizosphere soil with available-P deficiency. Soil Biol. Biochem. 2020, 149, 107918. [Google Scholar] [CrossRef]
  26. Lv, L. Effects of Exogenous Phosphorus on Ginseng Quality and Soil Physicochemical and Biological Characteristics. Master’s Thesis, Chinese Academy of Agricultural Sciences, Beijing, China, 2019. [Google Scholar]
  27. Sun, R.; Zhang, X.; Guo, X. Bacterial diversity in soils subjected to long-term chemical fertilization can be more stably maintained with the addition of livestock manure than wheat straw. Soil Biol. Biochem. 2015, 88, 9–18. [Google Scholar] [CrossRef]
  28. Ma, L.; Zhao, W.; Guo, Z. Effects of long-term application of phosphorus fertilizer on fungal community diversity, composition, and intraspecific interactions and variation with application rate in a lime concretion black soil. Acta Ecol. Sin. 2019, 39, 4158–4167. [Google Scholar]
  29. Li, S.; Sun, Y.; Liu, X. Effects of phosphate fertilizer on rhizosphere soil microenvironment and hay yield of alfalfa under drip irrigation. Acta Agrestia Sin. 2022, 30, 495–502. [Google Scholar] [CrossRef]
  30. Shi, Y.; Ziadi, N.; Hamel, C. Soil microbial biomass, activity and community structure as affected by mineral phosphorus fertilization in grasslands. Appl. Soil Ecol. 2020, 146, 103391. [Google Scholar] [CrossRef]
  31. Rana, S. Study on the Influence Mechanism of Water and Fertilizer Coupling on the Growth and Development of Idesia polycarpa Seedlings. Ph.D. Thesis, College of Forestry, Henan Agricultural University, Zhengzhou, China, 2024. [Google Scholar]
  32. Rana, S.; Liu, Z. Study on the pattern of vegetative growth in young dioecious trees of Idesia polycarpa maxim. Trees 2021, 35, 69–80. [Google Scholar] [CrossRef]
  33. Rana, S.; Jemim, R.S.; Li, Z.; Geng, X.D.; Wang, Y.M.; Cai, Q.F.; Liu, Z. Study on the pattern of reproductive allocation and fruit development in young dioecious trees of Idesia polycarpa Maxim. S. Afr. J. Bot. 2022, 146, 472–480. [Google Scholar] [CrossRef]
  34. Bao, S. Soil Agrochemical Analysis; China Agriculture Press: Beijing, China, 2000; pp. 263–270. [Google Scholar]
  35. Martin, M. CUTADAPT removes adapter sequences from high-throughput sequencing reads. EMBnet.journal 2011, 17. [Google Scholar] [CrossRef]
  36. Callahan, B.J.; McMurdie, P.J.; Rosen, M.J.; Han, A.W.; Johnson, A.J.; Holmes, S.P. DADA2: High-resolution sample inference from Illumina amplicon data. Nat. Methods 2016, 13, 581–583. [Google Scholar] [CrossRef] [PubMed]
  37. Barnes, C.J.; Rasmussen, L.; Asplund, M.; Knudsen, S.W.; Clausen, M.L.; Agner, T.; Hansen, A.J. Comparing DADA2 and OTU clustering approaches in studying the bacterial communities of atopic dermatitis. J. Med. Microbiol. 2020, 69, 1293–1302. [Google Scholar] [CrossRef]
  38. Quast, C.; Pruesse, E.; Yilmaz, P.; Gerken, J.; Schweer, T.; Yarza, P.; Peplies, J.; Glöckner, F.O. The SILVA ribosomal RNA gene database project: Improved data processing and web-based tools. Nucleic Acids Res. 2013, 41, D590–D596. [Google Scholar] [CrossRef]
  39. Kõljalg, U.; Nilsson, R.H.; Abarenkov, K.; Tedersoo, L.; Taylor, A.F.; Bahram, M.; Bates, S.T.; Bruns, T.D.; Bengtsson-Palme, J.; Callaghan, T.M.; et al. Towards a unified paradigm for sequence-based identification of fungi. Mol. Ecol. 2013, 22, 5271–5277. [Google Scholar] [CrossRef] [PubMed]
  40. Chao, A. Nonparametric estimation of the number of classes in a population. Scand. J. Stat. 1984, 11, 265–270. [Google Scholar]
  41. Simpson, E.H. Measurement of Diversity. Nature 1949, 163, 688. [Google Scholar] [CrossRef]
  42. Shannon, C.E. A mathematical theory of communication. Bell Syst. Tech. J. 1948, 27, 379–423. [Google Scholar] [CrossRef]
  43. Shannon, C.E. A mathematical theory of communication. ACM SIGMOBILE Mob. Comput. Commun. Rev. 2001, 5, 3–55. [Google Scholar] [CrossRef]
  44. Zgadzaj, R.; Garrido-Oter, R.; Jensen, D.B.; Koprivova, A.; Schulze-Lefert, P.; Radutoiu, S. Root nodule symbiosis in Lotus japonicus drives the establishment of distinctive rhizosphere, root, and nodule bacterial communities. Proc. Natl. Acad. Sci. USA 2016, 113, E7996–E8005. [Google Scholar] [CrossRef]
  45. Douglas, G.; Maffei, V.; Zaneveld, J.; Yurgel, S.; Brown, J.; Taylor, C.; Huttenhower, C.; Langille, M. PICRUSt2: An improved and customizable approach for metagenome inference. BioRxiv 2019. [Google Scholar] [CrossRef]
  46. Cao, S.; Ouyang, M.; Zhou, W. Soil pH and main nutrient characteristics of citrus orchards and their correation in Hunan Province. Soil Fert. Sci. China 2020, 285, 31–38. [Google Scholar] [CrossRef]
  47. Peng, T. Effects of Phosphorus Addition on Soil Nutrient Elements and Microorganisms in Young Phoebe bournei Plantations. Master’s Thesis, Central South University of Forestry and Technology, Changsha, China, 2022. [Google Scholar]
  48. Richardson, A.E.; Simpson, R.J. Soil microorganisms mediating phosphorus availability update on microbial phosphorus. Plant Physiol. 2011, 156, 989–996. [Google Scholar] [CrossRef] [PubMed]
  49. Cheng, Y.; Ishimoto, K.; Kuriyama, Y. Ninety-year-, but not single, application of phosphorus fertilizer has a major impact on arbuscular mycorrhizal fungal communities. Plant Soil 2013, 365, 397–407. [Google Scholar] [CrossRef]
  50. Tischer, A.; Blagodatskaya, E. Microbial community structure and resource availability drive the catalytic efficiency of soil enzymes under land-use change conditions. Soil Biol. Biochem. 2015, 89, 226–237. [Google Scholar] [CrossRef]
  51. Zhu, Y.; Guo, B.; Liu, C. Soil fertility, enzyme activity, and microbial community structure diversity among different soil textures under different land use types in coastal saline soil. J. Soils Sediments 2021, 21, 2240–2252. [Google Scholar] [CrossRef]
  52. Gao, P.; Tian, H.; Wang, Y. Spatial isolation and environmental factors drive distinct bacterial and archaeal communities in different types of petroleum reservoirs in China. Sci. Rep. 2016, 6, 20174. [Google Scholar] [CrossRef]
  53. Wu, J.; Liu, Y.; Zhou, X. Effects of long-term different fertilization on soil fungal communities in black soil based on the Illumina Mi Seq platform. Acta Microbiol. Sin. 2018, 58, 1658–1671. [Google Scholar] [CrossRef]
  54. Yang, Y.; Wang, P.; Zeng, Z. Dynamics of bacterial communities in a 30-year fertilized paddy field under different organic-inorganic fertilization strategies. Agronomy 2019, 9, 14. [Google Scholar] [CrossRef]
  55. Cui, X.; Zhang, Y.; Gao, J. Long-term combined application of manure and chemical fertilizer sustained higher nutrient status and rhizospheric bacterial dibersity in reddish paddy soil of Central South China. Sci. Rep. 2018, 8, 16554. [Google Scholar] [CrossRef]
  56. He, Q. Effects of Phosphorus Application Rate and Combined Application of Organic and Inorganic Fertilizer on Soil Microorganism, Phosphorus Status and Yield in Cotton Field. Master’s Thesis, Xinjiang Agricultural University, Xinjiang, China, 2022. [Google Scholar] [CrossRef]
  57. Yabe, S.; Aiba, Y.; Sakai, Y. Thermosporothrix hazakensis gen. nov., sp.nov., isolated from compost, description of Thermosporotrichaceae fam. Nov. within the class Ktedonobacteria Cavaletti et al. 2007 and emended description of the class Ktedonobacteria. Int. J. Syst. 2010, 60, 1794–1801. [Google Scholar] [CrossRef]
  58. Hou, T. Effects of Phosphate Fertilizer Application on Phosphorus Uptake and Soil Microbial Community Structure of Cotton under Mulch Drip Irrigation. Master’s Thesis, Xinjiang Agricultural University, Xinjiang, China, 2022. [Google Scholar] [CrossRef]
  59. Lauber, C.L.; Strickland, M.S.; Bradford, M.A. The influence of soil properties on the structure of bacterial and fungal communities across land-use types. Soil Biol. Biochem. 2008, 40, 2407–2415. [Google Scholar] [CrossRef]
  60. Nie, S.; Wang, Y.; Lei, X. Responses of fungal community structure and functional group to fertilization in yellow clayey soil. Chin. J. Appl. Ecol. 2018, 29, 2721–2729. [Google Scholar] [CrossRef]
  61. Chen, Z.; Gao, S.; Chen, Y. Effects of short-term fertilization on soil fungal community structure and functional group in eucalyptus artificial forest. Acta Ecol. Sin. 2020, 40, 3813–3821. [Google Scholar]
Figure 1. Effects of different phosphorus levels at different times on soil pH (a) and AP (b) in Idesia polycarpa seedlings. Data presented as mean ± standard deviation (SD). Capital letters denote a significant difference at p < 0.01 among phosphorus treatments on the same days/time. Meanwhile, lowercase letters indicate a significant difference at p < 0.05 among phosphorus treatments on the same days/time.
Forests 15 01686 g001
Figure 2. Venn diagram of bacteria and fungi with different P levels for 40 d, 80 d, and 120 d. (a) Bacteria, 40 d. (b) Fungi, 40 d. (c) Bacteria, 80 d. (d) Fungi, 80 d. (e) Bacteria, 120 d. (f) Fungi, 120 d. Note: the blue, red, green, and purple colors represent CK, low, medium, and high phosphorus levels. The q, b, and s represent 40 d, 80 d, and 120 d.
Forests 15 01686 g002
Figure 3. Relative abundance of phylum level of bacteria at different phosphorus levels.
Forests 15 01686 g003
Figure 4. Relative abundance of phylum of fungi at different phosphorus levels.
Forests 15 01686 g004
Figure 5. Correlation between inter-root soil bacterial and fungal communities and soil physiochemical properties at different phosphorus levels for 40 d, 80 d, and 120 d. (a) Bacteria, 40 d. (b) Fungi, 40 d. (c) Bacteria, 80 d. (d) Fungi, 80 d. (e) Bacteria, 120 d. (f) Fungi, 120 d. Abbreviations are AP, available phosphorus, and pH, Power of Hydrogen. A single asterisk represents * p < 0.05; a double asterisk represents ** p < 0.01; and a triple asterisk represents *** p < 0.001 significance value.
Forests 15 01686 g005
Figure 6. Abundance of major metabolic pathways of bacterial communities in KEGG database.
Forests 15 01686 g006
Figure 7. The abundance of key metabolic pathways of fungal communities in the MetaCyc database.
Forests 15 01686 g007
Figure 8. Functional classification of bacterial metabolic pathways with significant differences in each treatment group at 40 d, 80 d, and 120 d.
Forests 15 01686 g008aForests 15 01686 g008b
Figure 9. Functional classification of fungal metabolic pathways with significant differences between 120 d treatment of LP and CK.
Forests 15 01686 g009
Table 1. Specific dosage of fertilization test. Abbreviations: CK, no phosphorus; low phosphorus level, LP; medium phosphorus level, MP; high phosphorus level, HP.
Treatment
(g/Plant × Times)
NPK
CK2.401.29
LP2.40.921.29
MP2.41.831.29
HP2.42.751.29
Table 2. Sequence information and OTU number of microbial samples with different phosphorus levels at different times.
Time/dTreatmentBacteriaFungus
OTUsOriginal
Sequence
Significant SequenceOTUsOriginal
Sequence
Significant Sequence
40 dCK8669422,347365,990959368,513303,709
LP10,334384,480326,901975445,732352,752
MP9405426,817367,978874422,679342,421
HP9039383,246328,198768359,271267,004
80 dCK8530272,643235,049489222,056202,600
LP9320293,613253,278614194,790177,251
MP9155423,011370,504552247,558218,145
HP7885420,825371,096556219,004192,487
120 dCK7542339,478308,449683210,495188,659
LP7563326,329296,977675212,991185,018
MP6780341,323312,835779209,846182,647
HP7907319,213289,002650210,875186,959
Table 3. Bacterial species at different taxonomic levels at different times.
GroupsGenus LevelFamily LevelOrder LevelClass LevelPhylum Level
40 d117854530511437
80 d118256432412743
120 d126057833113044
Table 4. The number of fungi species at different taxonomic levels at different times.
GroupsGenus LevelFamily LevelOrder LevelClass LevelPhylum Level
40 d246147713310
80 d164107613010
120 d213131673111
Table 5. Bacterial diversity analysis at different times. Data presented as mean ± standard deviation (SD). Capital letters denote a significant difference at p < 0.01 among phosphorus treatments on the same days/time. Meanwhile, lowercase letters indicate a significant difference at p < 0.05 among phosphorus treatments on the same days/time.
Time/dGroupsPielou’s
Evenness
Goods
Coverage
Chao1ShannonSimpson
40 dCK0.78 ± 0.03 Ba0.99 ± 0.01 Ca4124.03 ± 259.46 Aa9.27 ± 0.38 Aa0.98 ± 0.01 Aa
LP0.82 ± 0.03 Aa0.99 ± 0.01 Ba4276.08 ± 560.56 Aa9.75 ± 0.48 Aa0.99 ± 0.01 Aa
MP0.81 ± 0.01 Aa0.98 ± 0.01 Ba4263.78 ± 327.12 Aa9.59 ± 0.082 Aa0.99 ± 0.01 Aa
HP0.81 ± 0.03 ABa0.99 ± 0.01 Ba4006.08 ± 387.39 Aa9.57 ± 0.45 Aa0.99 ± 0.01 Aa
80 dCK0.82 ± 0.01 ABab0.99 ± 0.01 Ba3586.52 ± 97.07 Ab9.68 ± 0.11 Aab0.99 ± 0.01 Aab
LP0.83 ± 0.01 Aa0.99 ± 0.01 Ba3889.86 ± 38.18 Ab9.90 ± 0.04 Aa0.99 ± 0.01 Aa
MP0.82 ± 0.01 Aab0.98 ± 0.01 Cc4537.89 ± 92.01 Aa9.83 ± 0.17 Aab0.99 ± 0.01 Aa
HP0.76 ± 0.04 Bb0.98 ± 0.01 Cb3776.05 ± 320.50 Ab8.86 ± 0.50 Ab0.98 ± 0.01 Ab
120 dCK0.86 ± 0.01 Aa0.99 ± 0.01 Aa3804.44 ± 231.67 Aa10.22 ± 0.22 Aa0.99 ± 0.01 Aa
LP0.87 ± 0.01 Aa0.99 ± 0.01 Aa3788.07 ± 41.08 Aa10.31 ± 0.05 Aa0.99 ± 0.01 Aa
MP0.79 ± 0.04 Aa0.99 ± 0.01 Aa3263.82 ± 258.38 Ba9.21 ± 0.59 Aa0.98 ± 0.01 Aa
HP0.87 ± 0.01 Aa0.99 ± 0.01 Aa3741.39 ± 176.37 Aa10.29 ± 0.19 Aa0.99 ± 0.01 Aa
Table 6. Analysis of fungal diversity at different times. Data presented as mean ± standard deviation (SD). Capital letters denote a significant difference at p < 0.01 among phosphorus treatments on the same days/time. Meanwhile, lowercase letters indicate a significant difference at p < 0.05 among phosphorus treatments on the same days/time.
Time/dGroupsPielou’s EvennessGoods
Coverage
Chao1ShannonSimpson
40CK0.61 ± 0.03 Aa0.99 ± 0.01 Aa444.90 ± 17.46 Aa5.36 ± 0.21 Aa0.91 ± 0.02 Aa
LP0.54 ± 0.06 Aa0.99 ± 0.01 Aa421.73 ± 92.64 Aa4.68 ± 0.69 Aa0.88 ± 0.04 Aa
MP0.53 ± 0.05 ABa0.99 ± 0.01 Ba381.83 ± 67.86 Aa4.54 ± 0.52 ABa0.87 ± 0.02 ABa
HP0.52 ± 0.04 Aa0.99 ± 0.01 Aa332.91 ± 41.23 Aa4.35 ± 0.32 Aa0.85 ± 0.06 Aa
80CK0.50 ± 0.13 Aa0.99 ± 0.01 Aa229.29 ± 19.74 Cb3.96 ± 1.03 Aa0.75 ± 0.18 Aa
LP0.61 ± 0.042 Aa0.99 ± 0.01 Aa298.65 ± 12.26 Aa4.99 ± 0.38 Aa0.89 ± 0.03 Aa
MP0.46 ± 0.06 Ba0.99 ± 0.01 ABa256.29 ± 5.01 Aab3.67 ± 0.46 Ba0.75 ± 0.07 Ba
HP0.55 ± 0.01 Aa0.99 ± 0.01 Aa257.58 ± 19.78 Aab4.41 ± 0.05 Aa0.86 ± 0.02 Aa
120CK0.57 ± 0.04 Aa0.99 ± 0.01 Aa349.34 ± 15.56 Ba4.81 ± 0.37 Aa0.88 ± 0.04 Aa
LP0.52 ± 0.09 Aa0.99 ± 0.01 Aa316.74 ± 59.04 Aa4.35 ± 0.85 Aa0.82 ± 0.07 Aa
MP0.64 ± 0.03 Aa0.99 ± 0.01 Aa382.44 ± 35.81 Aa5.52 ± 0.34 Aa0.93 ± 0.02 Aa
HP0.55 ± 0.06 Aa0.99 ± 0.01 Aa313.61 ± 26.06 Aa4.59 ± 0.51 Aa0.86 ± 0.06 Aa
Disclaimer/Publisher’s Note: The statements, opinions and data contained in all publications are solely those of the individual author(s) and contributor(s) and not of MDPI and/or the editor(s). MDPI and/or the editor(s) disclaim responsibility for any injury to people or property resulting from any ideas, methods, instructions or products referred to in the content.

