Article

Genome-Wide Identification of the Auxin Response Factor Gene Family in Maple (Acer truncatum) and Transcriptional Expression Analysis at Different Coloration Stages of Leaves

by
Tongbao Qu
,
Yinglun Sun
,
Ran Yu
,
Jian Liu
,
Xinyu Zhang
and
Zaixin Gong
*
College of Forestry and Grassland, Jilin Agricultural University, Changchun 130118, China
*
Author to whom correspondence should be addressed.
Forests 2024, 15(10), 1723; https://doi.org/10.3390/f15101723
Submission received: 15 August 2024 / Revised: 13 September 2024 / Accepted: 20 September 2024 / Published: 29 September 2024
(This article belongs to the Section Genetics and Molecular Biology)

Abstract

:
Auxin response factors (ARFs) are involved in the mechanism of plant leaf color regulation, inhibiting chlorophyll synthesis while promoting anthocyanin production. However, it is not clear whether the ARF gene family is involved in autumn leaf color changes in maple. The differentially expressed genes for autumn leaf discoloration were obtained by transcriptome sequencing, and the AtARF family was constructed by homologous gene search. The results show that the AtARFs consist of 21 members distributed on 11 chromosomes and can be divided into three subfamilies, which are mainly distributed in the nucleus. The promoter regions of the AtARFs contain light-responsive elements, abiotic stress-responsive elements, and hormone-responsive elements. The analyses presented in this paper provide comprehensive information on ARFs and help to elucidate their functional roles in leaf color change in Acer truncatum.

1. Introduction

Autumn senescence of plant leaves can lead to changes in leaf color, and the most prominent feature of deciduous forests in temperate climates is the rich leaf color in autumn [1,2]. The rich changes in leaf color not only enhance the ornamental effect of the plant itself, but also extend its ornamental period [3]. The color changes of plant leaves are influenced by both genetic and environmental factors, leading to changes in the physiological and biochemical characteristics of their leaves [4,5]. The chlorophyll content of deciduous tree leaves slowly decreases in autumn and then rapidly decreases [6,7]. At the same time, anthocyanins begin to accumulate in the leaf tissue, and the red color of leaves in autumn is mainly related to the accumulation of anthocyanin content in the leaves [8,9]. Many scholars have studied changes in plant leaf color, most of them focusing on common garden-cultivated plants. Examples include the leaf color change mechanism of Ulmus pulima under heat stress [10], how girdling promotes leaf color expression in Acer rubrum L [11], and the coloring and aging of Ginkgo biloba leaves in autumn [12]. Thus, the discoloration of these leaves under different conditions provides a large amount of germplasm for breeding new cultivars. However, the molecular mechanism of leaf discoloration remains unclear.
In general, chlorophyll, anthocyanins, and carotenoids directly contribute to changes in leaf color through their own synthesis and degradation, and through the content and ratio between the three. Anthocyanins directly influence the important factors in the mechanism of turning leaves purple or red [13]. Anthocyanin biosynthesis is metabolically influenced by structural genes that directly encode enzymes required for relevant metabolic pathways, such as chalcone synthase (CHS), dihydrocoumarol 4-reductase (DFR), and anthocyanin synthase (ANS) [14]. Transcription factors regulate plant leaf color by binding to cis-acting elements of structural gene promoters. MYB, bHLH, and WD40 play major roles in regulating the anthocyanin synthesis pathway at the transcriptional level and are often found in the form of MBW complexes that directly regulate the transcription of structural genes [15].
Auxin is a multifunctional plant hormone that can participate in various physiological and developmental processes throughout the plant life cycle, such as the differentiation of vascular bundles [16], embryonic development [17], and organogenesis [18,19]. The transcriptional regulation of plant auxin is mediated by auxin response factors, and ARFs promote chlorophyll accumulation by regulating the expression of genes related to chlorophyll metabolism [20]. For example, the overexpression of the SlARF6A gene resulted in a dark green color and increased chlorophyll content in tomato fruits during the green fruit stage [21]. Research also showed that ARFs can not only regulate the expression of genes related to chlorophyll metabolism, but also regulate the biosynthesis of plant flavonoids. For example, analysis of the auxin response factors in apples revealed that ARF2 is involved in regulating the accumulation of anthocyanins in apple fruits [22]. Differentially expressed genes are involved in the degradation of anthocyanins in Camellia sinensis, including ARFs [23].
Acer truncatum is a common deciduous trees in northern China, with enormous economic and ornamental value [24]. In recent years, research on this plant has focused on secondary metabolites, such as the evaluation of bioactive components of phenolic compounds in seed oil by-product varieties [25]. In addition to the active extracts from the seed kernels and fruits, its leaves also have extremely high value [26,27]. The content of flavonoids is a key factor determining the function [28]. However, the mechanism of leaf discoloration in Acer truncatum under natural conditions in autumn is still unclear. Based on high-quality genomic data, this study integrates transcriptome data from different leaf colors at the same period to explore the molecular regulatory mechanisms of autumn leaf color change, providing new insights for its molecular breeding.

2. Materials and Methods

2.1. Experimental Materials and Sampling

Acer truncatum located on the campus of Jilin Agricultural University was selected as the test material. At the beginning of October 2023, green, middle (i.e., half-red), and red leaves of the same Acer truncatum with obvious characteristics, normal growth, and complete leaves were selected as the test materials, and three replicates of each group of leaves were taken. The leaves were labeled with hang tags and placed in a refrigerator at −80 °C for preservation.

2.2. Total RNA Extraction

The RNA-seq samples of the different leaf color stages were used to construct 9 libraries (green, middle, and red; each sample had three replicates). The experimental process was carried out in accordance with the instructions of the kit, and the centrifuge tubes, pipette guns, and a series of other experimental supplies used in the experimental process were strictly sterilized and disinfected. Finally, the extracted total RNA was stored in an ultra-low-temperature refrigerator at −80 °C for sequencing.

2.3. Library Construction and On-Board Sequencing

In this project, mRNA with polyA structure in total RNA was enriched using Oligo(dT) beads, and the first strand of cDNA was synthesized using a 6-base random primer and reverse transcriptase as a template, and the second strand of cDNA was synthesized using the first strand of cDNA as a template.
After the library construction was completed, PCR amplification was used to enrich the library fragments, and then the library was selected according to the fragment size. The library size was 450 bp. Then, the library was quality checked with an Agilent 2100 Bioanalyzer, and then the total concentration of the library and the effective concentration of the library were detected. The libraries containing different index sequences were then mixed proportionally according to the effective concentration of the libraries and the amount of data required from the libraries. The mixed libraries were uniformly diluted to 2 nM and denatured by base denaturation to form single-stranded libraries.
After RNA extraction, purification, and library construction, the libraries were subjected to paired-end (PE) sequencing using next-generation sequencing [29] based on the Illumina sequencing platform.

2.4. Identification and Bioinformatics Analysis of the AtARF Gene Family

According to the preliminary transcriptome sequencing data, the obtained transcriptome data were preliminarily screened by blast comparison in 5 databases, including NR, GO, KEGG, eggNOG, and SwissProt. The data with conserved domains were screened against the NCBI conserved domain database and by blast comparison. To ensure that each sequence had a conserved domain, any redundancy was eliminated on this basis, and the resulting sequence was identified as an AtARF.
The number of amino acids, the isoelectric point, the relative molecular weight, and the average hydrophilicity of the AtARFs were analyzed and calculated using the online software ProtParam (https://web.expasy.org/protparam/, accessed on 7 February 2024). The online software WoLF PSORT (https://wolfpsort.hgc.jp, accessed on 7 February 2024) was used to predict the subcellular localization of proteins encoded by the AtARFs. The secondary and tertiary structures of proteins were analyzed using SOPMA (http://npsa-pbil.ibcp.fr/, accessed on 4 February 2024) and RobeTTaFold (https://robetta.bakerlab.org/, accessed on 7 February 2024), respectively. The protein transmembrane domains and signal peptides were analyzed using the online software TMHMM (https://services.healthtech.dtu.dk/services/TMHMM-2.0/, accessed on 7 February 2024) and SignalP (https://services.healthtech.dtu.dk/services/SignalP-4.1/, accessed on 7 February 2024), respectively. Motif analysis was performed using the online software MEME (https://meme-suite.org/meme/, accessed on 4 February 2024 ). Parameter settings: motif set to 8, length set to 100 amino acids, and other settings set to default values. The AtARFs were also analyzed online using NCBI’s Batch CD-Search (https://npsa-pbil.ibcp.fr/, accessed on 4 February 2024). Finally, TBtools v2.119 was used to visualize the analyzed domains.

2.5. Phylogenetic Evolutionary Tree and Cis-Acting Elements on the AtARFs

To classify AtARF gene families of Acer truncatum, we compared 22 species with complete ARF conserved structures to four other species. The ARFs of Acer truncatum (At), Vitis vinifera (Vv), Oryza sativa subsp. indica (Os), Malus pumila (Mp), and Arabidopsis thalian (Ath) were selected for phylogenetic analysis. Phylogenetic trees were constructed using the neighbor-joining (NJ) method in MEGA-XI, and bootstrap replicates were set to 1000. The final evolutionary trees were edited using the Evolview (https://evolgenius.info//evolview-v2/#login, accessed on 17 February 2024) online website.
The 2000 bp sequences of 22 AtARFs in the genome data and structure annotation file were extracted by TBtools as promoter regions. The prediction of cis-acting elements in the promoter region was carried out by Plant Care (https://bioinformatics.psb.ugent.be/webtools/plantcare/html/, accessed on 17 February 2024), and the prediction results were visualized.

2.6. Chromosome Distribution and Collinearity Analysis of the AtARF Gene Family

Using TBtools and genomic data, we visualized the chromosomal distribution of the AtARFs. Furthermore, we analyzed tandem repeat events in the AtARF gene family using TBtools with MCScanX. In a similar way, we investigated fragment repetition events and the collinearity of gene pairs in different species using TBtools with MCScanX.

2.7. qRT-PCR Analysis

AtARF gene-specific primers for qRT-PCR analysis were designed using Primer Premier 5 software (Supplementary Table S1). All samples were replicated three times, as were three technical replicates. Actin and β-tubulin were used as the internal control genes. The relative expression levels of genes were calculated using the 2−ΔΔCt method. Three experimental replicates were performed for each sample.

3. Results

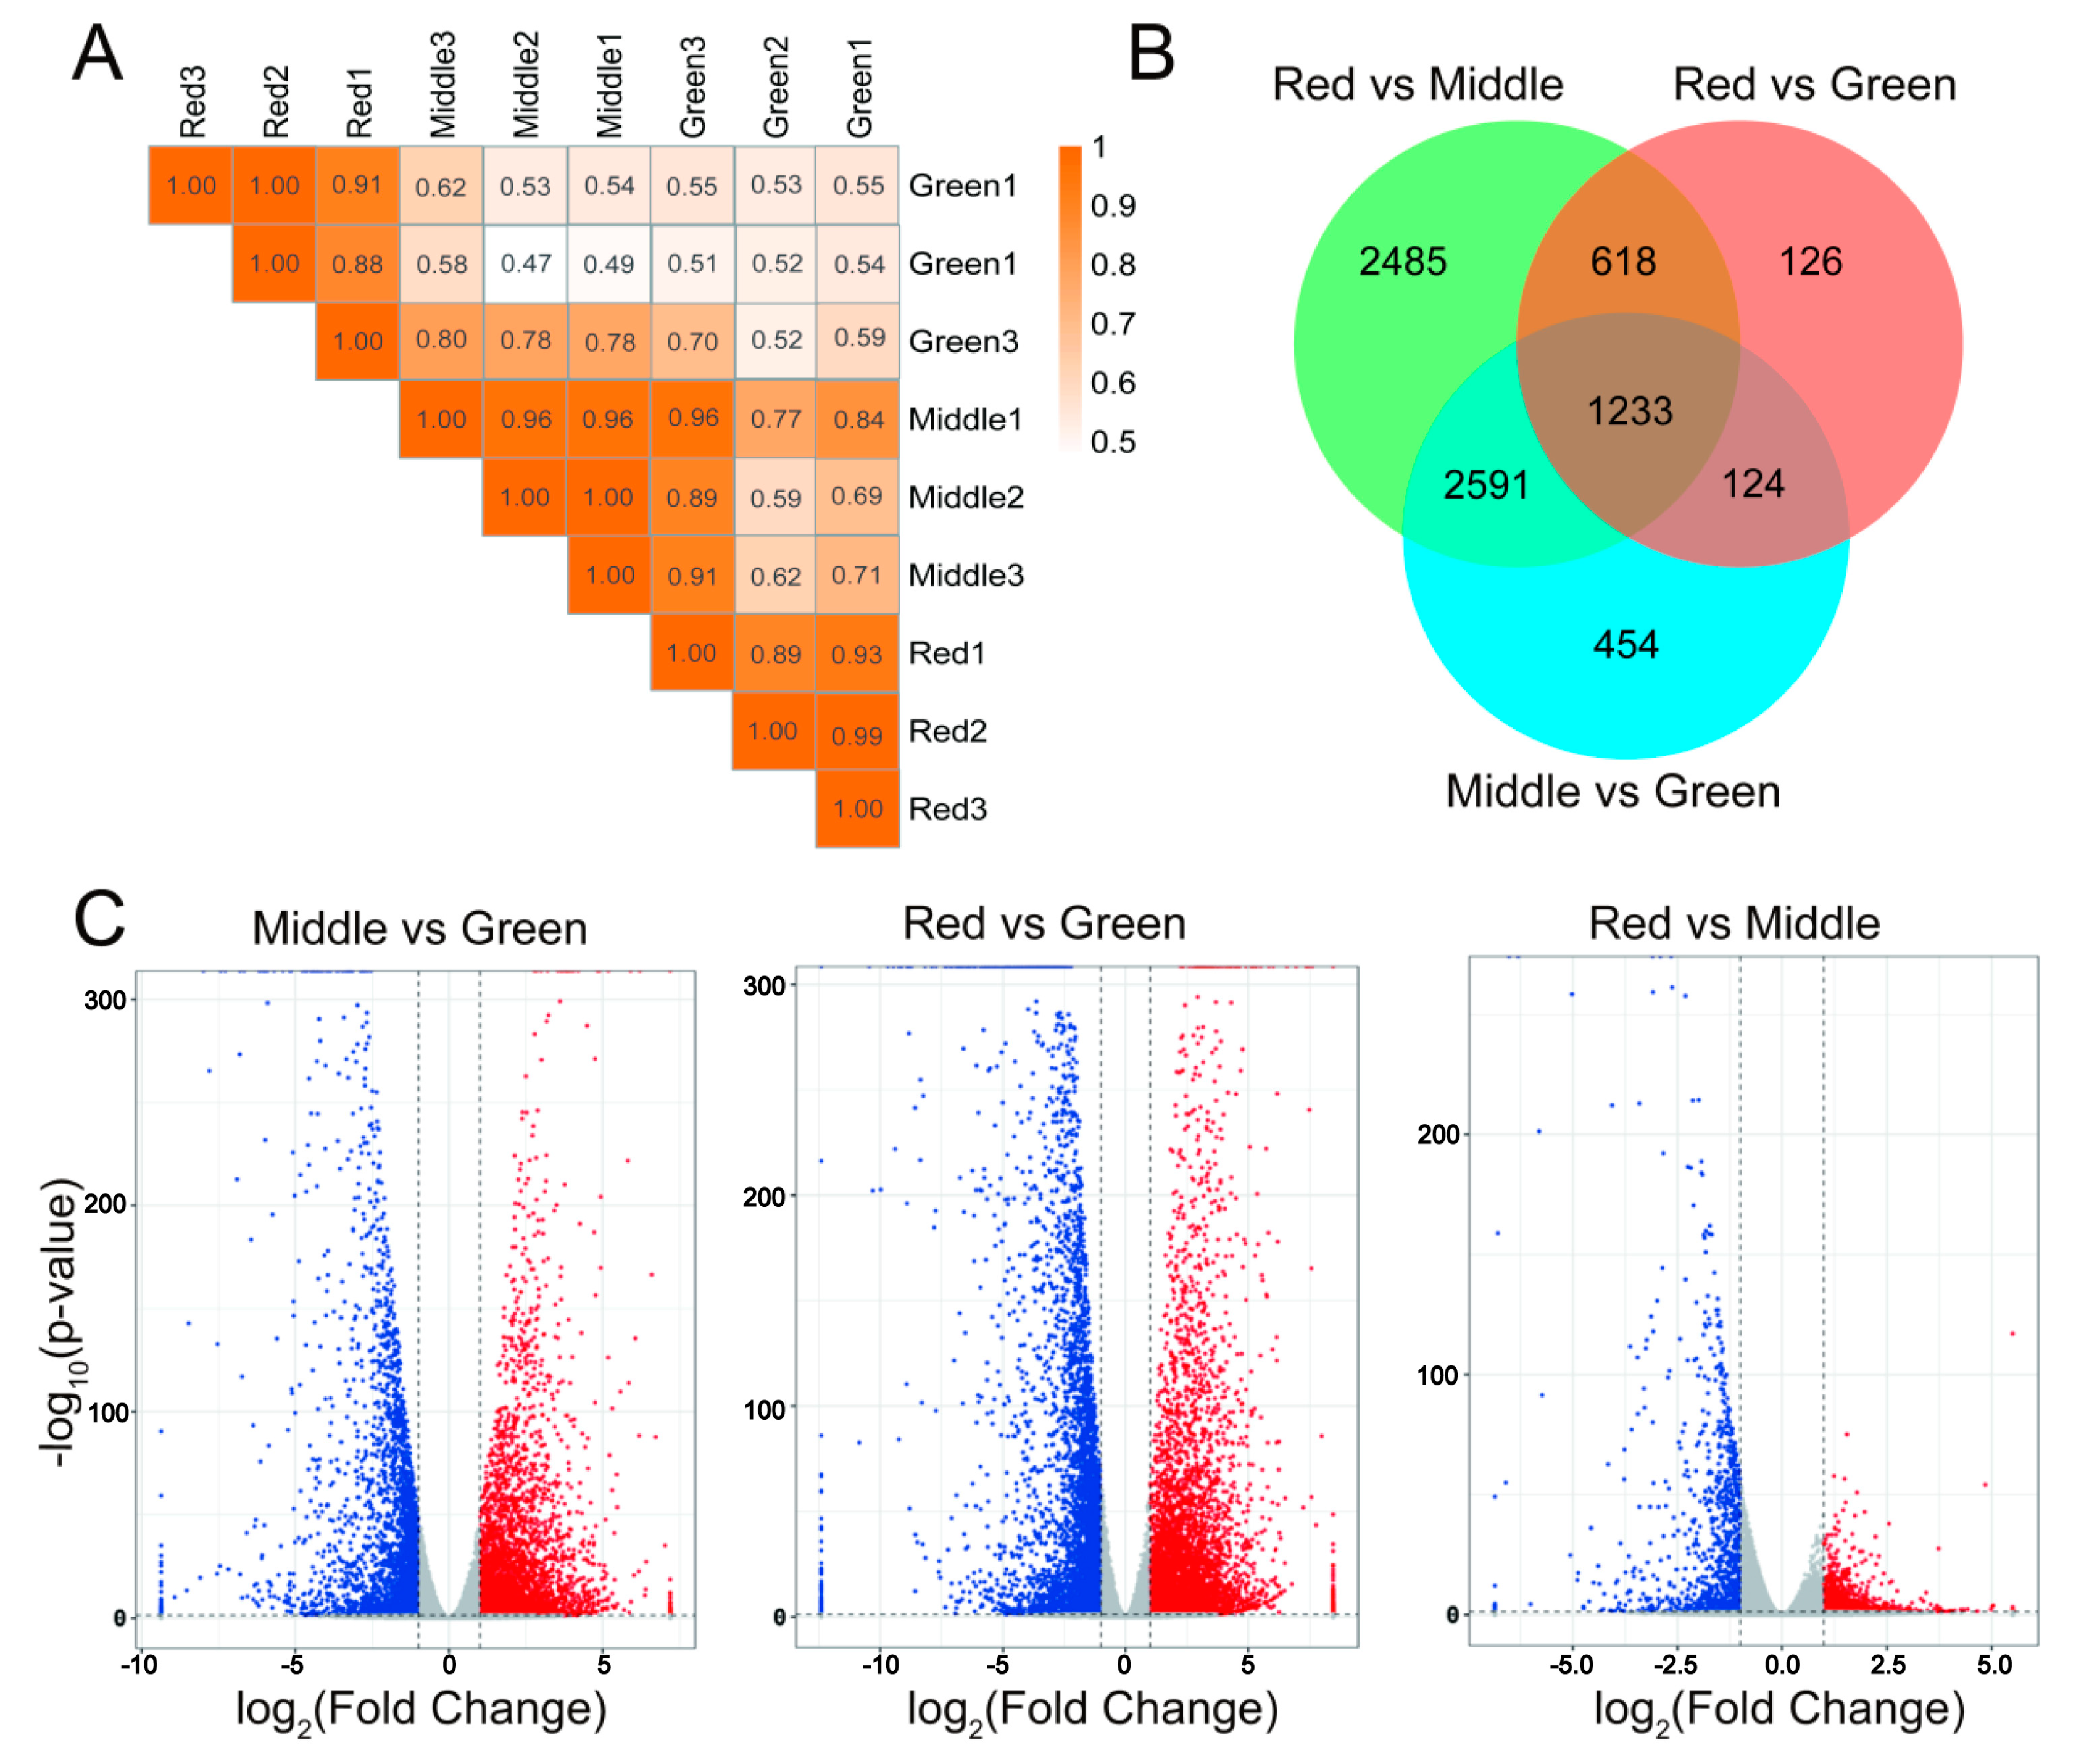
3.1. Full Transcriptome Data Construction

A total of nine cDNA libraries were constructed, with three replicates per color group. After screening, the data that met the requirements remained (Supplementary Table S2). A total of approximately 63.63 GB of data was obtained, with a maximum clean data of 5.54 GB and a minimum of 6.25 GB for each sample. The average percentage of Q 20 bases was 98.72%, and the average percentage of Q 30 bases was 96.42%, which proves that the sequencing data were excellent, the quality met the experimental standards, and it could meet the requirements of subsequent analysis.

3.2. Transcriptome Results Analysis

In this study, three biological replicates were set for green, middle, and red samples, and the correlation of gene expression levels among the samples was an important indicator to test the reliability of the experiment and the reasonableness of the sample selection. In addition to testing the repeatability of the biological experiment, it was used to evaluate the reliability of differentially expressed genes and assist in the screening of abnormal samples. We used the Pearson correlation coefficient to represent the correlation of gene expression levels between samples (Figure 1A). The closer the correlation coefficient is to 1, the higher the similarity of expression patterns between samples. In general, a correlation coefficient between 0.8 and 1 is a strong correlation, and if the correlation coefficient between biological duplicate samples is lower than 0.8, it means that the correlation between the samples is low. Through the correlation analysis of the samples, it was found that the coefficient of biological repetition between the green, middle, and red samples was between 0.8760 and 0.9958, and there was a strong correlation between the samples, indicating that the samples had good repeatability and consistency and could be used for subsequent analysis.
There were 126 DEGs specific to the Red vs. Middle comparison group, 2485 DEGs specific to the Red vs. Green comparison group, and 454 DEGs specific to the Middle vs. Green comparison group (Figure 1B). In addition, 1233 duplicate DEGs were common to all three.
We used DESeq for differential analysis of gene expression, and we screened differentially expressed genes under the following conditions: expression difference multiple |log2 Fold Change| > 1, significant p-value < 0.05 (Figure 1C). The differentially expressed genes in the leaves of Acer truncatum during the autumn color transition period were screened. A total of 2101 DEGs expressions were detected in the Red vs. Middle comparison group, of which 1051 DEGs were up-regulated and 1050 DEGs were down-regulated. There were 9627 DEGs in the Red vs. Green group, of which 5369 DEGs were up-regulated and 4258 DEGs were down-regulated. A total of 7102 DEGs expressions were found in the Middle vs. Green group, of which 4120 DEGs were up-regulated and 2982 DEGs were down-regulated.

3.3. Functional Annotation Analysis

By comparing with the GO database, the differential genes of Acer truncatum were classified and annotated based on their cell composition, their molecular function, and the biological processes involved (Figure 2A). Screening parameters were set, with p < 0.05. The differential genes between Red and Middle were enriched into 211 GO items, of which the 10 most significant GO items were biological processes. The differential genes between Red and Green were enriched in 625 GO items, mainly in plastid and chloroplast. The differential genes between Middle and Green were enriched in 544 GO items, mainly in ribosome (GO: 0005840), plastid (GO: 0009536), structural constituent of ribosome (GO: 0003735), cytosolic ribosome (GO: 0022626), ribosomal subunit (GO: 0044391), and chloroplast (GO: 0009507).
Red and Middle generated three major biological metabolic pathways: cellular processes, environmental information processing, genetic information processing, and metabolism (Figure 2B). The biological metabolic pathways generated in the other two comparative groups were cellular processes, genetic information processing, and metabolism. Among the two treatment groups compared to green, ribosome (ko03010) was the most significant. In the treatment group with the presence of middle, alanine, aspartate, and glucose metabolism (ko00250), search and cross metabolism (k00500), glyceroid metabolism (ko00561), and ether lipid metabolism were more significant (ko00565).

3.4. Identification and Analysis of the AtARF Gene Family

In the leaf color transcriptome sequencing data, after the annotation of five protein databases in Acer truncatum, the preliminary screening yielded 62 genes annotated as ARFs. In the comparison of the three groups, the presence of the ARF family is likely to be greater in the green leaves (Figure 3A, Supplementary Figure S1). According to the characteristic sequences of the domains, 22 protein sequences with two specified domains, B3 and Auxin-resp, were selected. They were named AtARF1 to AtARF22 according to the location of their coding genes in the chromosome (Supplementary Table S3). The shortest length among these genes was 403 bp (AtARF6), and the longest length was 1165 bp (AtARF13). The relative molecular weight ranged from 44.94 (AtARF6) to 130.78 (AtARF13) kDa. The theoretical isoelectric point was mostly about 6, but in AtARF2 it was 8.39. Furthermore, the grand average of hydropathicity of AtARF8 was greater than 0, whereas the other genes were all less than 0. This result indicates that the proteins encoded by this gene family were all hydrophilic neutral amino acids. The predicted subcellular localizations of the AtARF proteins showed that 18 AtARF members might be in the nucleus, while 4 AtARF proteins were anchored in the cytosol, peroxisome, plasma membrane, and vacular membrane.
A phylogenetic tree was constructed using 22 AtARFs of Acer truncatum (At), 17 VvARFs of Vitis vinifera (Vv), 24 OsARFs of Oryza sativa subsp. indica (Os), 30 MpARFs of Malus pumila (Mp), and 23 AthARFs of Arabidopsis thalian (At) (Figure 3B). The results showed that 116 ARFs were divided into three major subfamilies: ClassI, ClassII, and ClassIII. Among these, ClassIII can be further divided into IIIa, IIIb, IIIc, IIId, IIIe, and IIIf. AtARF genes were distributed in all subfamilies, and most AtARFs were clustered in a small branch with VvARF genes.

3.5. Protein Structure Analysis of AtARF Gene Family

The predicted secondary structures of the 22 AtARF proteins showed that all the proteins consisted of four parts: alpha helix, extended chain, beta turn, and random coil (Supplementary Table S4). AtARF-encoded proteins had the highest proportion of random coil, followed by alpha helix and extended chain. Among them, the secondary structure of AtARF17 and AtARF22 was arranged as follows: random coil > extended chain > alpha helix > beta turn. Other secondary structures had more alpha helix structures than extended chain. In addition, we found that only AtARF8 had three transmembrane domains, while the other proteins had only one.
The tertiary structure of the AtARF-encoded proteins contained alpha helix, extended chain, and random coil (Supplementary Figure S2). The tertiary structure showed that the secondary structure was further folded more regularly, and the structures formed by different proteins were similar, indicating that their functions were different, and further indicating the functional diversity of members of the AtARFs.

3.6. Analysis of the Gene Structure and Conserved Protein Sequence of AtARF Gene Family

As shown in Figure 4A, the ARF gene family contains the ARF DNA-binding domain that is usually located near the N-terminal region of the protein, and most of the members have similar motif sequences. All ARF family members contain the same three motif compositions including Motif1, Motif2, and Motif4. In addition, the minority of ARF DNA-binding is usually located at the C-terminal of the protein (Motif7 and Motif8) during evolution. Most of these domain sequences contain from 27 to 57 amino acid residues except Motif1 (Figure 4D).
Studying the genetic evolution of organisms, different gene families may have different conserved structural sequences, and the pattern of conserved domains between ARF subclasses can also provide some clues to classification (Figure 4B). The typical features of ARF proteins were B3 and Auxin-Resp. Besides, the results show that most of the AtARF proteins had AUX_IAA superfamily domains in ClassIII.
The exon–intron structures of AtARFs were obtained by comparing the corresponding DNA sequences. The results showed that different classes contained different exon numbers (Figure 4C). There were 2–4 exons in AtARF2, AtARF14, AtARF19, AtARF20, and AtARF15 which were grouped in ClassI and ClassIIIc. Every other gene had more than eight exons. For example, there were 8 exons in AtARF17 which belonged to ClassⅡ, and AtARF16 in ClassⅢa contained 14 exons.

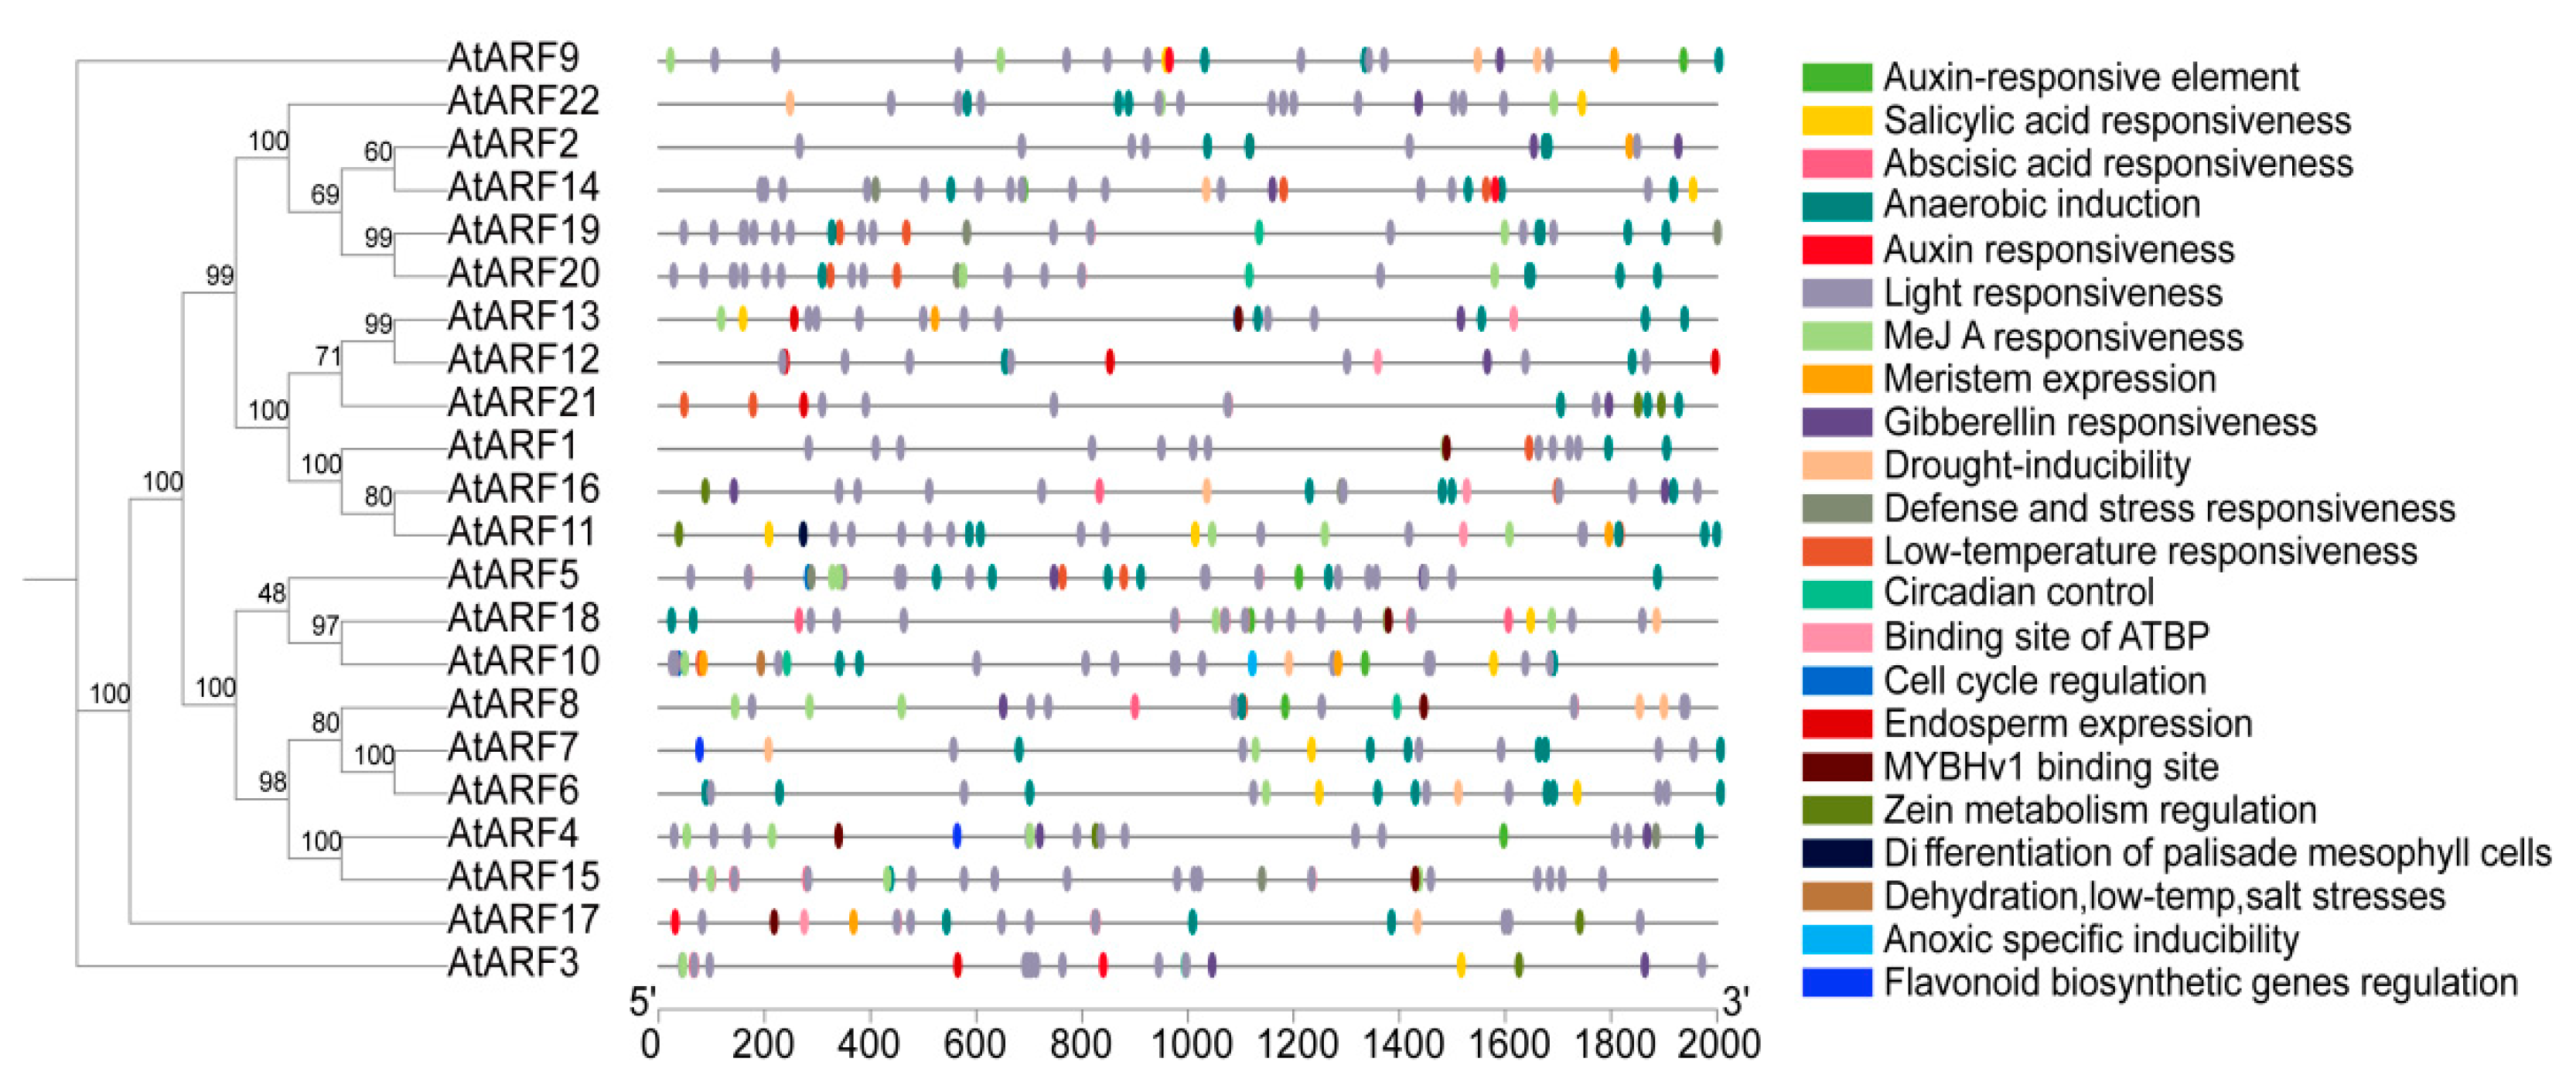
3.7. Identification of Cis-Acting Elements of the AtARF Gene Family

Cis-acting elements play a very important regulatory role in gene transcription initiation. We extracted the promoter of the AtARFs from the 2000 bp sequence upstream of the start codon, explored the function of the AtARF promoter, and analyzed the potential functional elements of these gene promoter regions. The results show that these promoters were mainly divided into four categories: (1) stress response elements, (2) hormone synthesis response elements, (3) cis-acting regulatory elements related to growth and development, and (4) light response elements (Supplementary Figure S3). At the same time, the number of cis-acting elements related to light response was very high in the gene family, so it can be inferred that this family plays an important role in the biochemical process of light response (Figure 5). Two elements directly related to flavonoid biosynthesis were located on the promoter of AtARF4 and AtARF7.

3.8. Chromosomal Location and Gene Collinearity Analysis of the AtARF Gene Family

Chromosomal localization analysis of the genome showed that the 22 AtARFs were unevenly distributed across the 11 chromosomes. Chromosomes 1, 8, 9, and 11 contained only one AtARF gene, whereas chromosome 6 contained up to six AtARFs. Tandem duplication is one of the main reasons for the expansion of gene families. Tandem duplication produced a total of one pair of AtARFs (AtARF6 and AtARF7) located on chromosome 6 (Figure 6A). To analyze the relationship between AtARF duplication and genetic evolution, the covariance of the genes was further analyzed (Figure 6B). The analysis revealed five pairs of genes with segmental duplication events. The number of segmental duplications was much higher than that of tandem duplications.
We performed whole genome syntenyanalysis on the ARFs of Acer truncatum and other maples (Figure 6C). The ARF genes in Acer amplum subsp. catalpifolium, Acer negundo, Acer pseudosieboldianum, Acer saccharum, and Acer yangbiense were selected for comparison. The syntenic conservation of ARFs was observed between Acer amplum subsp. catalpifolium (31 orthologous gene pairs), Acer negundo (29 orthologous gene pairs), Acer pseudosieboldianum (27 orthologous gene pairs), Acer saccharum (28 orthologous gene pairs), and Acer yangbiense (28 orthologous gene pairs). Among them, it was most genetically close to Acer amplum subsp. catalpifolium, and it was most distantly related to Acer pseudosieboldianum.

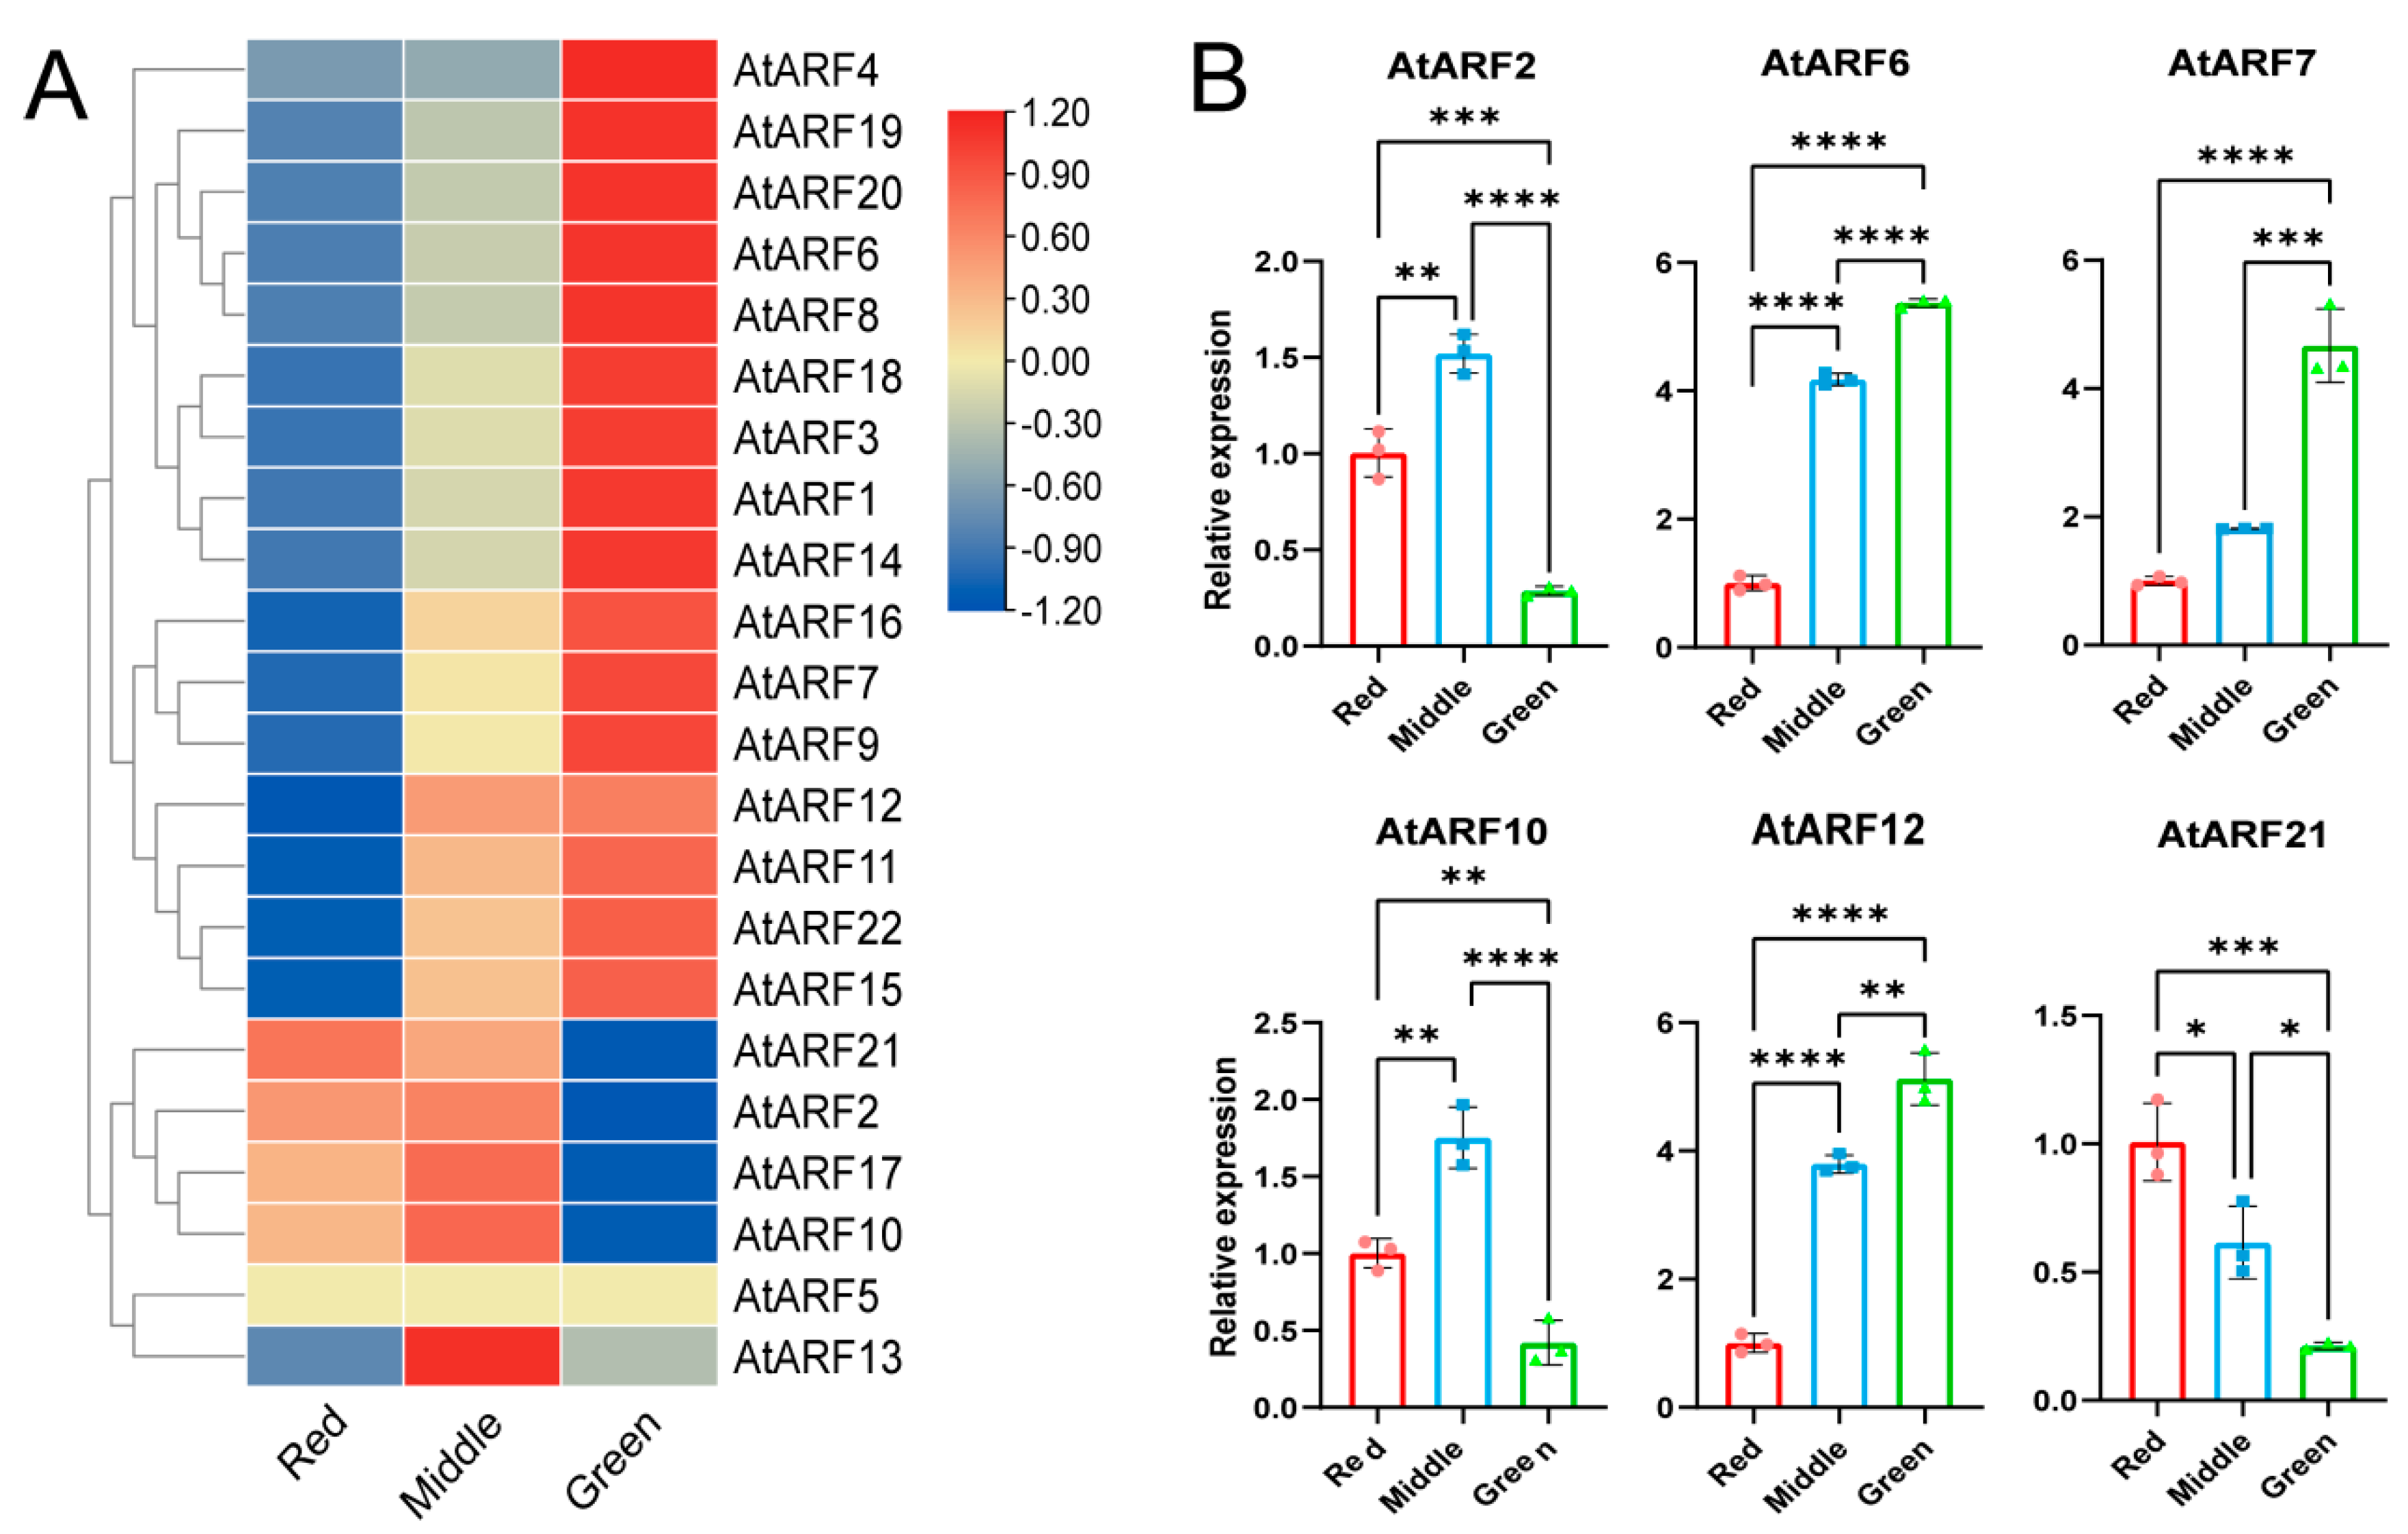
3.9. Expression Analysis of the AtARF Gene Family

Based on the transcriptome sequencing results, this study includes a heat map of the expression patterns of the original FPKM values (Figure 7A). Based on their expression levels, they can be categorized into four groups. Among them, a total of 16 AtARF genes were significantly expressed in green leaves and 1 AtARF gene was significantly expressed in red leaves. However, one AtARF was not expressed in any of the leaf color development.
When AtARFs were significantly expressed at the green leaf stage, their response genes usually showed similar expression patterns. The expression levels of AtARFs gradually decreased after the leaf color change. When AtARFs were significantly expressed at the color transition stage, the relative expression levels of most of the genes in the AtARF family showed a tendency to increase and then decrease. The expression levels of the AtARF2, AtARF10, and AtARF17 genes were all relatively low. When AtARFs were significantly expressed at the red stage, the expression level of these genes gradually increased after the leaf color change.
The expression heatmap of AtARFs was analyzed according to transcriptome data, and six AtARFs with the higher expression were screened out (Figure 7B). The tissue expression of these six AtARF genes in different colored leaves was analyzed by qRT-PCR. The results showed that the expression levels of three AtARFs (AtARF2, AtARF10, and AtARF21) started to increase after the leaves changed color. The expression levels of three AtARFs (AtARF6, AtARF7, and AtARF12) were the highest in green leaves. This result was consistent with the transcriptome results, proving the reliability of the transcriptome data.

4. Discussion

Auxin is an important signaling molecule present in most organs during plant development [30,31]. It is widely involved in the physiological and biochemical processes of plants, including organ morphogenesis, flower and fruit development, hormone regulation, stress response to environmental stimuli, and resistance to pathogens [32,33]. Research has been conducted on plants such as Arabidopsis thaliana [34], Oryza sativa [35], Zea mays [36], Solanum lycopersicum [37], and Ananas comosus [38]. However, the identification and functional studies of AtARFs were mostly focused on fruits and flowers and were not commonly seen in leaf studies. Therefore, we confirmed and comprehensively analyzed the members of the AtARF family, enabling us to study their family evolution and speculate on their biological functions in this study.
The direct cause of color changes in plants can be attributed to changes in the content of three main pigments: chlorophylls, carotenoids, and flavonoids. Among the flavonoids, anthocyanins are the main pigments that induce red color changes in plants [8]. This was evidenced in studies related to Boehmeria nivea [39] and Brassica oleracea [40].
This study screened a total of 22 AtARFs from the transcriptome sequence of Acer truncatum. Compared to ARFs found in other plants, such as Cajanus cajan with 12 ARFs [41], Ananas comosus with 20 ARFs [42], Medicago truncatula with 39 ARFs [43], and Populus trichocarpa with 39 ARFs [44], the moderate number of ARFs in Acer truncatum indicates significant differences in the number of ARF gene family members among different plants. Subcellular localization predicts that most of the 22 AtARF gene family members are located in the nucleus, indicating that AtARFs play a major role as a transcription factor in the nucleus. The subcellular localization results of most ARF family proteins reported in other species are consistent, indicating that the subcellular localization of ARF proteins is relatively conservative [29,45]. However, in subcellular localization prediction, we also found that four members of the AtARF gene family do not exist in the nucleus, and there are also ARF members that do not exist in the nucleus in other plants. These predicted ARF proteins located outside the nucleus may have unique biological functions.
The structures and motifs of genes can provide important evidence for the evolutionary relationships of gene families [46]. In this study, AtARFs in the same branch have similar gene structures and motifs. During the process of gene expansion, tandem replication and fragment replication play important roles [43,47]. The analysis of AtARF protein motifs revealed that the screened AtARFs contained 5–8 motifs, indicating that the AtARF protein structure is relatively conserved and suggesting that its function may be more conserved. The protein domain analysis of this gene family revealed that in addition to the typical B3 and Auxin-resp domains, most AtARFs also have typical AUX/IAA domains. The B3 binding domain regulates the expression of auxin responsive genes by binding to auxin-responsive elements in the promoter region [48]. The AUX/IAA domain belongs to the C-terminal dimerization domain, which is a domain that mediates protein–protein interactions. At the same time, the AUX/IAA protein also has a similar domain, and the two proteins can form ARF-ARF, ARF-Aux/IAA and Aux/IAA Aux/IAA homologous or heterologous oligomers through the interaction of this domain. However, further research is needed to determine the function of ARF with missing structural domains [49]. In addition, AtARF9 and AtARF12 have other structural domains. After predicting the secondary structure of the AtARF-encoded protein, it was found that the protein encoded by this gene had the highest proportion of random coil, followed by alpha helix. In the protein tertiary structure, it was found that the AtARF-encoded protein is a multi-stranded folding protein, mainly with random coil, which was basically consistent with the prediction results of the secondary and tertiary structures of the ARF-encoded protein in Pinus massoniana [50].
The analysis of cis-acting regulatory elements in gene promoters can predict the potential molecular functions and mechanisms of genes [51,52]. This study found that the promoter regions of members of the AtARF gene family contain multiple response elements, such as drought, low temperature, light response elements, auxin, abscisic acid, gibberellin, and salicylic acid plant hormone response elements. This indicates that the expression of the AtARFs was regulated by multiple factors and participated in plant leaf color changes and growth and development [53]. ARFs can affect anthocyanin metabolism in several ways. For instance, AtARF2 acts as a positive regulator to fine-tune the accumulation of flavonols and proanthocyanidins in Arabidopsis thaliana [54], and the IAA29-ARF5-1-ERF3 module in apples regulates anthocyanin biosynthesis [55].
RNA seq analysis showed that 16 out of 22 AtARFs were highly expressed in green leaves, suggesting that these genes may play a role in leaf development. The remaining five AtARFs showed differential expression in leaf discoloration, with five AtARFs having significantly higher expression levels after leaf discoloration than in green leaves, suggesting that these five AtARFs play an important role in leaf discoloration. The varying expression levels of these ARFs in different colored leaves suggest that they may play important roles in leaf color development. And the varying expression levels of ARFs in different tissues suggest that they may play important functions in specific tissues or periods. For example, ARF8 in Arabidopsis thaliana can regulate fruit development, but when ARF8 mutates, it can lead to seedless fruit [56].

5. Conclusions

As a key factor in the growth hormone signaling pathway, ARFs play a crucial role in all stages of plant growth and development. In this study, a genome-wide analysis of ARF genes in Acer truncatum was conducted. A total of 22 AtARFs were identified in this study, which were unevenly distributed on 11 chromosomes of Acer truncatum. Phylogenetic analysis showed that these 22 AtARFs belonged to three different subfamilies, each of which exhibited similar gene structures and conserved motifs. The promoter regions of the AtARF genes contained a large number of hormone- and light-responsive elements, suggesting an important role for AtARF genes in mediating the phytohormone signaling pathway. The qRT-PCR results showed that during leaf color morphogenesis, the core AtARF gene, AtARF21, was significantly induced in red leaves. These findings provide new insights into the role of AtARFs during leaf growth, development and color changes, as well as the breeding of new varieties of Acer truncatum.

Supplementary Materials

The following supporting information can be downloaded at: https://www.mdpi.com/article/10.3390/f15101723/s1, Figure S1: Histogram of differential transcription factors; Figure S2: Tertiary structure analysis of AtARF family members; Figure S3: Visual heatmap of cis acting elements in the promoter of the ARF gene family; Table S1: The specific primers for the AtARF genes for qRT-PCR analysis; Table S2: Sequencing data filtering and quality statistics; Table S3: Physical and chemical properties of ARF gene encoded proteins; Table S4: The secondary structure and transmembrane domain of proteins encoded by the ARF genes.

Author Contributions

Conceptualization, T.Q., Y.S. and Z.G.; methodology, T.Q., Y.S. and Z.G.; software, Y.S. and R.Y.; validation, T.Q., Y.S. and J.L.; formal analysis, T.Q. and Y.S.; resources, Z.G. and T.Q.; data curation, Y.S. and X.Z.; writing—original draft preparation, T.Q. and Y.S.; writing—review and editing, all; visualization, Y.S.; supervision, Z.G.; project administration, Z.G.; funding acquisition, Z.G. All authors have read and agreed to the published version of the manuscript.

Funding

This study was supported by the Natural Science Foundation of Jilin Province (20220101319JC).

Data Availability Statement

Data are available on request.

Acknowledgments

Thanks to the members of the College of Forestry and Grassland of Jilin Agricultural University for their assistance during laboratory works and for fruitful discussions. Thanks to the assistance of PANOMIX Biomedical Tech Co., Ltd. (abbreviation: PANOMIX).

Conflicts of Interest

The authors declare no conflicts of interest.

References

  1. Archetti, M.; Döring, T.F.; Hagen, S.B.; Hughes, N.M.; Leather, S.R.; Lee, D.W.; Lev-Yadun, S.; Manetas, Y.; Ougham, H.J.; Schaberg, P.G.; et al. Unravelling the evolution of autumn colours: An interdisciplinary approach. Trends Ecol. Evol. 2009, 24, 166–173. [Google Scholar] [CrossRef] [PubMed]
  2. Xing, X.Y.; Hao, P.Y.; Dong, L. Color characteristics of Beijing’s regional woody vegetation based on Natural Color System. Color. Res. Appl. 2019, 44, 595–612. [Google Scholar] [CrossRef]
  3. Li, C.-F.; Xu, Y.-X.; Ma, J.-Q.; Jin, J.-Q.; Huang, D.-J.; Yao, M.-Z.; Ma, C.-L.; Chen, L. Biochemical and transcriptomic analyses reveal different metabolite biosynthesis profiles among three color and developmental stages in ‘Anji Baicha’ (Camellia sinensis). BMC Plant Biol. 2016, 16, 195. [Google Scholar] [CrossRef] [PubMed]
  4. Becker, C.; Klaering, H.-P.; Kroh, L.W.; Krumbein, A. Cool-cultivated red leaf lettuce accumulates cyanidin-3-O-(6″-O-malonyl)-glucoside and caffeoylmalic acid. Food Chem. 2014, 146, 404–411. [Google Scholar] [CrossRef] [PubMed]
  5. Lev-Yadun, S.; Yamazaki, K.; Holopainen, J.K.; Sinkkonen, A. Spring versus autumn leaf colours: Evidence for different selective agents and evolution in various species and floras. Flora—Morphol. Distrib. Funct. Ecol. Plants 2012, 207, 80–85. [Google Scholar] [CrossRef]
  6. Primka, E.J.; Smith, W.K. Synchrony in fall leaf drop: Chlorophyll degradation, color change, and abscission layer formation in three temperate deciduous tree species. Am. J. Bot. 2019, 106, 377–388. [Google Scholar] [CrossRef]
  7. Junker, L.V.; Ensminger, I.; Niinemets, Ü. Relationship between leaf optical properties, chlorophyll fluorescence and pigment changes in senescing Acer saccharumleaves. Tree Physiol. 2016, 36, 694–711. [Google Scholar] [CrossRef] [PubMed]
  8. Yang, X.; Yang, N.; Zhang, Q.; Pei, Z.; Chang, M.; Zhou, H.; Ge, Y.; Yang, Q.; Li, G. Anthocyanin Biosynthesis Associated with Natural Variation in Autumn Leaf Coloration in Quercus aliena Accessions. Int. J. Mol. Sci. 2022, 23, 12179. [Google Scholar] [CrossRef] [PubMed]
  9. Sun, S.; Zhang, Q.; Yu, Y.; Feng, J.; Liu, C.; Yang, J. Leaf Coloration in Acer palmatum Is Associated with a Positive Regulator ApMYB1 with Potential for Breeding Color-Leafed Plants. Plants 2022, 11, 759. [Google Scholar] [CrossRef]
  10. Liu, Y.; Wang, S.; Feng, S.; Yan, S.; Li, Y.; Huang, Y.; Yang, M. Combined whole transcriptome analysis and physical-chemical reveals the leaf color change mechanism of Ulmus pulima under heat stress. Environ. Exp. Bot. 2023, 210, 105347. [Google Scholar] [CrossRef]
  11. Yan, Y.; Liu, Q.; Yan, K.; Wang, X.; Xu, P. Transcriptomic and metabolomic analyses reveal how girdling promotes leaf color expression in Acer rubrum L. BMC Plant Biol. 2022, 22, 498. [Google Scholar] [CrossRef]
  12. Li, W.; Wang, L.; He, Z.; Lu, Z.; Cui, J.; Xu, N.; Jin, B.; Wang, L. Physiological and Transcriptomic Changes during Autumn Coloration and Senescence in Ginkgo biloba Leaves. Hortic. Plant J. 2020, 6, 396–408. [Google Scholar] [CrossRef]
  13. Lo Piccolo, E.; Landi, M.; Massai, R.; Remorini, D.; Guidi, L. Girled-induced anthocyanin accumulation in red-leafed Prunus cerasifera: Effect on photosynthesis, photoprotection and sugar metabolism. Plant Sci. 2020, 294, 110456. [Google Scholar] [CrossRef] [PubMed]
  14. Chen, X.; Wang, P.; Zheng, Y.; Gu, M.; Lin, X.; Wang, S.; Jin, S.; Ye, N. Comparison of Metabolome and Transcriptome of Flavonoid Biosynthesis Pathway in a Purple-Leaf Tea Germplasm Jinmingzao and a Green-Leaf Tea Germplasm Huangdan reveals Their Relationship with Genetic Mechanisms of Color Formation. Int. J. Mol. Sci. 2020, 21, 4167. [Google Scholar] [CrossRef]
  15. Guo, P.; Huang, Z.; Zhao, W.; Lin, N.; Wang, Y.; Shang, F. Mechanisms for leaf color changes in Osmanthus fragrans ‘Ziyan Gongzhu’ using physiology, transcriptomics and metabolomics. BMC Plant Biol. 2023, 23, 453. [Google Scholar] [CrossRef]
  16. Perico, C.; Tan, S.; Langdale, J.A. Developmental regulation of leaf venation patterns: Monocot versus eudicots and the role of auxin. New Phytol. 2022, 234, 783–803. [Google Scholar] [CrossRef]
  17. Verma, S.; Attuluri, V.P.S.; Robert, H.S. An Essential Function for Auxin in Embryo Development. Cold Spring Harb. Perspect. Biol. 2021, 13, a039966. [Google Scholar] [CrossRef]
  18. Cavallari, N.; Artner, C.; Benkova, E. Auxin-Regulated Lateral Root Organogenesis. Cold Spring Harb. Perspect. Biol. 2021, 13, a039941. [Google Scholar] [CrossRef]
  19. Goldental-Cohen, S.; Israeli, A.; Ori, N.; Yasuor, H. Auxin Response Dynamics During Wild-Type and entire Flower Development in Tomato. Plant Cell Physiol. 2017, 58, 1661–1672. [Google Scholar] [CrossRef]
  20. Luo, W.-G.; Liang, Q.-W.; Su, Y.; Huang, C.; Mo, B.-X.; Yu, Y.; Xiao, L.-T. Auxin inhibits chlorophyll accumulation through ARF7-IAA14-mediated repression of chlorophyll biosynthesis genes in Arabidopsis. Front. Plant Sci. 2023, 14, 1172059. [Google Scholar] [CrossRef]
  21. Yuan, Y.; Xu, X.; Gong, Z.; Tang, Y.; Wu, M.; Yan, F.; Zhang, X.; Zhang, Q.; Yang, F.; Hu, X.; et al. Auxin response factor 6A regulates photosynthesis, sugar accumulation, and fruit development in tomato. Hortic. Res. 2019, 6, 85. [Google Scholar] [CrossRef] [PubMed]
  22. Wang, C.-K.; Han, P.-L.; Zhao, Y.-W.; Yu, J.-Q.; You, C.-X.; Hu, D.-G.; Hao, Y.-J. Genome-wide analysis of auxin response factor (ARF) genes and functional identification of MdARF2 reveals the involvement in the regulation of anthocyanin accumulation in apple. N. Z. J. Crop Hortic. Sci. 2020, 49, 78–91. [Google Scholar] [CrossRef]
  23. Maritim, T.K.; Masand, M.; Seth, R.; Sharma, R.K. Transcriptional analysis reveals key insights into seasonal induced anthocyanin degradation and leaf color transition in purple tea (Camellia sinensis (L.) O. Kuntze). Sci. Rep. 2021, 11, 1244. [Google Scholar] [CrossRef]
  24. Duan, W.; Li, X.; Li, Q.; Jing, R.; Zhang, S.; Zhang, B.; Hamel, C.; Sheng, M. Arbuscular mycorrhizal fungal community association determines the production of flavonoids and chlorogenic acid in Acer truncatum Bunge. Ind. Crops Prod. 2024, 208, 117858. [Google Scholar] [CrossRef]
  25. Fan, H.; Sun, L.; Yang, L.; Zhou, J.; Yin, P.; Li, K.; Xue, Q.; Li, X.; Liu, Y. Assessment of the bioactive phenolic composition of Acer truncatum seed coat as a byproduct of seed oil. Ind. Crops Prod. 2018, 118, 11–19. [Google Scholar] [CrossRef]
  26. Liang, Q.; Wang, W.; Yuan, F.; Liu, X.; Li, D.; Yang, K.Q. Characterization of yuanbaofeng (Acer truncatum Bunge) samaras: Oil, fatty acid, and phytosterol content. Ind. Crops Prod. 2019, 135, 344–351. [Google Scholar] [CrossRef]
  27. Gu, R.; Rybalov, L.; Negrin, A.; Morcol, T.; Long, W.; Myers, A.K.; Isaac, G.; Yuk, J.; Kennelly, E.J.; Long, C. Metabolic Profiling of Different Parts of Acer truncatum from the Mongolian Plateau Using UPLC-QTOF-MS with Comparative Bioactivity Assays. J. Agric. Food Chem. 2019, 67, 1585–1597. [Google Scholar] [CrossRef]
  28. Ma, Q.; Sun, T.; Li, S.; Wen, J.; Zhu, L.; Yin, T.; Yan, K.; Xu, X.; Li, S.; Mao, J.; et al. The Acer truncatum genome provides insights into nervonic acid biosynthesis. Plant J. 2020, 104, 662–678. [Google Scholar] [CrossRef]
  29. Zhai, Y.; Shen, X.; Sun, Y.; Liu, Q.; Ma, N.; Zhang, X.; Jia, Q.; Liang, Z.; Wang, D. Genome-wide investigation of ARF transcription factor gene family and its responses to abiotic stress in Coix (Coix lacryma-jobi L.). Protoplasma 2023, 260, 1389–1405. [Google Scholar] [CrossRef]
  30. Niu, X.; Guan, Y.; Chen, S.; Li, H. Genome-wide analysis of basic helix-loop-helix (bHLH) transcription factors in Brachypodium distachyon. BMC Genom. 2017, 18, 619. [Google Scholar] [CrossRef]
  31. Mo, Z.; Zhang, Y.; Hu, L.; Zhai, M.; Xuan, J. Genome-wide identification and expression analysis of auxin response factor (ARF) gene family in pecan indicates its possible roles during graft union formation. Sci. Hortic. 2023, 322, 112401. [Google Scholar] [CrossRef]
  32. Mei, M.; Ai, W.; Liu, L.; Xu, X.; Lu, X. Genome-wide identification of the auxin response factor (ARF) gene family in Magnolia sieboldii and functional analysis of MsARF5. Front. Plant Sci. 2022, 13, 958816. [Google Scholar] [CrossRef]
  33. Qi, Y.; Wang, L.; Li, W.; Dang, Z.; Xie, Y.; Zhao, W.; Zhao, L.; Li, W.; Yang, C.; Xu, C.; et al. Genome-Wide Identification and Expression Analysis of Auxin Response Factor Gene Family in Linum usitatissimum. Int. J. Mol. Sci. 2023, 24, 11006. [Google Scholar] [CrossRef]
  34. Okushima, Y.; Overvoorde, P.J.; Arima, K.; Alonso, J.M.; Chan, A.; Chang, C.; Ecker, J.R.; Hughes, B.; Lui, A.; Nguyen, D.; et al. Functional Genomic Analysis of theAUXIN RESPONSE FACTORGene Family Members in Arabidopsis thaliana: Unique and Overlapping Functions ofARF7andARF19. Plant Cell 2005, 17, 444–463. [Google Scholar] [CrossRef]
  35. Ma, F.; Zhang, F.; Zhu, Y.; Lan, D.; Yan, P.; Wang, Y.; Hu, Z.; Zhang, X.; Hu, J.; Niu, F.; et al. Auxin signaling module OsSK41-OsIAA10-OsARF regulates grain yield traits in rice. J. Integr. Plant Biol. 2023, 65, 1753–1766. [Google Scholar] [CrossRef]
  36. Suri, G.S.; Tiwari, M. Frontline Warrior microRNA167: A Battle of Survival. Int. J. Plant Biol. 2022, 13, 598–600. [Google Scholar] [CrossRef]
  37. Gambhir, P.; Singh, V.; Parida, A.; Raghuvanshi, U.; Kumar, R.; Sharma, A.K. Ethylene response factor ERF.D7 activates auxin response factor 2 paralogs to regulate tomato fruit ripening. Plant Physiol. 2022, 190, 2775–2796. [Google Scholar] [CrossRef] [PubMed]
  38. Su, Z.; Wang, L.; Li, W.; Zhao, L.; Huang, X.; Azam, S.M.; Qin, Y. Genome-Wide Identification of Auxin Response Factor (ARF) Genes Family and its Tissue-Specific Prominent Expression in Pineapple (Ananas comosus). Trop. Plant Biol. 2017, 10, 86–96. [Google Scholar] [CrossRef]
  39. Feng, X.; Gao, G.; Yu, C.; Zhu, A.; Chen, J.; Chen, K.; Wang, X.; Abubakar, A.S.; Chen, P. Transcriptome and metabolome analysis reveals anthocyanin biosynthesis pathway associated with ramie (Boehmeria nivea (L.) Gaud.) leaf color formation. BMC Genom. 2021, 22, 684. [Google Scholar] [CrossRef]
  40. Zou, J.; Gong, Z.; Liu, Z.; Ren, J.; Feng, H. Investigation of the Key Genes Associated with Anthocyanin Accumulation during Inner Leaf Reddening in Ornamental Kale (Brassica oleracea L. var. acephala). Int. J. Mol. Sci. 2023, 24, 2837. [Google Scholar] [CrossRef]
  41. Arpita, K.; Sharma, S.; Srivastava, H.; Kumar, K.; Mushtaq, M.; Gupta, P.; Jain, R.; Gaikwad, K. Genome-wide survey, molecular evolution and expression analysis of Auxin Response Factor (ARF) gene family indicating their key role in seed number per pod in pigeonpea (C. cajan L. Millsp.). Int. J. Biol. Macromol. 2023, 253, 126833. [Google Scholar] [CrossRef]
  42. Chen, G.; Yue, Y.; Li, L.; Li, Y.; Li, H.; Ding, W.; Shi, T.; Yang, X.; Wang, L. Genome-Wide Identification of the Auxin Response Factor (ARF) Gene Family and Their Expression Analysis during Flower Development of Osmanthus fragrans. Forests 2020, 11, 245. [Google Scholar] [CrossRef]
  43. Shen, C.; Yue, R.; Sun, T.; Zhang, L.; Xu, L.; Tie, S.; Wang, H.; Yang, Y. Genome-wide identification and expression analysis of auxin response factor gene family in Medicago truncatula. Front. Plant Sci. 2015, 6, 73. [Google Scholar] [CrossRef] [PubMed]
  44. Kalluri, U.C.; DiFazio, S.P.; Brunner, A.M.; Tuskan, G.A. Genome-wide analysis of Aux/IAA and ARF gene families in Populus trichocarpa. BMC Plant Biol. 2007, 7, 59. [Google Scholar] [CrossRef] [PubMed]
  45. Liu, Y.; Jiang, H.; Chen, W.; Qian, Y.; Ma, Q.; Cheng, B.; Zhu, S. Genome-wide analysis of the auxin response factor (ARF) gene family in maize (Zea mays). Plant Growth Regul. 2010, 63, 225–234. [Google Scholar] [CrossRef]
  46. Babenko, V.N. Prevalence of intron gain over intron loss in the evolution of paralogous gene families. Nucleic Acids Res. 2004, 32, 3724–3733. [Google Scholar] [CrossRef] [PubMed]
  47. Peng, Y.; Fang, T.; Zhang, Y.; Zhang, M.; Zeng, L. Genome-Wide Identification and Expression Analysis of Auxin Response Factor (ARF) Gene Family in Longan (Dimocarpus longan L.). Plants 2020, 9, 221. [Google Scholar] [CrossRef] [PubMed]
  48. Roosjen, M.; Paque, S.; Weijers, D. Auxin Response Factors: Output control in auxin biology. J. Exp. Bot. 2018, 69, 179–188. [Google Scholar] [CrossRef] [PubMed]
  49. Liu, Y.; Wang, R.; Yu, J.; Huang, S.; Zhang, Y.; Wei, H.; Wei, Z. Genome-Wide Identification and Characterization of Auxin Response Factor (ARF) Gene Family Involved in Wood Formation and Response to Exogenous Hormone Treatment in Populus trichocarpa. Int. J. Mol. Sci. 2023, 24, 740. [Google Scholar] [CrossRef]
  50. Li, L.; Li, Y.; Quan, W.; Ding, G. Effects of PmaIAA27 and PmaARF15 genes on drought stress tolerance in pinus massoniana. BMC Plant Biol. 2023, 23, 478. [Google Scholar] [CrossRef]
  51. Zhang, A.; Yang, X.; Lu, J.; Song, F.; Sun, J.; Wang, C.; Lian, J.; Zhao, L.; Zhao, B. OsIAA20, an Aux/IAA protein, mediates abiotic stress tolerance in rice through an ABA pathway. Plant Sci. 2021, 308, 110903. [Google Scholar] [CrossRef] [PubMed]
  52. Xu, H.; Liu, Y.; Zhang, S.; Shui, D.; Xia, Z.; Sun, J. Genome-wide identification and expression analysis of the AUX/IAA gene family in turnip (Brassica rapa ssp. rapa). BMC Plant Biol. 2023, 23, 342. [Google Scholar] [CrossRef] [PubMed]
  53. Aerts, N.; Pereira Mendes, M.; Van Wees, S.C.M. Multiple levels of crosstalk in hormone networks regulating plant defense. Plant J. 2020, 105, 489–504. [Google Scholar] [CrossRef] [PubMed]
  54. Jiang, W.; Xia, Y.; Su, X.; Pang, Y. ARF2 positively regulates flavonols and proanthocyanidins biosynthesis in Arabidopsis thaliana. Planta 2022, 256, 44. [Google Scholar] [CrossRef] [PubMed]
  55. Li, H.L.; Liu, Z.Y.; Wang, X.N.; Han, Y.; You, C.X.; An, J.P. E3 ubiquitin ligases SINA4 and SINA11 regulate anthocyanin biosynthesis by targeting the IAA29-ARF5-1-ERF3 module in apple. Plant Cell Environ. 2023, 46, 3902–3918. [Google Scholar] [CrossRef] [PubMed]
  56. Goetz, M.; Vivian-Smith, A.; Johnson, S.D.; Koltunow, A.M. AUXIN RESPONSE FACTOR8 Is a Negative Regulator of Fruit Initiation in Arabidopsis. Plant Cell 2006, 18, 1873–1886. [Google Scholar] [CrossRef]
Figure 1. Sample relationship analysis and differentially expressed genes. (A) Sample correlation test. (B) Venn diagram. (C) Volcano map differentially expressed genes. The red dots represent up-regulated genes in this group, the blue dots represent down-regulated genes in this group, and the gray dots represent non significantly differentially expressed genes.
Forests 15 01723 g001
Figure 2. Enrichment analysis and pathway analysis of DEGs in different comparison groups. (A) The GO enrichment analysis results of differentially expressed genes were selected, and the top 10 GO terms with the smallest p-value or the most significant enrichment were selected from each GO classification for display. (B) Based on the KEGG enrichment analysis of differentially expressed genes, the top 10 pathways with the smallest p-value and the most significant enrichment were selected for display.
Forests 15 01723 g002
Figure 3. Venn diagrams and phylogenetic tree of the ARF gene family. (A) Genes annotated as ARFs with different groups of Venn diagrams. RG was a comparison group of red and green leaves. MG was a comparison group of middle and green leaves. (B) Phylogenetic tree in Acer truncatum, Vitis vinifera, Oryza sativa subsp. indica, Malus pumila, and Arabidopsis thalian. Members of five species are marked with symbols of different colors. The black triangle represents the AtARFs.
Forests 15 01723 g003
Figure 4. Phylogenetic tree, gene structure, distribution, and the sequences of conserved motifs for the AtARF proteins. (A) The tree was constructed of 22 chrysanthemum AtARF proteins using the neighbor-joining method. The right portion shows the distribution of conserved motifs in AtARF proteins. (B) Conservative sequence of AtARF proteins. (C) Exon–intron regions of AtARFs. (D) ARF protein motifs as derived by MEME analysis.
Forests 15 01723 g004
Figure 5. The cis-acting elements of the promoter sequences (2000 bp) of 22 AtARFs. The points on the straight line in the figure indicate the position of the cis-acting element on the 2000 bp sequence upstream of the transcript.
Forests 15 01723 g005
Figure 6. Location and colinearity of AtARFs. (A) Chromosomal location of AtARF transcription factors. AtARFs generating tandem duplicates were connected using red lines. (B) Intraspecific covariance in metazoan maple. The gene density heatmap, gene density fold plot, and gene location on chromosomes are indicated from within to within. (C) Interspecific covariance of ARFs.
Forests 15 01723 g006
Figure 7. Different transcriptional expression levels of AtARFs. (A) The expression of AtARFs was febrile. Red and blue represent higher and lower transcriptional expression abundance, respectively. The yellow square indicates no transcriptional expression. (B) The expression patterns of AtARFs in different leaf colors from qRT-PCR (* p < 0.05, ** p < 0.01, *** p < 0.001 and **** p < 0.0001).
Forests 15 01723 g007
Disclaimer/Publisher’s Note: The statements, opinions and data contained in all publications are solely those of the individual author(s) and contributor(s) and not of MDPI and/or the editor(s). MDPI and/or the editor(s) disclaim responsibility for any injury to people or property resulting from any ideas, methods, instructions or products referred to in the content.

