Article

Assessing Drought Impacts on Gross Primary Productivity of Rubber Plantations Using Flux Observations and Remote Sensing in China and Thailand

1
Climate Center of Hainan Province, Haikou 570203, China
2
Key Laboratory of Meteorological Disaster Prevention and Reduction in South China Sea, Haikou 570203, China
3
China Meteorological Administration Training Centre, Beijing 100081, China
4
Department of Forest Sciences, University of Helsinki, 00014 Helsinki, Finland
5
Hainan Provincial Meteorological Science Research Institute, Haikou 570311, China
*
Author to whom correspondence should be addressed.
Forests 2024, 15(10), 1732; https://doi.org/10.3390/f15101732
Submission received: 22 August 2024 / Revised: 21 September 2024 / Accepted: 27 September 2024 / Published: 29 September 2024
(This article belongs to the Section Forest Inventory, Modeling and Remote Sensing)

Abstract

:
Rubber (Hevea brasiliensis Muell.) plantations are vital agricultural ecosystems in tropical regions. These plantations provide key industrial raw materials and sequester large amounts of carbon dioxide, playing a vital role in the global carbon cycle. Climate change has intensified droughts in Southeast Asia, negatively affecting rubber plantation growth. Limited in situ observations and short monitoring periods hinder accurate assessment of drought impacts on the gross primary productivity (GPP) of rubber plantations. This study used GPP data from flux observations at four rubber plantation sites in China and Thailand, along with solar-induced chlorophyll fluorescence (SIF), enhanced vegetation index (EVI), normalized difference vegetation index (NDVI), near-infrared reflectance of vegetation (NIRv), and photosynthetically active radiation (PAR) indices, to develop a robust GPP estimation model. The model reconstructed eight-day interval GPP data from 2001 to 2020 for the four sites. Finally, the study analyzed the seasonal drought impacts on GPP in these four regions. The results indicate that the GPP prediction model developed using SIF, EVI, NDVI, NIRv, and PAR has high accuracy and robustness. The model’s predictions have a relative root mean square error (rRMSE) of 0.22 compared to flux-observed GPP, with smaller errors in annual GPP predictions than the MOD17A3HGF model, thereby better reflecting the interannual variability in the GPP of rubber plantations. Drought significantly affects rubber plantation GPP, with impacts varying by region and season. In China and northern Thailand (NR site), short-term (3 months) and long-term (12 months) droughts during cool and warm dry seasons cause GPP declines of 4% to 29%. Other influencing factors may alleviate or offset GPP reductions caused by drought. During the rainy season across all four regions and the cool dry season with adequate rainfall in southern Thailand (SR site), mild droughts have negligible effects on GPP and may even slightly increase GPP values due to enhanced PAR. Overall, the study shows that drought significantly impacts rubber the GPP of rubber plantations, with effects varying by region and season. When assessing drought’s impact on rubber plantation GPP or carbon sequestration, it is essential to consider differences in drought thresholds within the climatic context.

1. Introduction

Understanding how vegetation absorbs carbon dioxide is crucial for comprehending the Earth’s carbon cycle. Gross primary production (GPP) measures carbon sequestration through photosynthesis and is a key terrestrial carbon exchange, driving growth and respiration [1,2,3]. Forests are crucial to Earth’s ecosystems and are the largest carbon reservoirs, sequestering about two-thirds of the carbon fixed by land systems annually, helping mitigate rising atmospheric CO2 levels [4]. Therefore, studying the carbon sequestration capacity of forests is central to achieving carbon neutrality and addressing global climate change [5]. A decline in photosynthetic productivity due to drought weakens their role as a carbon sink. Recent research has shown that droughts, especially in mainland Southeast Asia, have significantly impacted agricultural and natural ecosystems, with prolonged and frequent drought conditions observed in countries like Cambodia and Thailand. Such events have led to a decrease in vegetation health and productivity, further exacerbating the challenge of maintaining carbon sequestration capabilities in these regions [6,7].
Rubber (Hevea brasiliensis Muell.) plantations provide essential industrial materials, have significant economic value, and possess carbon sequestration potential. Rising latex consumption has led to increased and expanding global cultivation of rubber plantations, especially in tropical rainforest regions [8,9,10,11]. Southeast Asia, with its favorable climate and conditions, is the world’s primary natural rubber cultivation area, accounting for over 80% of global plantations. Over the past two decades, rubber cultivation has expanded from traditional areas to nearly all tropical regions, including Malaysia, Laos, Myanmar, Thailand, Vietnam, and Cambodia, exceeding one million hectares. However, this expansion often replaces pristine or secondary forests, causing biodiversity loss, reduced soil and water conservation, regional environmental degradation, and weakened vegetation resilience to weather-related disasters [12,13,14,15]. Recent studies have highlighted the ecological consequences of this expansion, including increased vulnerability to drought and extreme weather events, which threaten the sustainability of these plantations. Studies using advanced remote sensing techniques have highlighted that the expansion of rubber plantations into ecologically sensitive regions, particularly in Cambodia, Laos, and Vietnam, has led to a notable decrease in vegetation resilience. These areas are increasingly susceptible to both short-term meteorological droughts and long-term agricultural drought conditions, which further threaten the sustainability of rubber plantation ecosystems [16,17]. Despite the importance of rubber plantations in global carbon cycling, there is a critical gap in understanding how drought specifically affects their GPP and overall carbon balance, particularly in the context of ongoing climate change. Moreover, the complex interactions between drought indices and vegetation responses in tropical regions show that different vegetation types and altitudes respond variably to drought, with rainfed crops and mixed forests being particularly vulnerable. Understanding the response of rubber plantations’ GPP to drought is crucial for their rational development, forest ecosystem protection, carbon sink balance, and climate change stability [7,16].
Drought is a critical factor contributing to the decline in forest photosynthetic productivity, thereby weakening their role as carbon sinks. The 2015/2016 El Niño event caused prolonged severe drought (drought affected area up to 75.6% [18]) and high temperatures (2.34 °C above average in April 2016) in Southeast Asia [19,20]. Remote sensing and biosphere models observed abnormal carbon flux and a significant decline in photosynthesis across Southeast Asia [21,22]. A study on changes in GPP during drought in rubber plantations in northern and southern Thailand showed that northern plantations depend on soil moisture content, and high light levels can offset the negative effects of drought on rubber GPP. In contrast, southern plantations in humid regions are more sensitive to PAR [23]. Using flux observations from rubber plantations in Hainan Island, China, the EC-LUE and SEIB-DGVM models indicate that the GPP of rubber trees is significantly affected by extreme and prolonged droughts, showing greater sensitivity to droughts in the early rainy season [24,25]. A study on rubber plantations in Xishuangbanna, China, found that winter cold stress causes rubber trees to concentrate leaf shedding in January and February, which is a dominant factor affecting the net ecosystem exchange (NEE) of rubber plantations [25].
In recent years, sun-induced chlorophyll fluorescence (SIF) has been widely used as a more reliable method for directly monitoring vegetation activity. Studies have shown that SIF measures the photosynthetic capacity determined by chlorophyll concentration and environmental conditions, providing significant improvements over reflectance-based vegetation indices in estimating GPP [26]. Traditional vegetation indices (such as NDVI and EVI) only reflect static information during vegetation growth (such as leaf number, pigment content, and canopy structure) [27]. Tropical vegetation, often being evergreen, shows relatively small annual changes in greenness, and the same greenness index can correspond to large variations in photosynthetic activity [28,29], making these indices less sensitive for tropical evergreen crops. Compared to traditional vegetation indices, SIF can reveal changes in vegetation health and environmental stress impacts earlier [30,31,32]. SIF can detect subtle spring changes in evergreen forests that traditional greenness indices cannot differentiate [33], and it can also reflect rapid changes in canopy water stress [34]. During the early stages of drought and heatwave events, SIF levels decrease earlier and more significantly than the traditional vegetation index EVI [35]. For example, during the severe meteorological drought in the Amazon from August 2015 to July 2016, overall forest greenness slightly increased due to enhanced solar radiation, with 21.6% of the forest becoming even greener. However, SIF, as an indicator of photosynthetic capacity, significantly decreased [36]. In monitoring drought effects in rubber plantations, the GOSIF product derived from the OCO-2 satellite outperforms the normalized difference vegetation index (NDVI) and enhanced vegetation index (EVI) in detecting GPP and drought effects. Additionally, incorporating near-infrared reflectance of vegetation (NIRv) allows for a more accurate representation of the relationship between SIF and GPP [37].
To explore the potential impact of drought on GPP in different rubber plantation zones, we utilized carbon and water flux data from four rubber plantation sites in China and Thailand, specifically situated in the traditional southern region of Thailand, the northern region of Thailand, Hainan Island in China, and Xishuangbanna in China. Initially, we investigated the relationship between GPP measured at rubber forest flux observation stations across the four regions and satellite remote sensing indices, subsequently establishing a model for the inversion of GPP using remote sensing indices. Second, we integrated the long time series of GPP inverted from satellite remote sensing with drought indices. The specific questions addressed in this study include the following: (a) assessing the feasibility and accuracy of using remote sensing indices to estimate GPP in rubber plantations; and (b) quantifying the seasonal impacts of drought on GPP across different rubber forest ecosystems.
Addressing these questions will elucidate the implications of drought variability induced by climate change on carbon and water cycling within rubber forests, shedding light on how these systems respond under evolving climatic conditions.

2. Materials and Methods

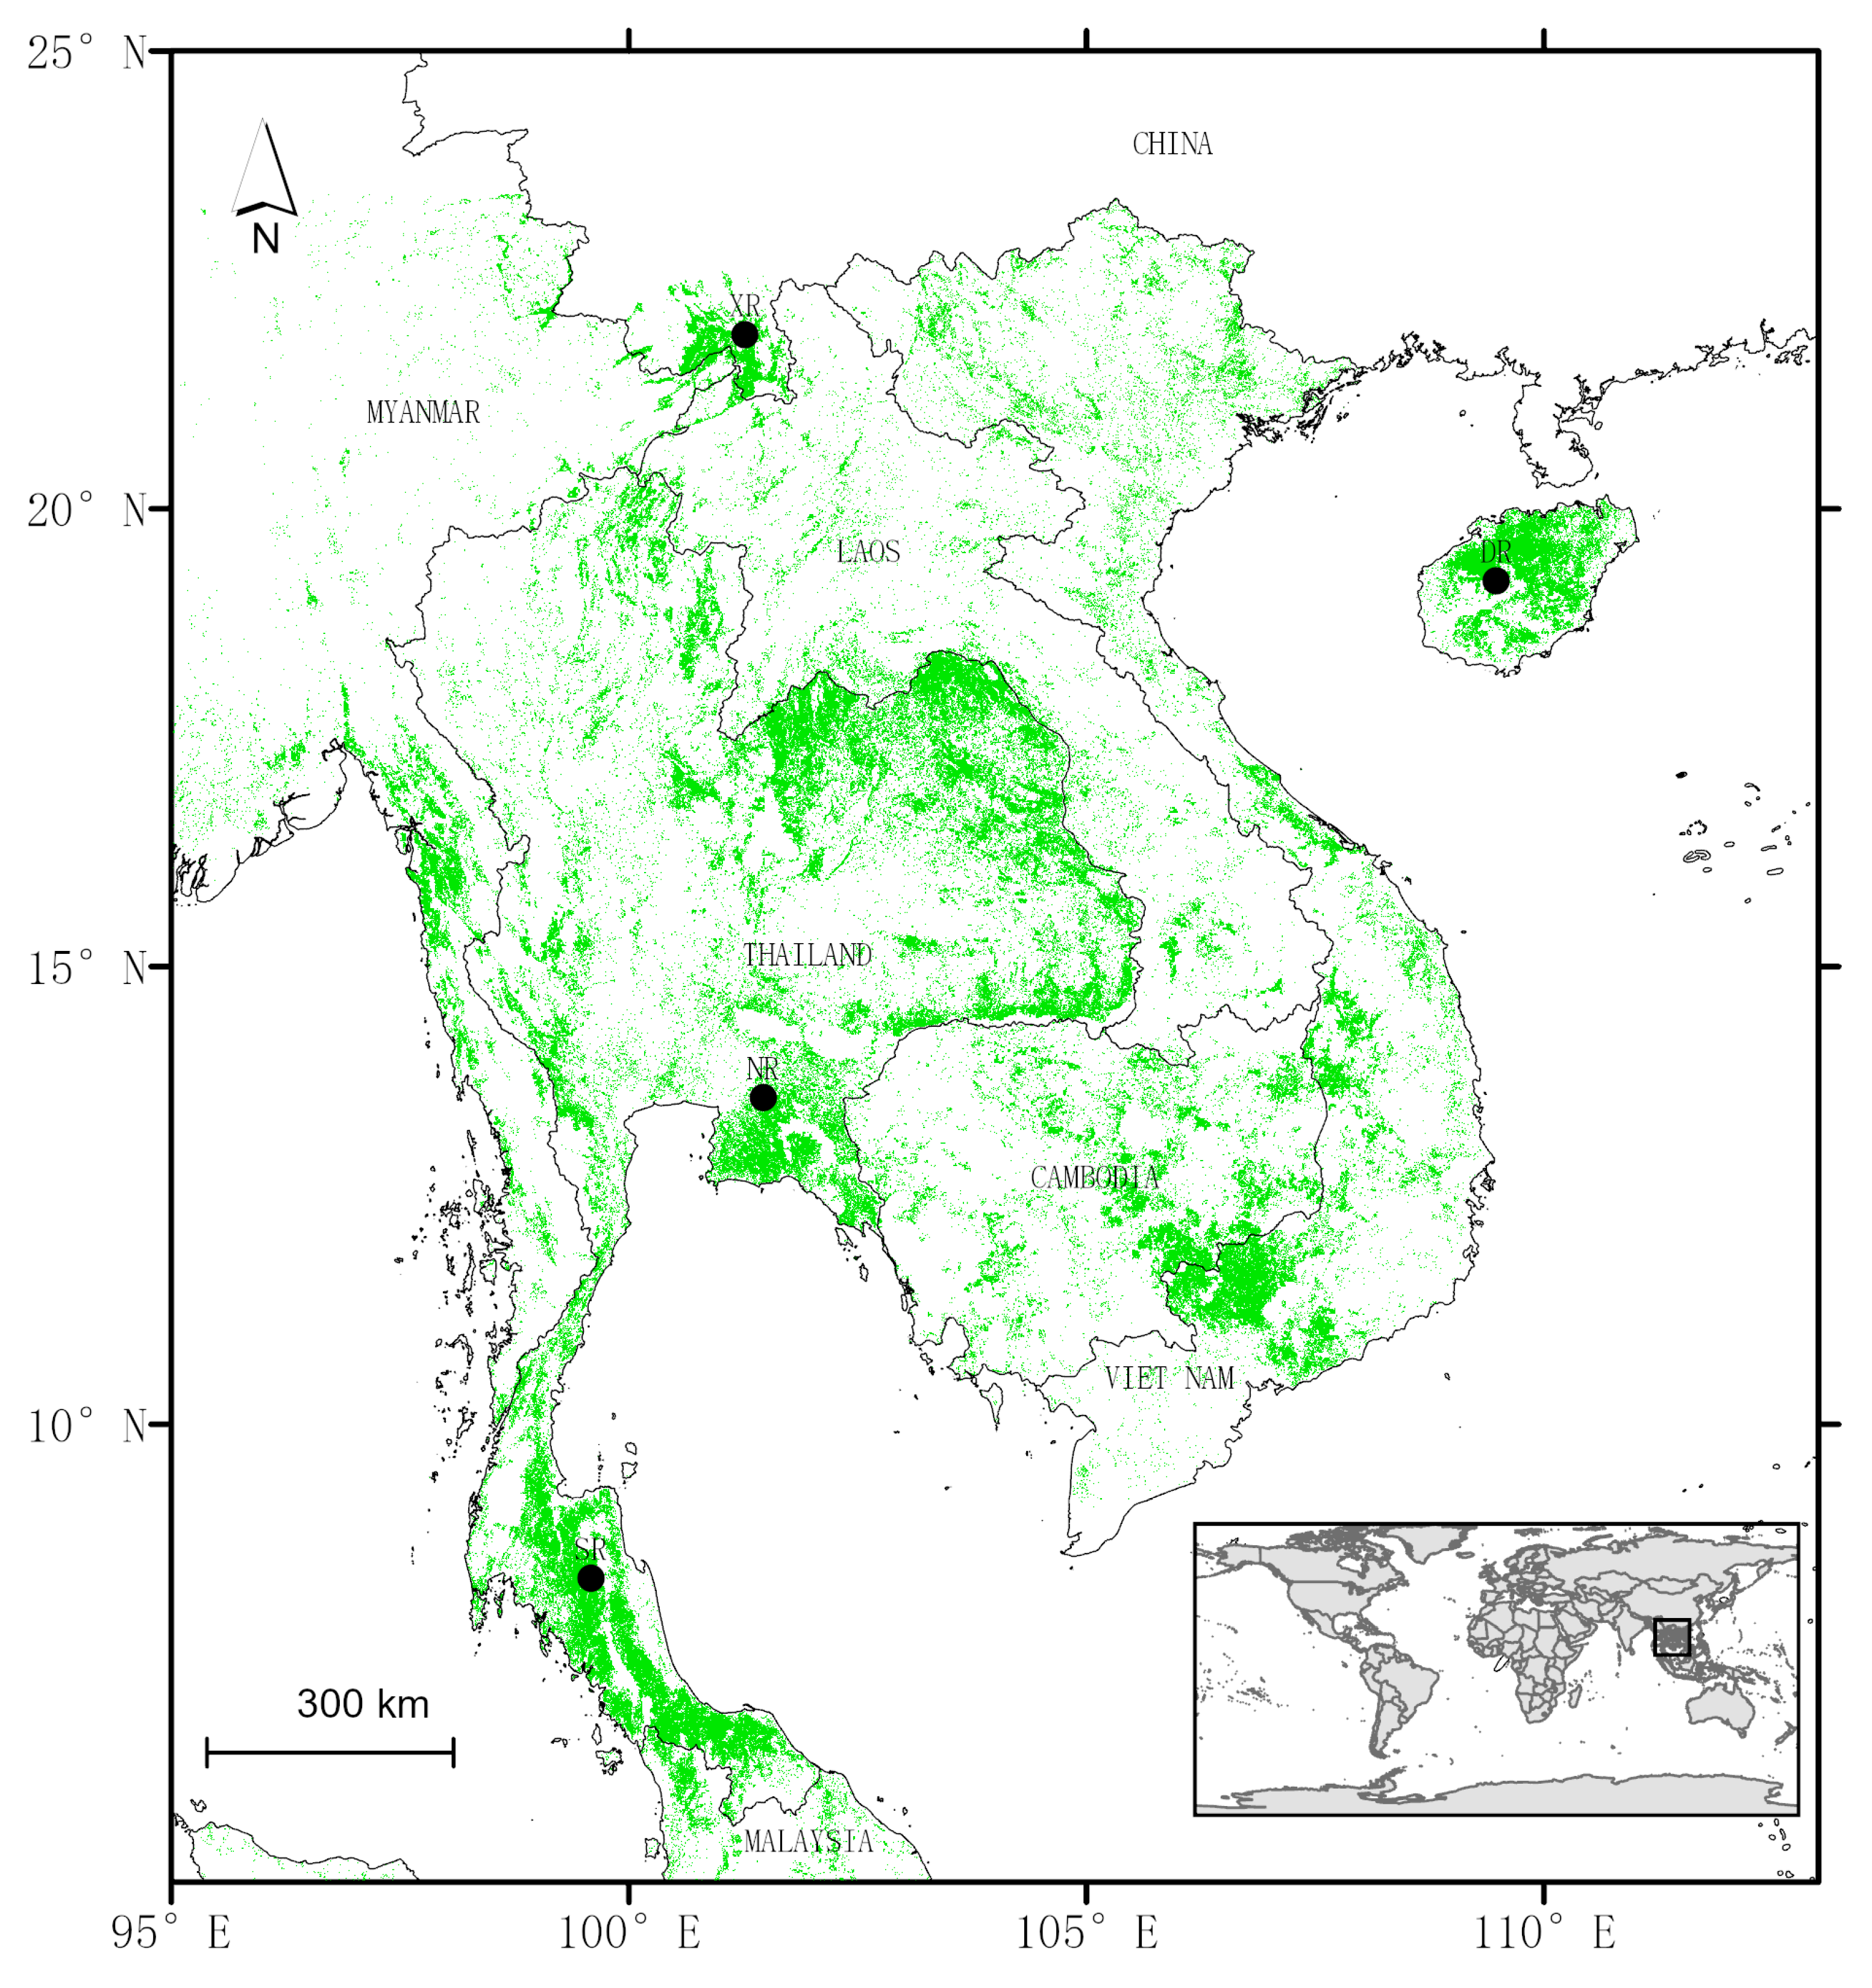
2.1. Flux Site Description

In this study, data from flux observation stations in China and Thailand were selected, and their locations are shown in Figure 1. The green areas on the map indicate where the rubber tree forests are located [38,39]. Two are located in China (Hainan Island and Xishuangbanna), and two are located in Thailand (Chachoengsao and Nakhon Si Thammarat) (Table 1).
The rubber plantation flux observation station in Danzhou (DR), China, is located at the third experimental area of the Chinese Academy of Tropical Agricultural Sciences Experimental Farm in northwest Hainan Island (109.48° E, 19.21° N), with an average elevation of 144.0 m. This region has a tropical island monsoon climate with abundant water and heat conditions, an average annual sunshine duration of over 2000 h, and distinct wet and dry seasons (wet season from May to October, dry season from November to April) [40]. The observation plot is a mature rubber tree plantation established in 2001, with a community height of about 18.0 m, and the tapping season occurs from May to December. The data used in this paper are from the Yang dataset [40]; for more detailed explanations, please refer to the dataset descriptions.
The rubber plantation flux tower in Xishuangbanna (XR), China, is located in a rubber plantation under the jurisdiction of the Economic Extension Station of the Xishuangbanna Tropical Botanical Garden, Chinese Academy of Sciences (101.27° E, 21.90° N), with an average elevation of 592 m. This region belongs to the tropical monsoon climate zone, controlled year round by the Indian monsoon [41]. According to local climate data, the region can be divided into a half-year wet season (May to October) and a half-year dry season (November to April), with the dry season further divided into a foggy cool season (November to February) and a hot dry season (March to April) [41]. The vegetation of the flux tower plot includes rubber trees planted in 1982, with a community height of about 21 m. The tapping period is from April to November, coinciding with the wet season. Additionally, it is important to note that this area is located in a river valley, with the Luosuo River, a tributary of the Lancang River, flowing nearby (500 m). The data used in this paper are from an open access dataset [41]; for more detailed explanations, please refer to the dataset descriptions.
Thailand exhibits typical tropical monsoon climate characteristics. The annual average temperature in this region has remained stable. The wet season from May to October is significantly influenced by the Southwest Asian monsoon. Based on the cyclical variations in air temperature and precipitation, the year can be divided into three seasons: the cool dry season (November to February), the warm dry season (March and April), and the wet season (May to October) [23]. One of the rubber plantation flux observation stations in Thailand is located in the southern region (SR) of Nakhon Si Thammarat Province (99.58° E, 8.32° N, elevation 200 m), a traditional rubber-growing area with a tropical equatorial climate. The RRIM600 clone rubber trees planted here cover an area of 16 hectares. The other station is located in the northern rubber plantation (NR) along the Gulf of Thailand in Chachoengsao Province, eastern Thailand (101.47° E, 13.57° N, elevation 69 m), considered a marginal area for rubber growth due to its lower precipitation compared to traditional growing areas. Details of the rubber plantation include the use of the most common RRIM600 clone in Thailand. Both rubber plantations are monocultures with exposed ground under the canopy. The rubber trees in both plantations are of varying ages, but all trees are mature. From May to January of the following year, rubber trees are tapped every two to three days to collect latex. The data used in this paper are from the study by Wang [23].

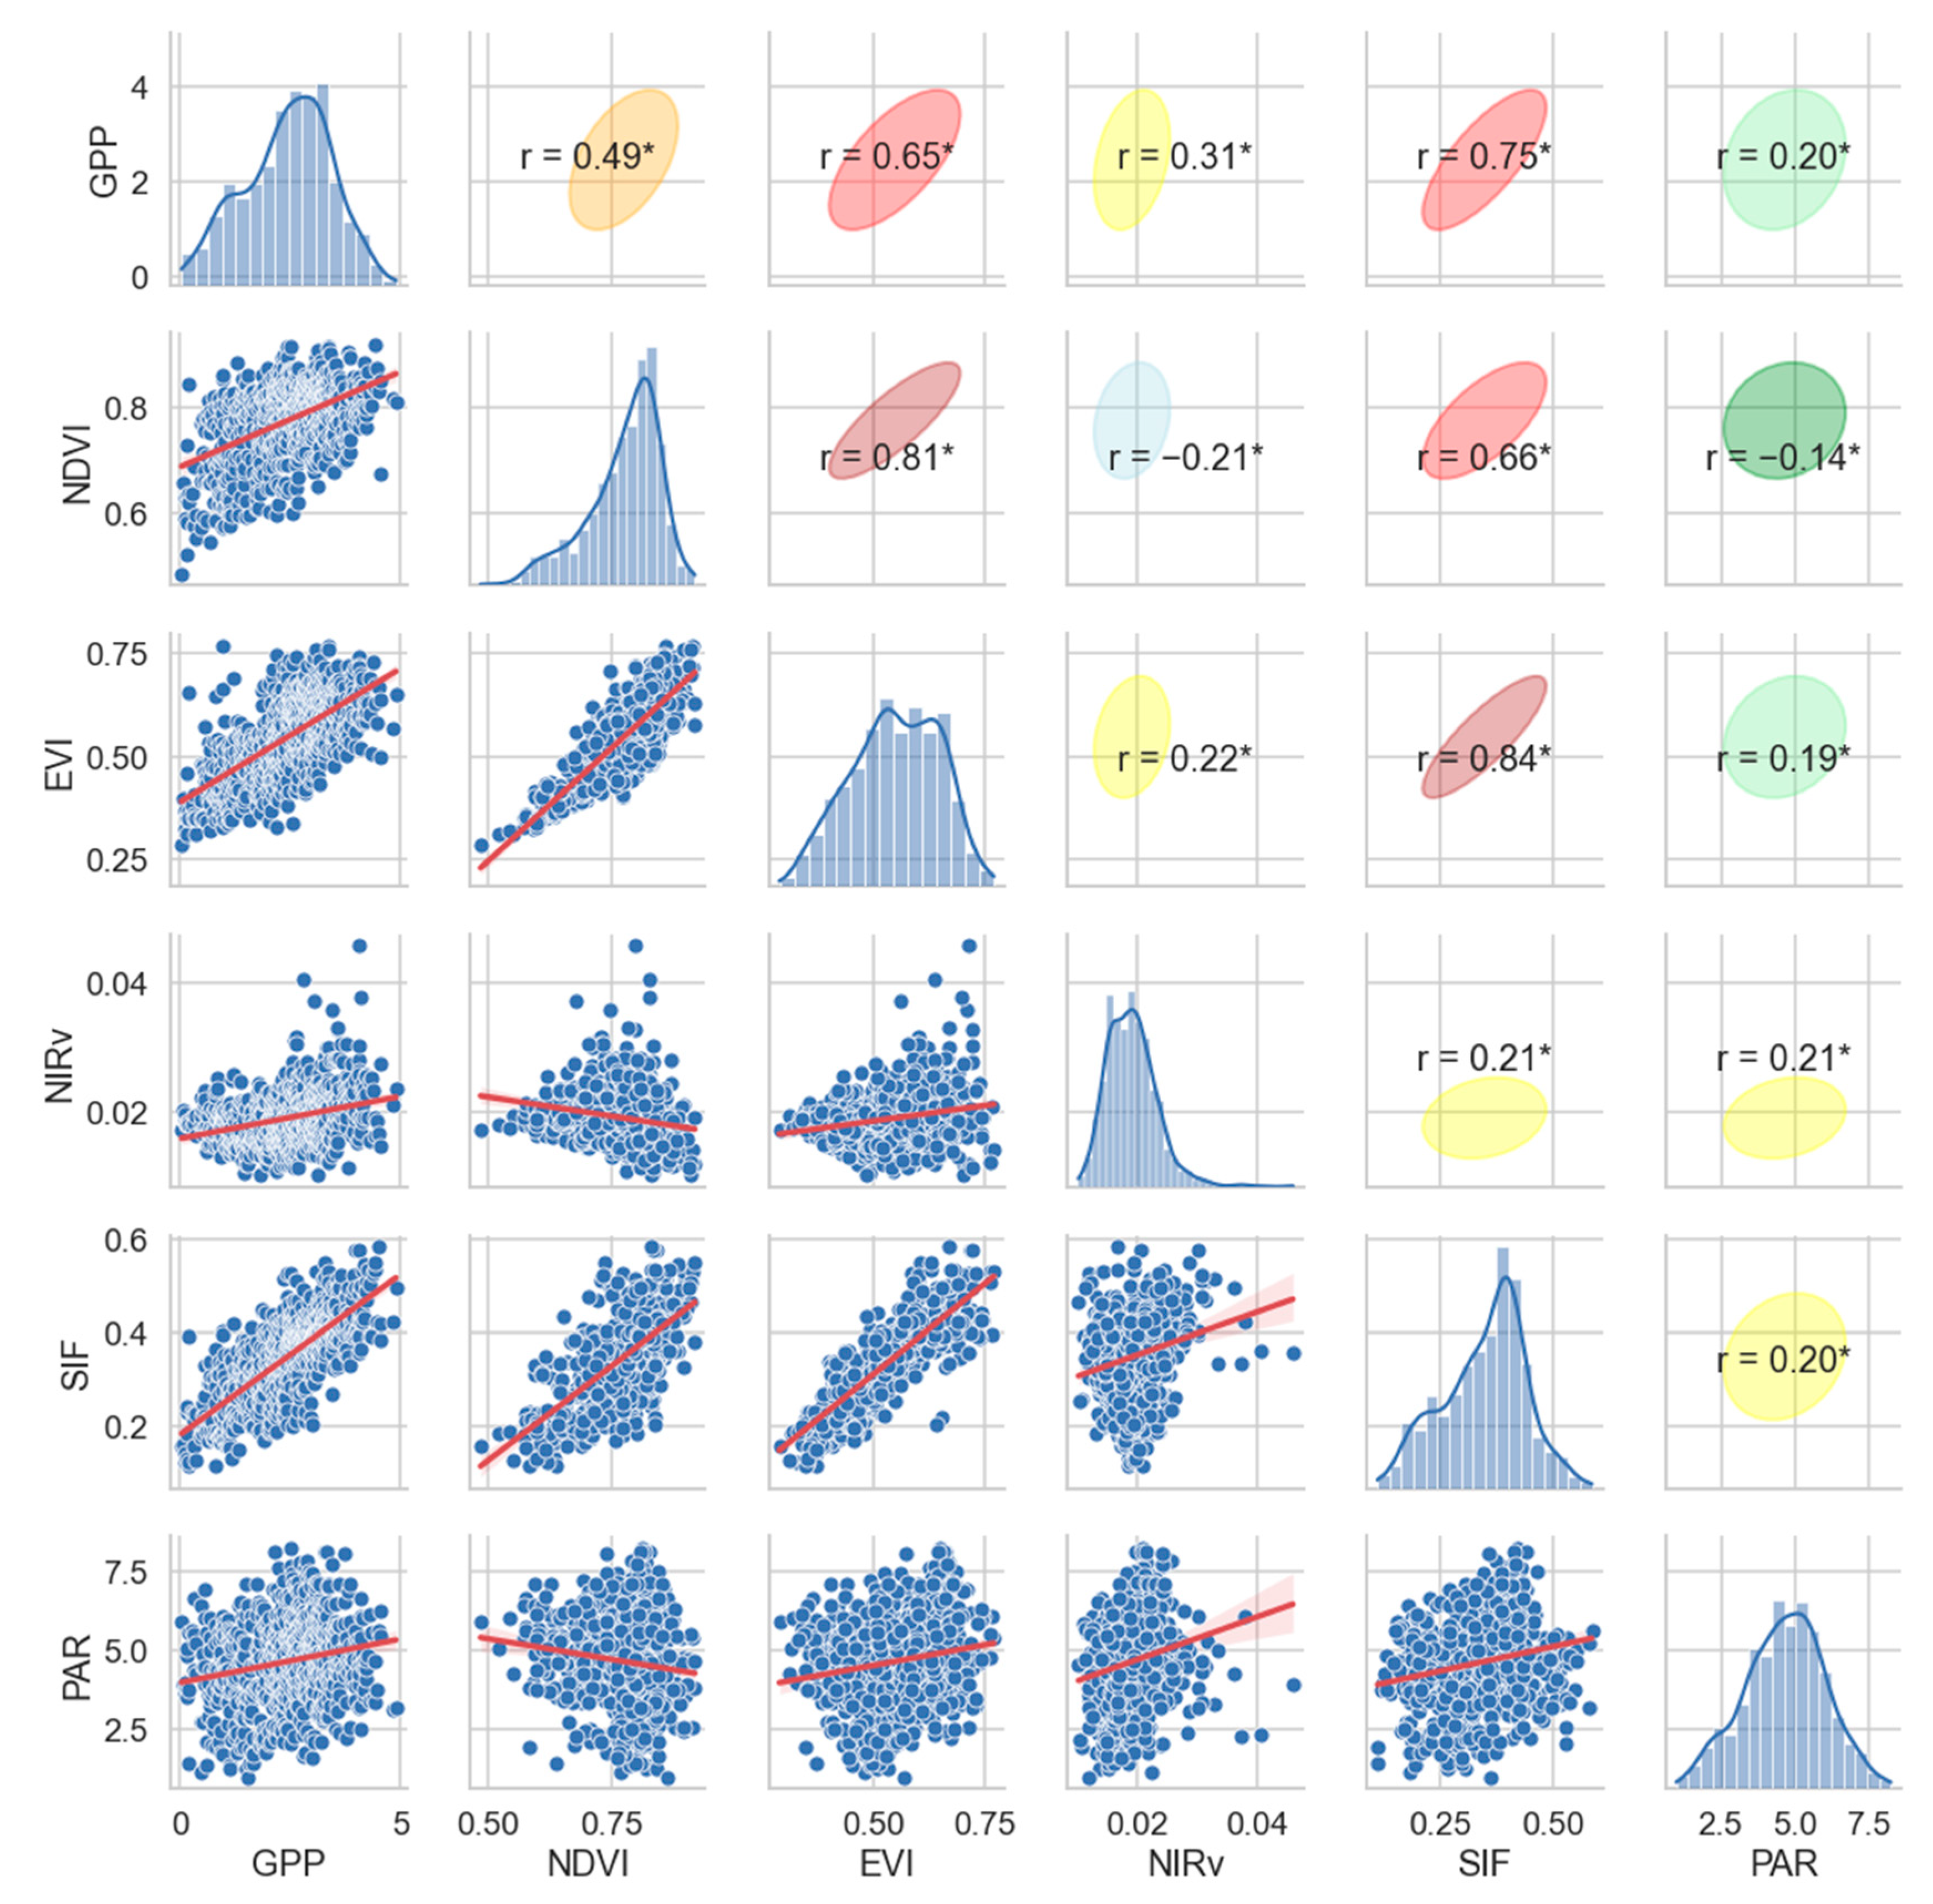
2.2. Remote Sensing and Drought Data

Among the existing remote sensing vegetation indices, SIF signals most closely reflect the actual photosynthesis of vegetation and can more effectively indicate vegetation growth status. The global dataset of solar-induced chlorophyll fluorescence dataset (GOSIF) is proven to be one of the most effective SIF datasets developed so far [37,42]. The GOSIF dataset was developed by Li and Xiao with a resolution of 0.05°and an eight-day interval [43]. This dataset is generated using a Cubist regression tree model based on discrete OCO-2 SIF measurements, MODIS EVI, MODIS land cover type, and MERRA-2 meteorological variables.
To ensure the representativeness of the data at each site, we extracted SIF values within a 25 km radius of each flux tower, with the underlying surface being rubber plantations (Figure 1). The GOSIF data extraction period ranges from 2001 to 2020.
The NDVI, EVI, and NIRv vegetation indices were calculated using MCD43A4 Version 6.1 [44] based on the following formulas. The reflectance data in the MCD43A4 dataset represent the adjusted surface normalized bidirectional reflectance distribution function (NBAR). NBAR represents the surface reflectance corrected for atmospheric scattering and absorption, reflecting the intrinsic optical properties of the surface. Adjusting the reflectance data eliminates atmospheric effects, providing more accurate surface reflectance information. When extracting MCD43A4 band values, we averaged all high-quality data pixels within a 0.05° × 0.05° window centered on each flux tower. Then, we used the maximum value composite method to obtain vegetation indices with an eight-day temporal resolution.
N D V I = ρ N I R ρ R E D ρ N I R + ρ R E D
E V I = 2.5 × ρ N I R ρ R E D ρ N I R + 6 × ρ R E D 7.5 × ρ B L U E + 1
N I R v = ρ N I R × ( N D V I 0.08 )
PAR data were extracted from MCD18C2 Version 6.1. This dataset is a level 3 gridded product of PAR, combined from MODIS Terra and Aqua, produced daily at a 0.05-degree resolution (5600 m at the equator) and generated every 3 h [45]. Then, the eight-day PAR value corresponding to GOSIF time interval is calculated by summation.
The drought index used is the standardized precipitation evapotranspiration index (SPEI) dataset version 2.9 [46]. The SPEI is calculated using precipitation and temperature data, represents wetness and dryness conditions, and can be computed over various time scales (1, 3, 12, or 24 months, etc.). Higher SPEI values indicate wetter conditions, while lower values indicate drier conditions, making it widely used in drought research. It is an advancement of the standardized precipitation index (SPI), incorporating the effects of evapotranspiration, making it more suitable for regions with significant temperature trends and particularly effective for long-term studies. Its spatial resolution is 0.5° × 0.5°, with a monthly temporal resolution.

2.3. Correlation Analysis and Geographic Detector

Pearson correlation analysis was performed to assess the relationship between flux-measured GPP and different remote sensing indices [47]. Geo-detectors are spatial statistical tools used to detect the influence of multiple independent or joint effects of various independent variables on a dependent variable across different spatial units [48]. Specifically, they assess whether the combined effect of independent variables X1 and X2 enhances or diminishes the explanatory power on the dependent variable Y, or if their impacts on Y are independent. The assessment method involves first calculating the q values of factors X1 and X2 individually and jointly on Y and then comparing these q values. The larger the q value is, the stronger the explanatory power of the factor. This study employs geo-detectors to analyze the capacity of five remote sensing indices to predict rubber forest GPP.

2.4. GPP Prediction Model

This study utilizes GPP data from four distinct sites, along with corresponding EVI, NDVI, NIRv, SIF, and PAR data. All datasets underwent necessary preprocessing, including the removal of NaN values, to ensure data quality and consistency. The data were aggregated into eight-day composites, resulting in a total of 753 samples for modeling.
To predict GPP, we employed a generalized linear model (GLM) combined with a mixed-effects model [49,50]. The GLM offers flexibility in handling different types of dependent variables (e.g., continuous, binary, count), making it suitable for our GPP prediction task. The mixed-effects model accounts for potential heterogeneity across different sites, thereby effectively capturing both fixed and random effects. The model structure is defined as follows:
Y i j = β 0 + β 1 E V I i j + β 2 N D V I i j + β 3 N I R v i j + β 4 S I F i j + β 5 P A R i j + b i + ϵ i j
where Yij represents the GPP observation for the ith site at the jth time point; β 0 is the intercept; β 1 , β 2 , β 3 , β 4 , and β 5 are the fixed effect coefficients for EVI, NDVI, NIRv, SIF, and PAR, respectively; b i is the random intercept for the ith site; and i j is the error term. We utilized the maximum likelihood estimation (MLE) method for parameter estimation in the mixed-effects model.
To assess the predictive performance and explanatory power of the model, we implemented the following steps.
Data Splitting: The dataset was randomly divided into a training set (600 samples) and a test set (153 samples), ensuring a proportional representation of each site in both sets.
Model evaluation: The performance of the model is primarily evaluated by the proportion of the relative root mean square error (rRMSE) to the sample mean [51].
r R M S E = i = 1 n y i y i ^ 2 n ÷ y ¯
Here, y i is the observed value, y ^ i is the predicted value of the metric, and y ¯ is the average of the observed value. The rRMSE measures the proportion of deviation between observed and true values. The smaller the rRMSE value is, the smaller the deviation between the predicted and true values, indicating higher model accuracy. Additionally, we compared the annual GPP predicted by the model with the flux observations to further validate the model’s accuracy.
These methodologies were aimed at constructing a robust and efficient GPP prediction model, providing a comprehensive understanding of the influence of various vegetation indices on GPP.

2.5. Drought Effect Analysis

Pearson correlation analysis was performed between SPEI drought indices at different time scales and remote sensing indices to evaluate their impact on drought effects in rubber plantations [47]. To analyze the impact of drought on rubber forest GPP production, we first generated GPP data every 8 days from 2001 to 2020 using a model. These data were aligned with the SPEI drought index to plot a time series curve and observe trends.
Second, we introduced GPP deviation to quantitatively analyze the impact of drought on GPP [52]. Rubber forest GPP was decomposed into the sum of the GPP trend component (TGPP) and GPP deviation (DGPP). GPP deviation represents the fluctuations caused by drought and other environmental factors in a given year. The GPP every 8 days from 2001 to 2020 is denoted as G y e a r ,   d a y , where the year ranges from 2001 to 2020 and the day follows the sequence 1, 9, 17, …, 361 at eight-day intervals. We extracted the same period GPP data for each year, G 2001 ,   d a y G 2002 ,   d a y , …,  G 2020 ,   d a y , and established a linear regression equation with time as the independent variable and GPP as the dependent variable.
T G P P = a y e a r + b
The least squares method was used to solve for TGPP for each corresponding period. Then, GPP minus TGPP was used to obtain DGPP.
D G P P = G P P T G P P
Finally, the changes in GPP deviation during drought events in different seasons were analyzed. To mitigate the effects of phenological changes in rubber plantations, we divided the year into three seasons, following methods from other studies [23,40,41]: the rainy season (May to November), the cool dry season (December to February), and the warm dry season (March to April).

3. Results

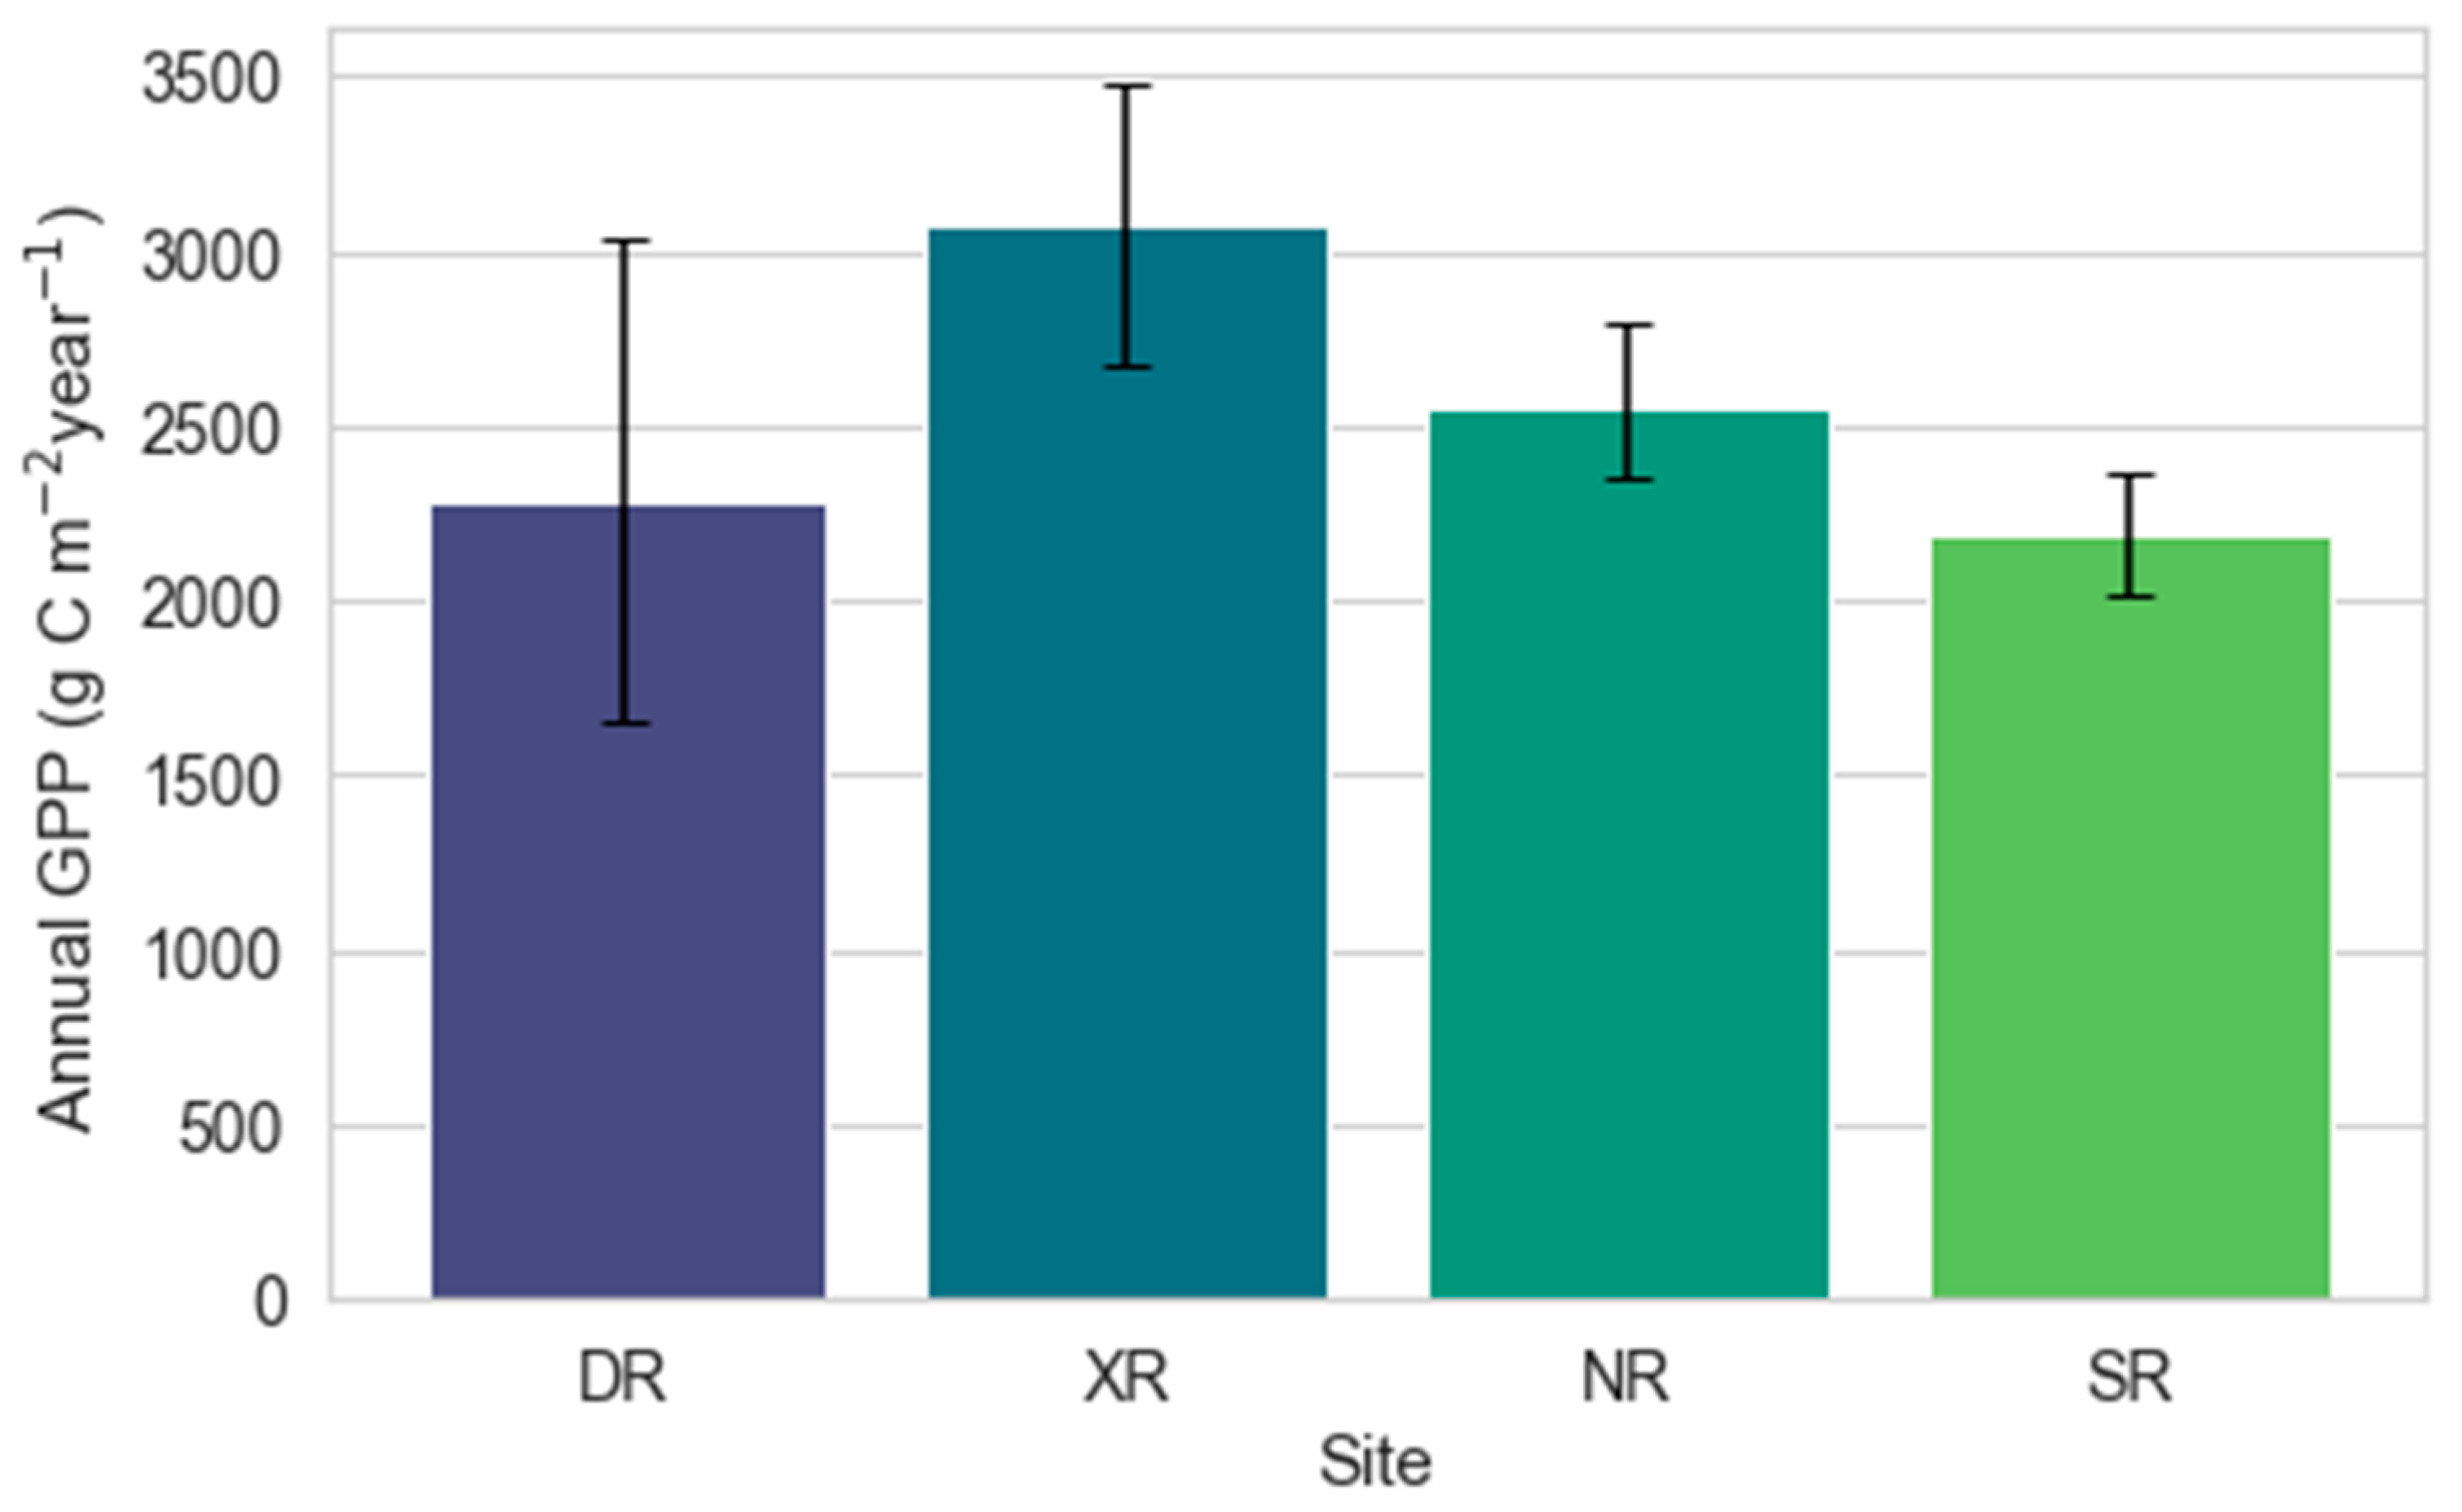
3.1. Flux Site Climate and GPP Background

Figure 2 illustrates the monthly variations in precipitation and temperature across four sites: DR, XR, NR, and SR. Regarding temperature, the two stations in the Chinese region, DR and XR, have high summer temperatures and low winter temperatures due to their proximity to the northern edge of the tropics. XR has the highest temperature in June, reaching 25.7 °C, and the lowest in January, at only 16.7 °C. Similarly, DR records the highest temperature in June at 28.6 °C and the lowest in January at 17.9 °C. The two stations in Thailand, NR and SR, show little temperature variation throughout the year, fluctuating between 25 and 32 °C. In terms of precipitation, the annual average rainfall and distribution for the XR, NR, and DR stations are similar, ranging from 1600 to 2000 mm, with specific values of 1601 mm, 1821 mm, and 1914 mm, respectively. The SR station has the highest annual average rainfall, reaching 2924 mm. The XR, NR, and DR stations receive more rainfall in the summer and autumn (June to November), generally above 200 mm, while the winter and spring seasons see less rainfall, typically below 100 mm. It is worth noting that there are slight differences during the transitional months. The SR station experiences the most rainfall from October to January, generally above 300 mm, with other months having relatively balanced rainfall, exceeding 100 mm.
Figure 3 shows the annual GPP values for four different locations. The XR station in Southwest China has the highest annual GPP, reaching 3075.5 g C m−2 year−1. The DR station on Hainan Island, China, and the two stations in Thailand (NR and SR) have similar annual GPP values. The DR station has an average annual GPP of 2280.5 g C m−2 year−1. The value for the NR station is slightly higher at 2558.4 g C m−2 year−1, and the SR station has the lowest at 2189.5 g C m−2 year−1. In terms of variation, DR and XR show greater fluctuations, while NR and SR have smaller variations.
The violin plot in Figure 4 shows the monthly variations in daily GPP for the four sites DR, XR, NR, and SR. At all sites, daily GPP values typically exhibit a pronounced seasonal trend, with lower values in winter, usually reaching their minimum in January or February, gradually increasing, peaking in summer or autumn, and then declining. The daily GPP at the XR site is relatively stable throughout the year, with monthly GPP values being relatively concentrated, and the average daily GPP in February is also above 5 g C m−2 year−1. The highest average daily GPP in July exceeds 10 g C m−2 year−1. The daily GPP variation in the same month for the other three sites is greater, with the highest average daily GPP generally below 10 g C m−2 year−1, and the lowest months below 5 g C m−2 year−1. Among all the sites, the monthly average daily GPP fluctuates the most at DR, while it is the most stable at XR.

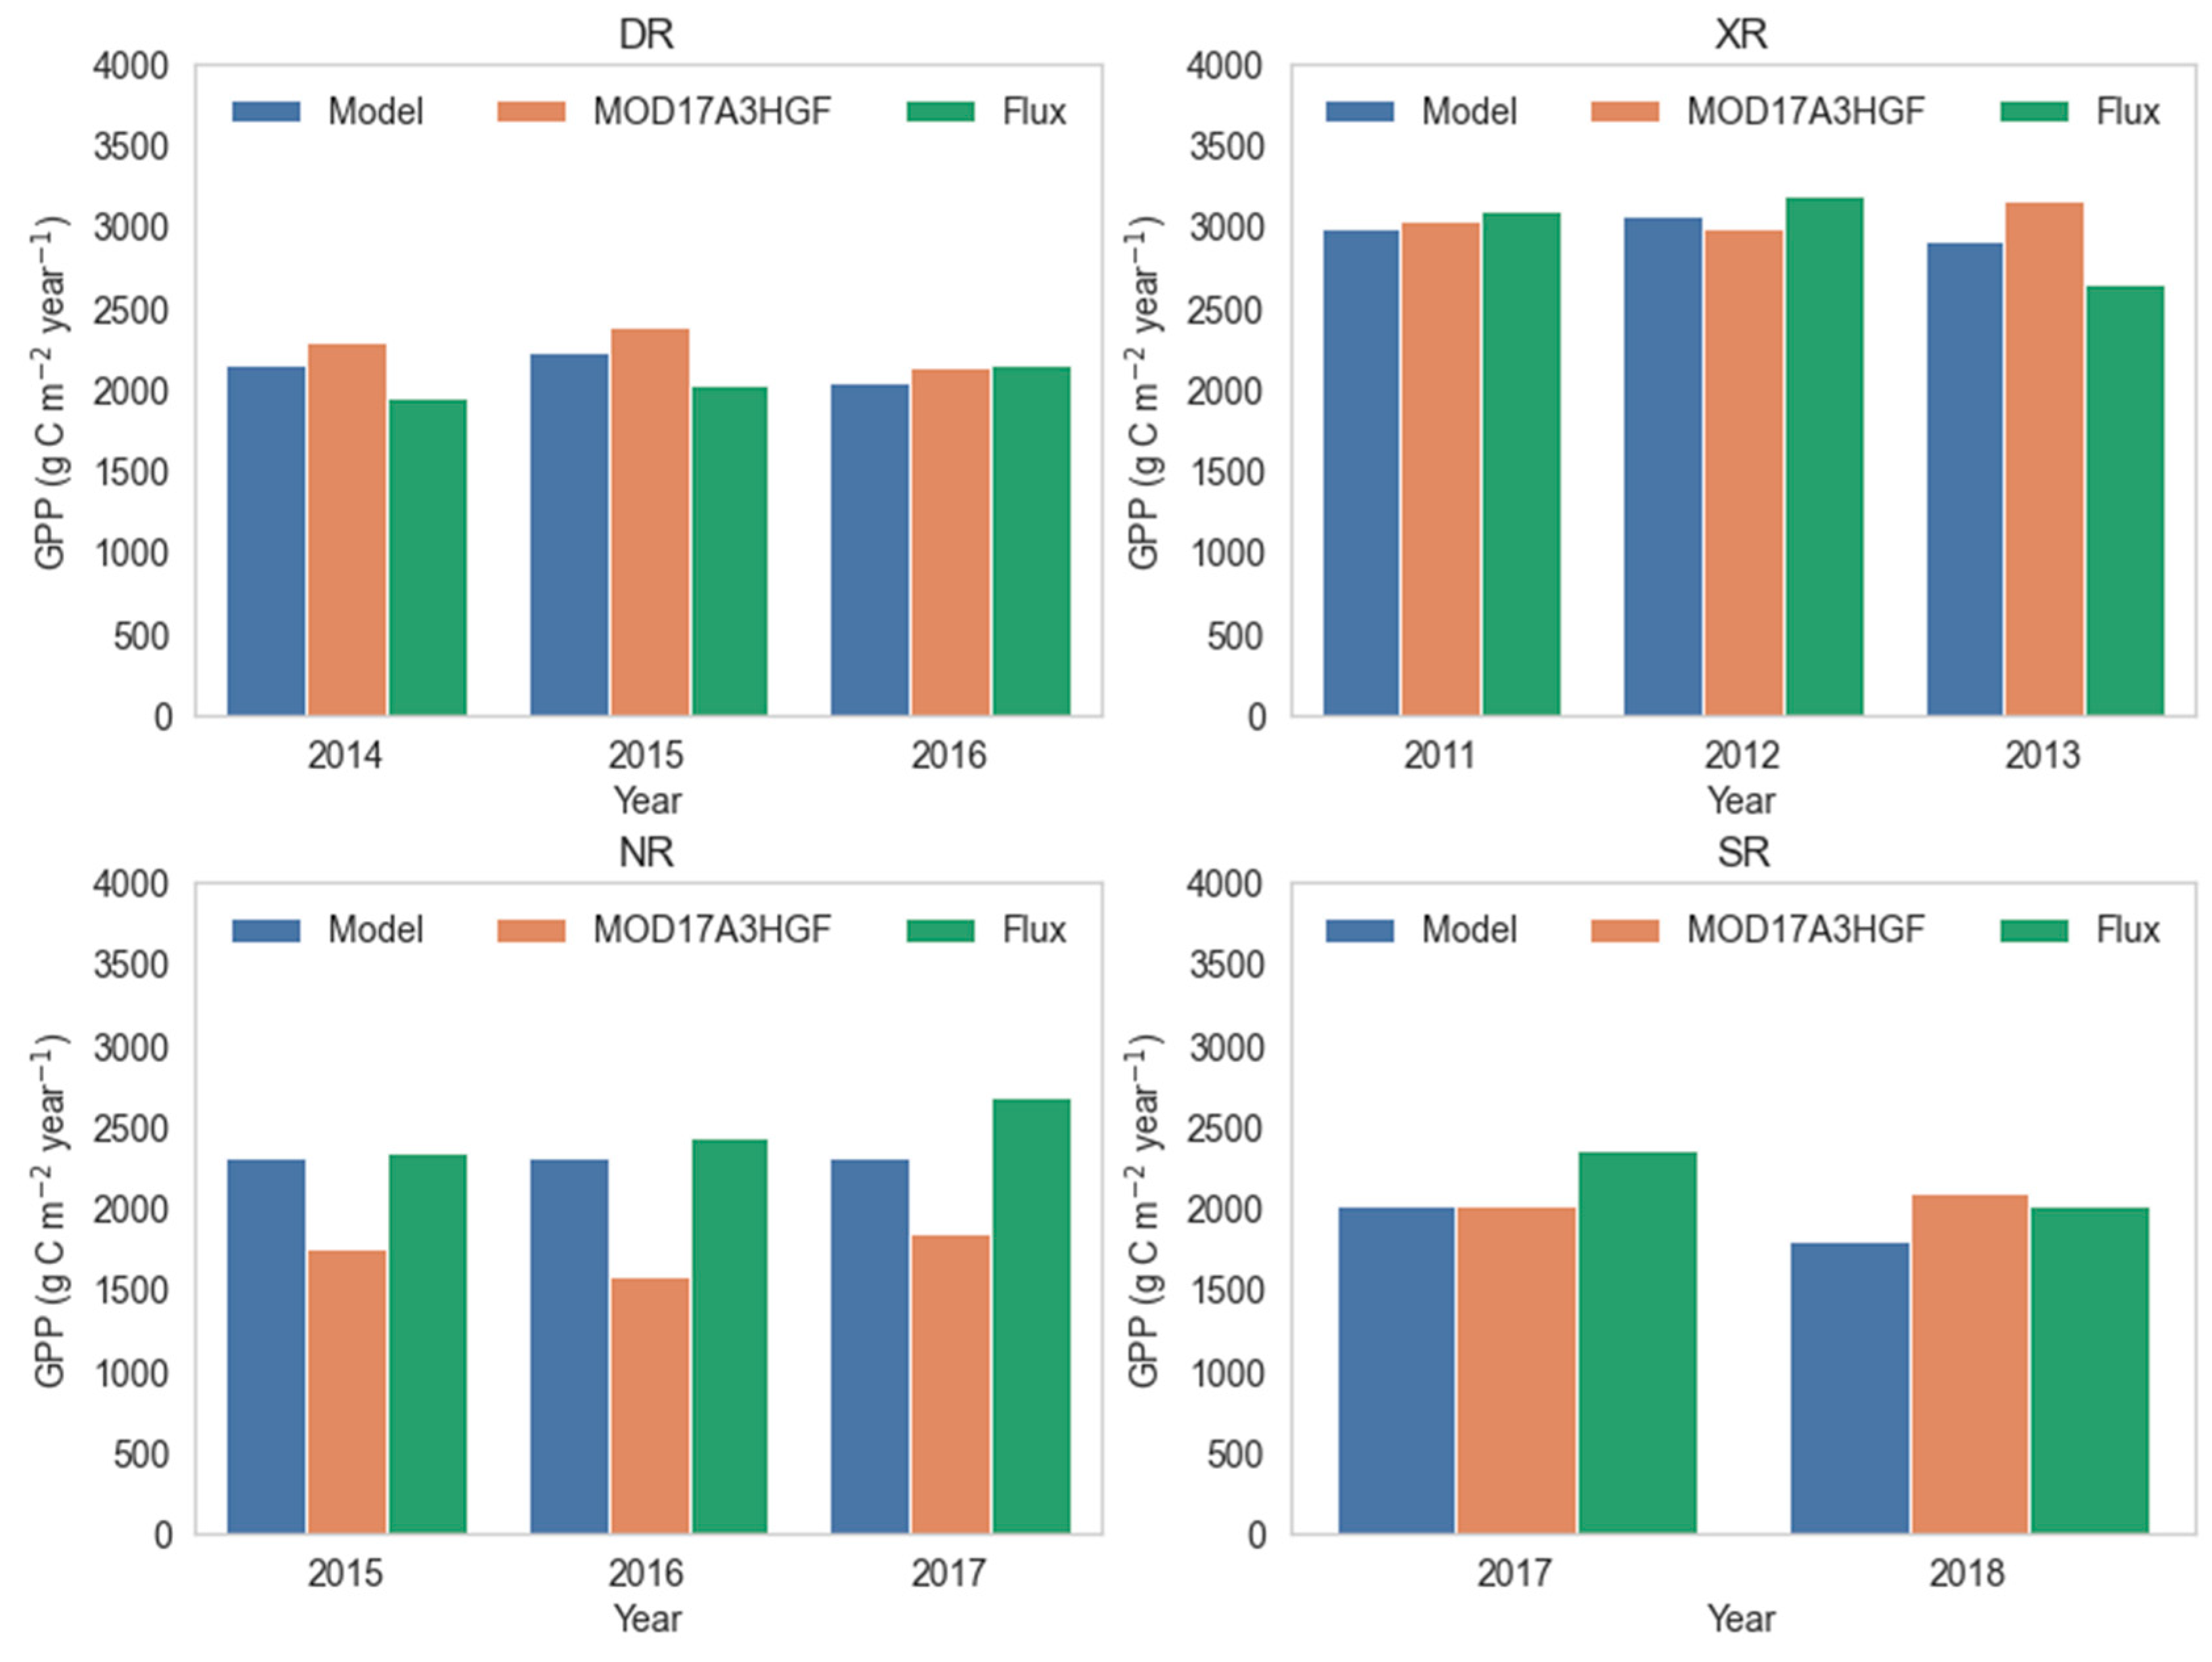
3.2. Performance of the GPP Prediction Model

Figure 5 shows the scatter matrix of the distribution and correlation between GPP and VI indices, including GPP, NDVI, EVI, NIRv, SIF, and PAR. The correlation between GPP and SIF is the highest (r = 0.75), indicating a significant positive correlation, followed by EVI (0.65) and NDVI (0.49). The weakest correlations are noted for NIRv (0.31) and PAR (0.20). Among different vegetation indices, the correlation between SIF and EVI is the highest at 0.84, indicating EVI’s strong ability to reflect vegetation photosynthetic capacity. NDVI and EVI are highly correlated (r = 0.81), indicating that they capture similar vegetation characteristics; similarly, NDVI and SIF are also highly correlated (r = 0.66), suggesting that NDVI is less effective than EVI in reflecting photosynthetic capacity. The correlations of NIRv and PAR with other indices are relatively weak, around r = 0.2. The correlations of SIF, EVI, NDVI, NIRv, and PAR with GPP all passed the significance test. The above indicates that GPP has the strongest correlations with EVI and SIF, highlighting their potential as GPP indicators. The moderate correlations of NIRv and PAR with GPP suggest that they are useful supplements.
The results of the geographical detector interaction analysis showed whether NDVI, EVI, NIRv, SIF, and PAR individually or in combination enhance or weaken the prediction of GPP (Table 2). Individually, SIF is the most effective predictor of GPP, with a q value of 0.56. EVI also has a strong predictive ability for GPP, with a q value of 0.45. NDVI and NIRv have weaker predictive effects on GPP, with q values of 0.24 and 0.12, respectively. PAR has the poorest predictive ability for GPP, with a q value of only 0.05. In combination, the effect of SIF improves when combined with other factors, and the q values are relatively stable, ranging from 0.60 to 0.62. EVI also shows good predictive ability for GPP when combined with other factors, with q values of EVI combined with PAR, NIRv, and NDVI ranging from 0.50 to 0.52. PAR is a very intriguing factor. Its q value for predicting GPP is only 0.05 individually. However, when combined with any other factor, the q value exceeds the sum of the individual q values. This indicates that PAR has a nonlinear enhancement ability for predicting GPP. Similarly, the combined effect of NIRv and NDVI also shows a significant nonlinear enhancement. Overall, the combination of SIF with other factors consistently shows high predictive ability for GPP, and PAR and NIRv are very beneficial supplements for predicting GPP. Understanding these interactions helps to improve models for predicting GPP under different environmental conditions.
Figure 6 depict the performance of the GPP prediction model using training and validation datasets. For the training dataset, the model shows a high degree of accuracy with an rRMSE of 0.22. The scatter plot for the training dataset indicates a strong correlation between observed and predicted GPP values. Similarly, the validation dataset demonstrates the model’s robustness with an rRMSE of 0.23. The validation scatter plot confirms the consistency of the model’s predictions against the observed GPP values. Both datasets indicate that the model can reliably predict GPP under different conditions. The close alignment of rRMSE values between training and validation datasets suggests minimal overfitting. Overall, the GPP prediction model demonstrates high accuracy and robustness, making it a valuable tool for assessing rubber GPP under drought conditions.
The bar chart in Figure 7 compares the GPP results from prediction models, flux observations, and MOD17A3HGF inversions at four sites: DR, XR, NR, and SR. At the DR site, in 2014, the model-estimated GPP was 2148.65 g C m−2 year−1, very close to the flux observation of 1952.67 g C m−2 year−1, while the MOD17A3HGF value was 2286 g C m−2 year−1. In 2015, the model-estimated GPP was 2231.03 g C m−2 year−1, the flux observation was 2036.39 g C m−2 year−1, and the MOD17A3HGF value was slightly higher at 2382 g C m−2 year−1. In 2016, the model prediction, MOD17A3HGF estimation, and flux observation of GPP were very close, with errors less than 5%. At the XR site, in 2011, the model prediction, MOD17A3HGF estimation, and flux observation of GPP were also very close, with MOD17A3HGF having a smaller error than the model prediction. In 2012 and 2013, the model-estimated GPP was closer to the flux observation results, particularly in 2013, where the model estimation error was only half that of MOD17A3HGF. At the NR site, from 2015 to 2017, the GPP estimates from MOD17A3HGF were significantly lower than both the model predictions and flux observations. At the SR site, in 2017, the model-estimated GPP was consistent with the MOD17A3HGF estimates, about 15% lower than the flux observation. In 2018, the model-estimated GPP was 1801.57 g C m−2 year−1, the flux observation was 2020.32 g C m−2 year−1, and the MOD17A3HGF value was 2096 g C m−2 year−1, closer to the flux observation. However, observing the trend from 2017 to 2018, the flux observed GPP decreased, whereas the MOD17A3HGF estimates increased. The model prediction also showed a decrease, more accurately reflecting the trend. Overall, compared to flux observations, the developed model’s GPP estimates demonstrated high accuracy and consistency across all sites and were more reliable than the MOD17A3HGF estimations.

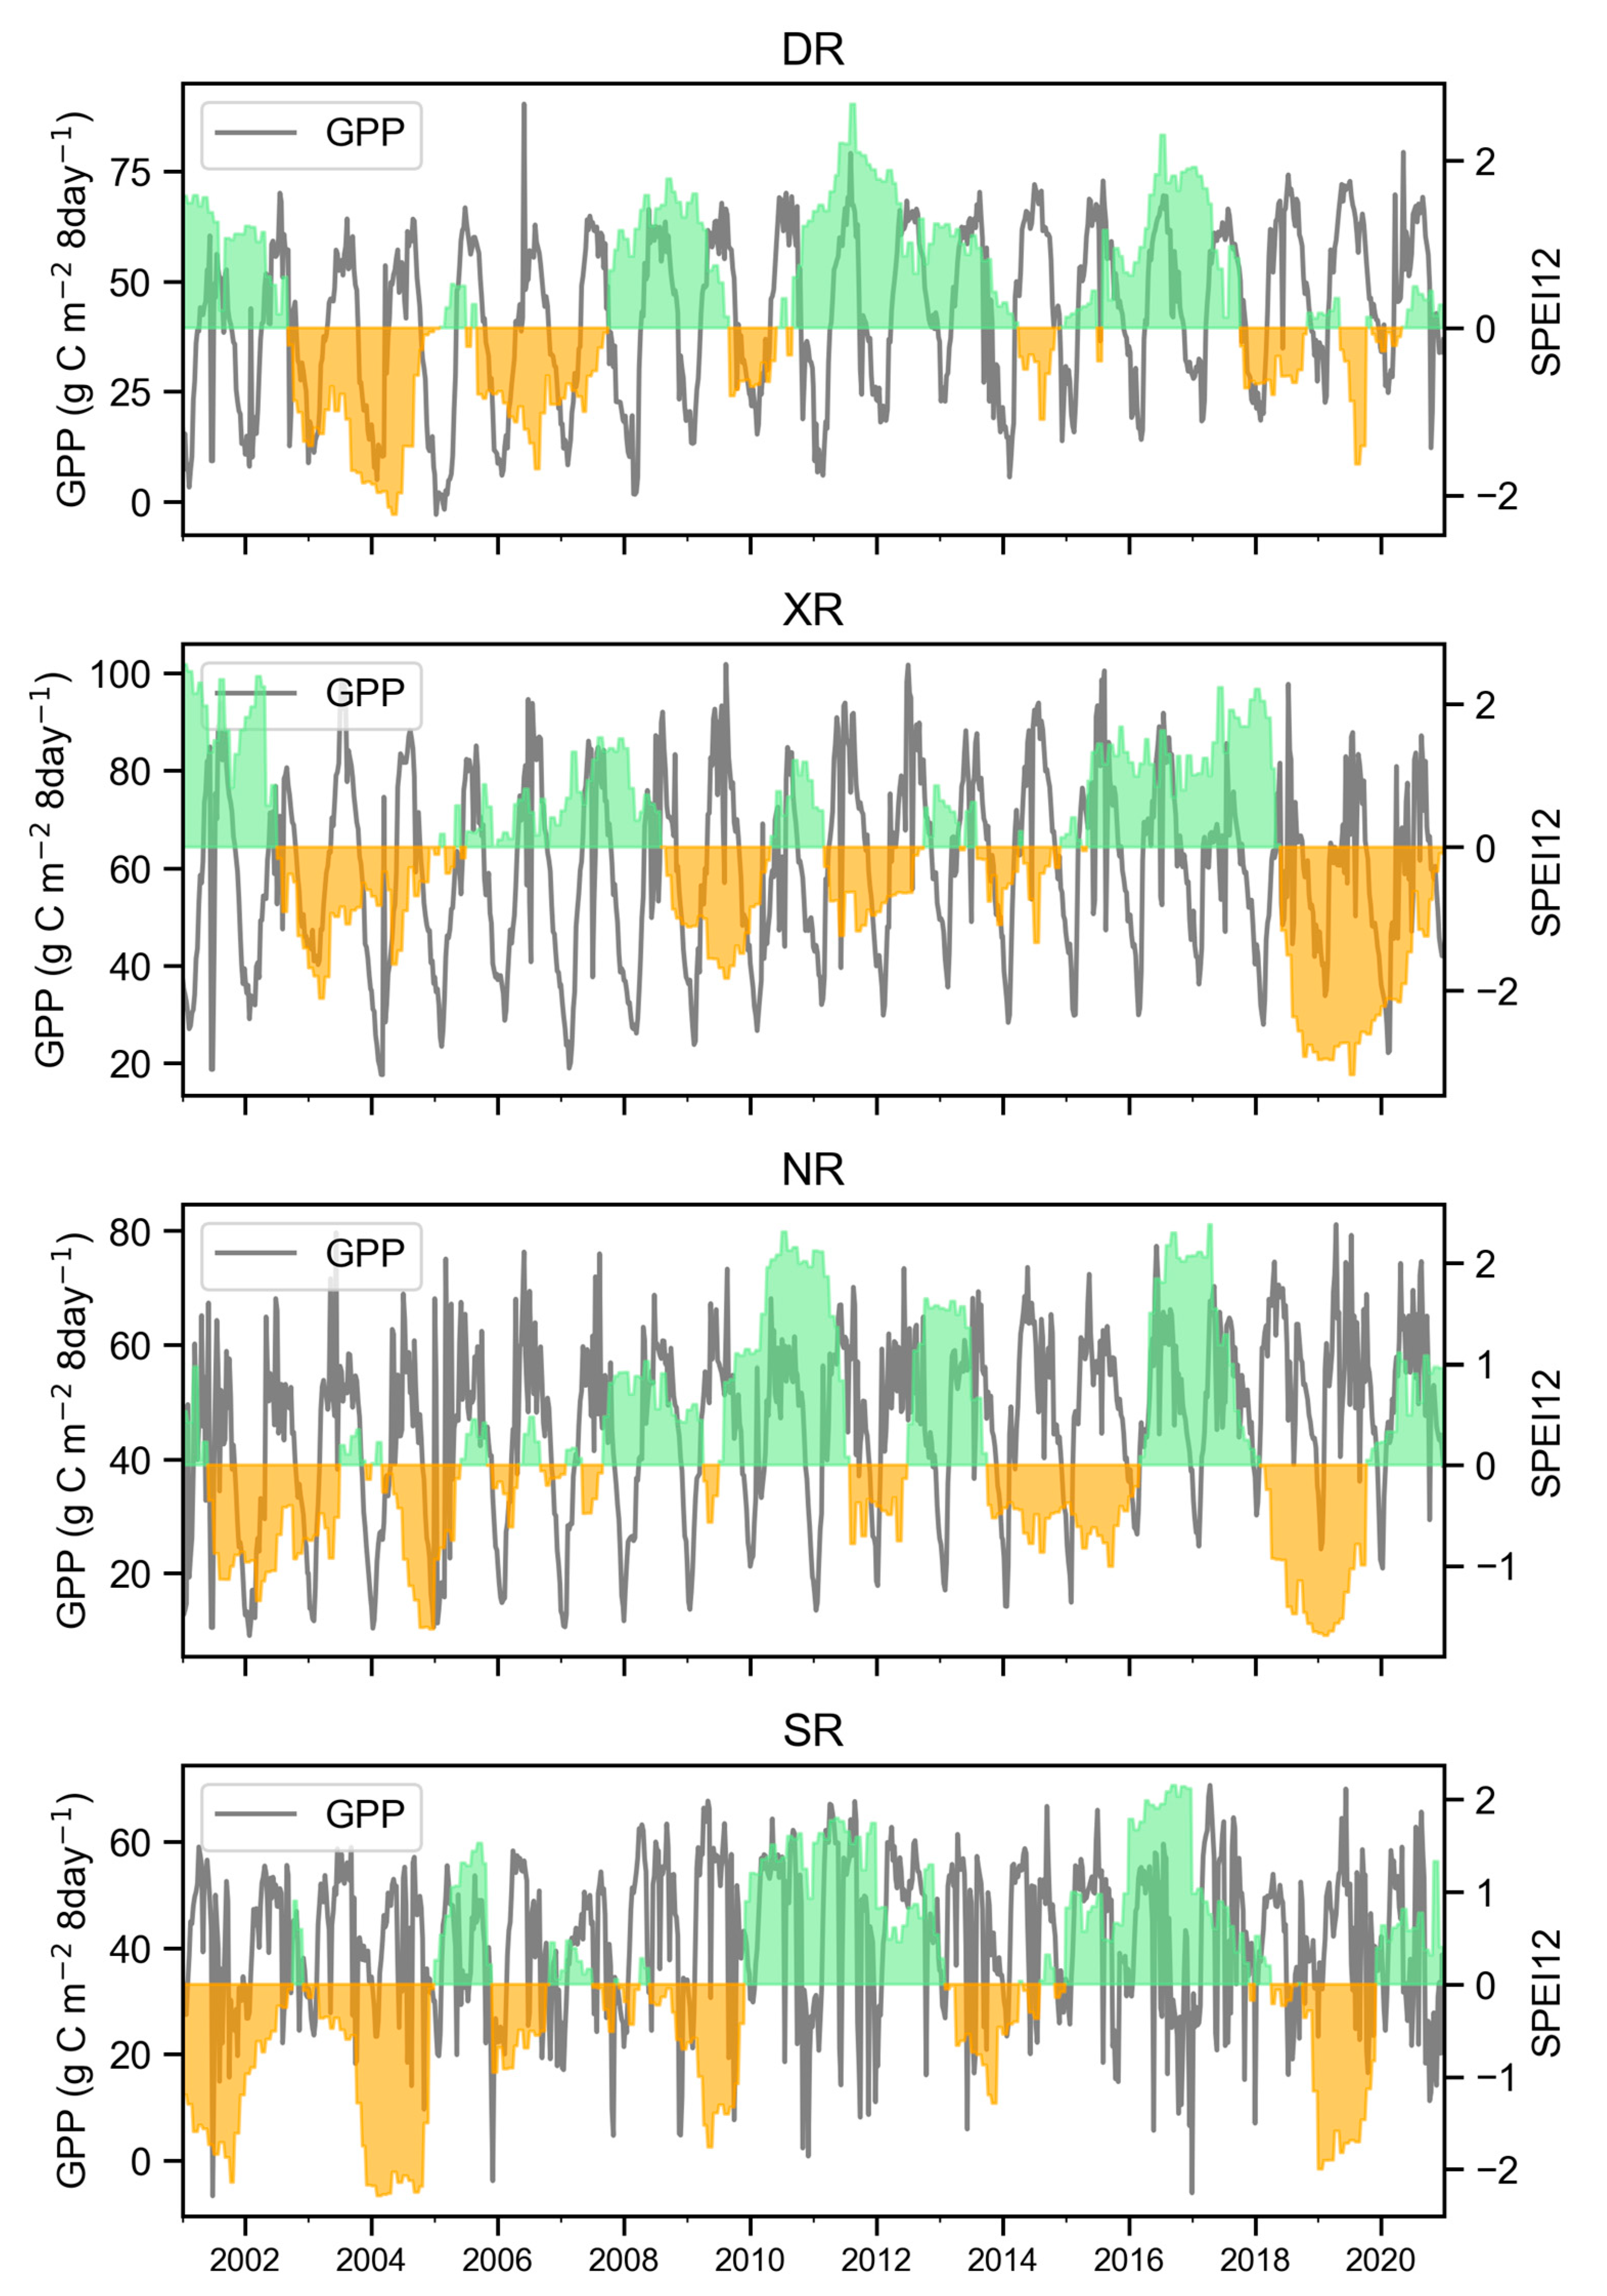
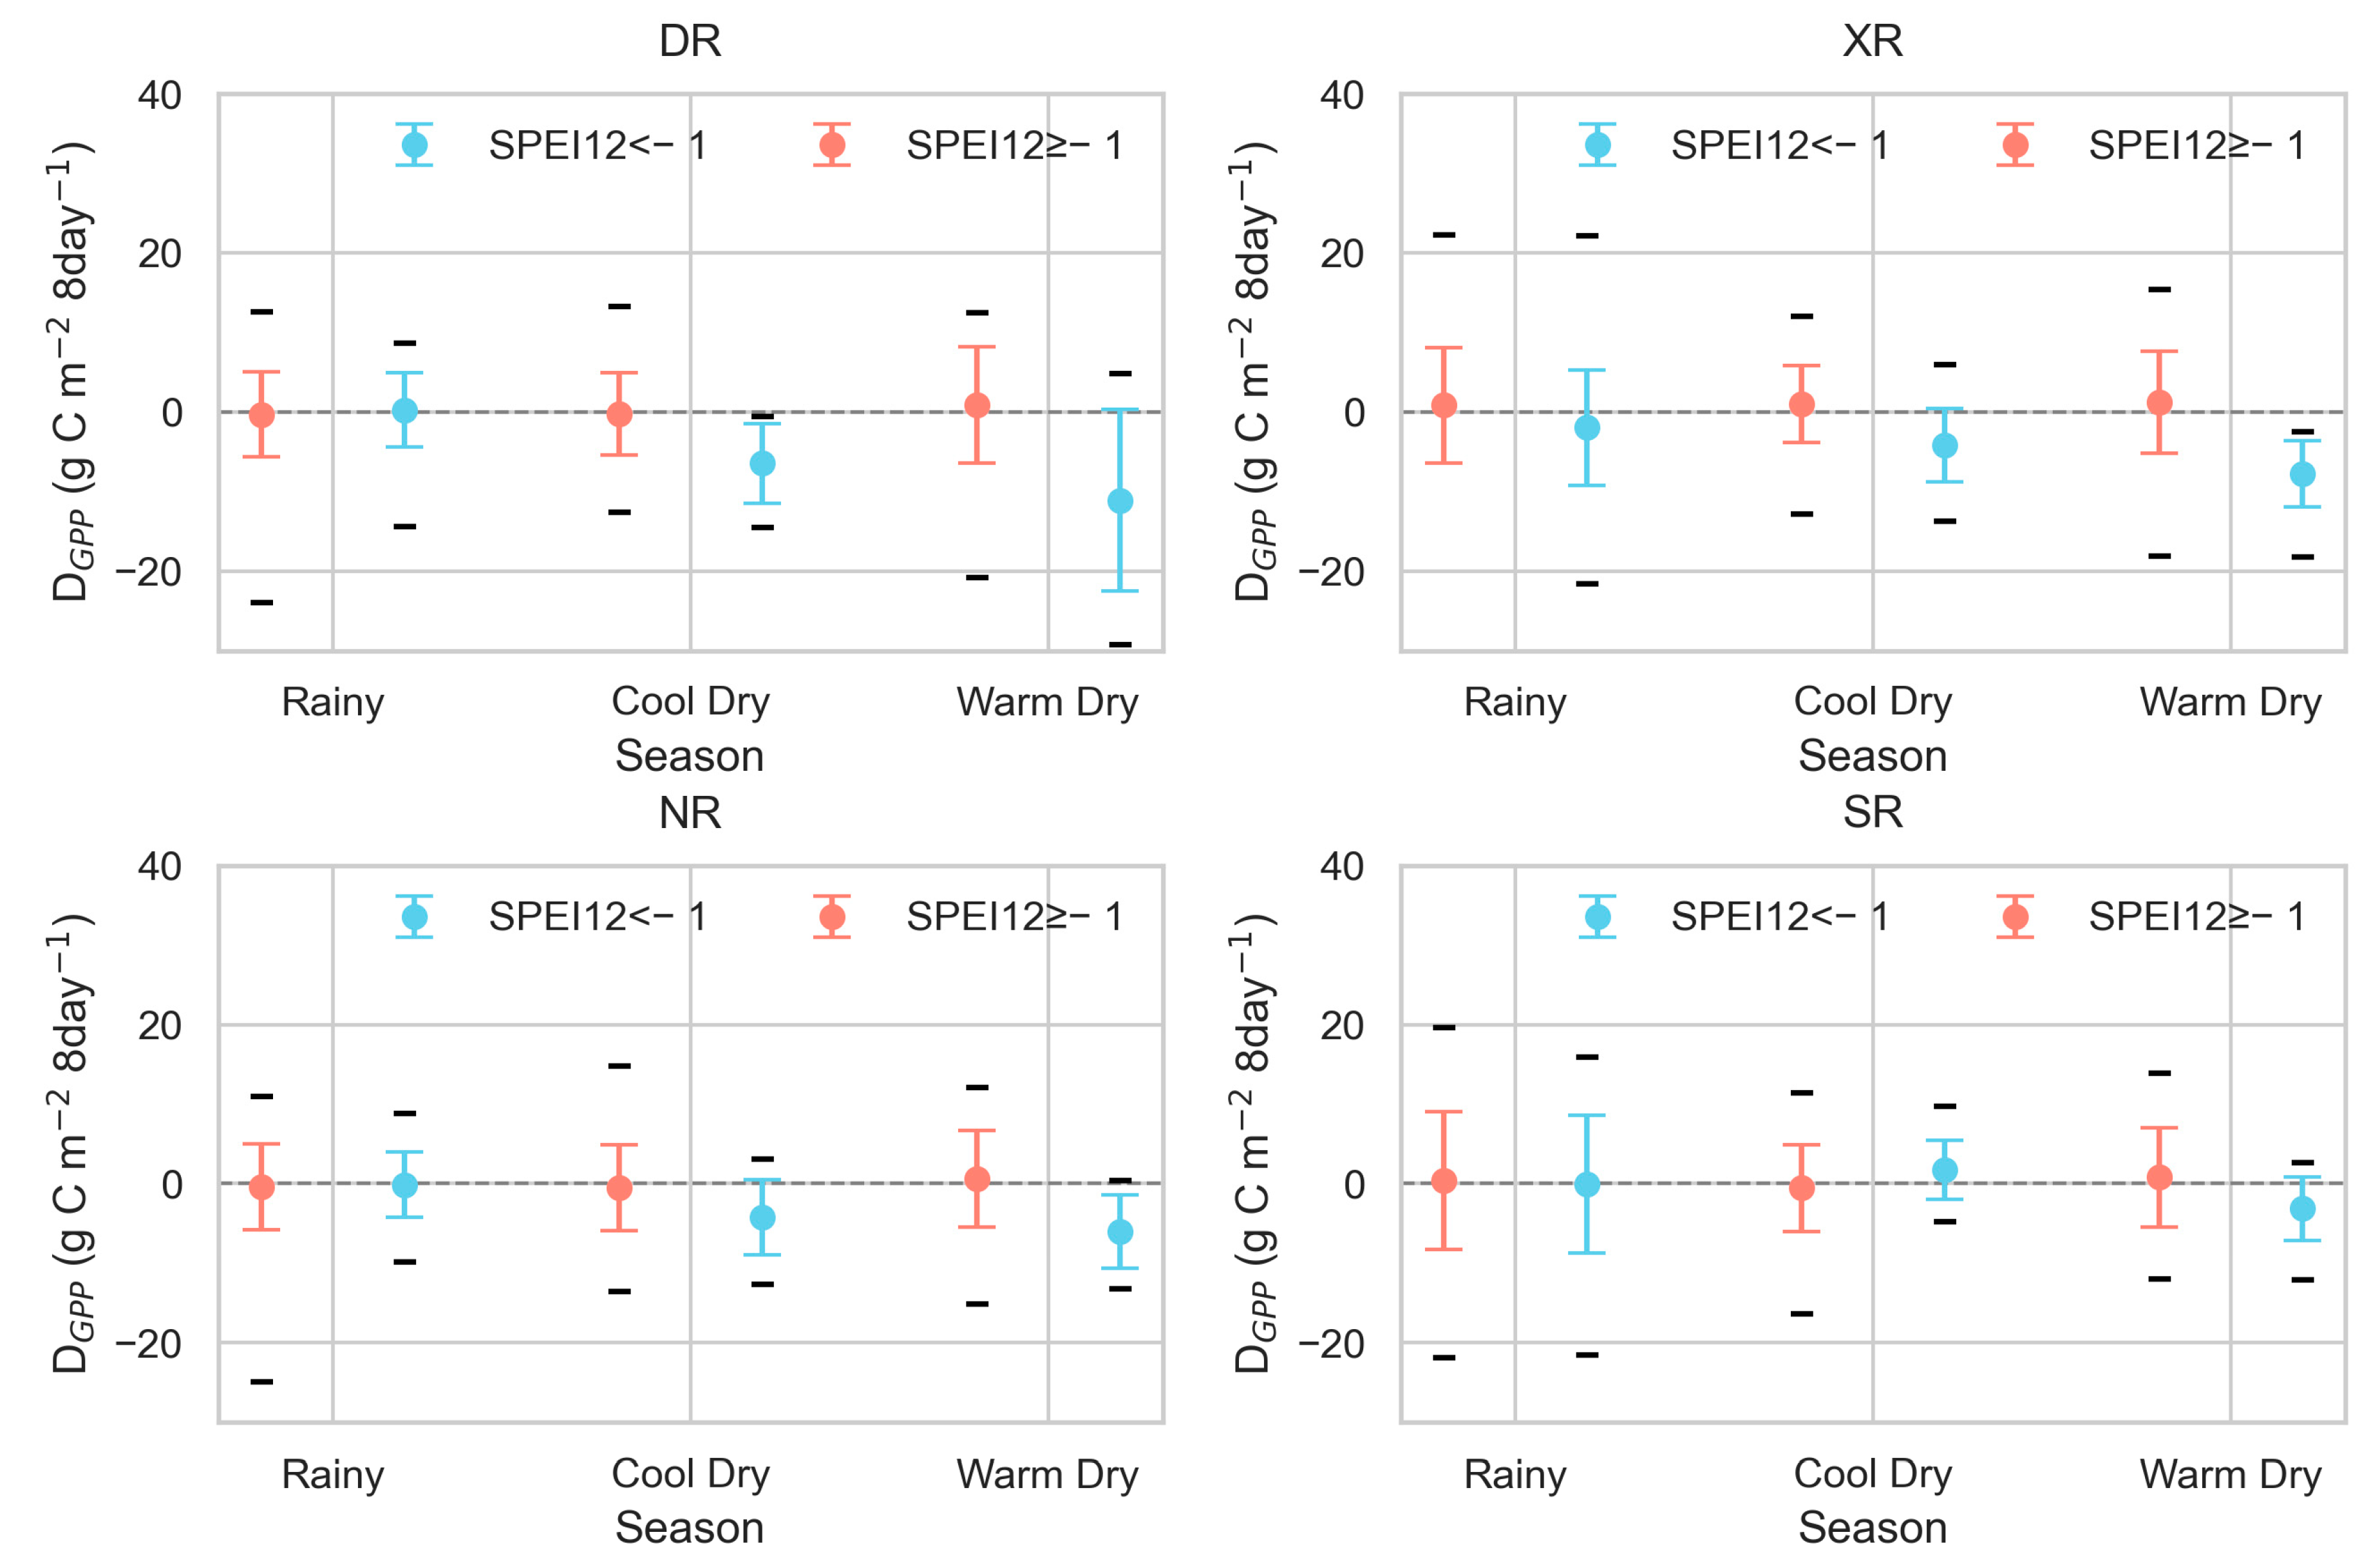
3.3. Drought Efforts on Rubber GPP

Figure 8 shows the correlation heatmap results between the standardized precipitation evapotranspiration index (SPEI) values at different time scales and vegetation indices (such as SIF, EVI, NDVI, NIRv, and PAR) for four sites (DR, XR, SR, and NR). For the DR site, SPEI12 and SPEI24 show relatively high positive correlations with SIF, EVI, NDVI, and NIRv, with values around 0.5, indicating that prolonged drought significantly impacts vegetation indices. These correlations are statistically significant at the 0.05 level (p < 0.05). For the XR, NR, and SR sites, SPEI03 shows the highest correlations with vegetation indices, with values around 0.7, and these correlations are also statistically significant at the 0.05 level (p < 0.05). At all four sites, PAR is negatively correlated with vegetation indices, with the strongest negative correlation observed with PSEI01. These negative correlations are statistically significant at the 0.05 level (p < 0.05), confirming the reliability of these results. This indicates that the lower the drought index for the month is, the higher the photosynthetically active radiation (PAR) will be.
Figure 9 shows the time series of GPP (in gray) and SPEI12 (green representing wet periods, orange representing drought periods). At the DR site, GPP shows an upward trend, with the annual GPP lows increasing over time. Several significant drought periods are highlighted in orange at this site, particularly the prolonged droughts of 2003–2005 and 2007–2009, along with a few shorter drought periods. During the 2003–2005 drought, the eight-day GPP minimum was the lowest from 2001 to 2020, indicating a negative impact of drought on primary productivity. At the XR site, the eight-day GPP minimum values were generally higher than those at DR, with five significant drought events, the most severe occurring around 2019–2020. During this period, the GPP lows were also the lowest in recent years, reflecting the negative impact of drought events on GPP. At the NR site, several major drought periods occurred, mainly around 2004, 2007, and 2015.
There were also a few minor and shorter drought events. During these major drought periods, GPP fluctuations were more pronounced during high-value periods. At the SR site, the timing of drought occurrences was similar to those at NR, with several prolonged severe drought periods coinciding. However, the GPP cyclic trend at this site was not evident, possibly due to satellite observations being affected by cloud cover, warranting further analysis. Nonetheless, significant GPP reductions were observed during drought periods at other sites, highlighting the sensitivity of rubber plantations to drought conditions.
Figure 10 and Figure 11 show the deviations in GPP under drought conditions at four different sites across various seasons and time scales (SPEI03, SPEI12). Table 3 shows the proportion of deviations due to drought relative to the average value. Considering the sample size and representativeness, periods with an SPEI less than −1.0 are defined as drought periods. Based on the phenological characteristics of rubber forests and seasonal climatic features, the year at each site is divided into three periods: rainy season (May−November), cool dry season (December−February), and warm dry season (March−April).
Using the three-month SPEI to define drought events (Figure 10), it is observed that during the rainy season, the GPP deviations at the DR, XR, and NR sites are not significantly different. At the SR site, the GPP deviation under drought conditions is higher compared to non-drought conditions. During the cool dry season, the GPP deviations under drought conditions at the DR, XR, and NR sites are negative. The values are −4.80, −4.03, and −2.92 g C m−2 8 day−1, respectively, which are about 22%, 10%, and 10% below the average value during the same period, respectively. At the SR site, the GPP deviation under drought conditions is 0.89 g C m−2 8 day−1 higher than under non-drought conditions, about 2% over the average. During the warm dry season, the four sites exhibit more complex patterns. At the DR site, the GPP deviation during drought is slightly lower than non-drought by 0.94 g C m−2 8 day−1, about 4% below the average. At the XR site, the GPP deviation during drought in the warm dry season is higher than under non-drought conditions. At the NR and SR sites, the GPP deviations during drought in the warm dry season are significantly lower than those during non-drought periods, being approximately 14% and 5% below the average value for the same period.
Using the twelve-month SPEI to define drought events (Figure 11), it is observed that during the rainy season, the GPP deviations under drought and non-drought conditions at all four sites are not significantly different. During the cool dry season, the GPP deviations during drought at the DR, XR, and NR sites are significantly lower than during non-drought periods. Specifically, these values are −6.46, −4.18, and −4.21 g C m−2 8 day−1, respectively, representing decreases of approximately 29%, 11%, and 14%, respectively. At the SR site, the GPP deviation under drought conditions is 2.32 g C m−2 8 day−1 (5%) higher than under non-drought conditions. During the warm dry season, the four sites show relatively consistent patterns, with GPP deviations during drought being lower than during non-drought periods. At the DR site, the GPP deviation is the largest, reaching 9.38 g C m−2 8 day−1, representing a decrease of 29%. At the XR site, it is also significantly lower by 8.41 g C m−2 8 day−1, with an approximate decrease of 6%. At the NR and SR sites, the deviations are smaller, at 4.68 and 4.49 g C m−2 8 day−1, respectively, corresponding to decreases of 14% and 12%, respectively.

4. Discussion

4.1. Uncertainty of the GPP Prediction Model

This study constructs a GPP prediction model based on remote sensing data, including NDVI, EVI, NIRv, SIF, and PAR, with a relative root mean square error (rRMSE) of 0.22, demonstrating a high annual GPP prediction accuracy. The remote sensing indices reflect instantaneous observations, whereas GPP represents the cumulative value obtained from continuous observations over eight days. The relationship between instantaneous observations at different time points and the eight-day GPP is still unclear, which constitutes one source of model uncertainty. Zhang et al. [53] simulated instantaneous SIF and daily average GPP at five grassland sites across a wide latitude range, finding a more significant linear relationship between SIF observed by satellites at noon and daily average GPP. How to utilize instantaneous SIF data to assess the total carbon sequestration on a daily or multi-day basis has become a key problem that the scientific community needs to address. Factors such as atmospheric conditions and canopy structure directly influence the energy absorption and allocation in leaves, thereby increasing the complexity of the SIF–GPP relationship. There is substantial evidence for the positive correlation between vegetation indices like NDVI and GPP [54]. These indices can supplement the explanatory capacity of SIF regarding GPP (see Table 2), although their specific contribution rates require further analysis. Surface environmental factors such as temperature [55] and relative humidity [56] also significantly affect the GPP of rubber forests; however, due to the length and quality of observational data, this study has not included them in the modeling considerations. This study employs a multilayer perceptron (MLP) to construct a GPP prediction model based on five remote sensing indices, aligning with the data-driven machine learning model established by Zhang et al. [57]. The model demonstrates high accuracy in ecosystem simulation. However, the data-driven machine learning model developed in this study involves a linear simplification of the relationship between parameters and GPP during data processing, necessitating further research to clarify the underlying mechanisms.

4.2. Determination of Drought Events

This study utilizes a long-term drought index and remote sensing datasets to analyze the impact of drought events occurring outside the flux observation periods on the GPP of rubber forests. The study employs SPEI indices at different time scales to evaluate drought events, with the SPEI index reflecting the deviation of rainfall from potential evapotranspiration [58]. Consequently, there may be inconsistencies in drought index thresholds and suitable monitoring time scales among the four sites during the occurrence of drought stress [59]. Generally, a lower drought index correlates with a smaller GPP deviation and a more pronounced suppression of GPP. The SR site receives nearly 3000 mm of annual precipitation, while the other sites receive between 1600 and 2000 mm. From a precipitation perspective, the abundant rainfall at the SR site diminishes the likelihood of experiencing drought threats. During the rainy season and the cool dry season (which differs from the other three sites as this site also receives ample precipitation), GPP increased by 2%–5% during drought periods when SPEI was less than −1. This may be because, when SPEI is less than −1, the precipitation in this region still meets the evapotranspiration requirements of rubber forests, and the ample sunlight provides additional energy for photosynthesis. The SR site only exhibited a slight decrease of 5%–6% under drought conditions during the warm dry season, which is also less than the reductions observed at the other sites.
During the abundant rainy seasons at the DR, XR, and SR sites, no significant losses (more than 3%) due to drought stress were observed in GPP deviations, regardless of whether SPEI03 or SPEI12 was below −1.0. During the cool dry season with reduced precipitation at the DR, XR, and SR sites, a significant reduction in GPP was observed when using the same drought threshold, with the magnitude of decrease ranging between 10% and 29%. This season is a critical period for rubber forests, marked by new leaf emergence and rapid growth [60], during which the trees are particularly susceptible to drought stress. All four sites exhibited a significant decline in GPP due to drought stress. It is noteworthy that, at the DR and XR sites, the GPP deviations during the drought indicated by SPEI12 are substantially greater than those indicated by SPEI03 (Table 3), suggesting that the rubber forests in these two regions are more sensitive to rainfall from the previous rainy season in the cool dry season. From December to April, the moisture demands of rubber trees consistently exceed effective precipitation, with the cumulative difference between supply and demand reaching its maximum in April [25]. During this period, the transpired moisture in rubber forests is primarily derived from water stored in the soil from the previous rainy season. Thus, factors such as soil moisture and the differences between precipitation and evapotranspiration must be considered in determining drought events.

4.3. Other Influencing Factors

Environmental factors such as temperature, photosynthetically active radiation (PAR), and precipitation, as well as biotic and environmental stresses like drought, low temperatures, typhoons, and pest infestations, impact leaf growth, senescence, and photosynthetic rates in rubber forests. For example, in rubber plantation areas in China, lower winter temperatures often delay new leaf growth and advance the leaf drop period in rubber forests, with these changes significantly exceeding the impacts of climatic averages [61,62]. Vegetation indices (VI), solar-induced fluorescence (SIF), and their derived GPP values can all reflect phenological fluctuations in rubber forests [63]. Variations in the timing of phenological events, such as advancement or delay, can significantly affect GPP levels in rubber forests. In this study, GPP deviations were calculated by comparing with historical GPP trends during the same period, without considering the impact of advanced or delayed phenological phases in rubber trees on the results. At the XR site during the warm dry season, GPP increased by 5% under drought conditions (Table 3), possibly due to higher temperatures and ample PAR during drought, which promoted new leaf growth and mitigated drought stress effects. Accurate analysis of the impact of drought stress requires the exclusion of other influencing factors, necessitating further flux observations and physiological experiments on drought stress.

5. Conclusions

This study developed a robust model to predict the GPP using flux observations of GPP from rubber plantations at four different locations in China and Thailand, along with corresponding remote sensing indices. The model reconstructed the GPP time series from 2001 to 2020 for these four sites and assessed the impact of drought on the GPP of rubber plantation ecosystems.
The results indicate that the GPP prediction model developed using remote sensing indices such as SIF, EVI, NDVI, NIRv, and PAR exhibits high accuracy and robustness. Among these indices, solar-induced chlorophyll fluorescence (SIF) is the most effective indicator for predicting vegetation GPP. Indices like NDVI, EVI, and PAR still provide additional information and can effectively complement SIF in monitoring vegetation growth conditions.
Drought affects the GPP of rubber plantations, but the extent of the impact varies by region and season. In the rubber plantation areas of northern China and Thailand, both short-term (3 months) and long-term (12 months) droughts during the cool dry and warm dry seasons lead to reductions in GPP, with declines ranging from 4% to 29%. In addition, the decrease in GPP caused by drought may be compensated for by variations in other factors. During the rainy season with abundant precipitation across the four regions, and in the cool dry season with sufficient rainfall in southern Thailand (SR site), mild droughts have minimal impact on GPP, and may even lead to a slight increase in GPP due to enhanced photosynthetically active radiation.
This study integrated multiple remote sensing indices into a mixed-effects model for GPP prediction, advancing the methods for assessing vegetation productivity. The analysis of GPP yield sequences derived from satellite remote sensing addresses the relationship between drought conditions and GPP in rubber plantations, overcoming the limitations of sparse flux observation sites and observation periods that cannot capture drought processes.
Despite its advantages, this study has some limitations. The use of eight-day composite data for GPP and remote sensing index analysis may overlook subtle temporal variations in photosynthetic activity and drought impacts. Future research incorporating higher temporal and spatial resolution data could enhance understanding of short-term variations in GPP and drought impacts. Including additional environmental factors such as soil moisture, nutrient availability, and detailed climate variables could refine the prediction model and reduce uncertainty.

Author Contributions

W.L. and S.L.: Conceptualization, Funding acquisition, and Writing—review and editing. M.H.: Writing—original draft, Writing—review and editing, and Methodology. J.Z., H.Z., X.C., R.B., R.L. and W.H.: Data curation, Formal analysis, Methodology, and Visualization. All authors have read and agreed to the published version of the manuscript.

Funding

This research was funded by the National Natural Science Foundation of China Joint Foundation Program (U21A6001); National Key R&D Program of China (2022YFD2301201); Natural Science Foundation of Hainan province (Grant No. 421MS101); and Scientific Research Projects of Academician Innovation Platform in Hainan Province.

Data Availability Statement

Data is contained within the article.

Conflicts of Interest

The authors declare no conflicts of interest.

References

  1. Al-Kaisi, M.M.; Broner, I. Crop Water Use and Growth Stages; Colorado State University Extension: Fort Collins, CO, USA, 2009; p. 4. [Google Scholar]
  2. Beer, C.; Reichstein, M.; Tomelleri, E.; Ciais, P.; Jung, M.; Carvalhais, N.; Rödenbeck, C.; Arain, M.; Baldocchi, D.; Bonan, G.; et al. Terrestrial Gross Carbon Dioxide Uptake: Global Distribution and Covariation with Climate. Science 2010, 329, 834–838. [Google Scholar] [CrossRef] [PubMed]
  3. Running, S.; Nemani, R.; Heinsch, F.; Zhao, M.; Reeves, M.; Hashimoto, H. A Continuous Satellite-Derived Measure of Global Terrestrial Primary Production. BioScience 2004, 54, 547–560. [Google Scholar] [CrossRef]
  4. Li, R.; Zhao, S.; Zhao, H.; Xu, M.; Zhang, L.; Wen, H.; Sheng, Q. Spatiotemporal Assessment of Forest Biomass Carbon Sinks: The Relative Roles of Forest Expansion and Growth in Sichuan Province, China. J. Environ. Qual. 2017, 46, 64–71. [Google Scholar] [CrossRef] [PubMed]
  5. Brinck, K.; Fischer, R.; Groeneveld, J.; Lehmann, S.; Paula, M.; Pütz, S.; Sexton, J.; Song, D.; Huth, A. High Resolution Analysis of Tropical Forest Fragmentation and Its Impact on the Global Carbon Cycle. Nat. Commun. 2017, 8, 14855. [Google Scholar] [CrossRef] [PubMed]
  6. Ha, T.V.; Uereyen, S.; Kuenzer, C. Agricultural Drought Conditions over Mainland Southeast Asia: Spatiotemporal Characteristics Revealed from MODIS-Based Vegetation Time-Series. Int. J. Appl. Earth Obs. Geoinf. 2023, 121, 103378. [Google Scholar] [CrossRef]
  7. Ha, T.V.; Uereyen, S.; Kuenzer, C. Spatiotemporal analysis of tropical vegetation ecosystems and their responses to multifaceted droughts in Mainland Southeast Asia using satellite-based time series. GIScience Remote Sens. 2004, 61, 2387385. [Google Scholar] [CrossRef]
  8. Li, Z.; Fox, J. Mapping Rubber Tree Growth in Mainland Southeast Asia Using Time-Series MODIS 250 m NDVI and Statistical Data. Appl. Geogr. 2012, 32, 420–432. [Google Scholar] [CrossRef]
  9. Ahrends, A.A.; Hollingsworth, P.; Ziegler, A.; Fox, J.; Chen, H.; Su, Y.; Xu, J. Current Trends of Rubber Plantation Expansion May Threaten Biodiversity and Livelihoods. Glob. Environ. Chang. 2015, 34, 48–58. [Google Scholar] [CrossRef]
  10. Koh, L.; Wilcove, D. Is Oil Palm Agriculture Really Destroying Tropical Biodiversity? Conserv. Lett. 2008, 1, 60–64. [Google Scholar] [CrossRef]
  11. Ziegler, A.; Fox, J.; Xu, J. The Rubber Juggernaut. Science 2009, 324, 1024–1025. [Google Scholar] [CrossRef]
  12. Gao, S.; Liu, X.; Bo, Y.; Shi, Z.; Zhou, H. Rubber Identification Based on Blended High Spatio-Temporal Resolution Optical Remote Sensing Data: A Case Study in Xishuangbanna. Remote Sens. 2019, 11, 496. [Google Scholar] [CrossRef]
  13. von Essen, M.; Do Rosário, I.T.; Santos-Reis, M.; Nicholas, K.A. Valuing and Mapping Cork and Carbon across Land Use Scenarios in a Portuguese Montado Landscape. PLoS ONE 2019, 14, e0212174. [Google Scholar] [CrossRef] [PubMed]
  14. Sarathchandra, C.; Abebe, Y.; Worthy, F.; Wijerathne, I.; Ma, H.; Yingfeng, B.; Jiayu, G.; Chen, H.; Yan, Q.; Geng, Y.; et al. Impact of Land Use and Land Cover Changes on Carbon Storage in Rubber Dominated Tropical Xishuangbanna, South West China. Ecosyst. Health Sustain. 2021, 7, 1915183. [Google Scholar] [CrossRef]
  15. Li, Y.; Liu, C.; Zhang, J.; Zhang, P.; Xue, Y. Monitoring Spatial and Temporal Patterns of Rubber Plantation Dynamics Using Time-Series Landsat Images and Google Earth Engine. IEEE J. Sel. Top. Appl. Earth Obs. Remote Sens. 2021, 14, 9450–9461. [Google Scholar] [CrossRef]
  16. Nguyen, M.H.; Dao, D.T.; Le, M.S.; Le, T.H. A modification of normalized difference drought index to enhance drought assessment using remotely sensed imagery. Environ. Monit. Assess. 2024, 196, 883. [Google Scholar] [CrossRef]
  17. Yang, S.; Zhao, Y.; Yang, D.; Lan, A. Analysis of Vegetation NDVI Changes and Driving Factors in the Karst Concentration Distribution Area of Asia. Forests 2024, 15, 398. [Google Scholar] [CrossRef]
  18. Guo, H.; Bao, A.; Liu, T.; Ndayisaba, F.; He, D.; Kurban, A.; De Maeyer, P. Meteorological Drought Analysis in the Lower Mekong Basin Using Satellite-Based Long-Term CHIRPS Product. Sustainability 2017, 9, 901. [Google Scholar] [CrossRef]
  19. Burton, C.; Rifai, S.; Malhi, Y. Inter-Comparison and Assessment of Gridded Climate Products over Tropical Forests During the 2015/2016 El Niño. Philos. Trans. R. Soc. B Biol. Sci. 2018, 373, 20170406. [Google Scholar] [CrossRef]
  20. Thirumalai, K.; Dinezio, P.N.; Okumura, Y.; Deser, C. Extreme Temperatures in Southeast Asia Caused by El Niño and Worsened by Global Warming. Nat. Commun. 2017, 8, 15531. [Google Scholar] [CrossRef]
  21. Qian, X.; Qiu, B.; Zhang, Y. Widespread Decline in Vegetation Photosynthesis in Southeast Asia Due to the Prolonged Drought During the 2015/2016 El Niño. Remote Sens. 2019, 11, 910. [Google Scholar] [CrossRef]
  22. Wigneron, J.P.; Fan, L.; Ciais, P.; Bastos, A.; Brandt, M.; Chave, J.; Saatchi, S.; Baccini, A.; Fensholt, R. Tropical Forests Did Not Recover from the Strong 2015–2016 El Niño Event. Sci. Adv. 2020, 6, eaay4603. [Google Scholar] [CrossRef]
  23. Wang, X.; Blanken, P.D.; Kasemsap, P.; Petchprayoon, P.; Thaler, P.; Nouvellon, Y.; Gay, F.; Chidthaisong, A.; Sanwangsri, M. Carbon and Water Cycling in Two Rubber Plantations and a Natural Forest in Mainland Southeast Asia. J. Geophys. Res. Biogeosci. 2022, 127, e2022JG006840. [Google Scholar] [CrossRef]
  24. Zhang, R.; E, X.; Ma, Z.; An, Y.; Bao, Q.; Wu, Z.; Wu, L.; Sun, Z. Drought Sensitivity and Vulnerability of Rubber Plantation GPP—Insights from Flux Site-Based Simulation. Land 2024, 13, 745. [Google Scholar] [CrossRef]
  25. Cui, W.; Xiong, Q.; Zheng, Y.; Zhao, J.; Nie, T.; Wu, L.; Sun, Z. A Study on the Vulnerability of the Gross Primary Production of Rubber Plantations to Regional Short-Term Flash Drought over Hainan Island. Forests 2022, 13, 893. [Google Scholar] [CrossRef]
  26. Sousa, C.; Hilker, T.; Waring, R.; Moura, Y.; Lyapustin, A. Progress in Remote Sensing of Photosynthetic Activity over the Amazon Basin. Remote Sens. 2017, 9, 48. [Google Scholar] [CrossRef]
  27. Li, X.; Xiao, J. TROPOMI Observations Allow for Robust Exploration of the Relationship between Solar-Induced Chlorophyll Fluorescence and Terrestrial Gross Primary Production. Remote Sens. Environ. 2022, 268, 112748. [Google Scholar] [CrossRef]
  28. Shen, M.; Tang, Y.; Desai, A.; Gough, C.; Chen, J. Can EVI-Derived Land-Surface Phenology Be Used as a Surrogate for Phenology of Canopy Photosynthesis? Int. J. Remote Sens. 2014, 35, 1162–1174. [Google Scholar] [CrossRef]
  29. Rossini, M.; Nedbal, L.; Guanter, L.; Ač, A.; Alonso, L.; Burkart, A.; Cogliati, S.; Colombo, R.; Damm, A.; Drusch, M.; et al. Red and Far Red Sun-Induced Chlorophyll Fluorescence as a Measure of Plant Photosynthesis. Geophys. Res. Lett. 2015, 42, 1632–1639. [Google Scholar] [CrossRef]
  30. Guanter, L.; Zhang, Y.; Jung, M.; Joiner, J.; Voigt, M.; Berry, J.; Frankenberg, C.; Huete, A.; Zarco-Tejada, P.; Lee, J.; et al. Global and Time-Resolved Monitoring of Crop Photosynthesis with Chlorophyll Fluorescence. Proc. Natl. Acad. Sci. USA 2014, 111, E1327–E1333. [Google Scholar] [CrossRef]
  31. Frydenvang, J.; Maarschalkerweerd, M.; Carstensen, A.; Mundus, S.; Schmidt, S.; Pedas, P.; Laursen, K.; Schjoerring, J.; Husted, S. Sensitive Detection of Phosphorus Deficiency in Plants Using Chlorophyll a Fluorescence. Plant Physiol. 2015, 169, 353–361. [Google Scholar] [CrossRef]
  32. Sun, Y.; Frankenberg, C.; Wood, J.D.; Schimel, D.S.; Jung, M.; Guanter, L.; Drewry, D.T.; Verma, M.; Porcar-Castell, A.; Griffis, T.J.; et al. OCO-2 Advances Photosynthesis Observation from Space via Solar-Induced Chlorophyll Fluorescence. Science 2017, 358, eaam5747. [Google Scholar] [CrossRef] [PubMed]
  33. Pérez-Priego, Ó.; Zarco-Tejada, P.; Miller, J.; Sepulcre-Cantó, G.; Fereres, E. Detection of Water Stress in Orchard Trees with a High-Resolution Spectrometer through Chlorophyll Fluorescence In-Filling of the O2-A Band. IEEE Trans. Geosci. Remote Sens. 2005, 43, 2860–2869. [Google Scholar] [CrossRef]
  34. Kim, J.; Ryu, Y.; Dechant, B.; Lee, H.; Kim, H.; Kornfeld, A.; Berry, J. Solar-induced chlorophyll fluorescence detects photosynthnce Is Non-Linearly Related to Canopy Photosynthesis in a Temperate Evergreen Needleleaf Forest during the Fall Transition. Remote Sens. Environ. 2021, 258, 112362. [Google Scholar] [CrossRef]
  35. Wang, X.; Qiu, B.; Li, W.; Zhang, Q. Impacts of Drought and Heatwave on the Terrestrial Ecosystem in China as Revealed by Satellite Solar-Induced Chlorophyll Fluorescence. Sci. Total Environ. 2019, 693, 133627. [Google Scholar] [CrossRef]
  36. Yang, J.; Tian, H.; Pan, S.; Chen, G.; Zhang, B.; Dangal, S. Amazon Drought and Forest Response: Largely Reduced Forest Photosynthesis but Slightly Increased Canopy Greenness during the Extreme Drought of 2015/2016. Glob. Chang. Biol. 2018, 24, 1919–1934. [Google Scholar] [CrossRef]
  37. Wang, X.; Blanken, P.D.; Wood, J.D.; Nouvellon, Y.; Thaler, P.; Kasemsap, P.; Chidthaisong, A.; Petchprayoon, P.; Chayawat, C.; Xiao, J.; et al. Solar-Induced Chlorophyll Fluorescence Detects Photosynthesis Variations and Drought Effects in Tropical Rubber Plantation and Natural Deciduous Forests. Agric. For. Meteorol. 2023, 339, 109591. [Google Scholar] [CrossRef]
  38. Bao, Q.; Zhang, R.; Wang, Y.; Cui, W.; Zhao, J.; Wu, L.; Sun, Z. Dataset of Distribution Changes of Natural Rubber Plantations in Hainan Island from 2000 to 2020. China Sci. Data 2023, 8, 4. [Google Scholar] [CrossRef]
  39. Wang, Y.; Hollingsworth, P.M.; Zhai, D.; West, C.D.; Green, J.M.H.; Chen, H.; Hurni, K.; Su, Y.; Warren-Thomas, E.; Xu, J.; et al. High-Resolution Maps Show That Rubber Causes Substantial Deforestation. Nature. 2023, 623, 340–346. [Google Scholar] [CrossRef]
  40. Yang, S.; Liu, J.; Yang, C.; Lan, G.; Song, B.; Wu, Z. 2010–2018 Hainan Danzhou Rubber Plantation Carbon and Water Flux and Micrometeorological Data Set [DS/OL]. Science Data Bank. 2022. Available online: https://cstr.cn/31253.11.sciencedb.j00001.00480 (accessed on 26 October 2022).
  41. Yu, H.; Qi, D.; Zhang, Y.; Song, Q.; Fei, X.; Sha, L.; Liu, Y.; Zhou, W.; Zhou, L.; Deng, X.; et al. 2010–2014 Xishuangbanna Rubber Plantation Carbon and Water Flux Observation Data Set [DB/OL]. Science Data Bank. 2020. Available online: https://cstr.cn/31253.11.sciencedb.j00001.00123 (accessed on 16 September 2020).
  42. An, Y.; Zhang, R.; Liu, W.; Wang, P.; Zhang, J.; Wu, L.; Sun, Z. Analysis of different satellite-based SIF products of the rubber plantations in Hainan Island and their effects on GPP estimate. J. Trop. Biol. 2023, 14, 412–423. [Google Scholar] [CrossRef]
  43. Li, X.; Xiao, J. A global, 0.05-degree product of solar-induced chlorophyll fluorescence derived from OCO-2, MODIS, and reanalysis data. Remote Sens. 2019, 11, 517. [Google Scholar] [CrossRef]
  44. Schaaf, C.; Wang, Z. MCD43A4 MODIS/Terra+Aqua BRDF/Albedo Nadir BRDF Adjusted Ref Daily L3 Global—500m V006 [Data Set]. NASA EOSDIS Land Processes Distributed Active Archive Center. 2015. Available online: https://lpdaac.usgs.gov/products/mcd43a4v006/ (accessed on 8 July 2024).
  45. Wang, D. MODIS/Terra+Aqua Photosynthetically Active Radiation Daily/3-Hour L3 Global 0.05Deg CMG V061 [Data Set]. NASA EOSDIS Land Processes Distributed Active Archive Center. 2021. Available online: https://lpdaac.usgs.gov/products/mcd18c2v061/ (accessed on 8 July 2024).
  46. SPEI Global Drought Monitor. Available online: https://spei.csic.es/database.html (accessed on 3 August 2024).
  47. Ghasemloo, N.; Matkan, A.A.; Alimohammadi, A.; Aghighi, H.; Mirbagheri, B. Estimating the Agricultural Farm Soil Moisture Using Spectral Indices of Landsat 8, and Sentinel-1, and Artificial Neural Networks. J. Geovisualization Spat. Anal. 2022, 6, 19. [Google Scholar] [CrossRef]
  48. Wang, J.; Haining, R.; Zhang, T.; Xu, C.; Hu, M.; Yin, Q.; Li, L.; Zhou, C.; Li, G.; Chen, H. Statistical Modeling of Spatially Stratified Heterogeneous Data. Ann. Am. Assoc. Geogr. 2024, 114, 499–519. [Google Scholar] [CrossRef]
  49. Niku, J.; Warton, D.; Hui, F.; Taskinen, S. Generalized Linear Latent Variable Models for Multivariate Count and Biomass Data in Ecology. J. Agric. Biol. Environ. Stat. 2017, 22, 498–522. [Google Scholar] [CrossRef]
  50. Fu, L.; Zeng, W.; Tang, S.; Sharma, R.; Li, H. Using linear mixed model and dummy variable model approaches to construct compatible single-tree biomass equations at different scales—A case study for Masson pine in Southern China. J. For. Sci. 2018, 58, 101–115. [Google Scholar] [CrossRef]
  51. Rodríguez-Veiga, P.; Quegan, S.; Carreiras, J.; Persson, H.; Fransson, J.; Hościło, A.; Ziolkowski, D.; Stereńczak, K.; Lohberger, S.; Stängel, M.; et al. Forest biomass retrieval approaches from earth observation in different biomes. Int. J. Appl. Earth Obs. Geoinf. 2019, 77, 53–68. [Google Scholar] [CrossRef]
  52. Lu, J.; Carbone, G.; Gao, P. Detrending crop yield data for spatial visualization of drought impacts in the United States, 1895–2014. Agric. For. Meteorol. 2017, 237, 196–208. [Google Scholar] [CrossRef]
  53. Zhang, Z.; Zhang, Y.; Joiner, J.; Migliavacca, M. Angle matters: Bidirectional effects impact the slope of relationship between gross primary productivity and sun-induced chlorophyll fluorescence from Orbiting Carbon Observatory-2 across biomes. Glob. Chang. Biol. 2018, 24, 5017–5020. [Google Scholar] [CrossRef]
  54. Costa, G.B.; Mendes, K.R.; Viana, L.B.; Almeida, G.V.; Mutti, P.R.; e Silva, C.M.S.; Bezerra, B.G.; Marques, T.V.; Ferreira, R.R.; Oliveira, C.P. Seasonal ecosystem productivity in a seasonally dry tropical forest (caatinga) using flux tower measurements and remote sensing data. Remote Sens. 2022, 14, 3955. [Google Scholar] [CrossRef]
  55. Cavaleri, M.; Coble, A.P.; Ryan, M.G.; Bauerle, W.; Loescher, H.; Oberbauer, S. Tropical rainforest carbon sink declines during El Niño as a result of reduced photosynthesis and increased respiration rates. New Phytol. 2017, 216, 136–149. [Google Scholar] [CrossRef]
  56. Sun, Z.; Wang, X.; Yamamoto, H.; Tani, H.; Zhong, G.; Yin, S.; Guo, E. Spatial pattern of GPP variations in terrestrial ecosystems and its drivers: Climatic factors, CO2 concentration and land-cover change, 1982–2015. Ecol. Inform. 2018, 46, 156–165. [Google Scholar] [CrossRef]
  57. Zhang, W.; Luo, G.; Yuan, X.; Li, C.; Xie, M.; Wang, Y.; Ma, X.; Shi, H.; Hamdi, R.; Hellwich, O. New data-driven method for estimation of net ecosystem carbon exchange at meteorological stations effectively increases the global carbon flux data. Methods Ecol. Evol. 2023, 14, 2449–2463. [Google Scholar] [CrossRef]
  58. Vicente-Serrano, S.; Beguería, S.; López-Moreno, J. A Multiscalar Drought Index Sensitive to Global Warming: The Standardized Precipitation Evapotranspiration Index. J. Clim. 2009, 23, 1696–1718. [Google Scholar] [CrossRef]
  59. Vicente-Serrano, S.; Gouveia, C.; Camarero, J.; Beguería, S.; Trigo, R.; López-Moreno, J.; Azorín-Molina, C.; Pasho, E.; Lorenzo-Lacruz, J.; Revuelto, J.; et al. Response of vegetation to drought time-scales across global land biomes. Proc. Natl. Acad. Sci. USA 2012, 110, 52–57. [Google Scholar] [CrossRef] [PubMed]
  60. Chen, B.; Li, X.; Xiao, X.; Zhao, B.; Dong, J.; Kou, W.; Qin, Y.; Yang, C.; Wu, Z.; Sun, R.; et al. Mapping tropical forests and deciduous rubber plantations in Hainan Island, China by integrating PALSAR 25-m and multi-temporal Landsat images. Int. J. Appl. Earth Obs. Geoinf. 2016, 50, 117–130. [Google Scholar] [CrossRef]
  61. He, Z.; Du, J.; Chen, L.; Zhu, X.; Lin, P.; Zhao, M.; Fang, S. Impacts of recent climate extremes on spring phenology in arid-mountain ecosystems in China. Agric. For. Meteorol. 2018, 260, 31–40. [Google Scholar] [CrossRef]
  62. Javed, T.; Li, Y.; Feng, K.; Ayantobo, O.; Ahmad, S.; Chen, X.; Rashid, S.; Suon, S. Monitoring responses of vegetation phenology and productivity to extreme climatic conditions using remote sensing across different sub-regions of China. Environ. Sci. Pollut. Res. 2020, 28, 3644–3659. [Google Scholar] [CrossRef]
  63. Wang, X.; Sun, Z.; Lu, S.; Zhang, Z. Comparison of Phenology Estimated From Monthly Vegetation Indices and Solar-Induced Chlorophyll Fluorescence in China. Front. Earth Sci. 2022, 10, 802763. [Google Scholar] [CrossRef]
Figure 1. Distribution of rubber plantations and flux station locations in the study area.
Forests 15 01732 g001
Figure 2. Monthly temperature and precipitation conditions in the areas of the four flux sites. (DR stands for China Danzhou rubber, XR represents China Xishuangbanna rubber, SR stands for Thailand south rubber, and NR represents Thailand north rubber).
Forests 15 01732 g002
Figure 3. Annual GPP values from flux observations at four sites.
Forests 15 01732 g003
Figure 4. Monthly distribution of daily GPP values at four flux sites.
Forests 15 01732 g004
Figure 5. Scatter matrix plot of the distribution and correlation between GPP and VI indices. Significant correlations are indicated with * (p < 0.05). In the upper-right plots, the colors of the ellipses represent the strength of the correlations. In the lower-left plots, the red line indicates the regression line, and the shaded area represents the 95% confidence intervals.
Forests 15 01732 g005
Figure 6. GPP simulation training and validation based on remote sensing indices.
Forests 15 01732 g006
Figure 7. Annual GPP comparisons of model-predicted GPP, flux observations, and MOD17A3HGF data.
Forests 15 01732 g007
Figure 8. Correlation between drought indices and remote sensing indices at four flux stations. Significant correlations are indicated with * (p < 0.05).
Forests 15 01732 g008
Figure 9. Time series of eight-day GPP and the SPEI12 drought index for four sites (DR, XR, NR, and SR) from 2001 to 2020. The green area represents the wet stage, the yellow area indicates the drought stage, and the grey line corresponds to the GPP values over an eight-day interval.
Forests 15 01732 g009
Figure 10. Deviations of GPP under short-term drought conditions during different seasons. Error bars represent 95% confidence intervals, and black lines indicate minimum and maximum values.
Forests 15 01732 g010
Figure 11. Deviations of GPP under long-term drought conditions during different seasons. Error bars represent 95% confidence intervals, and black lines indicate minimum and maximum values.
Forests 15 01732 g011
Table 1. Locations of the four flux stations and observation timespan.
NationThailandThailandChinaChina
Site NameNRSRDRXR
Location101.47° E, 13.57° N99.58° E, 8.32° N109.48° E, 19.21° N101.27° E, 21.90° N
Elevation69 m200 m144 m592 m
Observation Timespan2015–20182017–20182010–20182010–2014
Table 2. Interaction between remote sensing index factors and GPP.
NDVIEVINIRvSIFPAR
NDVI0.24
EVI0.50 0.45
NIRv0.44 0.52 0.12
SIF0.62 0.61 0.61 0.56
PAR0.39 0.51 0.20 0.60 0.05
Table 3. The percentage of deviations of GPP under drought conditions compared to the average value.
DRXRNRSR
RainyCool DryWarm DryRainyCool DryWarm DryRainyCool DryWarm DryRainyCool DryWarm Dry
SPEI03 < −10%−22%−4%1%−10%5%−2%−10%−14%5%2%−5%
SPEI03 ≥ −10%−1%1%0%3%−1%0%0%1%−1%−1%2%
SPEI12 < −10%−29%−29%−3%−11%−14%0%−14%−12%0%5%−6%
SPEI12 ≥ −1−1%−1%2%1%3%2%−1%−2%1%1%−2%1%
Disclaimer/Publisher’s Note: The statements, opinions and data contained in all publications are solely those of the individual author(s) and contributor(s) and not of MDPI and/or the editor(s). MDPI and/or the editor(s) disclaim responsibility for any injury to people or property resulting from any ideas, methods, instructions or products referred to in the content.

