

Farmers’ Willingness to Accept Afforestation in Farming Land and Its Influencing Factors in Fragile Landscapes Based on the Contingent Valuation Method


Abstract
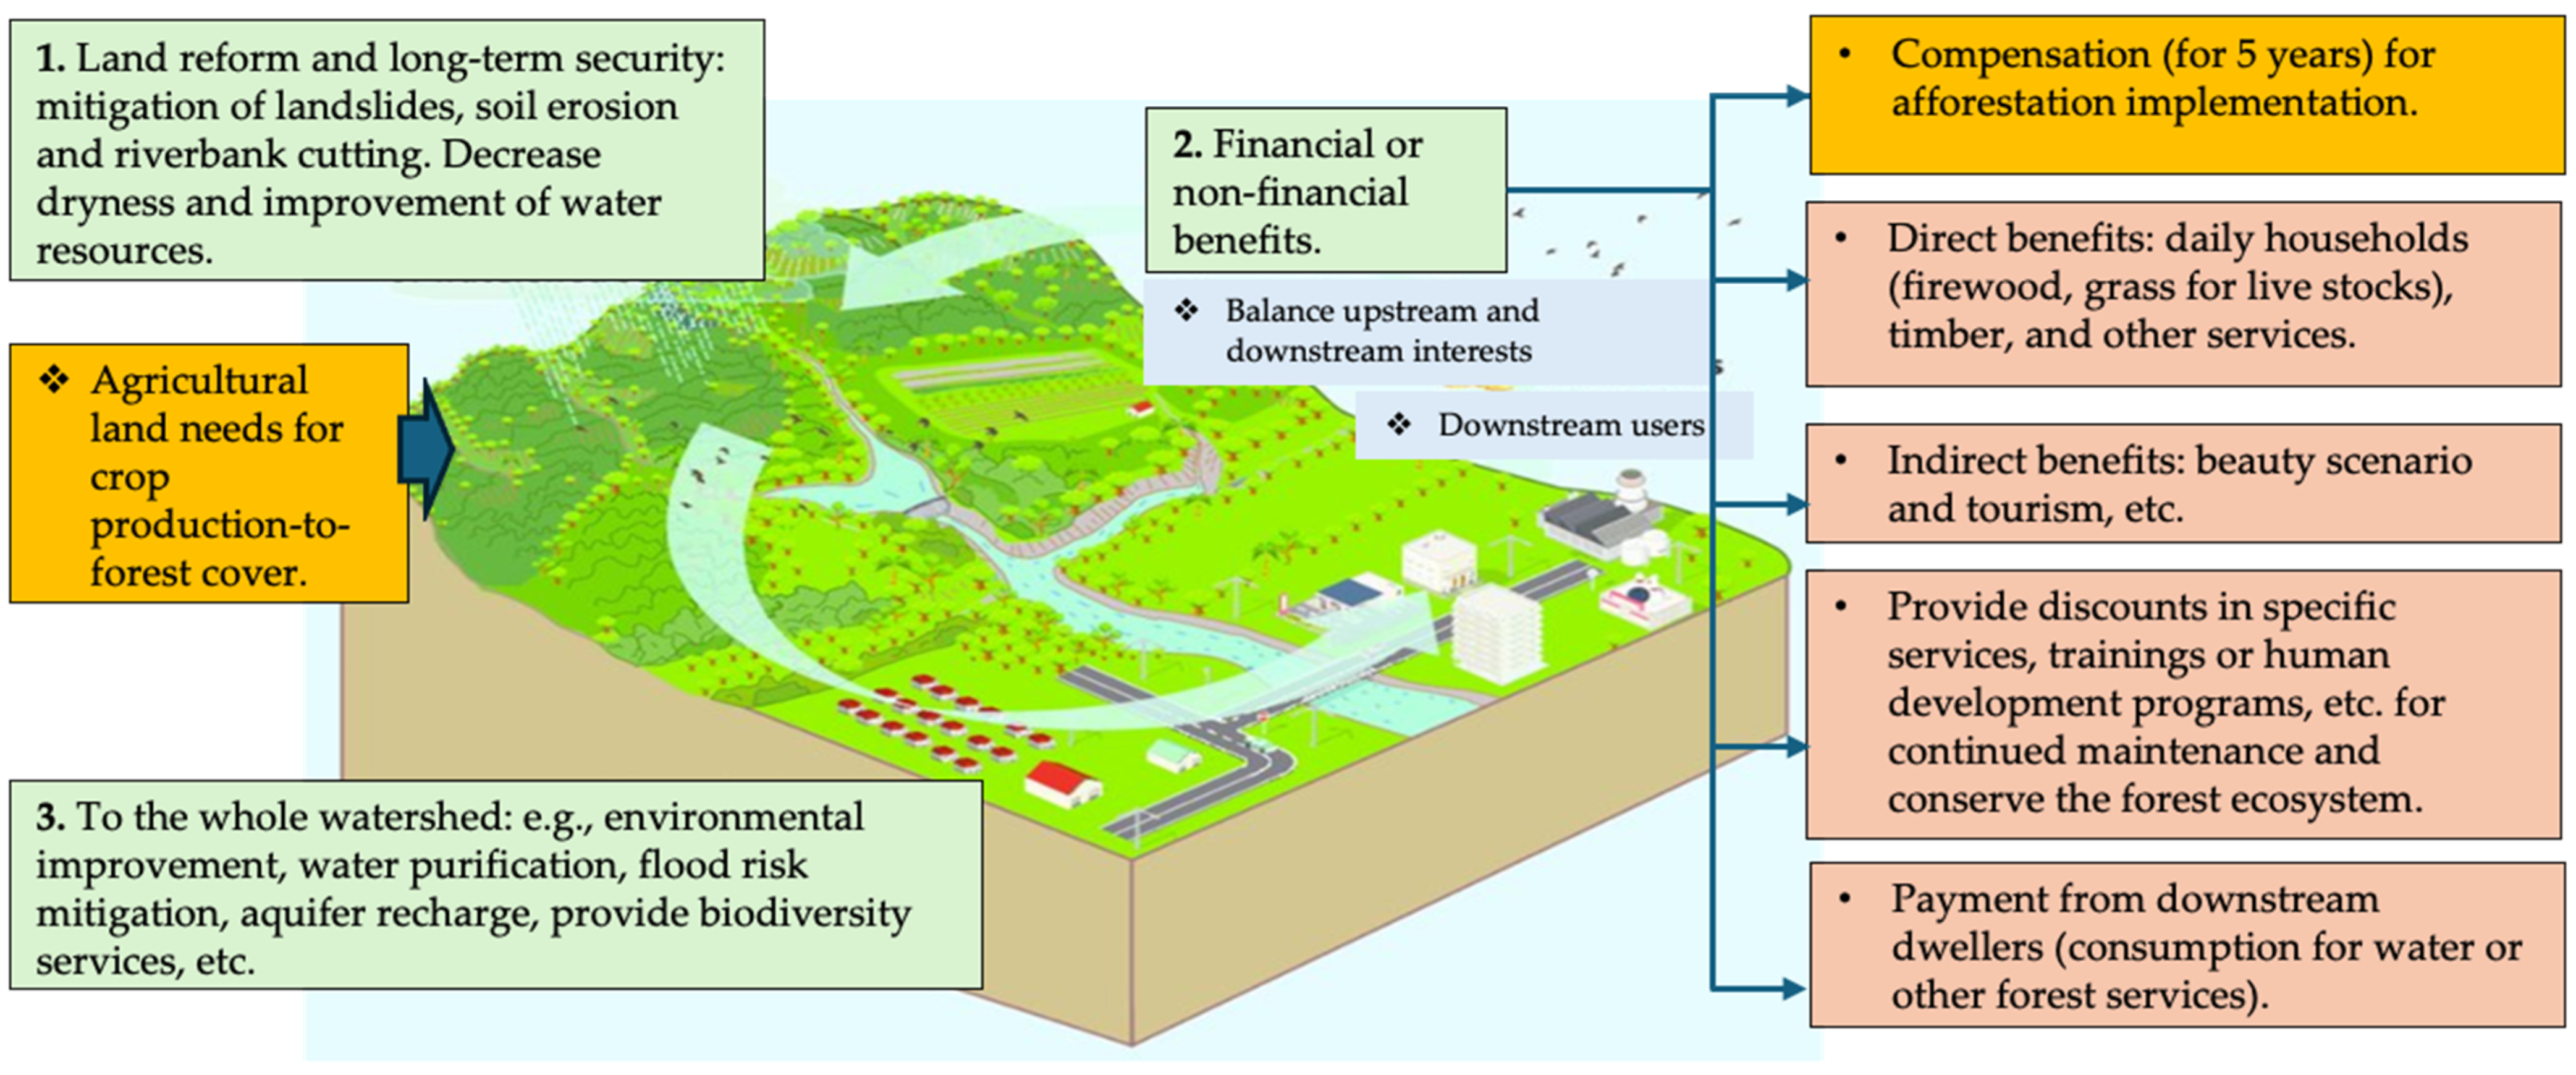
:1. Introduction
2. Materials and Methods
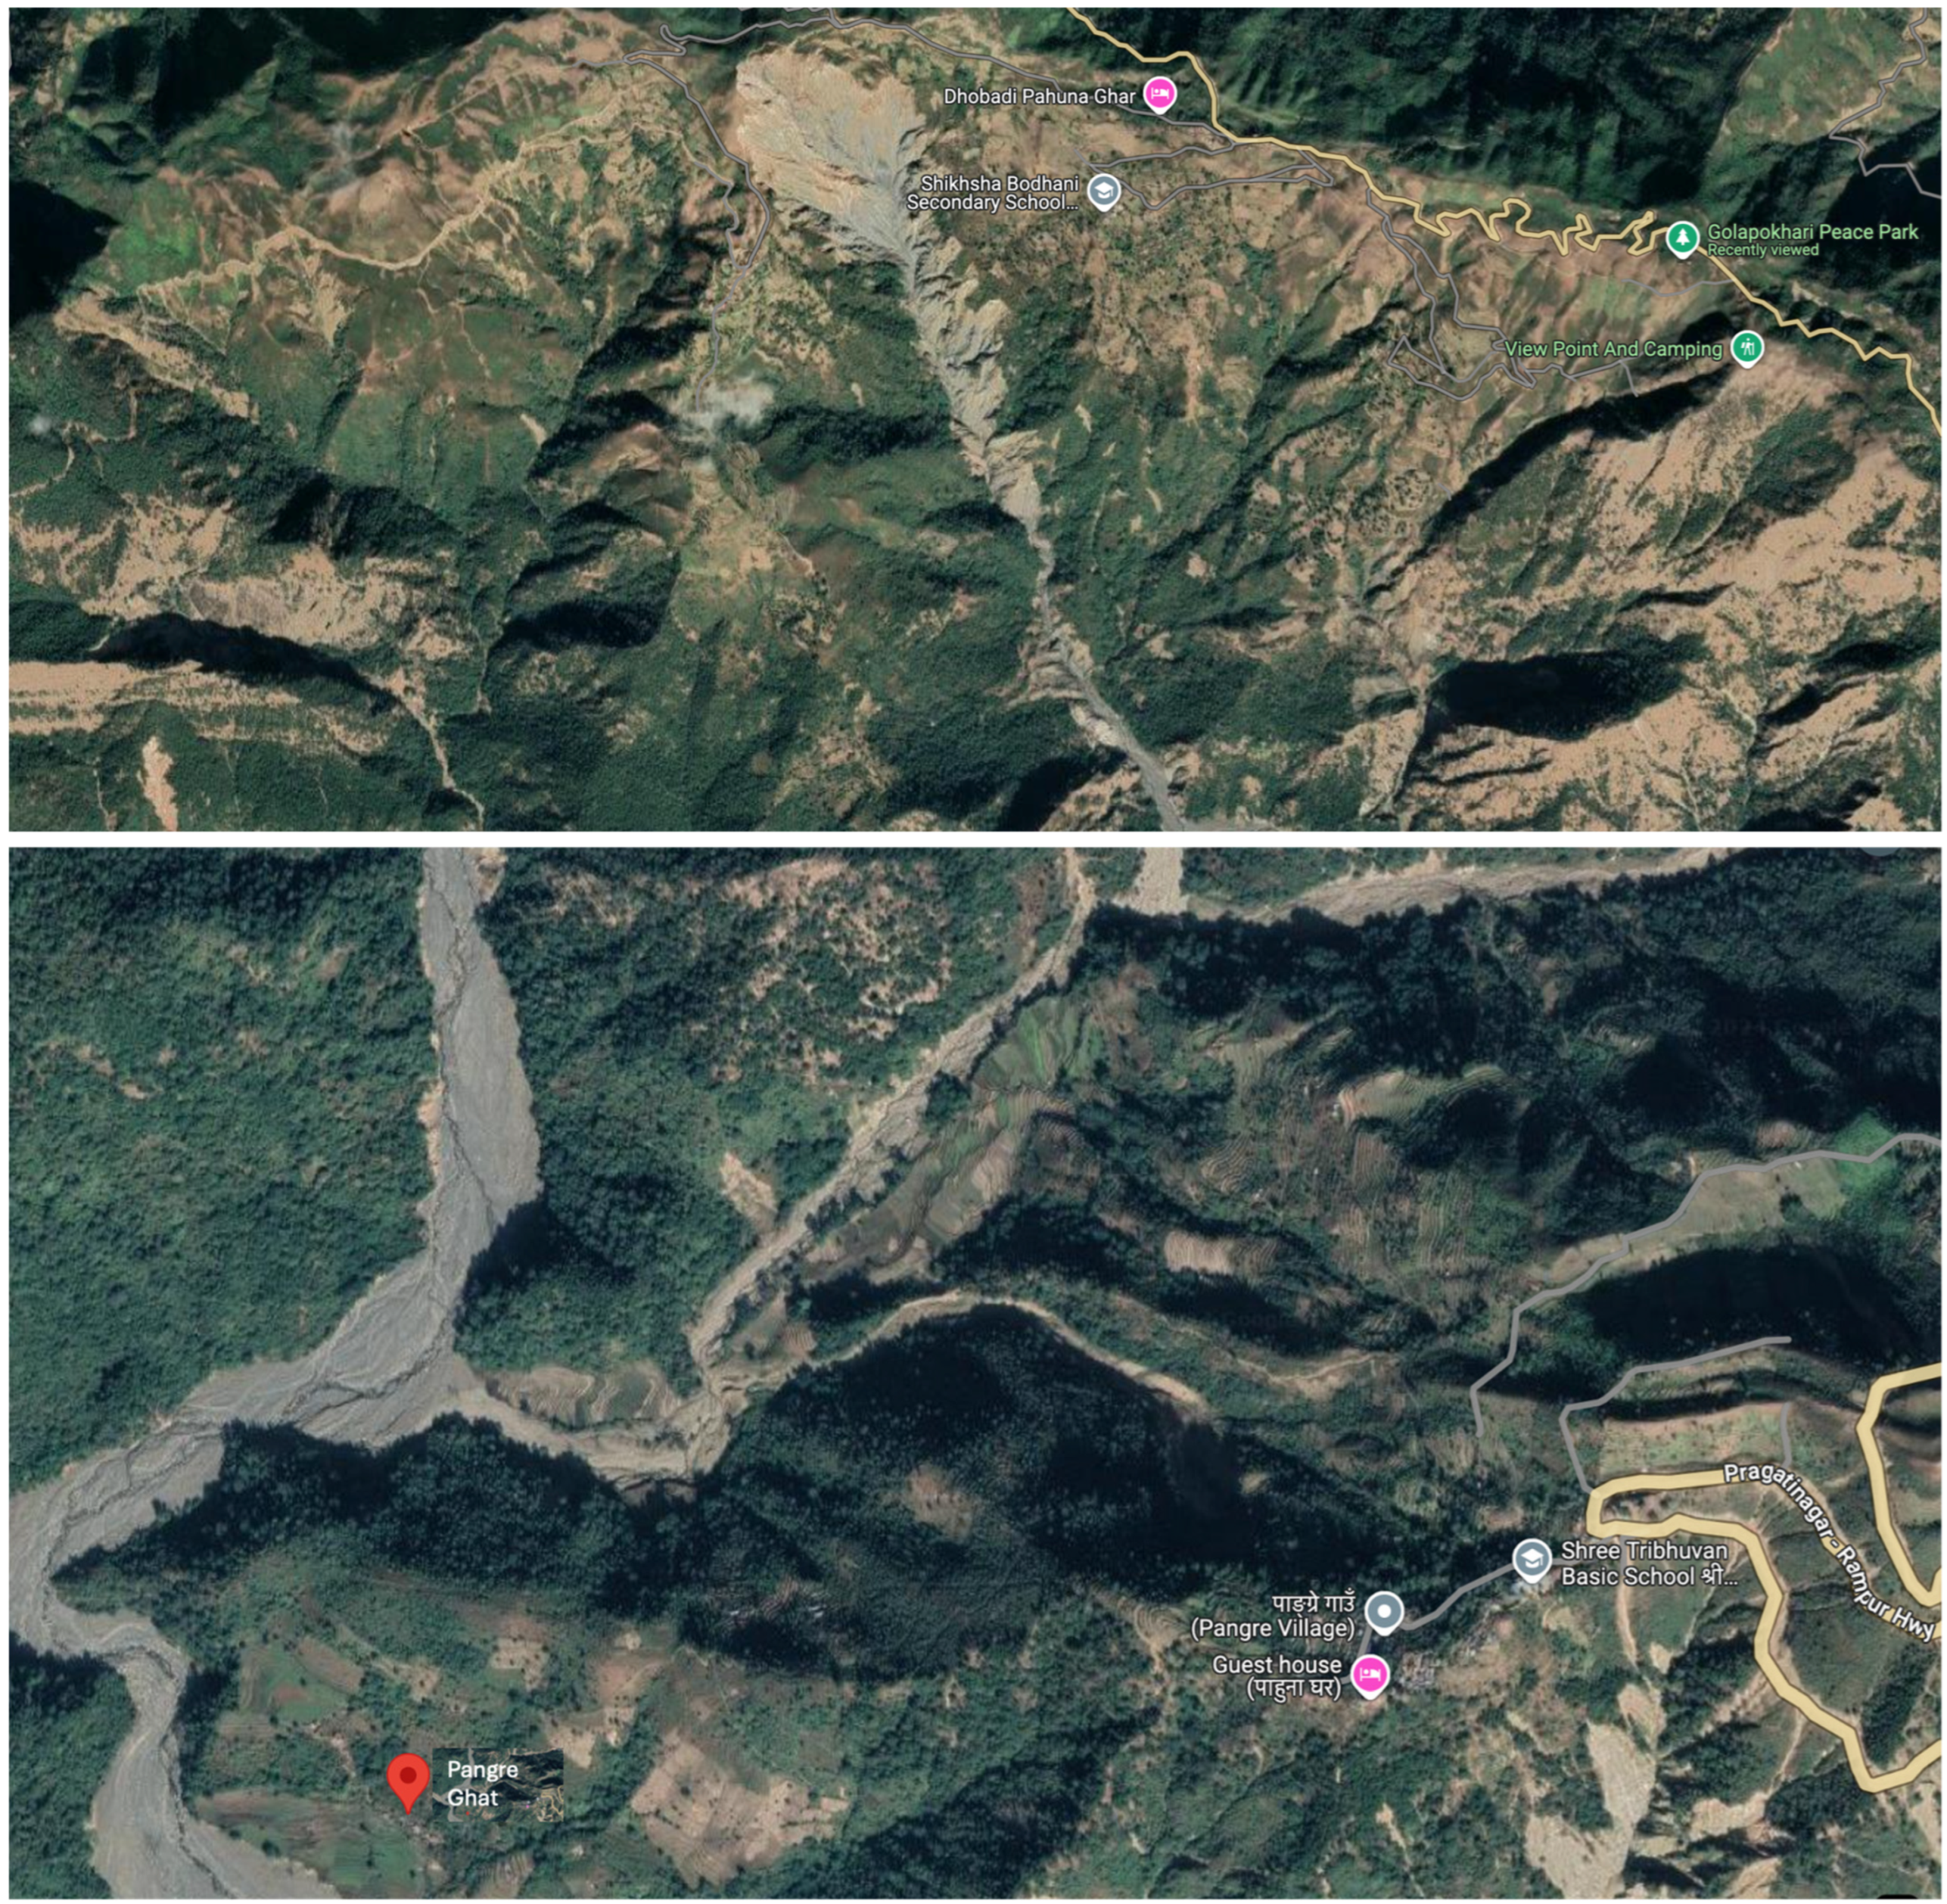
2.1. Study Area
2.2. Questionnaire Design and Field Survey
2.3. Data Analysis Method
2.4. Variables Used in the Statistical Analysis
3. Results
3.1. Farmers’ Socioeconomic and Environmental Characteristics
3.2. Distribution of WTA Value
3.3. Regression Analysis Results for WTA Impact Factors
4. Discussion
5. Conclusions
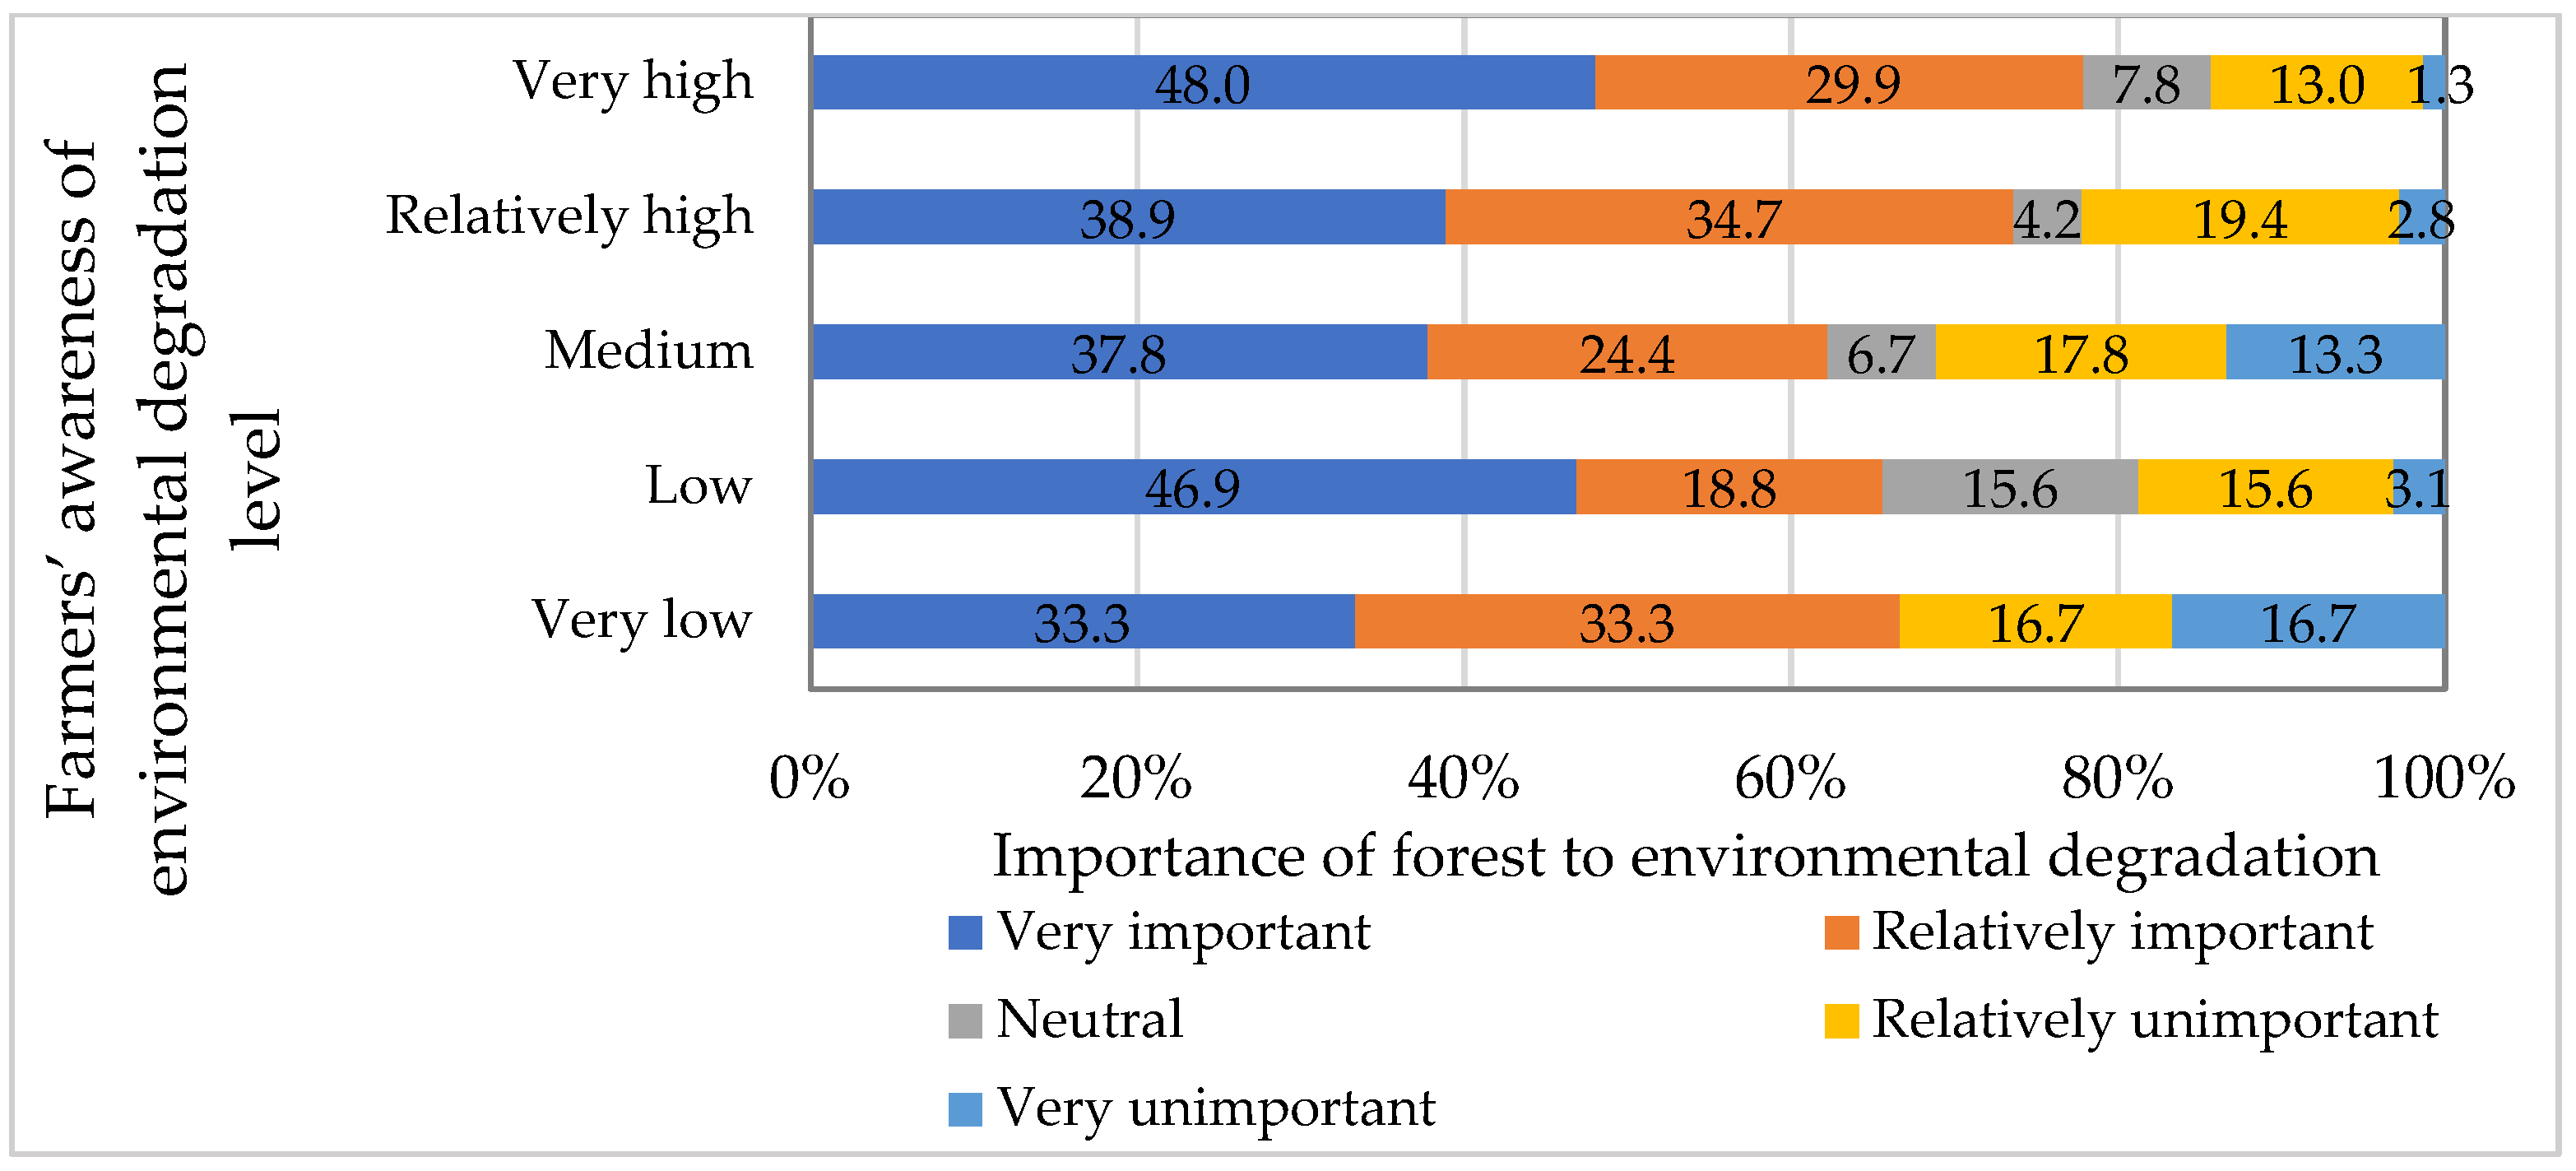
- The impact factors of crop sufficiency, risk level, engagement in local resource management, level of environmental degradation, importance of forest, and level of satisfaction with forest accessibility were significant to both WTA compensation and land with similar coefficients. Other impact factors, such as education, were significant for WTA compensation, and land holding was significant for WTA land. This shows that there is a high possibility that similar factors have a significant impact on WTA alternative land-use practices. However, the result of the level of satisfaction with forest accessibility clarified that the level of significance of these impact factors may vary within different WTAs.
- This study extended a possible relationship that if farmers are well aware of the environmental situation, there is a high possibility of accepting more land for AF as a disaster mitigation measure. However, they would have to be given a compensation equivalent to the land.
Author Contributions
Funding
Data Availability Statement
Acknowledgments
Conflicts of Interest
Abbreviations
| Abbreviation | Definition |
| AF | Afforestation |
| CPS | Crop production sufficiency |
| CVM | Contingent valuation method |
| ED | Education level |
| EDL | Environmental degradation level |
| ELRM | Engagement in local resource management |
| ES | Ecosystem |
| ESS | Ecosystem services |
| FM | Number of family members |
| IFED | Importance of the forest for environmental degradation |
| IS | Main income source |
| IWA | Irrigational water accessibility |
| MF | Manpower for farming |
| LH | Land holding |
| LS | Satisfaction level of forest resource accessibility |
| MI | Households’ average monthly income |
| NPR | Nepalese Rupees |
| NS | Need for forest resources |
| OLRM | Ordinal linear regression model |
| RL | Risk level |
| WTA | Willingness to accept |
| WTP | Willingness to pay |
Appendix A. Additional Figures
Appendix B. Additional Table

| Variables | Description | Number of Respondents | Proportion (%) | |
|---|---|---|---|---|
| Socioeconomic variables | Gender | Female | 79 | 34.1 |
| Male | 153 | 65.9 | ||
| Age (in years) | 18–25 | 19 | 8.2 | |
| 26–45 | 139 | 59.9 | ||
| 46–65 | 69 | 29.7 | ||
| 66–75 | 5 | 2.2 | ||
| Education | Uneducated | 82 | 35.3 | |
| Primary | 88 | 37.9 | ||
| Secondary | 45 | 19.4 | ||
| Senior high school | 17 | 7.3 | ||
| Main income source | Farming | 85 | 36.6 | |
| Off-farming | 147 | 63.4 | ||
| Number of family members | 1–3 | 26 | 11.2 | |
| 4–6 | 117 | 50.4 | ||
| ≥7 | 89 | 38.4 | ||
| Manpower for farming | 0 | 1 | 0.4 | |
| 1–2 | 91 | 39.3 | ||
| 3–4 | 96 | 41.4 | ||
| ≥5 | 44 | 18.9 | ||
| Households’ average monthly income (Nepalese Rupees, NPR) | 10,000 | 95 | 41.0 | |
| 20,000 | 98 | 42.2 | ||
| 30,000 | 32 | 13.8 | ||
| 50,000 | 4 | 1.7 | ||
| ≥100,000 | 3 | 1.3 | ||
| Land holding (Kattha) | ≤5 | 63 | 27.2 | |
| 6–10 | 71 | 30.6 | ||
| 11–20 | 71 | 30.6 | ||
| 21–40 | 25 | 10.7 | ||
| ≥41 | 2 | 0.9 | ||
| Crop production sufficiency | Not sufficient | 176 | 75.9 | |
| Sufficient | 56 | 24.1 | ||
| Irrigational water accessibility | Very poor | 57 | 24.6 | |
| Poor | 85 | 36.6 | ||
| Fair | 31 | 13.4 | ||
| Good | 59 | 25.4 | ||
| Attitude and awareness of the local environment | Risk level (of farming land) | Very low | 66 | 28.4 |
| Relatively low | 2 | 0.9 | ||
| Medium | 50 | 21.6 | ||
| Relatively high | 102 | 44.0 | ||
| Very high | 12 | 5.2 | ||
| Engagement in local resource management | Not engaged | 161 | 69.4 | |
| Engaged | 71 | 30.6 | ||
| Environmental degradation level | Very low | 6 | 2.6 | |
| Relatively low | 32 | 13.8 | ||
| Medium | 45 | 19.4 | ||
| Relatively high | 72 | 31.0 | ||
| Very high | 77 | 33.2 | ||
| Importance of forest to environmental degradation | Very unimportant | 11 | 4.7 | |
| Relatively unimportant | 38 | 16.4 | ||
| Neutral | 17 | 7.3 | ||
| Relatively important | 67 | 28.9 | ||
| Very important | 99 | 42.7 | ||
| Needs of forest resource | Only for daily household | 3 | 1.3 | |
| Daily household and income source | 120 | 51.7 | ||
| Daily household, income source, and cultural | 77 | 33.2 | ||
| Daily household, income source, cultural, and beauty | 32 | 13.8 | ||
| Satisfaction level of forest resource accessibility | Very unsatisfied | 22 | 9.5 | |
| Relatively unsatisfied | 104 | 44.8 | ||
| Relatively satisfied | 67 | 28.9 | ||
| Very satisfied | 39 | 16.8 | ||
References
- Chazdon, R.L.; Brancalion, P.H.; Lamb, D.; Laestadius, L.; Calmon, M.; Kumar, C. A policy-driven knowledge agenda for global forest and landscape restoration. Conserv. Lett. 2017, 10, 125–132. [Google Scholar] [CrossRef]
- Bremer, L.L.; Farley, K.A. Does plantation forestry restore biodiversity or create green deserts? A synthesis of the effects of land-use transitions on plant species richness. Biodivers. Conserv. 2010, 19, 3893–3915. [Google Scholar] [CrossRef]
- Barlow, J.; Gardner, T.A.; Araújo, I.S.; Ávila-Pires, T.C.; Bonaldo, A.B.; Costa, J.E.; Esposito, M.C.; Ferreira, L.V.; Hawes, J.; Hernandez, M.I.M.; et al. Quantifying the biodiversity value of tropical primary, secondary, and plantation forests. Proc. Natl. Acad. Sci. USA 2007, 104, 18555–18560. [Google Scholar] [CrossRef]
- Anderson, H.W.; Hoover, M.D.; Reinhart, K.G. Forests and water: Effects of forest management on floods, sedimentation, and water supply. In Pacific Southwest Forest and Range Experiment Station; Forest Service, US Department of Agriculture: Alturas, CA, USA, 1976; 18, pp. 1–95. [Google Scholar]
- Byrne, K.A.; Farrell, E.P. The effect of afforestation on soil carbon dioxide emissions in blanket peatland in Ireland. Forestry 2005, 78, 217–227. [Google Scholar] [CrossRef]
- Likoswe, M.; Chanyenga, T.; Mphepo, G.; Utila, H.; Meke, G.; Chithila, V.; Sagona, W. Building resilience of ecosystems and people’s livelihood through afforestation. In Socio-Ecological Resilience to Climate Change in a Fragile Ecosystem; Routledge: London, UK, 2018; pp. 60–75. [Google Scholar]
- Vedel, S.E.; Jacobsen, J.B.; Thorsen, B.J. Forest owners’ willingness to accept contracts for ecosystem service provision is sensitive to additionality. Ecol. Econ. 2015, 113, 15–24. [Google Scholar] [CrossRef]
- Guo, T.; Wu, S.; Zhang, X.; Zhang, C.; Yang, J.; Cheng, S. Measurement and influencing factors of willingness to accept payment for ecosystem service provision: A case study of a leading forest farm in China. Forests 2023, 14, 2417. [Google Scholar] [CrossRef]
- He, L.; Guo, J.; Yang, W.; Jiang, Q.; Li, X.; Chen, S.; Zhang, M.; Li, D. Changes in vegetation in China’s drylands are closely related to afforestation compared with climate change. Sci. Total Environ. 2024, 912, 169121. [Google Scholar] [CrossRef]
- Kim, T.; Langpap, C. Agricultural landowners’ response to incentives for afforestation. Resour. Energy Econ. 2016, 43, 93–111. [Google Scholar] [CrossRef]
- Dang Do, T.; NaRanong, A. Livelihood and environmental impacts of payments for forest environmental services: A case study in Vietnam. Sustainability 2019, 11, 4165. [Google Scholar] [CrossRef]
- Li, Y.; Izlar, R.L. The forest land protection act program (FLPA) and conserving forestland in Georgia. For. Policy Econ. 2021, 124, 102399. [Google Scholar] [CrossRef]
- Kilgore, M.A.; Greene, J.L.; Jacobson, M.G.; Straka, T.J.; Daniels, S.E. The influence of financial incentive programs in promoting sustainable forestry on the nation’s family forests. J. For. 2007, 105, 184–191. [Google Scholar]
- Mitani, Y.; Lindhjem, H. Forest owners’ participation in voluntary biodiversity conservation: What does it take to forgo forestry for eternity? Land. Econ. 2015, 91, 235–251. [Google Scholar] [CrossRef]
- Langpap, C.; Kim, T. Literature review: An economic analysis of incentives for carbon sequestration on nonindustrial private forests (NIPFs). In Economic Modeling of Effects of Climate Change on the Forest Sector and Mitigation Options: A Compendium of Briefing Papers; Alig, R.J., Ed.; U.S. Department of Agriculture, Forest Service, Pacific Northwest Research Station: Portland, OR, USA, 2010; pp. 109–142. [Google Scholar]
- Gaodi, X.; Shuyan, C.; Chunxia, L.; Changshun, Z.; Yu, X. Current status and future trends for eco-compensation in China. J. Res. Ecol. 2015, 6, 355–362. [Google Scholar] [CrossRef]
- Ferraro, P.J.; Kiss, A. Direct payments to conserve biodiversity. Science 2002, 298, 1718–1719. [Google Scholar] [CrossRef] [PubMed]
- Grieg-Gran, M.; Porras, I.; Wunder, S. How can market mechanisms for forest environmental services help the poor? Preliminary lessons from Latin America. World Dev. 2005, 33, 1511–1527. [Google Scholar] [CrossRef]
- Grima, N.; Singh, S.J.; Smetschka, B.; Ringhofer, L. Payment for ecosystem services (PES) in Latin America: Analysing the performance of 40 case studies. Ecosyst. Serv. 2016, 17, 24–32. [Google Scholar] [CrossRef]
- Feng, D.; Liang, L.; Wu, W.; Li, C.; Wang, L.; Li, L.; Zhao, G. Factors influencing willingness to accept in the paddy land-to-dry land program based on contingent value method. J. Clean. Prod. 2018, 183, 392–402. [Google Scholar] [CrossRef]
- Chu, X.; Zhan, J.; Wang, C.; Hameeda, S.; Wang, X. Households’ willingness to accept improved ecosystem services and influencing factors: Application of contingent valuation method in Bashang Plateau, Hebei Province, China. J. Environ. Manag. 2020, 255, 109925. [Google Scholar] [CrossRef]
- Paudel, B.; Zhang, Y.L.; Li, S.C.; Liu, L.S.; Wu, X.; Khanal, N.R. Review of studies on land-use and land cover change in Nepal. J. Mt. Sci. 2016, 13, 643–660. [Google Scholar] [CrossRef]
- COFORD Land Availability Working Group. Land Availability for Afforestation: Exploring Opportunities for Expanding Ireland’s Forest Resource; COFORD, Department of Agriculture, Food and the Marine: Dublin, Ireland, 2016. [Google Scholar]
- Cooley, D.; Olander, L. Stacking ecosystem services payments: Risks and solutions. Envtl L Rep. News Anal. 2012, 42, 10150. [Google Scholar]
- Arrow, K.; Solow, R.; Portney, P.R.; Leamer, E.E.; Radner, R.; Schuman, H. Report of the NOAA panel on contingent valuation. Fed. Regist. 1993, 58, 4601–4614. [Google Scholar]
- Diamond, P.A.; Hausman, J.A. On contingent valuation measurement of nonuse values. Contingent valuation: A Critical Assessment. Contrib. Econ. Anal. 1993, 3, 3–38. [Google Scholar]
- Carson, R.T.; Hanemann, W.M. Contingent valuation. Handb. Environ. Econ. 2005, 2, 821–936. [Google Scholar]
- Cook, D.; Eiríksdóttir, K.; Davíðsdóttir, B.; Kristófersson, D.M. The contingent valuation study of Heiðmörk, Iceland–Willingness to pay for its preservation. J. Environ. Manag. 2018, 209, 126–138. [Google Scholar] [CrossRef] [PubMed]
- Riera, P.; Signorello, G.; Thiene, M.; Mahieu, P.A.; Navrud, S.; Kaval, P.; Rulleau, B.; Mavsar, R.; Madureira, L.; Meyerhoff, J.; et al. Non-market valuation of forest goods and services: Good practice guidelines. J. For. Econ. 2012, 18, 259–270. [Google Scholar] [CrossRef]
- Amigues, J.P.; Boulatoff, C.; Desaigues, B.; Gauthier, C.; Keith, J.E. The benefits and costs of riparian analysis habitat preservation: A willingness to accept/willingness to pay contingent valuation approach. Ecol. Econ. 2002, 43, 17–31. [Google Scholar] [CrossRef]
- Tang, J.; Xin, M.; Wang, X. Herdsmen’s willingness to accept compensation for grazing ban compliance: Empirical evidence from pastoral China. J. Clean. Prod. 2022, 361, 132102. [Google Scholar] [CrossRef]
- Bhat, M.Y.; Sinha, A. Willingness to pay for preserving national park biodiversity: A case study. Economy 2016, 3, 102–107. [Google Scholar] [CrossRef]
- Xiong, K.; Kong, F. The analysis of farmers’ willingness to accept and its influencing factors for ecological compensation of Poyang Lake wetland. Procedia Eng. 2017, 174, 835–842. [Google Scholar] [CrossRef]
- Duan, B.; Huang, L.; Ban, J.; Bi, J. Evaluating the non-use value of biodiversity of the Hongze Lake Watershed. China Environ. Sci. 2010, 30, 1135–1141. [Google Scholar]
- Acharya, R.P.; Maraseni, T.N.; Cockfield, G. Local users and other stakeholders’ perceptions of the identification and prioritization of ecosystem services in fragile mountains: A case study of Chure region of Nepal. Forests 2019, 10, 421. [Google Scholar] [CrossRef]
- Bishwokarma, D.; Thing, S.J.; Paudel, N.S. Political ecology of the Chure region in Nepal. J. For. Livelihood 2016, 14, 84–96. [Google Scholar] [CrossRef]
- Rayamajhi, S.; Pokharel, R.K.; Tiwari, K.R.; Heyojoo, B.P.; Chhetri, B.B.K.; Kandel, P.N. An assessment of the President Chure-Tarai Madhesh Conservation Development Program. For. J. Inst. For. Nepal. 2019, 16, 101–110. [Google Scholar] [CrossRef]
- Oli, B.N. Pro-poor leasehold forestry in Nepal: A new dimension on livelihoods. Regional workshop on pro-poor leasehold forestry. In Workshop Proceedings; Department of Forest: Kathmandu, Nepal, 2014; pp. 53–66. [Google Scholar]
- Bhandari, B.P.; Dhakal, S. A multidisciplinary approach of landslide characterization: A case of the Siwalik zone of Nepal Himalaya. J. Asian Earth Sci. 2021, 5, 100061. [Google Scholar] [CrossRef]
- Paudel, P.K.; Bhattarai, B.P.; Kindlmann, P. An overview of the biodiversity in Nepal. In Himalayan Biodiversity in the Changing World; Springer: Dordrecht, The Netherland, 2011; pp. 1–40. [Google Scholar]
- Paudyal, D. Pro-poor leasehold forestry in Nepal: Voices from Nawalparasi. Regional workshop on pro-poor leasehold forestry. In Workshop Proceedings; Department of Forest: Kathmandu, Nepal, 2014; pp. 67–75. [Google Scholar]
- Pokhrel, K.P. Chure forestry conservation and management plan: A case study of Arghakhanchi district, Nepal. J. Geogr. Reg. Plann 2013, 6, 172. [Google Scholar] [CrossRef]
- Wright, W.C.; Eppink, F.V.; Greenhalgh, S. Are ecosystem service studies presenting the right information for decision making? Ecosyst. Serv. 2017, 25, 128–139. [Google Scholar] [CrossRef]
- Calow, P. The importance of money as a common currency in ecosystem service valuation-A comment on the Roskilde workshop recommendations for risk assessment. Environ. Toxicol. Chem. 2017, 36, 866. [Google Scholar] [CrossRef]
- Chaudhary, S.; Wang, Y.; Dixit, A.M.; Khanal, N.R.; Xu, P.; Fu, B.; Yan, K.; Liu, Q.; Lu, Y.; Li, M. A Synopsis of Farmland Abandonment and Its Driving Factors in Nepal. Land 2020, 9, 84. [Google Scholar] [CrossRef]
- Grasso, A.C.; Hung, Y.; Olthof, M.R.; Verbeke, W.; Brouwer, I.A. Older consumers’ readiness to accept alternative, more sustainable protein sources in the European Union. Nutrients 2019, 11, 1904. [Google Scholar] [CrossRef]
- Bulut, O.D.; Karaman, S.; Çelik Kaysim, Z.; Karadağ Gürsoy, A. Factors affecting landowners’ willingness to sustain hiring foreign farmworkers: The case of banana producers in Mersin province, Turkey. Sustainability 2023, 15, 13066. [Google Scholar] [CrossRef]
- Ataman, M.G.; Sarıyer, G. Predicting waiting and treatment times in emergency departments using ordinal logistic regression models. Am. J. Emerg. Med. 2021, 46, 45–50. [Google Scholar] [CrossRef] [PubMed]
- Boxall, P.C.; Adamowicz, W.L.; Swait, J.; Williams, M.; Louviere, J. A comparison of stated preference methods for environmental valuation. Ecol. Econ. 1996, 18, 243–253. [Google Scholar] [CrossRef]
- Abdullah, S.; Jeanty, P.W. Willingness to pay for renewable energy: Evidence from a contingent valuation survey in Kenya. Renew. Sustain. Energy Rev. 2011, 15, 2974–2983. [Google Scholar] [CrossRef]
- Kreye, M.M.; Pienaar, E.F.; Soto, J.R.; Adams, D.C. Creating voluntary payment programs: Effective program design and ranchers’ willingness to conserve Florida panther habitat. Land. Econ. 2017, 93, 459–480. [Google Scholar] [CrossRef]
- Mitchell, R.C.; Carson, R.T. Using Surveys to Value Public Goods: The Contingent Valuation Method, 1st ed.; Rff Press: New York, NY, USA, 2013. [Google Scholar]
- Soto, J.R.; Adams, D.C.; Escobedo, F.J. Landowner attitudes and willingness to accept compensation from forest carbon offsets: Application of best–worst choice modeling in Florida USA. For. Pol. Econ. 2016, 63, 35–42. [Google Scholar] [CrossRef]
- Bhandari, P.; Mohan, K.C.; Shrestha, S.; Aryal, A.; Shrestha, U.B. Assessments of ecosystem service indicators and stakeholder’s willingness to pay for selected ecosystem services in the Chure region of Nepal. Appl. Geogr. 2016, 69, 25–34. [Google Scholar] [CrossRef]
- Pagiola, S.; Honey-Rosés, J.; Freire-González, J. Evaluation of the permanence of land-use change induced by payments for environmental services in Quindío, Colombia. PLoS ONE 2016, 11, e0147829. [Google Scholar] [CrossRef]
- Pathak, S.; Panta, H.K.; Bhandari, T.; Paudel, K.P. Flood vulnerability and its influencing factors. Nat. Hazards 2020, 104, 2175–2196. [Google Scholar] [CrossRef]
- Pathak, B.R.; Yi, X.; Bohara, R. Community based forestry in Nepal: Status, issues and lessons learned. Int. J. Sci. 2017, 6, 119–129. [Google Scholar] [CrossRef]
- Meli, P.; Rey-Benayas, J.M.; Brancalion, P.H. Balancing land sharing and sparing approaches to promote forest and landscape restoration in agricultural landscapes: Land approaches for forest landscape restoration. Perspect. Ecol. Conserv. 2019, 17, 201–205. [Google Scholar] [CrossRef]
- Poudel, S.; Bhattarai, S.; Regmi, S.; Gautam, D. Assessment of factors affecting willingness to pay/accept: A study from Begnas watershed, Nepal. Int. J. Environ. 2021, 10, 1–15. [Google Scholar] [CrossRef]
- Rai, R.K.; Nepal, M.; Karky, B.S.; Timalsina, N.; Khadayat, M.S.; Bhattarai, N. Opportunity costs of forest conservation in Nepal. Front. For. Glob. Change 2022, 5, 857145. [Google Scholar] [CrossRef]
- KC, A.; Koirala, I.; Adhikari, N. Cost-Benefit Analysis of a Community Forest in Nepal. J. Sustain. For. 2015, 34, 199–213. [Google Scholar]
- Jiang, H.Y.; Wen, Y.L. Study on peasants’ willingness to accept and its influential factor around wetland based on WTA. REYB 2011, 20, 489–494. [Google Scholar]
- Mutandwa, E.; Grala, R.K.; Petrolia, D.R. Estimates of willingness to accept compensation to manage pine stands for ecosystem services. For. Pol. Econ. 2019, 102, 75–85. [Google Scholar] [CrossRef]


| Category of Questionnaires (Q) | Contents |
|---|---|
| Basic socioeconomic situation (Q1–Q3) Household situation (Q4–Q10) | Gender, Age (group), and Education Level |
| Main income source, number of family members, manpower for farming (family members engaged in farming), household’s average monthly income, land holding, crop production sufficiency, and irrigational water accessibility | |
| Attitude and awareness of the local environment (Q11–Q16) | Risk level (of farming land), engagement in local resource management, environmental degradation level, importance of forest to environmental degradation, needs of forest resources, and satisfaction level of forest resource accessibility |
| Willingness to accept afforestation in farmland (Q17) | If yes (willing to accept afforestation) a. The bid values of minimum acceptable compensation (NPR) b. The bid values of maximum acceptable farmland size (Kattha) to implement afforestation |
| If no (not willing to accept afforestation) Reasons (multiple choices): i. lack of information; ii. payment options are too low; iii. distrust system (I do not trust that payment will be made smoothly, even if it will be implemented); and iv. no need to change (current land-use practices) |
| Variables (Symbol) | Measure | Description | Min. | Max. | Mean | Std. D. |
|---|---|---|---|---|---|---|
| Gender | Nominal | 0 = Female, 1 = Male | 0 | 1 | 0.6 | 0.4 |
| Age | Continuous | Years | 21.5 | 70.5 | 40.6 | 11.8 |
| Education level 1 (ED) | Ordinal | 1 = Uneducated (no former education), 2 = Primary, 3 = Secondary, 4 = Senior high school 1 | 1 | 4 | 1.9 | 0.9 |
| Main income source (IS) | Nominal | 0 = Off-farming, 1 = Farming | 0 | 1 | 0.3 | 0.4 |
| Number of family members (FM) | Continuous | Persons | 2 | 15 | 6.21 | 2.5 |
| Manpower for farming (MF) | Continuous | Persons | 0 | 9 | 3.2 | 1.5 |
| Households’ average monthly income (MI) | Continuous | Nepalese Rupees (NPR) | 10,000 | 150,000 | 19,267.2 | 15,622.0 |
| Land holding (in Kattha) (LH) | Continuous | Kattha (1 Kattha = 0.0126 hectare) | 1.5 | 60.0 | 12.0 | 9.2 |
| Crop production sufficiency (CPS) | Nominal | 0 = Not sufficient, 1 = Sufficient | 0 | 1 | 0.2 | 0.4 |
| Irrigational water accessibility (IWA) | Ordinal | 1 = Very poor, 2 = Relatively poor, 3 = Fair, 4 = Good | 1 | 4 | 2.4 | 1.1 |
| Risk level (RL) | Ordinal | 1 = Very low, 2 = Relatively low, 3 = Medium, 4 = Relatively high, 5 = Very high | 1 | 5 | 2.9 | 1.3 |
| Engagement in local resource management (ELRM) | Nominal | 0 = Not engaged, 1 = Engaged | 0 | 1 | 0.3 | 0.4 |
| Environmental degradation level (EDL) | Ordinal | 1 = Very low, 2 = Relatively low, 3 = Medium, 4 = Relatively high, 5 = Very high | 1 | 5 | 3.7 | 1.1 |
| Importance of forest for environmental degradation (IFED) | Ordinal | 1 = Very unimportant, 2 = Relatively unimportant, 3 = Neutral, 4 = Relatively important, 5 = Very important | 1 | 5 | 3.8 | 1.2 |
| Needs of forest resources (NS) | Ordinal | 1 = Only daily household, 2 = Daily household and income source, 3 = Daily household, income source, and cultural, 4 = Daily household, income source, cultural, and beauty | 1 | 4 | 2.5 | 0.7 |
| Satisfaction level of forest resource accessibility (SL) | Ordinal | 1 = Very unsatisfied, 2 = Relatively unsatisfied, 3 = Relatively satisfied, 4 = Very satisfied | 1 | 4 | 2.5 | 0.8 |
| Compensation (NPR 1/Year/Kattha) | Number of Respondents | Proportion (%) | |
|---|---|---|---|
| WTA = 1 | 500 | 28 | 12.1 |
| 1000 | 53 | 22.8 | |
| 2000 | 50 | 21.6 | |
| 3000 | 14 | 6.0 | |
| 4000 | 5 | 2.2 | |
| 5000 | 13 | 5.6 | |
| WTA = 0 | 0 | 69 | 29.7 |
| Total | 232 | 100 | |
| Acceptable | 163 | 70.3 | |
| Unacceptable | 69 | 29.7 |
| Land (in Kattha 1/Household) | Number of Respondents | Proportion (%) | |
|---|---|---|---|
| WTA = 1 | >0–5 | 132 | 56.9 |
| >5–10 | 26 | 11.2 | |
| >10–15 | 2 | 0.9 | |
| >15–20 | 2 | 0.9 | |
| >20–25 | 0 | 0 | |
| >25 | 1 | 0.4 | |
| WTA = 0 | 0 | 69 | 29.7 |
| Total | 232 | 100 | |
| Acceptable | 163 | 70.3 | |
| Unacceptable | 69 | 29.7 |
| Test Model Evaluation | −2 Log Likelihood | Chi-Square | df | p Value |
|---|---|---|---|---|
| Model fitting information | (Final) 452.855 | 141.833 | 16 | 0.000 |
| Goodness-of-fit: | ||||
| Pearson | 612.206 | 677 | 0.964 | |
| Deviance | 452.855 | 677 | 1.000 | |
| Cox and Snell R2 = 0.457; Nagelkerke R2 = 0.496; McFadden R2 = 0.238. | ||||
| Test Model Evaluation | −2 Log Likelihood | Chi-Square | df | p Value |
|---|---|---|---|---|
| Model fitting information | (Final) 278.080 | 182.645 | 16 | 0.000 |
| Goodness-of-fit: | ||||
| Pearson | 677.846 | 677 | 0.592 | |
| Deviance | 278.080 | 677 | 1.000 | |
| Cox and Snell R2 = 0.545; Nagelkerke R2 = 0.632; McFadden R2 = 0.396. | ||||
| Variables | Estimate | Std. Error | Wald | Sig. (p) | Exp (β) |
|---|---|---|---|---|---|
| [Gender = female] | −0.024 | 0.290 | 0.007 | 0.935 | 0.977 |
| [Gender = male] | 0 a | - | - | - | - |
| Age | 0.002 | 0.014 | 0.020 | 0.887 | 1.002 |
| ED | −0.370 ** | 0.178 | 4.339 | 0.037 | 0.691 ** |
| [IS = off-farming ] | 0.143 | 0.312 | 0.211 | 0.646 | 1.154 |
| [IS = farming] | 0 a | - | - | - | - |
| FM | 0.056 | 0.061 | 0.830 | 0.362 | 1.058 |
| MF | −0.026 | 0.105 | 0.061 | 0805 | 0.974 |
| MI | 1.346 × 10⁻⁶ | 9.263 × 10⁻⁶ | 0.021 | 0.885 | 1.000 |
| LH | 0.001 | 0.015 | 0.002 | 0.962 | 1.001 |
| [CPS = not sufficient] | −2.745 *** | 0.381 | 51.951 | 0.000 | 0.064 *** |
| [CPS = sufficient] | 0 a | - | - | - | - |
| IWA | −0.154 | 0.132 | 1.365 | 0.234 | 0.857 |
| RL | 0.451 *** | 0.123 | 13.510 | 0.000 | 1.570 *** |
| [ELRM = not engaged] | −0.826 *** | 0.303 | 7.406 | 0.007 | 0.438 *** |
| [ELRM = engaged] | 0 a | - | - | - | - |
| EDL | 0.293 ** | 0.142 | 4.243 | 0.039 | 1.340 ** |
| IFED | 0.368 *** | 0.129 | 8.151 | 0.004 | 1.444 *** |
| NF | 0.038 | 0.204 | 0.035 | 0.853 | 1.039 |
| SL | −0.293 * | 0.171 | 2.930 | 0.087 | 0.746 * |
| Variables | Estimate | Std. Error | Wald | Sig. (p) | Exp (β) |
|---|---|---|---|---|---|
| [Gender = female] | −0.475 | 0.362 | 1.723 | 0.189 | 0.622 |
| [Gender = male] | 0 a | - | - | - | - |
| Age | 0.009 | 0.017 | 0.325 | 0.568 | 1.009 |
| ED | −0.162 | 0.215 | 0.571 | 0.450 | 0.850 |
| [IS = off-farming ] | −0.036 | 0.380 | 0.009 | 0.925 | 0.965 |
| [IS = farming] | 0 a | - | - | - | - |
| FM | 0.108 | 0.076 | 2.024 | 0.155 | 1.114 |
| MF | −0.032 | 0.124 | 0.065 | 0.799 | 0.969 |
| MI | 3.190 × 10⁻⁶ | 1.093 × 10⁻⁵ | 0.085 | 0.770 | 1.000 |
| LH | 0.077 *** | 0.018 | 18.830 | 0.000 | 1.080 *** |
| [CPS = not sufficient] | −1.456 *** | 0.415 | 12.290 | 0.000 | 0.233 *** |
| [CPS = sufficient] | 0 a | - | - | - | - |
| IWA | 0.065 | 0.158 | 0.170 | 0.680 | 1.067 |
| RL | 0.512 *** | 0.154 | 11.067 | 0.001 | 1.668 *** |
| [ELRM = not engaged] | −1.073 *** | 0.375 | 8.177 | 0.004 | 0.341 *** |
| [ELRM = engaged] | 0 a | - | - | - | - |
| EDL | 0.869 *** | 0.186 | 21.710 | 0.000 | 2.383 *** |
| IFED | 0.572 *** | 0.158 | 13.086 | 0.000 | 1.771 *** |
| NF | 0.066 | 0.246 | 0.071 | 0.790 | 1.068 |
| SL | −0.903 *** | 0.221 | 16.767 | 0.000 | 0.405 *** |
Disclaimer/Publisher’s Note: The statements, opinions and data contained in all publications are solely those of the individual author(s) and contributor(s) and not of MDPI and/or the editor(s). MDPI and/or the editor(s) disclaim responsibility for any injury to people or property resulting from any ideas, methods, instructions or products referred to in the content. |
© 2024 by the authors. Licensee MDPI, Basel, Switzerland. This article is an open access article distributed under the terms and conditions of the Creative Commons Attribution (CC BY) license (https://creativecommons.org/licenses/by/4.0/).
Share and Cite
Karki, S.; Yokota, S. Farmers’ Willingness to Accept Afforestation in Farming Land and Its Influencing Factors in Fragile Landscapes Based on the Contingent Valuation Method. Forests 2024, 15, 1742. https://doi.org/10.3390/f15101742
Karki S, Yokota S. Farmers’ Willingness to Accept Afforestation in Farming Land and Its Influencing Factors in Fragile Landscapes Based on the Contingent Valuation Method. Forests. 2024; 15(10):1742. https://doi.org/10.3390/f15101742
Chicago/Turabian StyleKarki, Sharada, and Shigehiro Yokota. 2024. "Farmers’ Willingness to Accept Afforestation in Farming Land and Its Influencing Factors in Fragile Landscapes Based on the Contingent Valuation Method" Forests 15, no. 10: 1742. https://doi.org/10.3390/f15101742