Study on Nondestructive Detection Imaging Method of Log Knot Based on Judging the Shortest Path of Stress Wave Propagation
Abstract
1. Introduction
2. Materials and Methods
2.1. Testing Materials
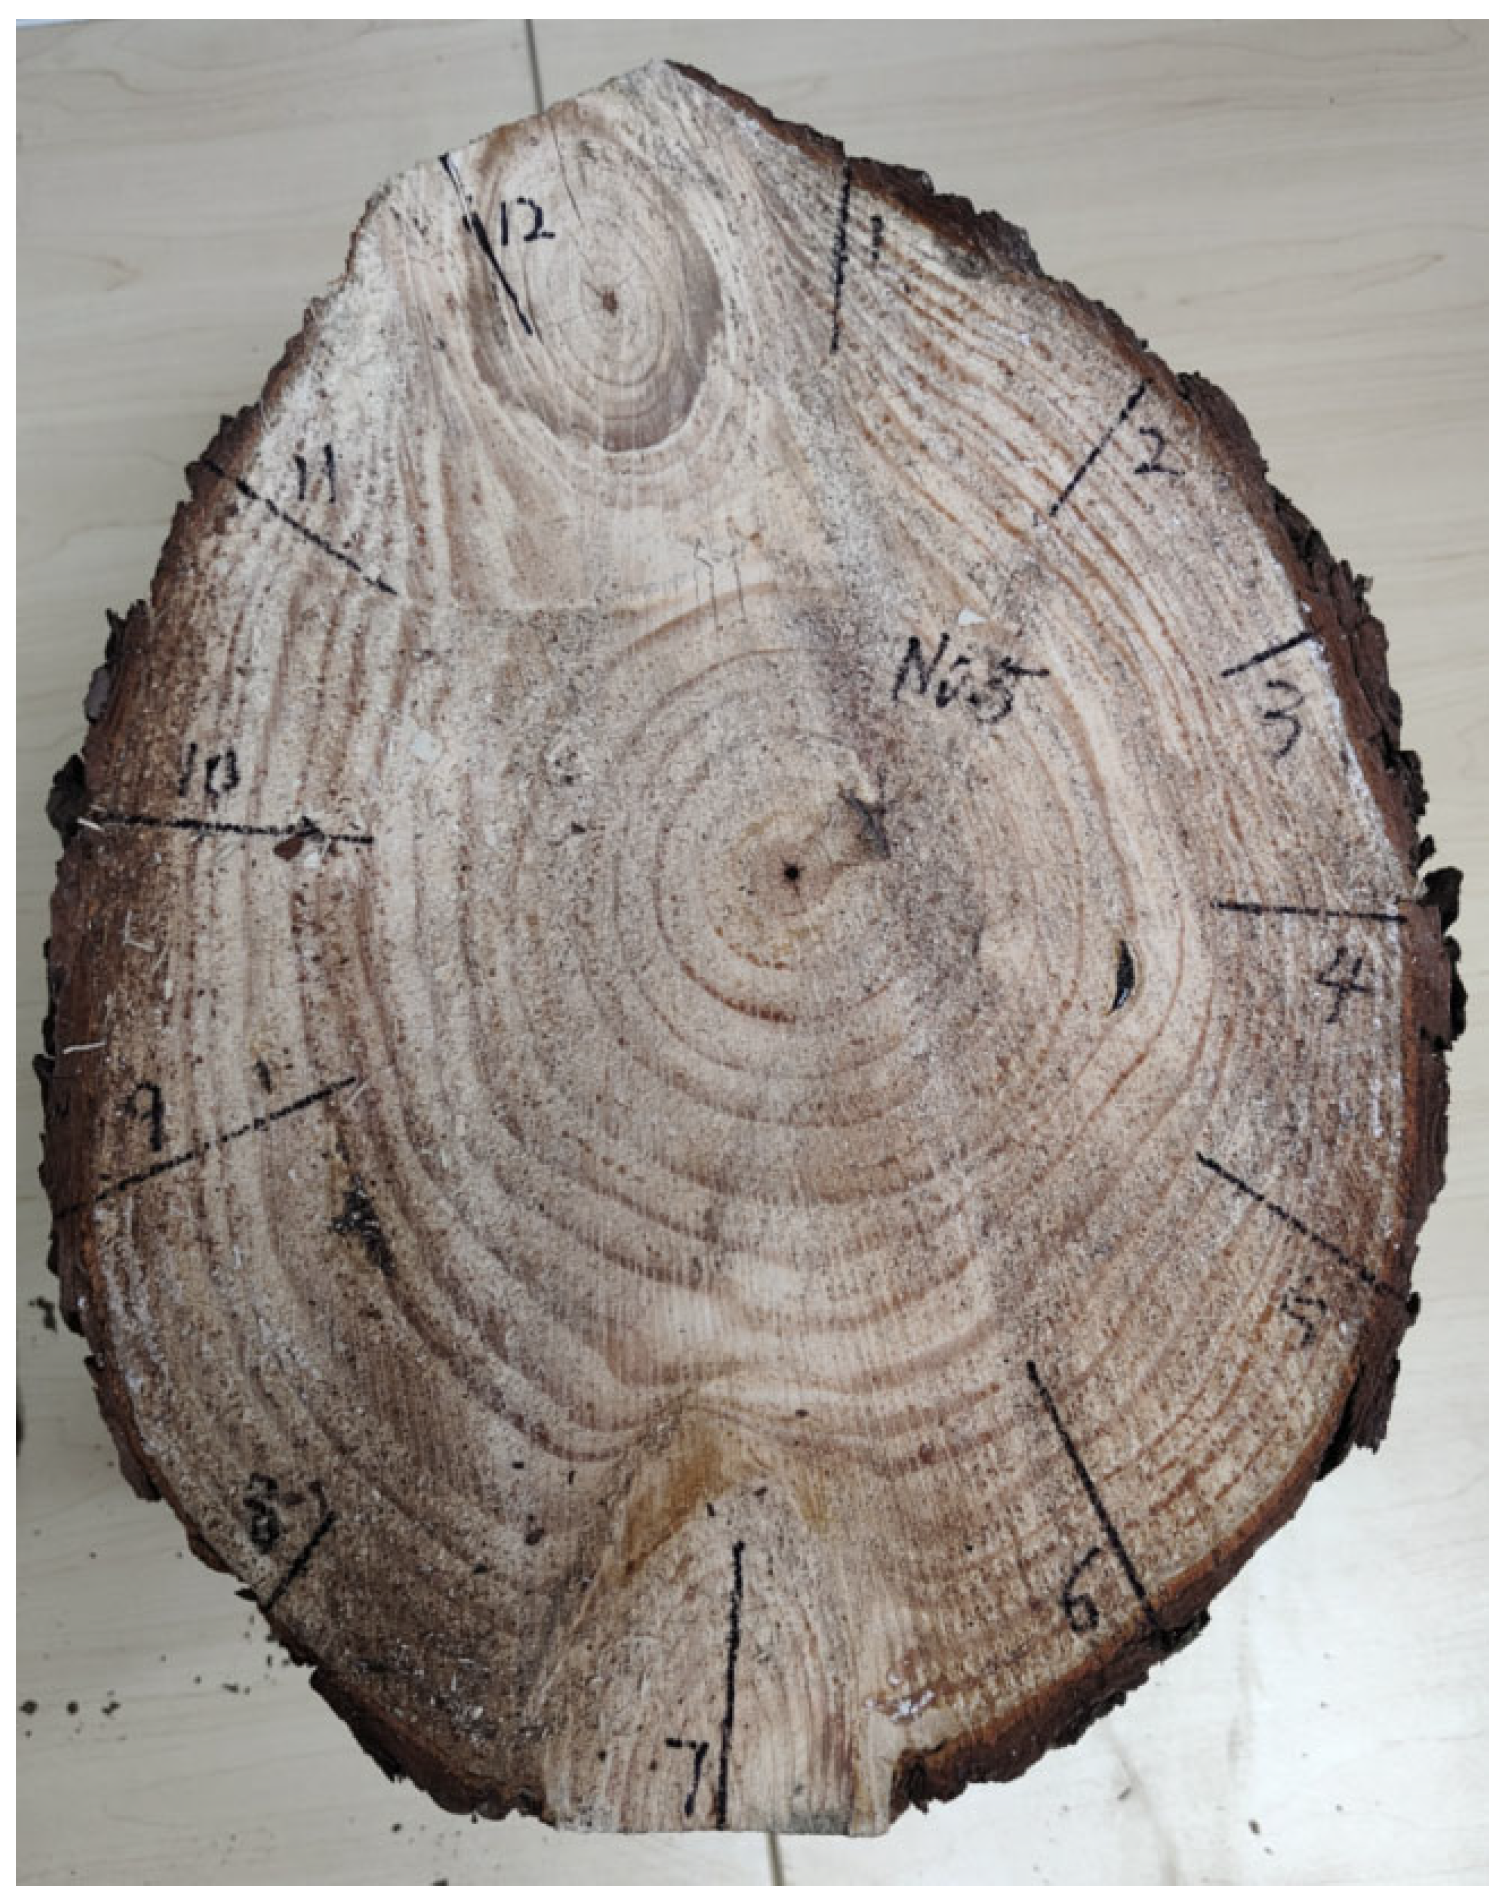
2.2. Test Method
2.2.1. Measurement Method of Stress Wave in Cross Section of Test Log
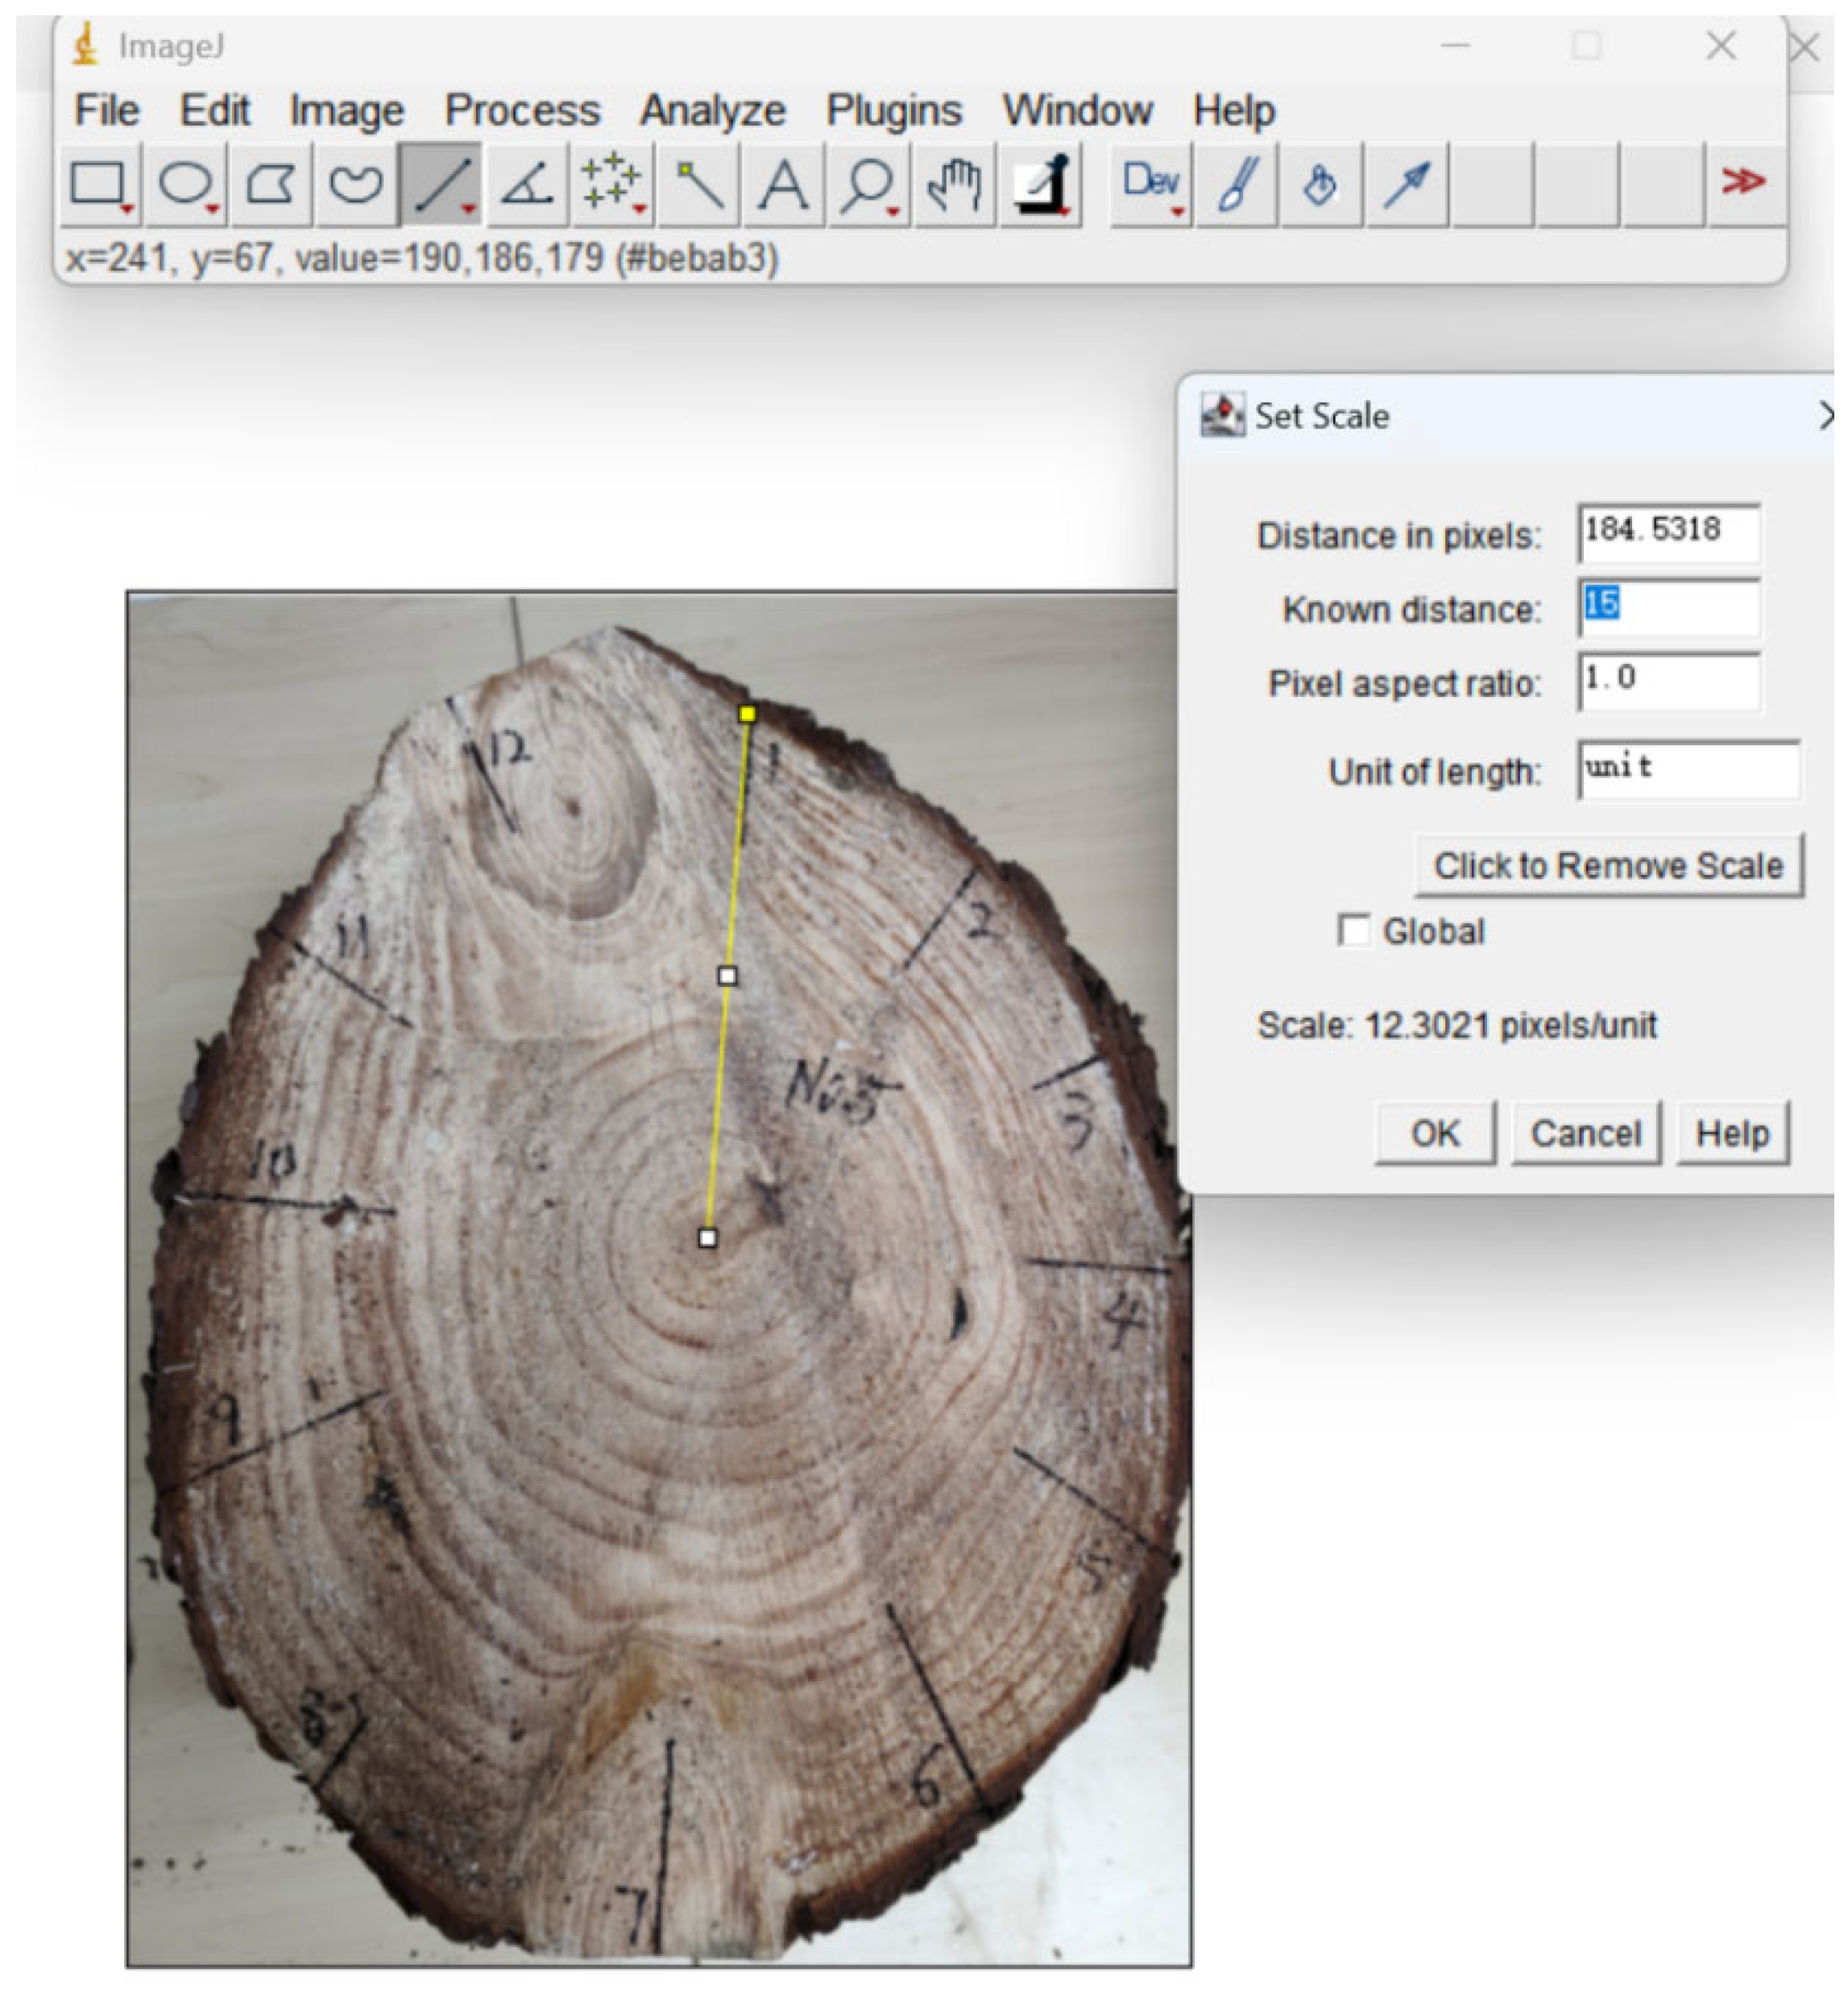
2.2.2. Calculation Method of Actual Area of Log Cross Section and Section
2.3. Algorithm Steps
- (a)
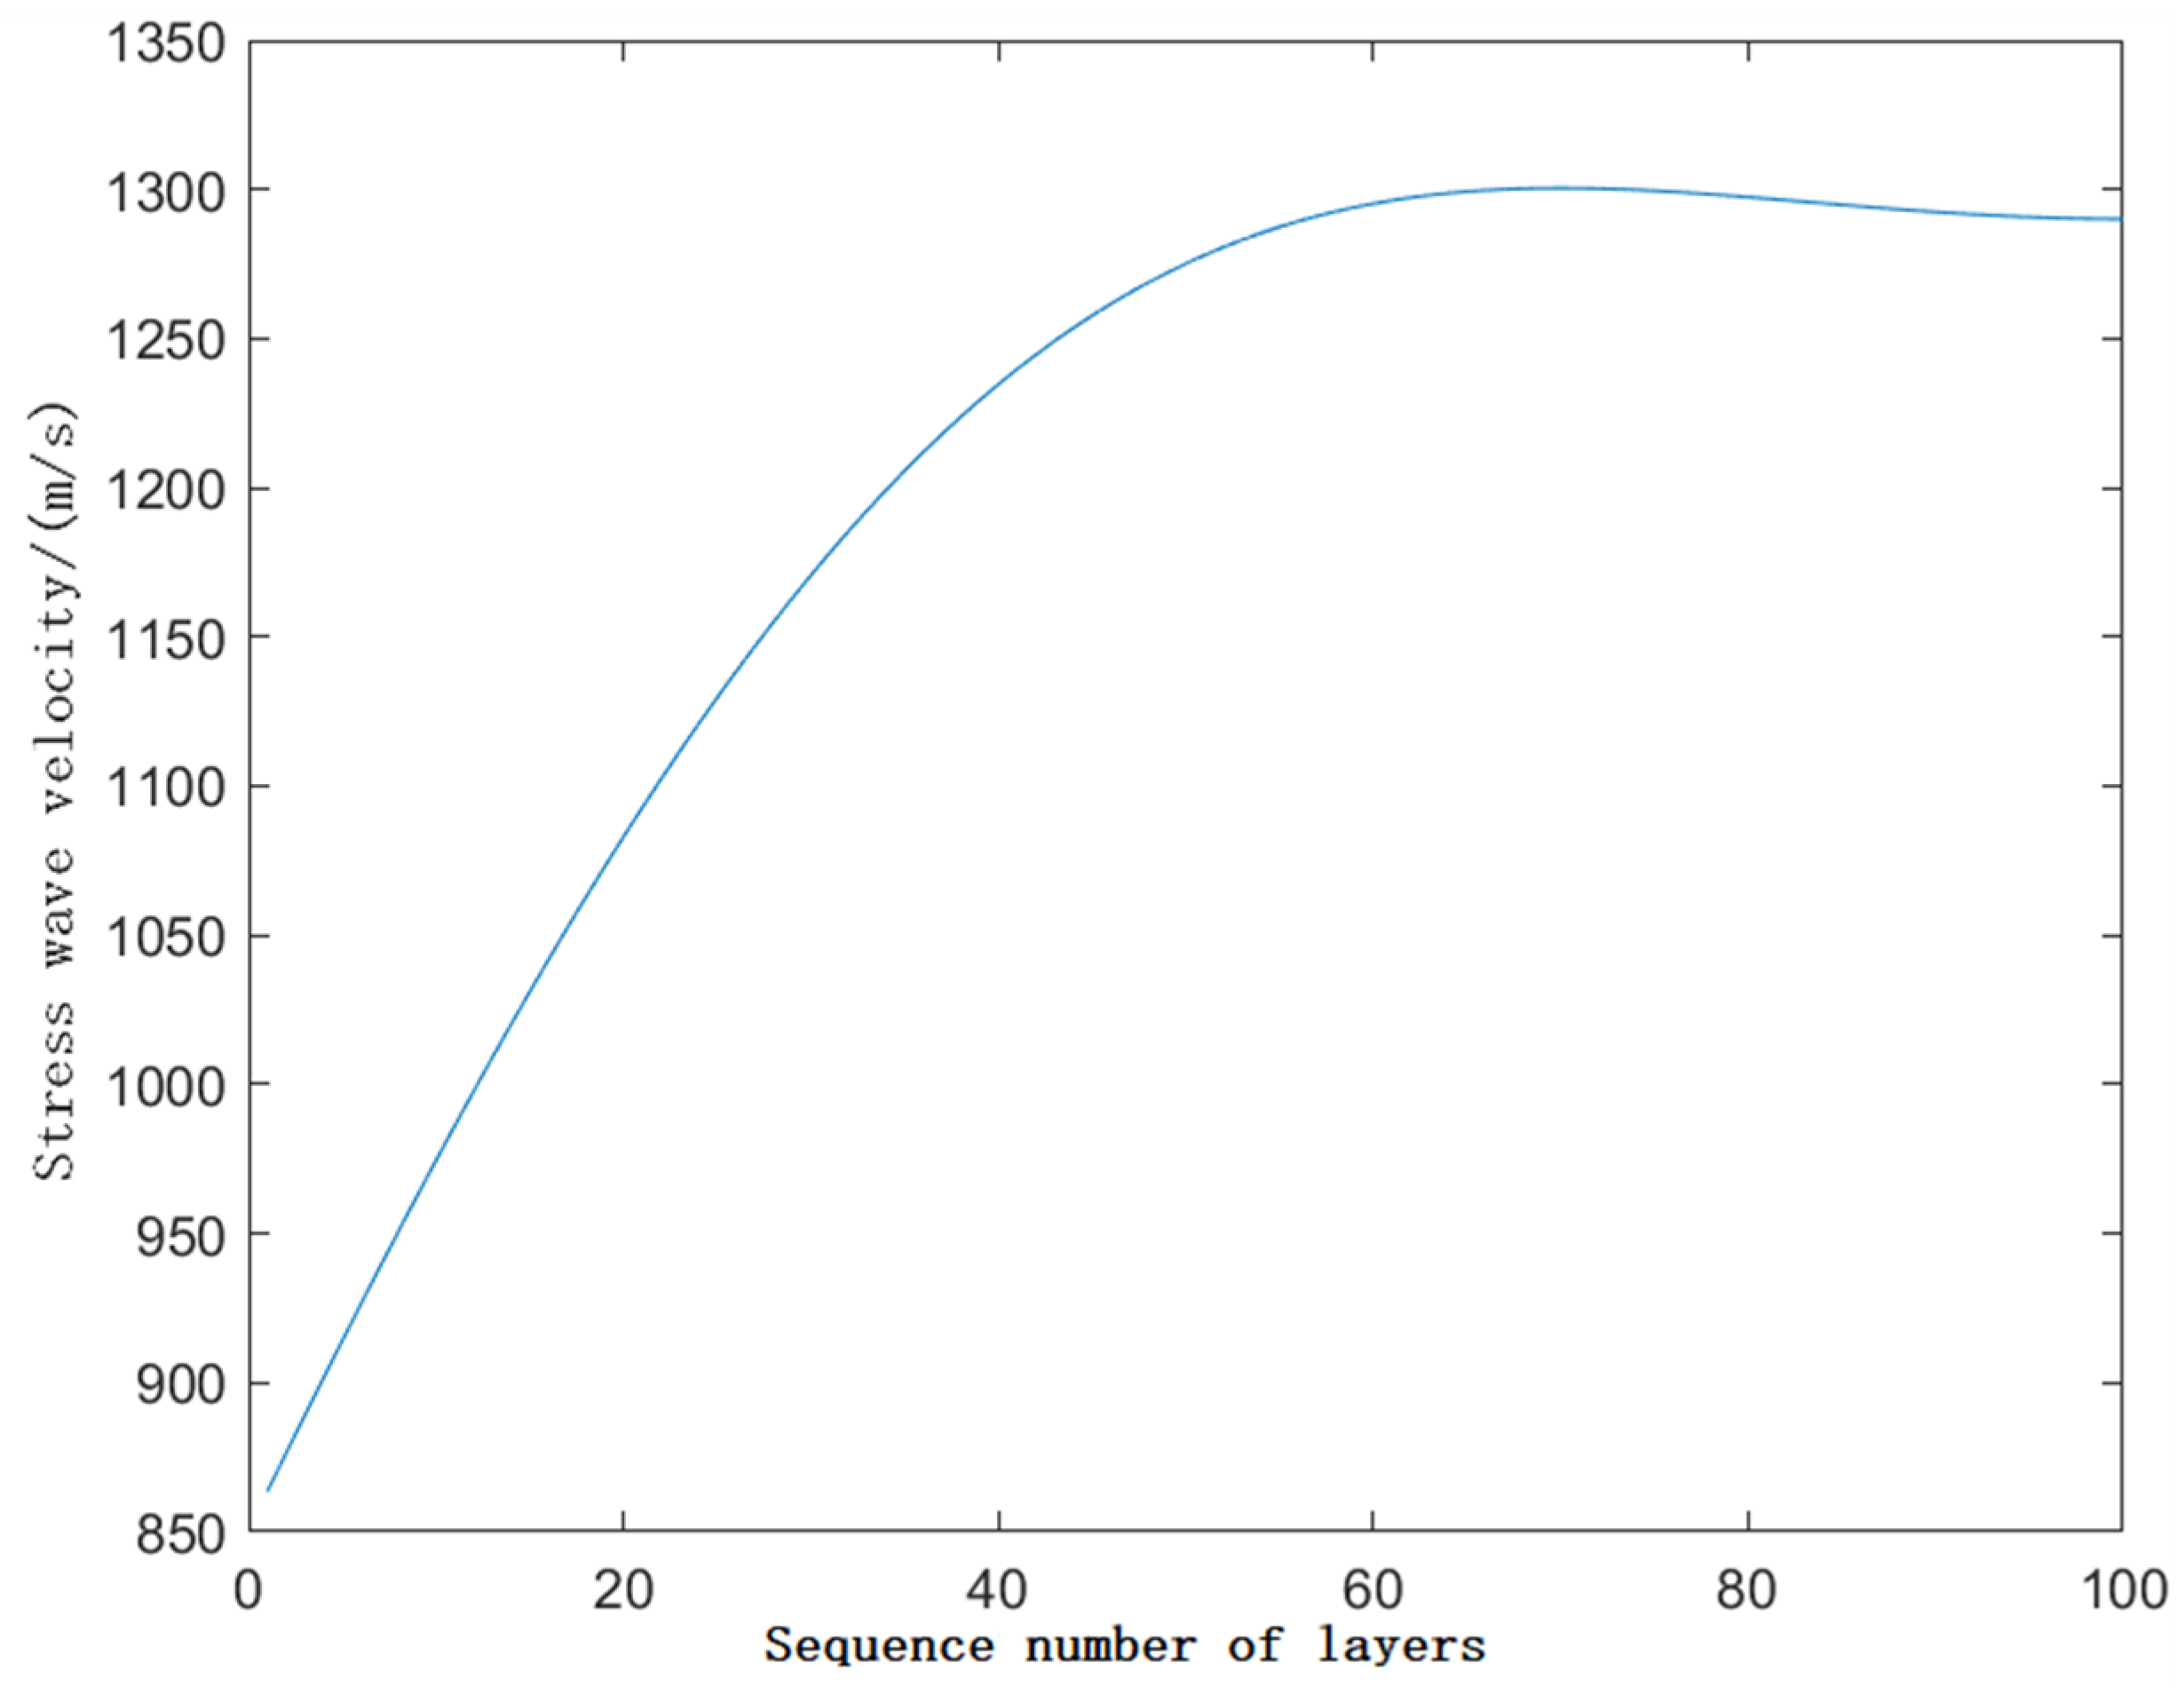
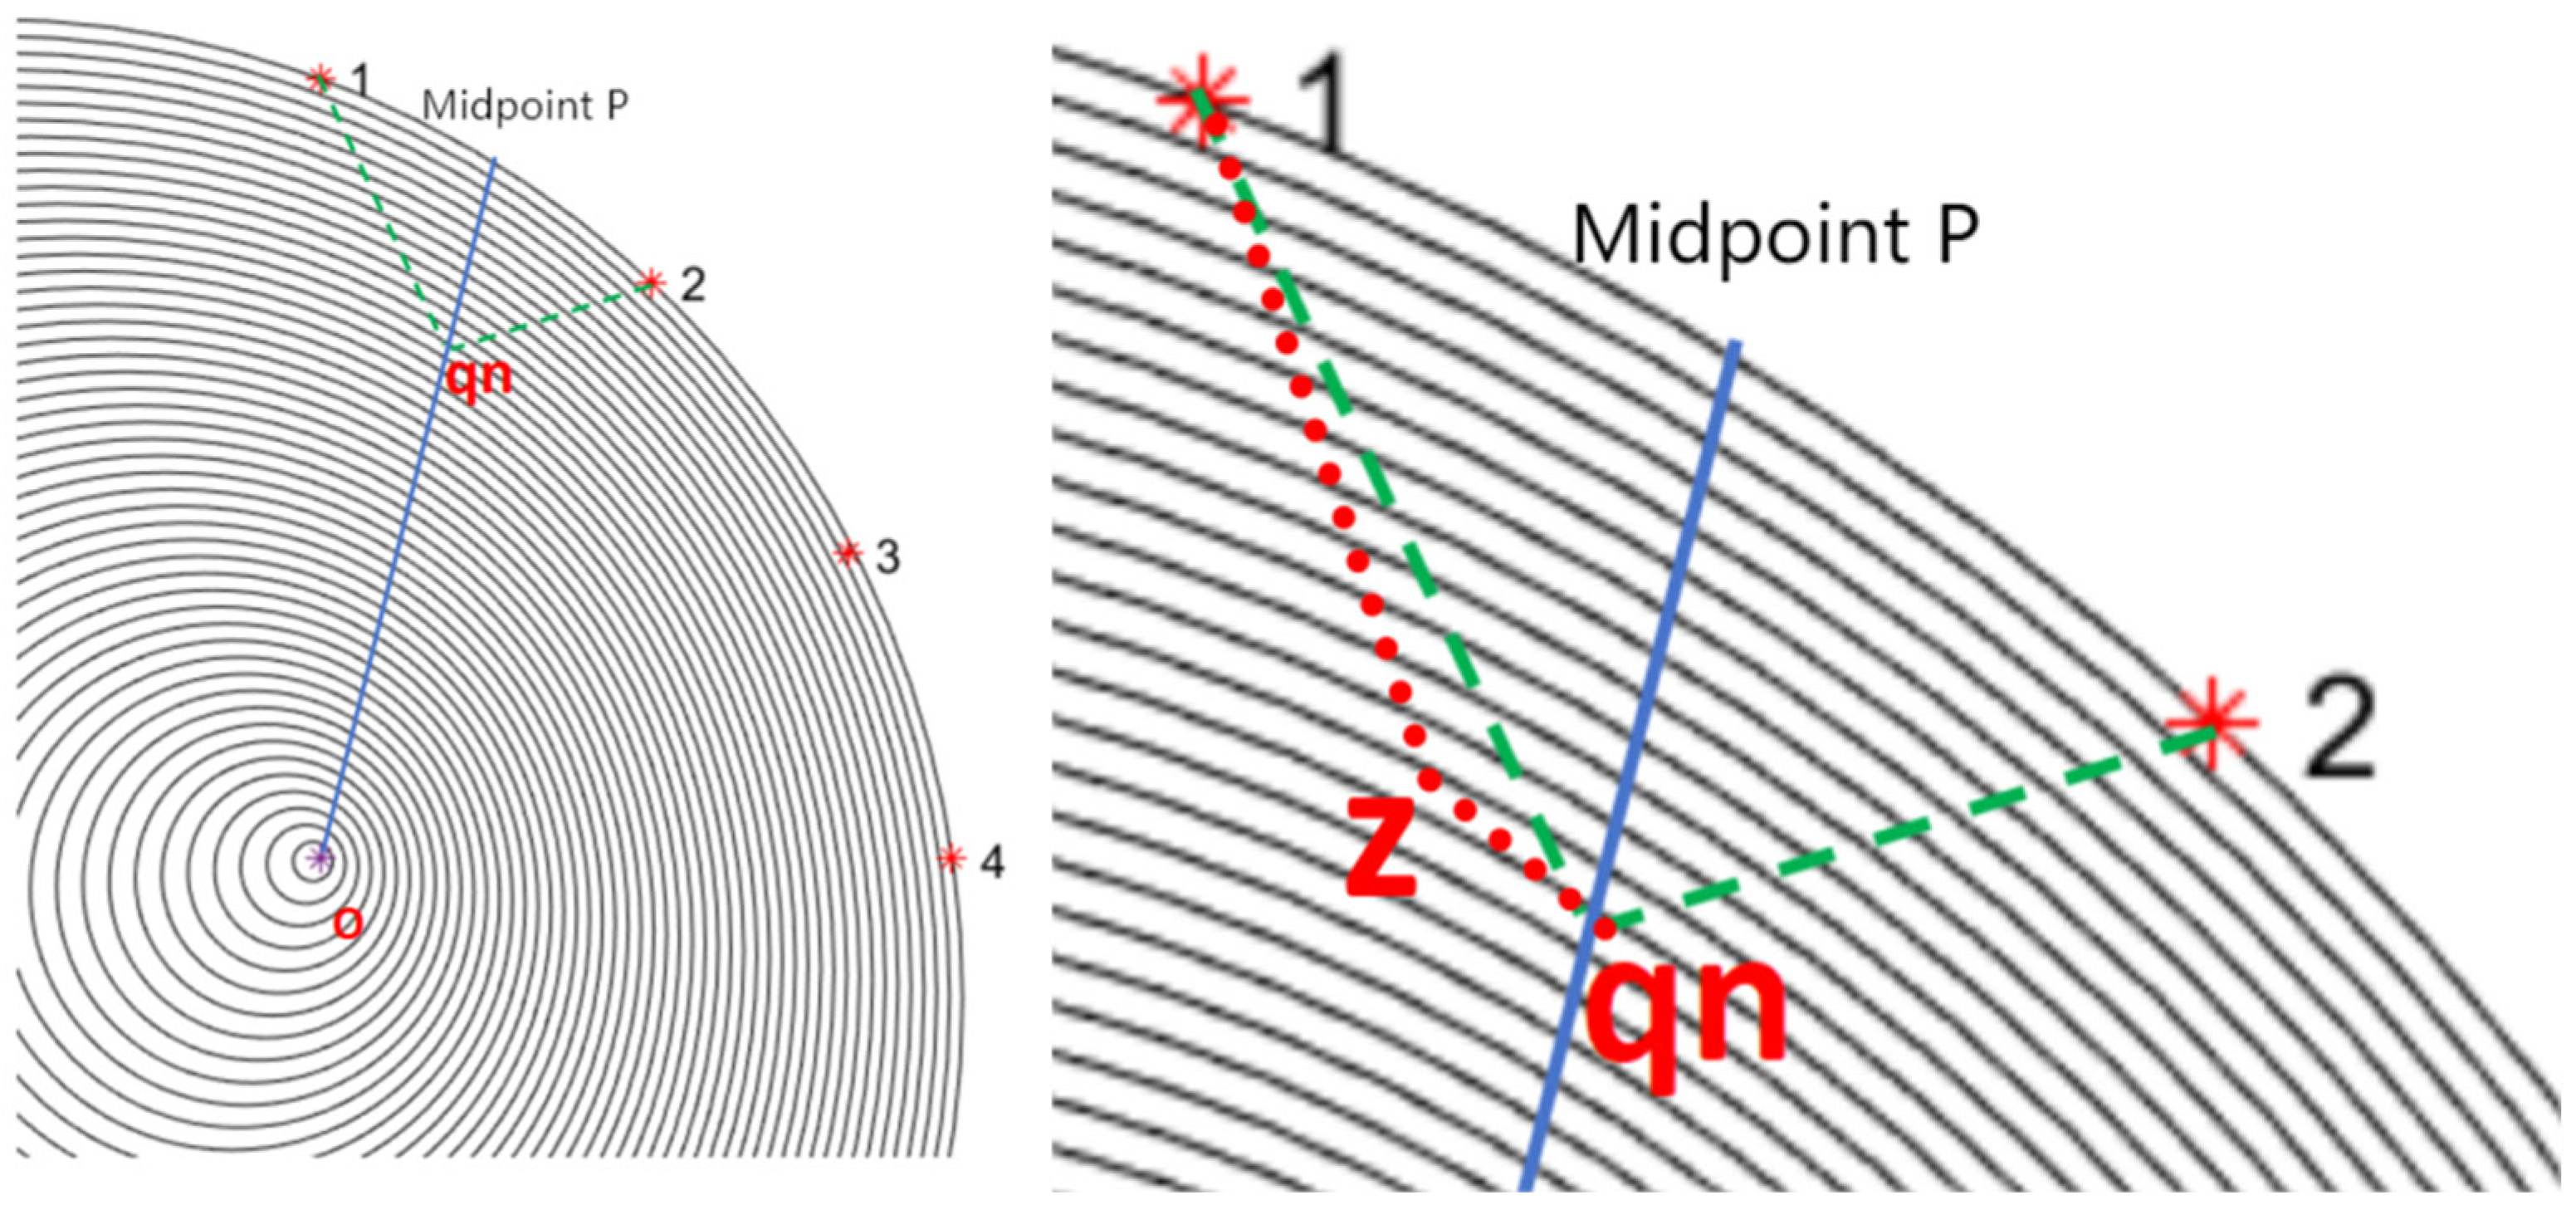
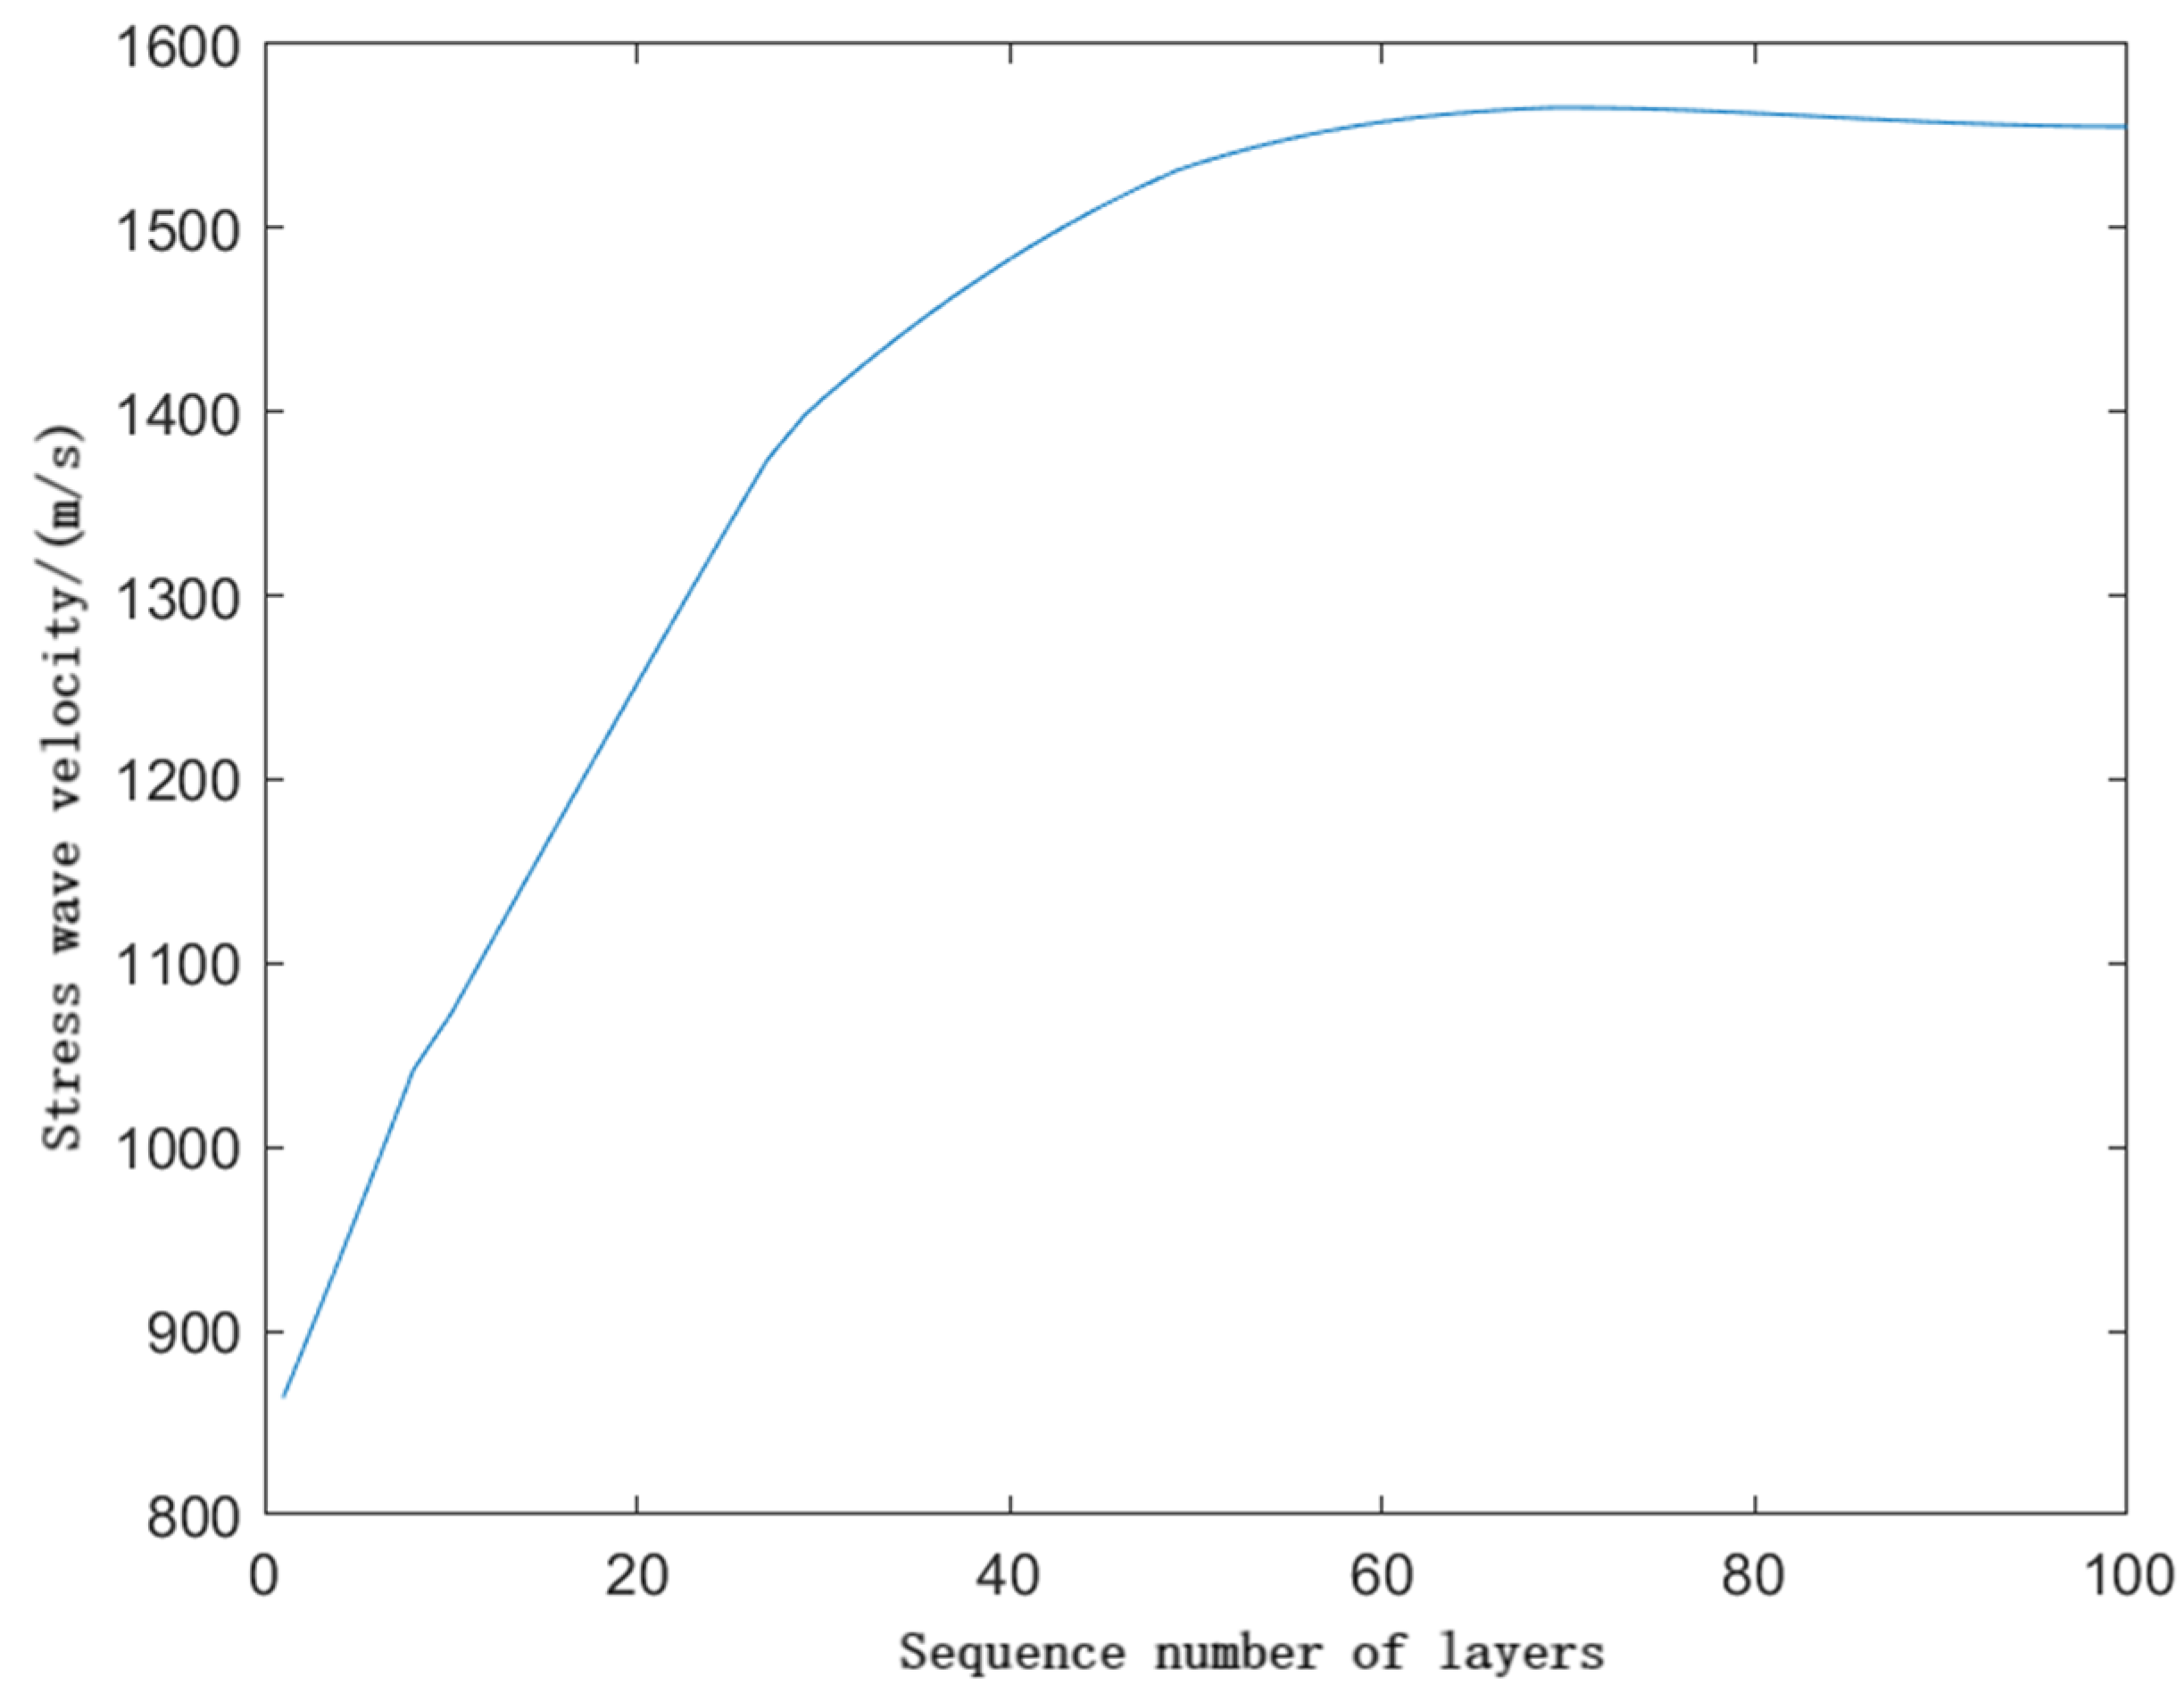
- Method to eliminate the influence of the stress wave propagation time based on the external shape
- (b)
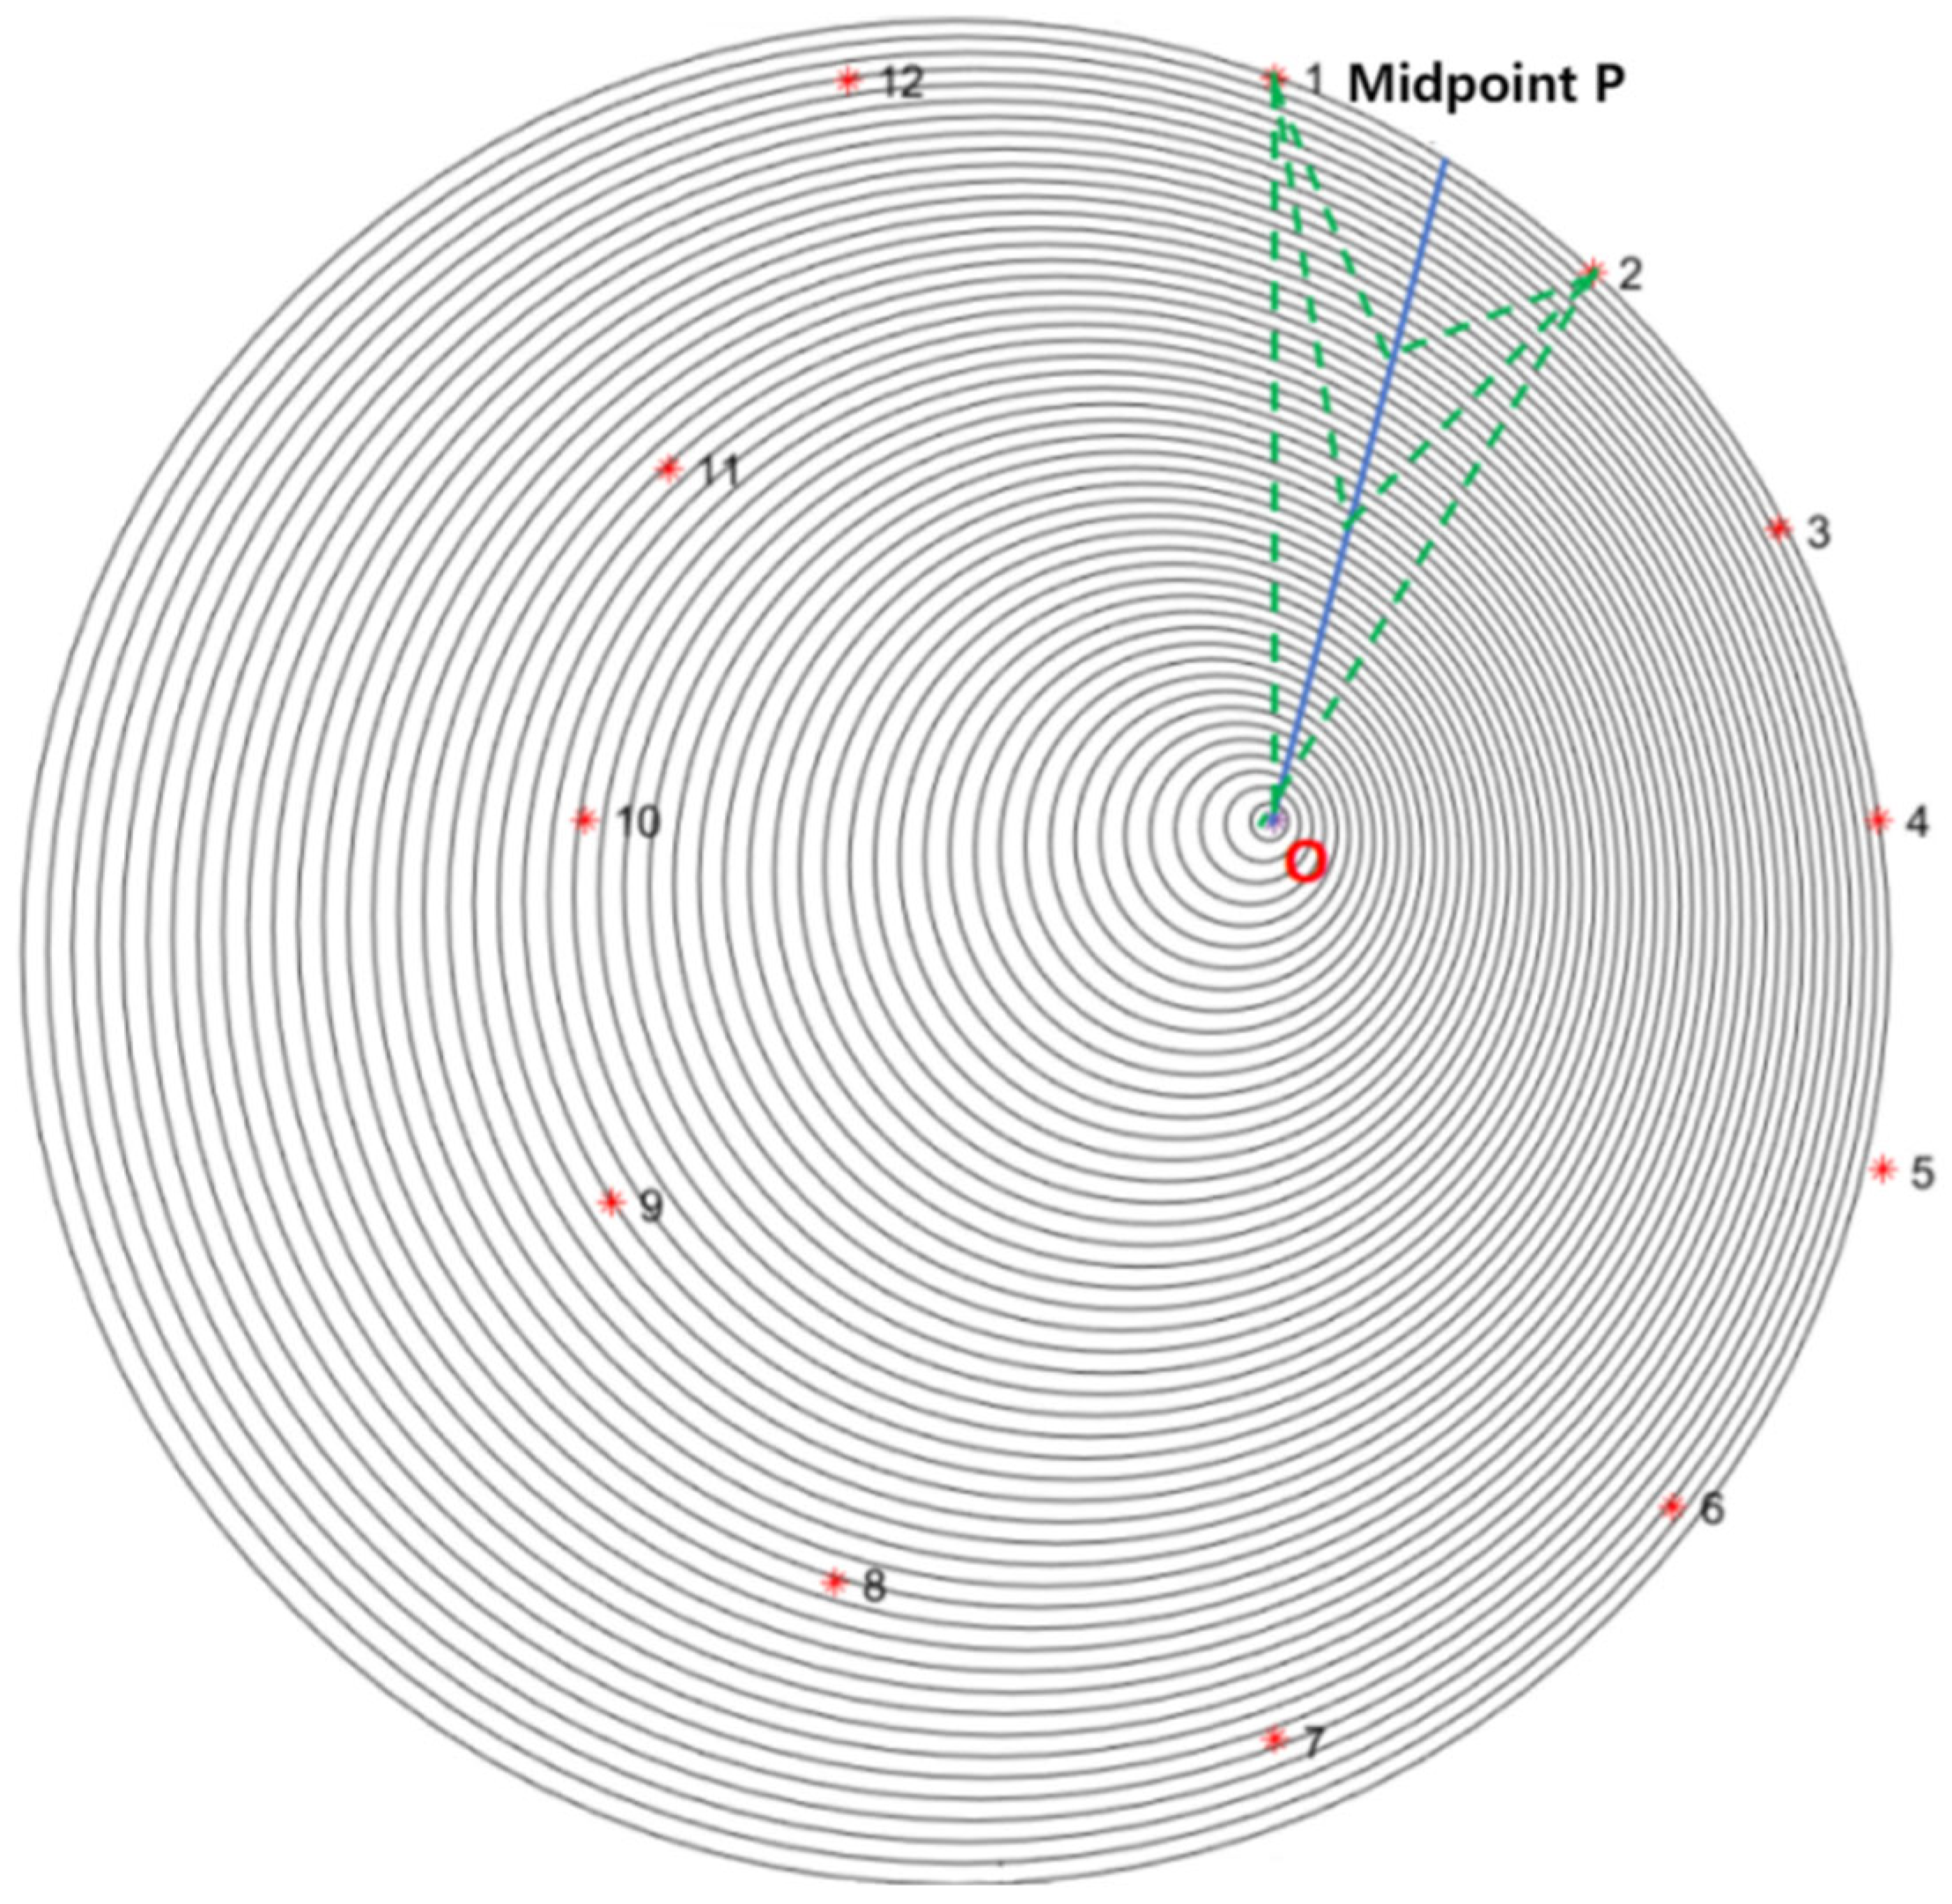
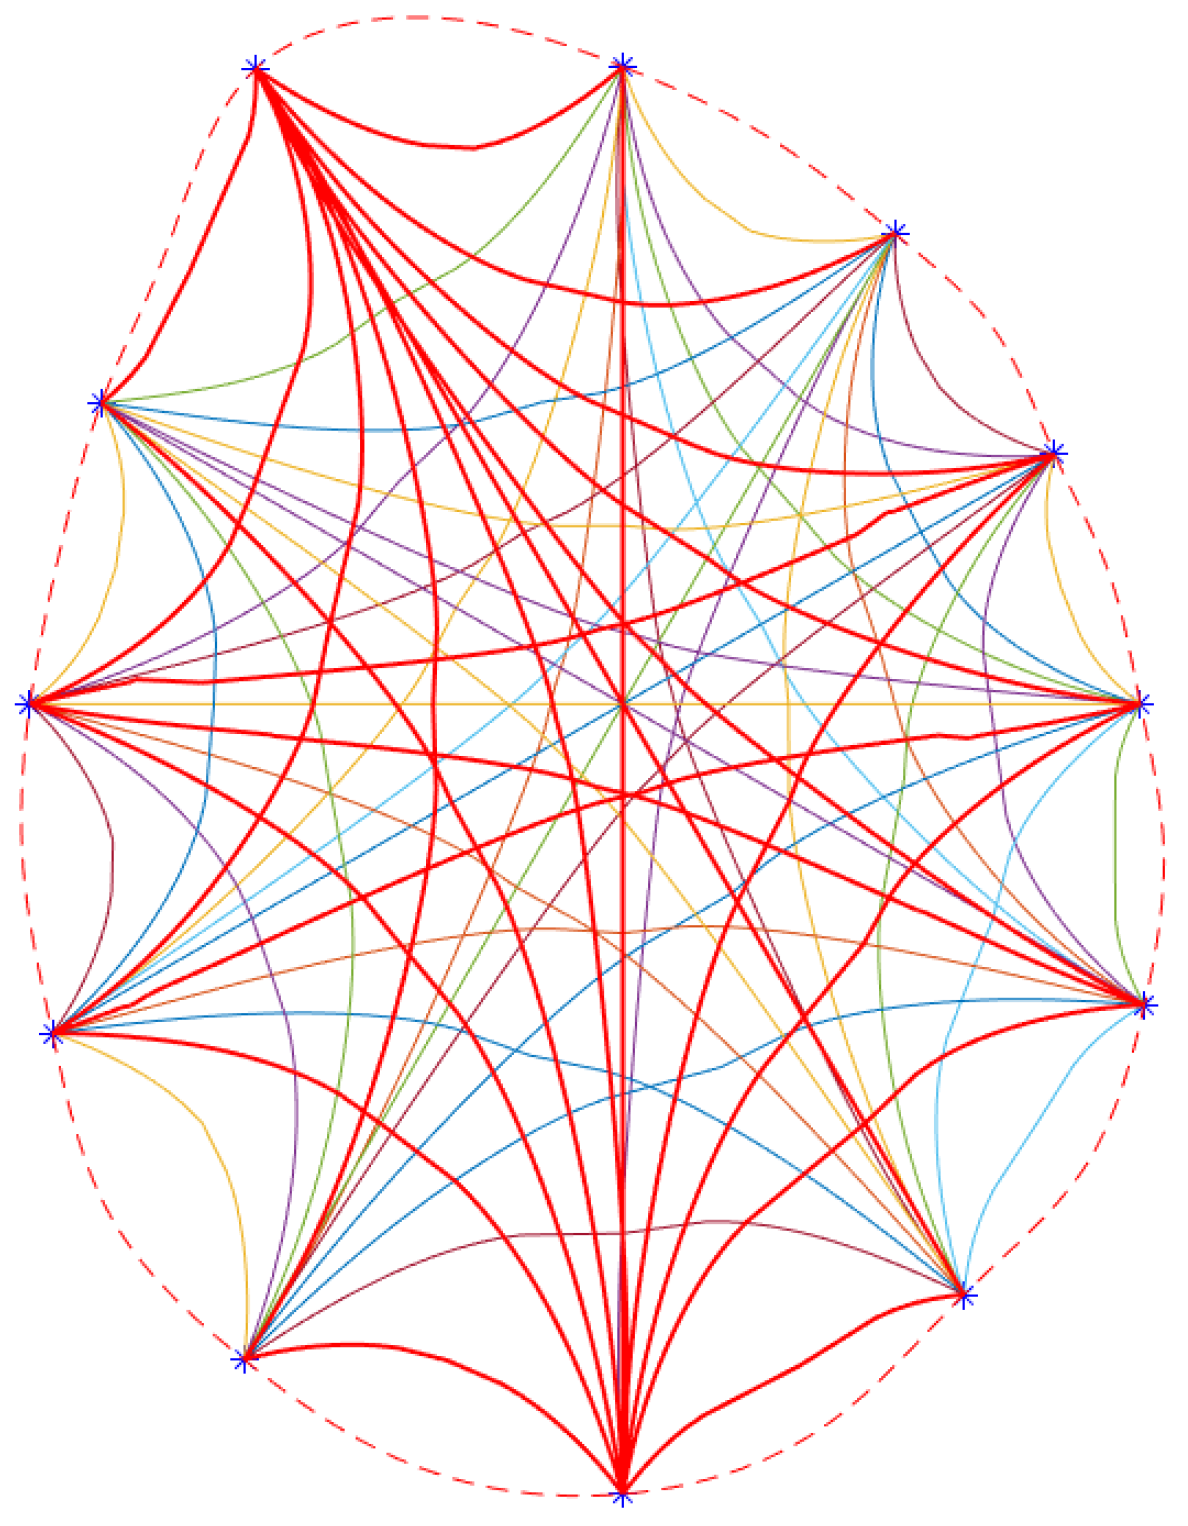
- Find methods for the shortest propagation path under this model
- (c)
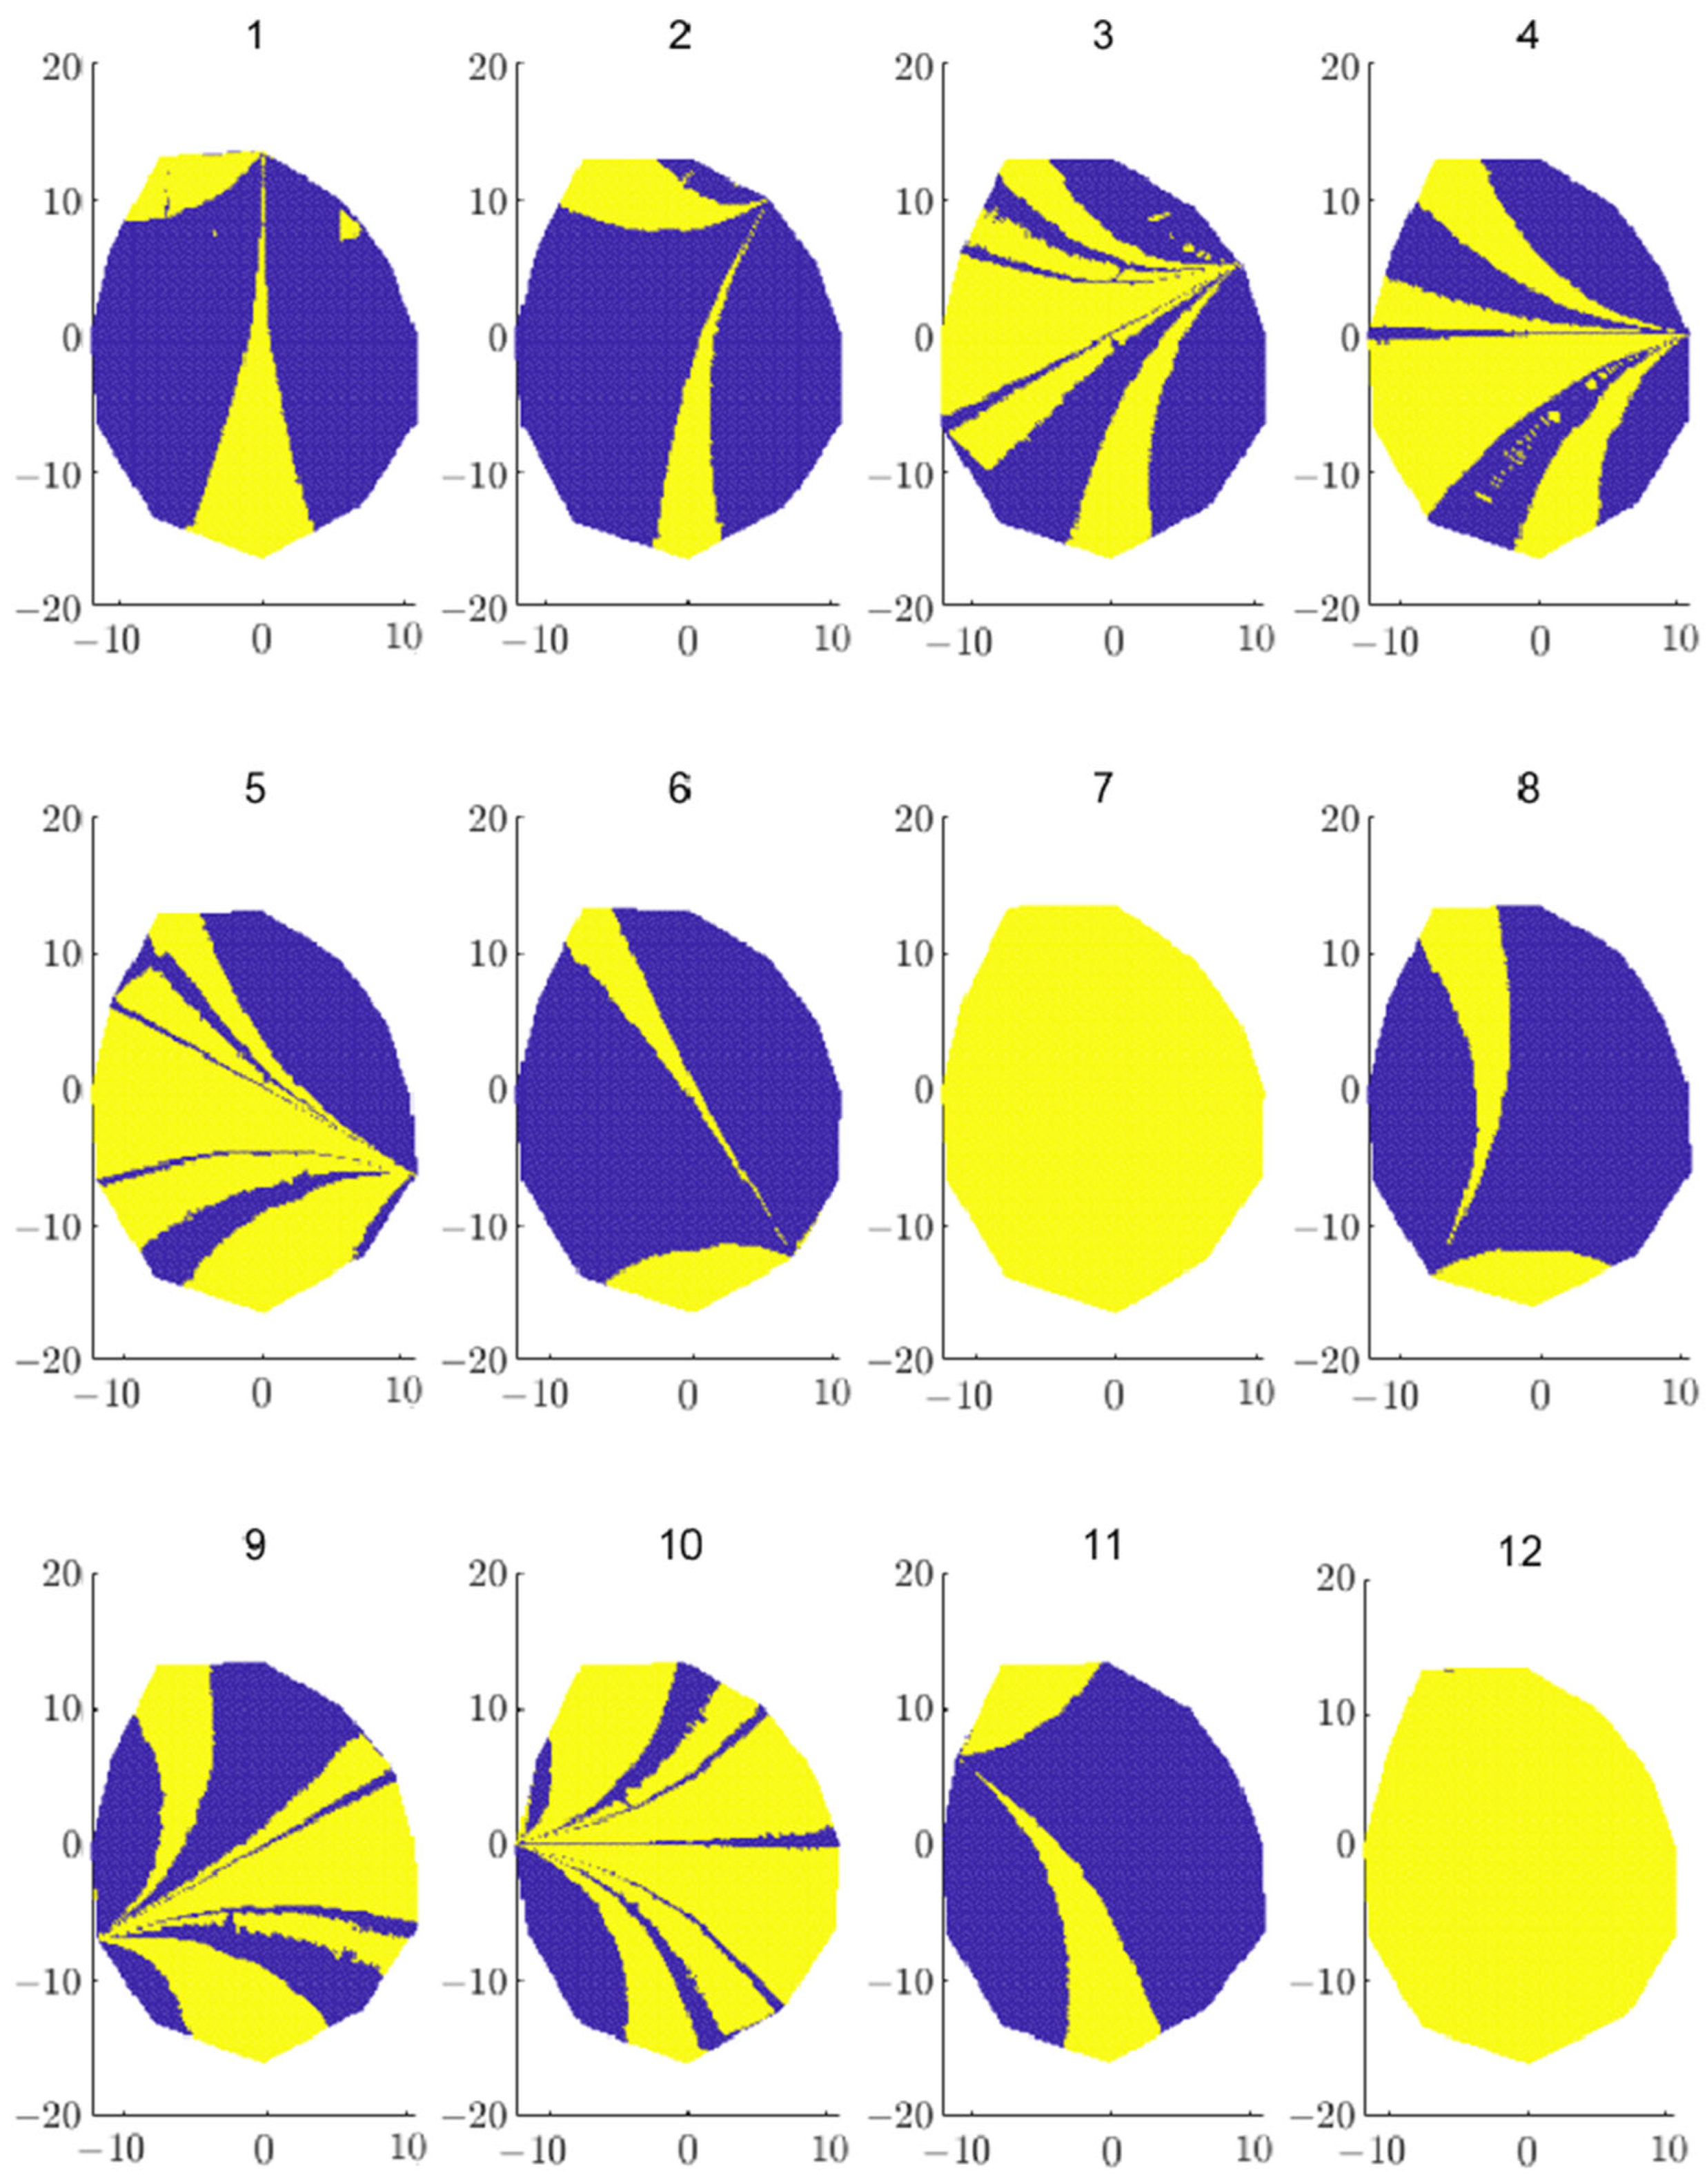
- Log cross-section tomographic imaging method based on the shortest path method
3. Results and Discussion
3.1. Results and Analysis of Stress Wave Tomography of Cross Section of Sample Logs
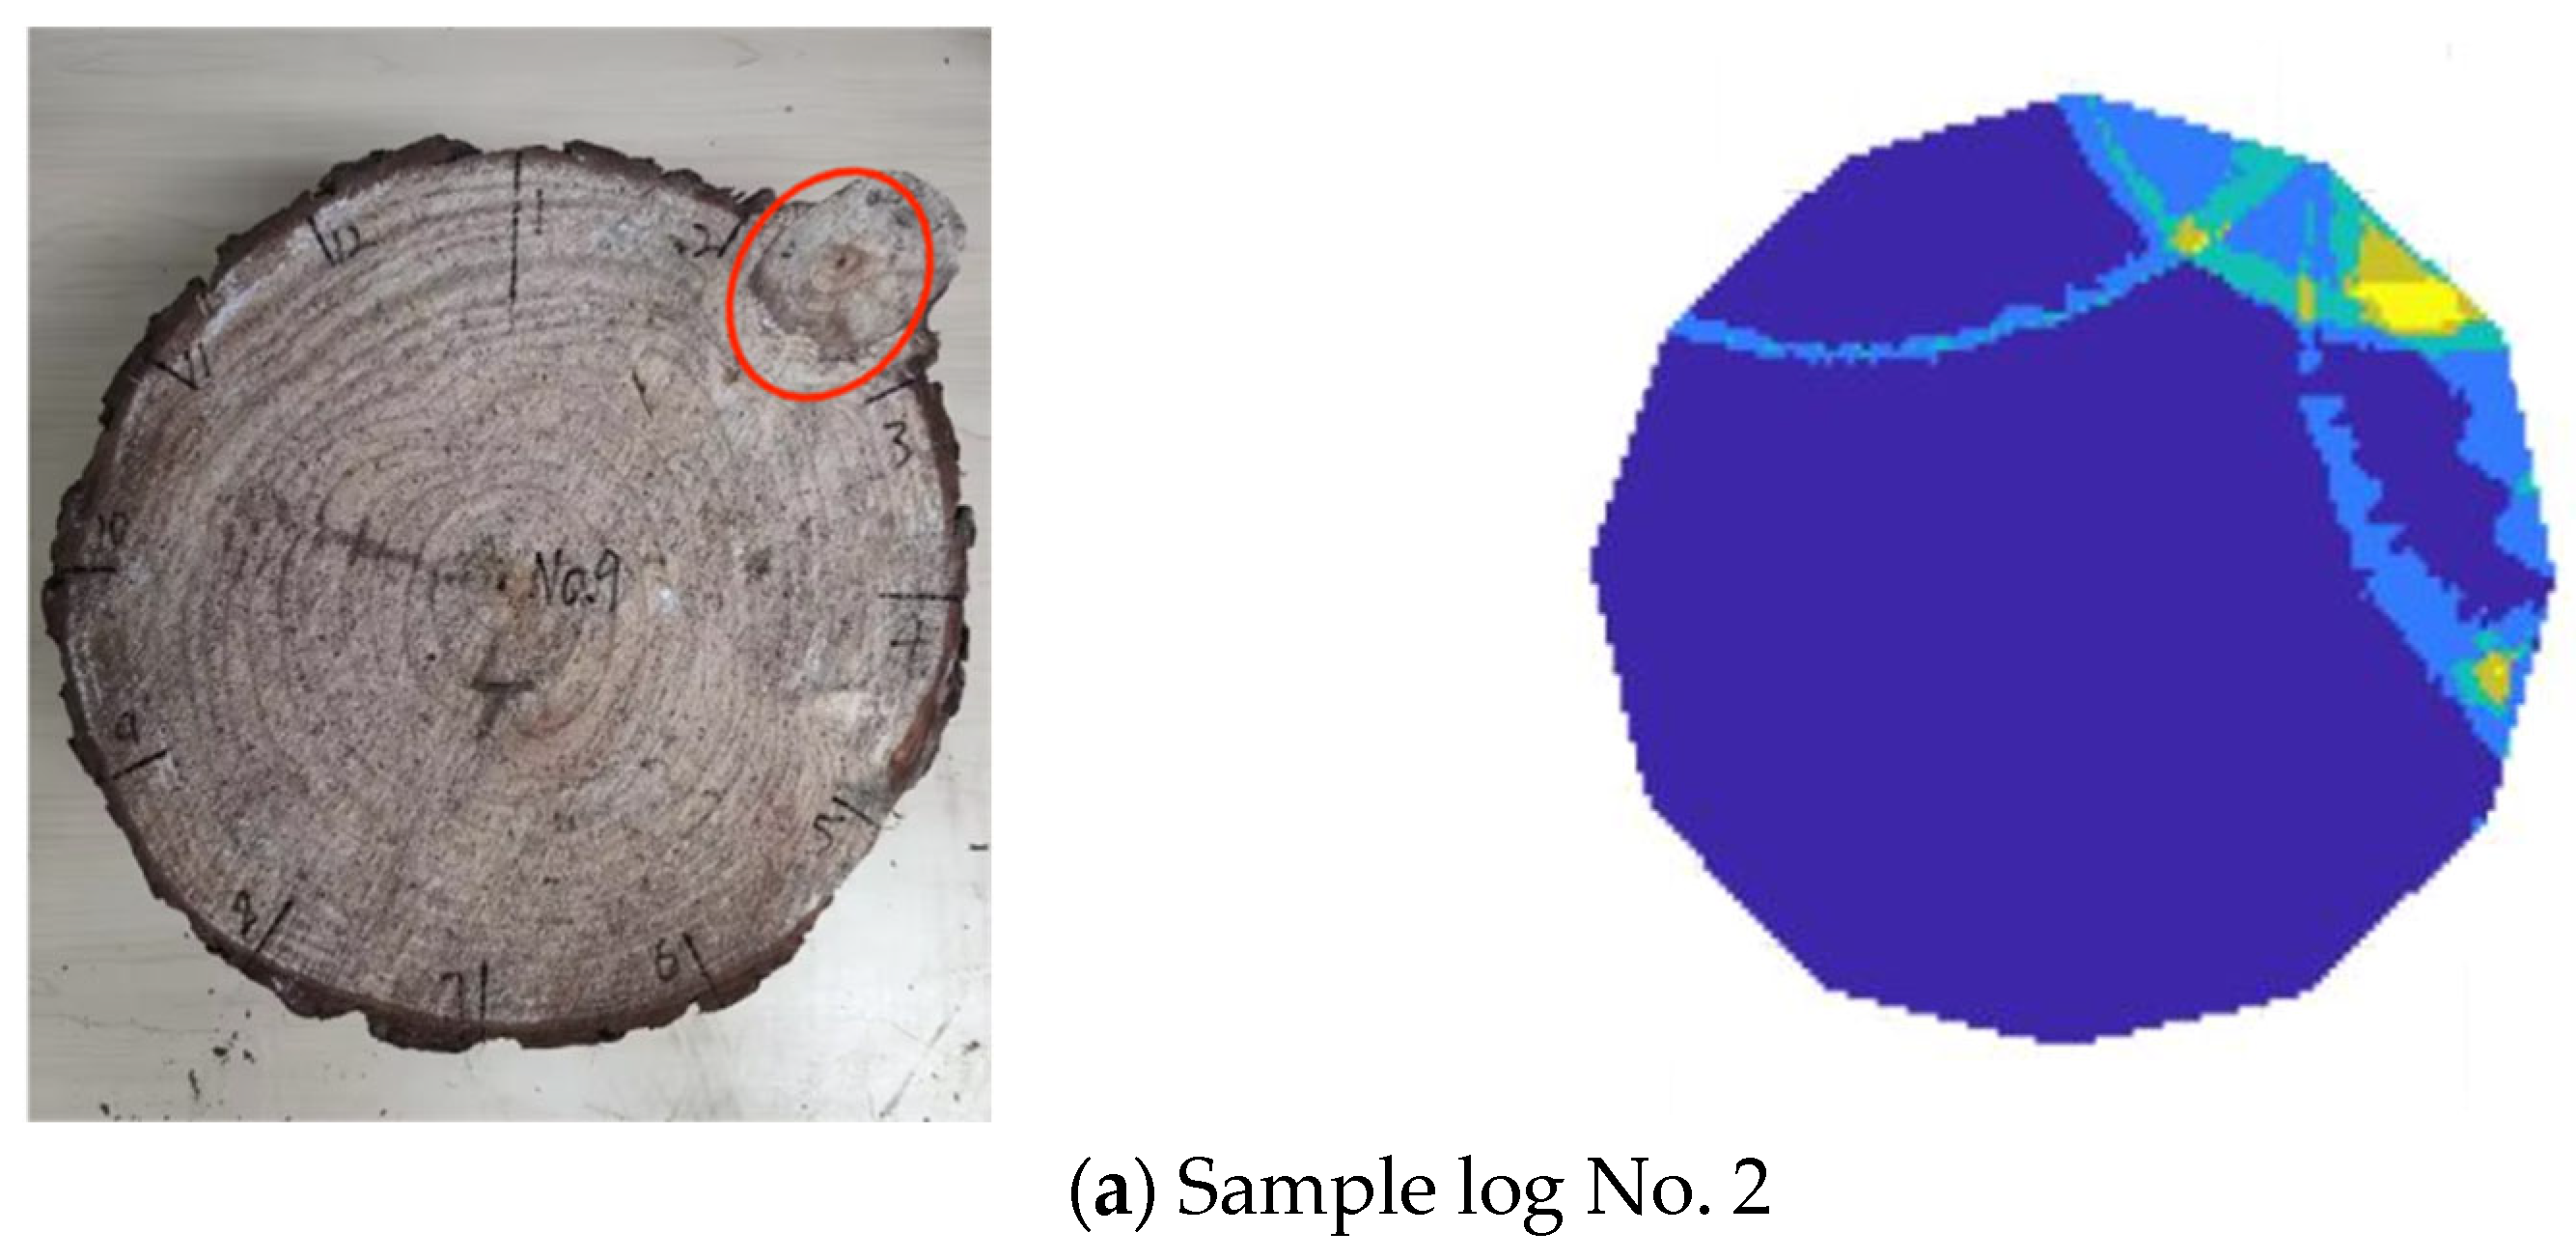
- (a)
- Single-knot sample log
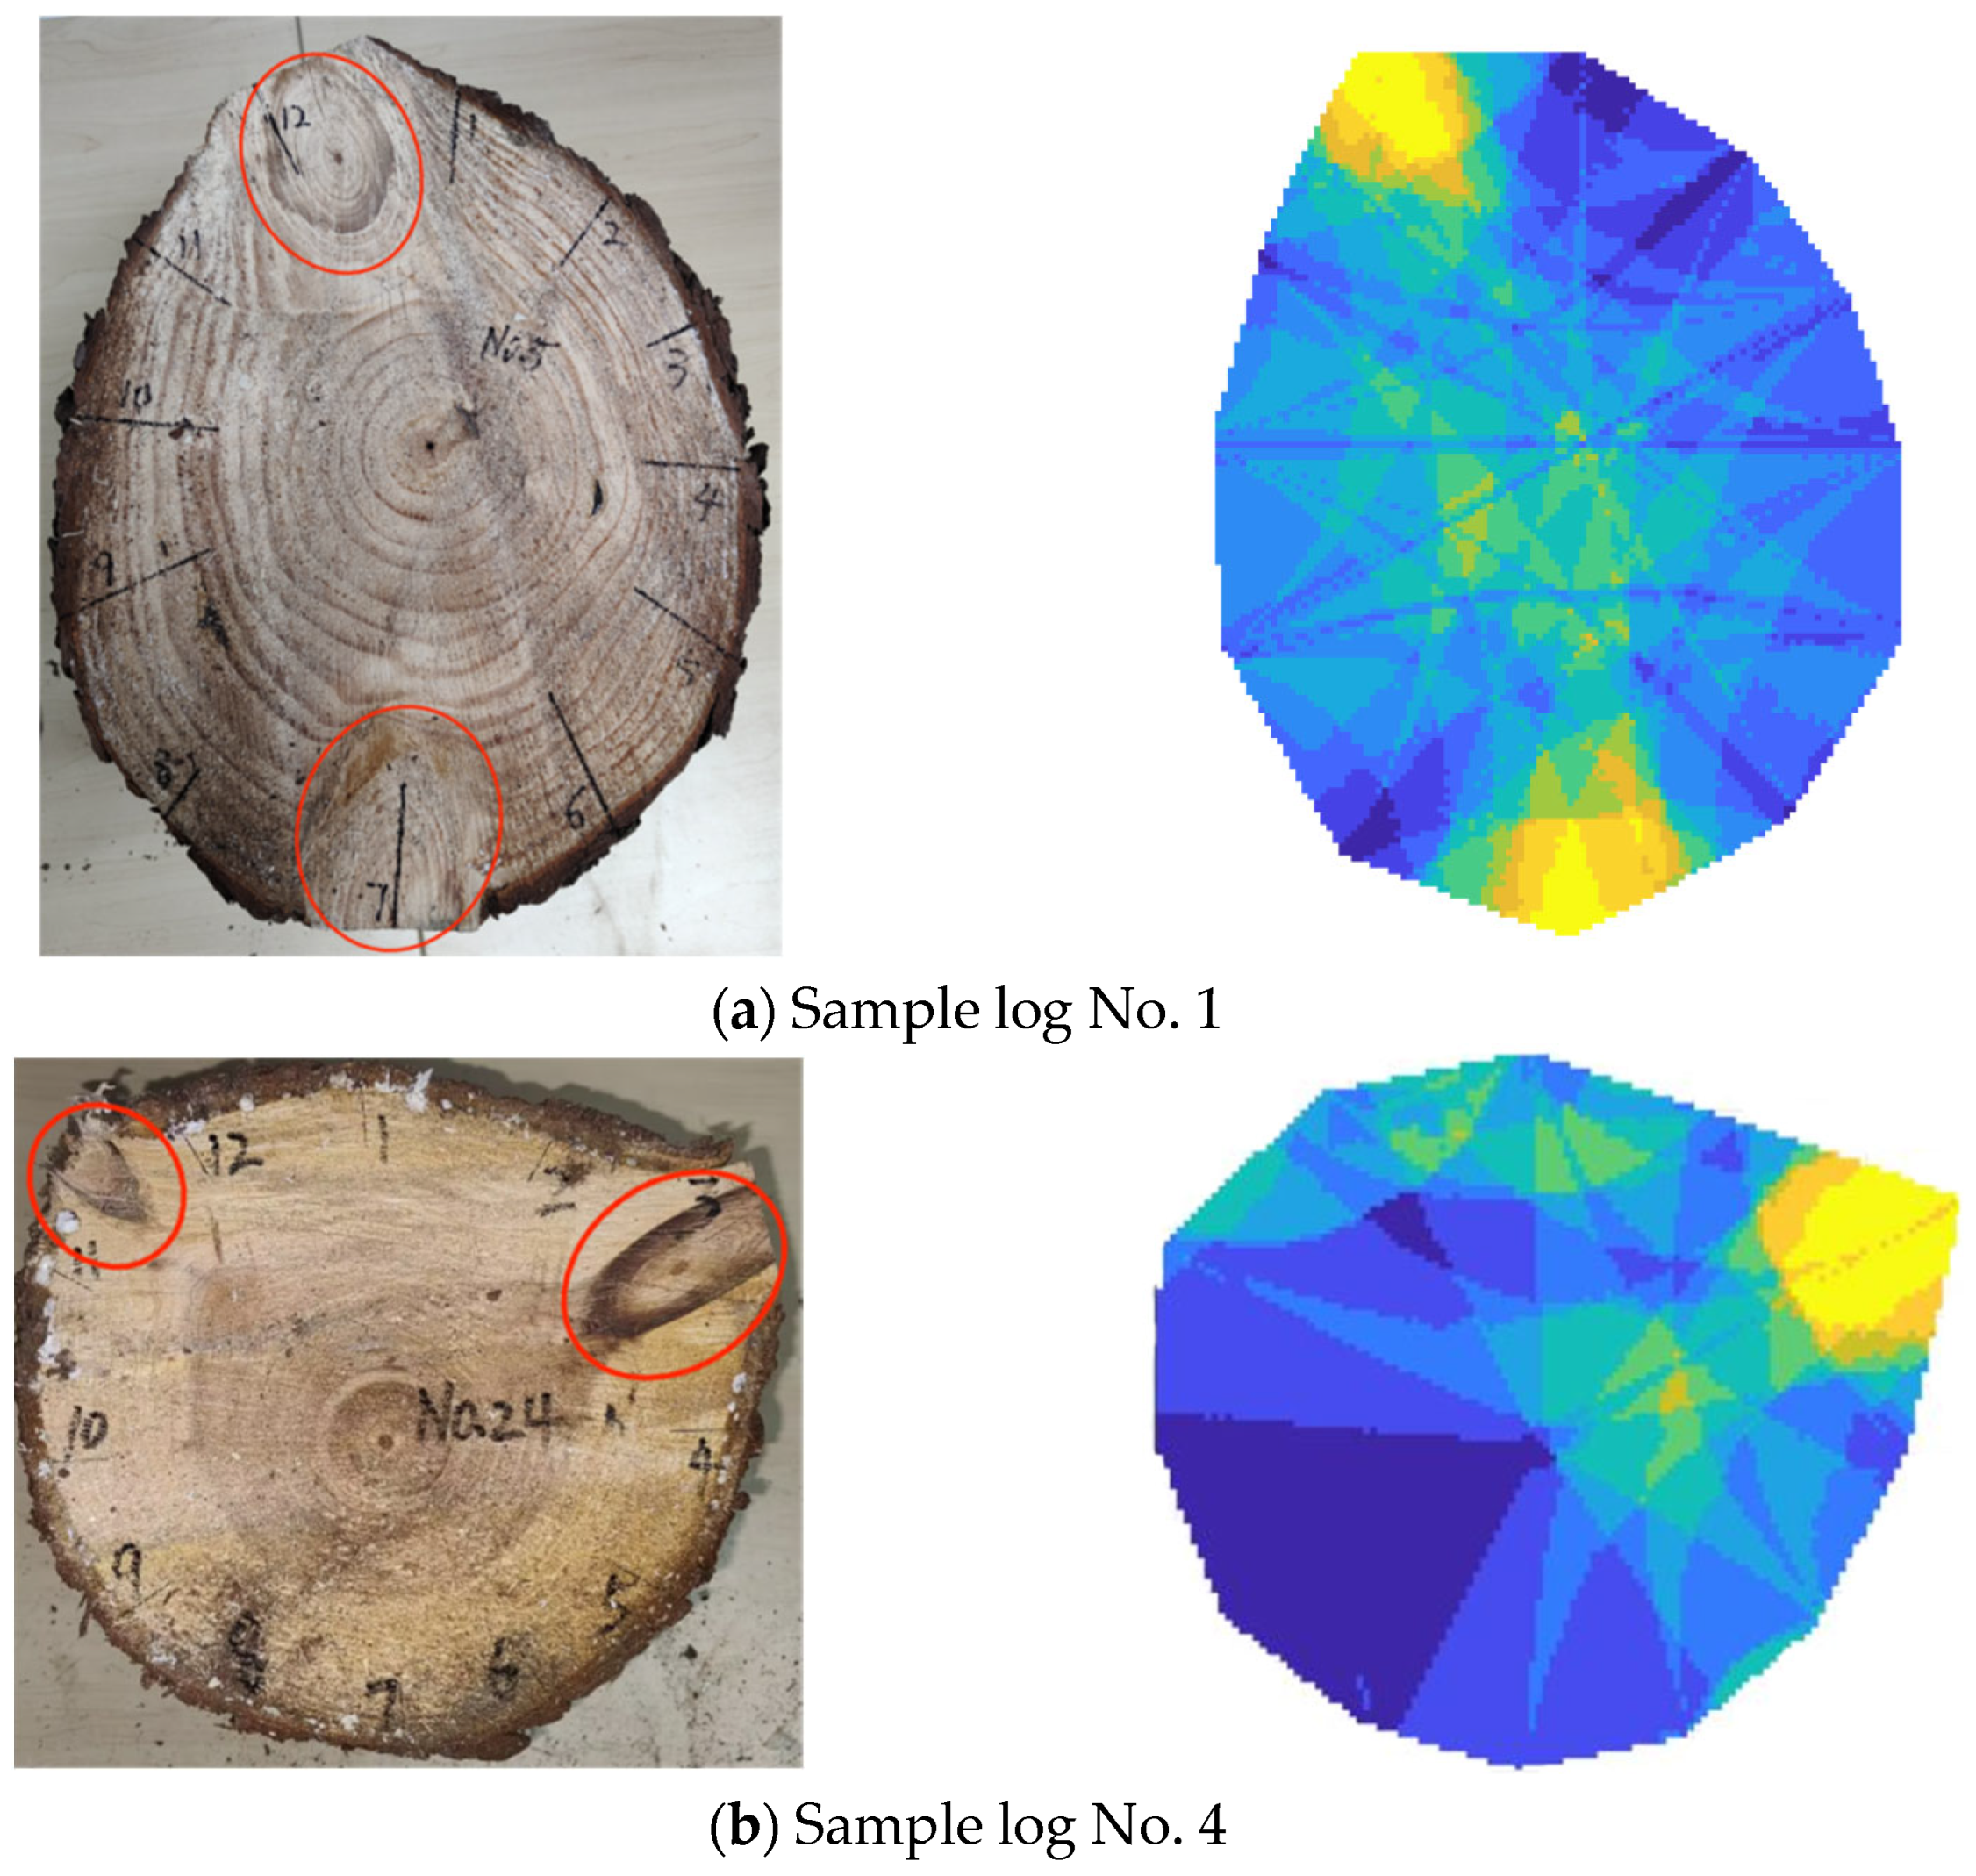
- (b)
- Double-knot sample log
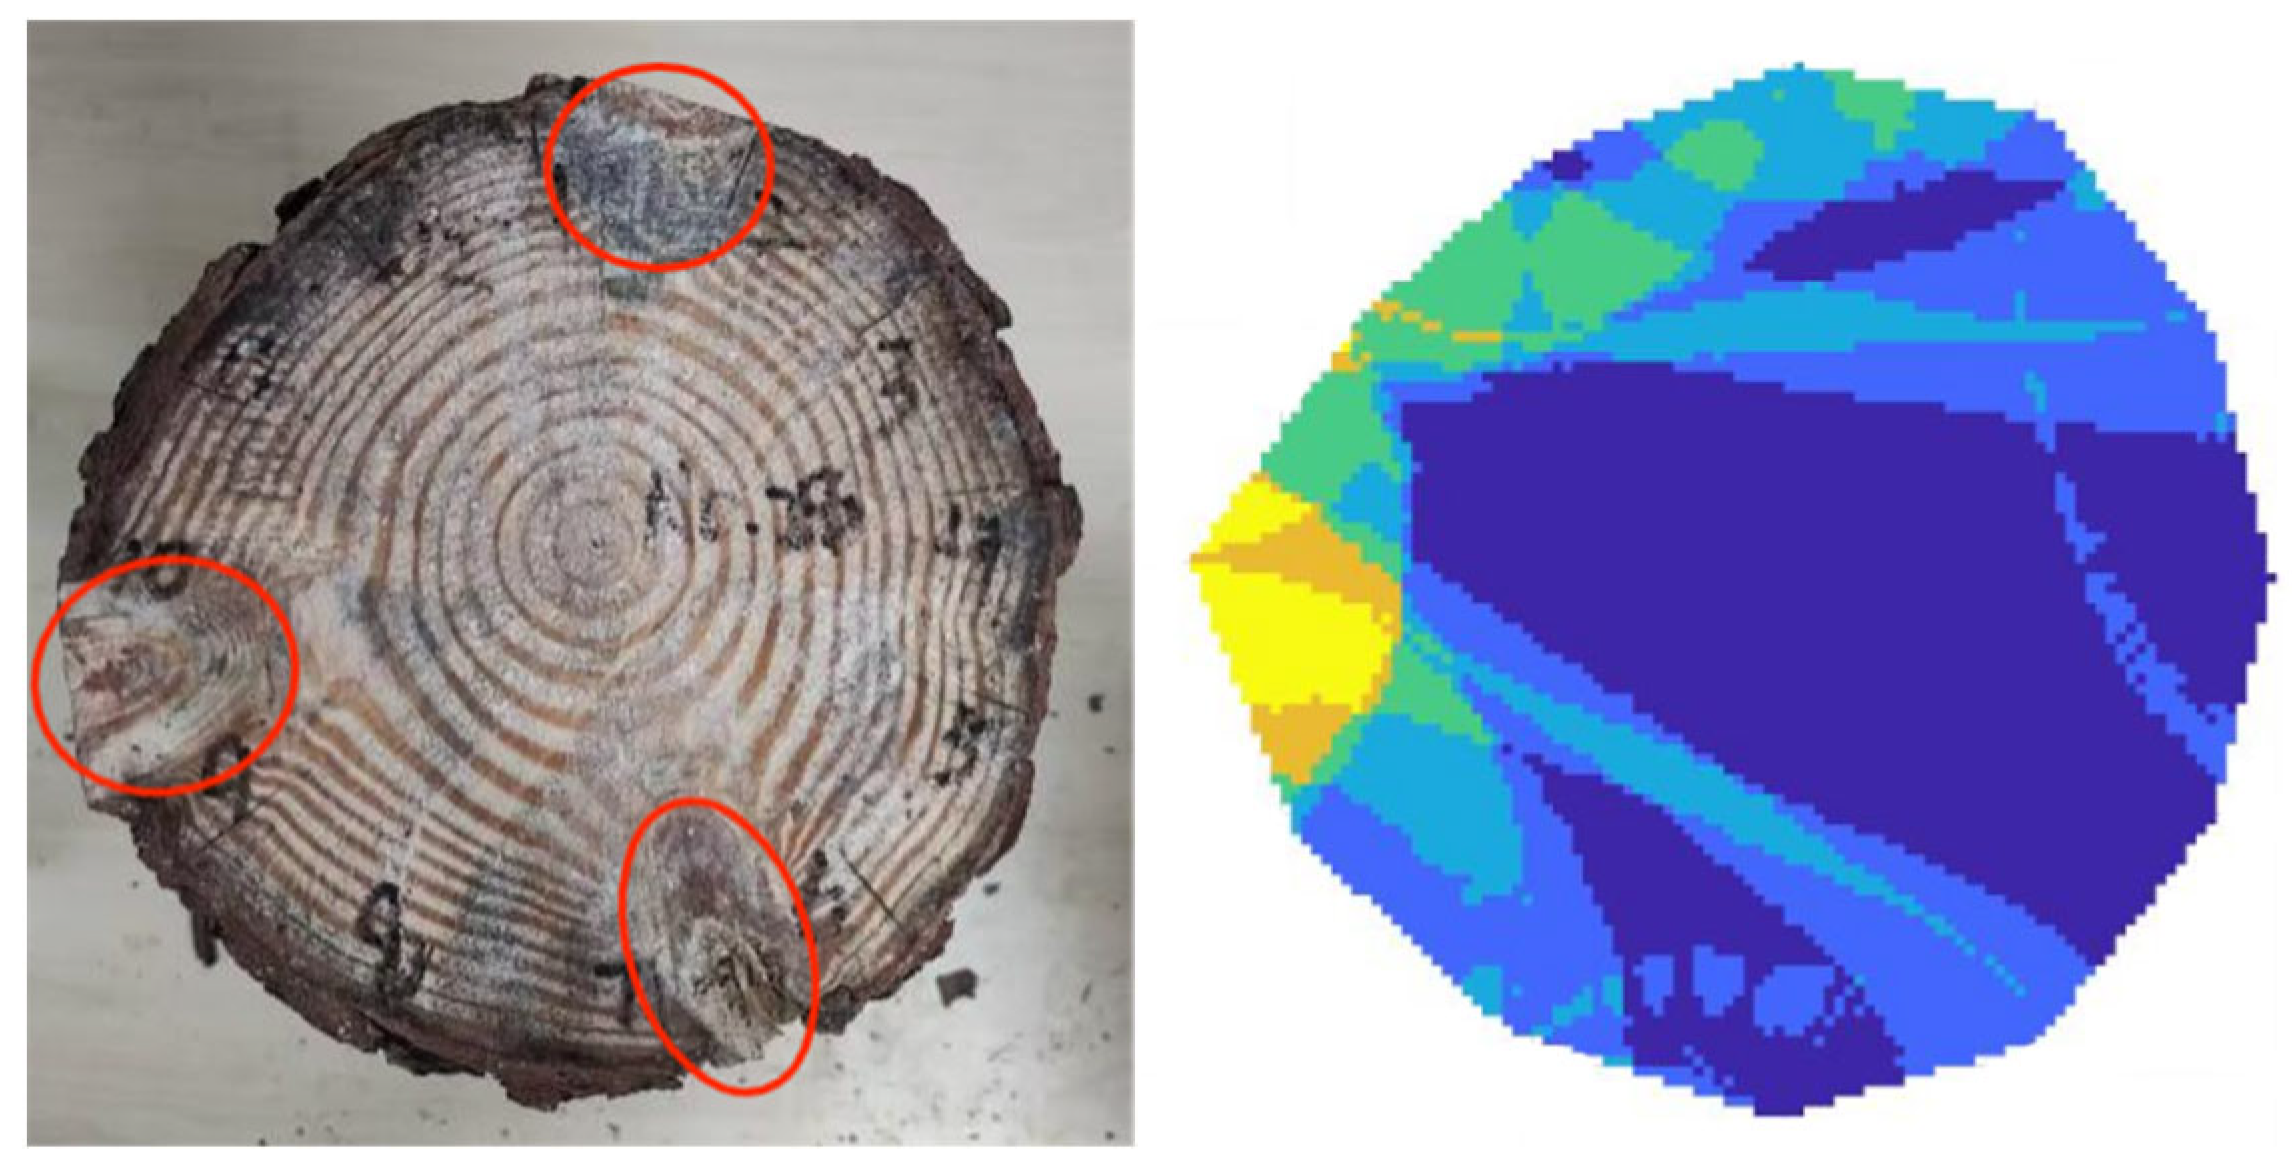
- (c)
- Three-knot sample logs
3.2. Analysis of Prediction Results of Sample
4. Conclusions
- (1)
- The tomographic imaging algorithm proposed can roughly predict the knot locations in logs with one, two, or three knots. However, it is less accurate in predicting the shape and size of the knots, with some discrepancies between the predicted and actual dimensions. Additionally, the algorithm might misidentify a single-knot log as having two knots or a double-knot log as having one knot, potentially missing actual knots. For logs with three or more knots, the algorithm relies on single log data without artificial data screening, which may lead to the incomplete detection of knots due to a lack of normal propagation time data. Therefore, it is important to verify the presence of multiple knots inside the log.
- (2)
- The relative error between the knot area calculated by the algorithm and the measured knot area ranges from 15.66% to 52.08%. Except for sample log No. 6, the relative errors for the other sample logs are generally within 31%, with sample logs No. 1, No. 2, and No. 5 showing relative errors of less than 20%. Although there are some discrepancies, the algorithm provides a rough estimate of the knot area. Further improvements are needed to enhance the prediction accuracy of the knot area.
- (3)
- The algorithm performs well for logs with cross-sectional shapes close to an ideal circle and can provide accurate tomographic imaging and prediction. However, it struggles with logs that have significant deviations from a circular shape or very small faults. The imaging effect and prediction accuracy decrease under these conditions. Further experimental research and algorithm refinement are necessary to improve fault imaging and prediction accuracy for such cases. There are few studies on the detection algorithm of stress wave wood NDT. This paper provides an algorithm for detecting detection, which provides a little basis for subsequent algorithm research.
Author Contributions
Funding
Data Availability Statement
Conflicts of Interest
References
- Cui, H.O.; Liu, M. Study on resource dynamics in the ninth Forest Resources Inventory in China. West. For. Sci. 2020, 49, 90–95. [Google Scholar]
- Yu, C. The Current situation and management suggestions of forest quality in China. For. Econ. China 2020, 6, 91–94. [Google Scholar] [CrossRef]
- Broda, M.; Mazela, B.; Królikowska-Pataraja, K.; Hill, C.A. The use of FT-IR and computed tomography non-destructive technique for water logged wood characterisation. Wood Res. 2015, 60, 707–722. [Google Scholar]
- Wang, X.C. Study on Adhesive Shear Properties of Carbonized Bamboo/Larch Gum. Master’s Thesis, Central South University of Forestry and Technology, Changsha, China, 2021. [Google Scholar] [CrossRef]
- FUJIMORI, T. Dynamics of crown structure and stem growth based on knot analysis of a hinoki cypress. For. Ecol. Manag. 1993, 56, 57–68. [Google Scholar] [CrossRef]
- Yong, C.Z.; Li, Y.L. Physical and mechanical properties and utilization of Chinese wood. Guizhou For. Sci. Technol. 1991, 19, 69–70. [Google Scholar]
- Wang, Y.R.; Zhao, R.J.; Jiang, Z.H.; Xu, Z.Y. Density analysis of the trunk, knots and branches of loblolly pine. For. Prod. Ind. 2016, 43, 14–17. [Google Scholar]
- Hein, S. Knot attributes and occlusion of naturally pruned branches of Fagus sylvatica. For. Ecol. Manag. 2008, 256, 2046–2057. [Google Scholar] [CrossRef]
- Newton, M.; Lachenbruch, B.; Robbins, J.M.; Cole, E.C. Branch diameter and longevity linked to plantation spacing and rectangularity in young Douglas-fir. For. Ecol. Manag. 2012, 26, 75–82. [Google Scholar] [CrossRef]
- Björklund, L.; Moberg, L. Modelling the inter-tree variation of knot properties for Pinus sylvestris in Sweden. Stud. For. Suec. 1999, 14, 376–384. [Google Scholar]
- Duchateau, E.; Longuetaud, F.; Mothe, F.; Ung, C.; Auty, D.; Achim, A. Modelling knot morphology as a function of external tree and branch attributes. Can. J. For. Res. 2012, 43, 266–277. [Google Scholar] [CrossRef]
- Mäkinen, H.; Ojansuu, R.; Sairanen, P.; Yli-Kojola, H. Predicting branch characteristics of Norway spruce (Picea abies (L.) Karst.) from simple stand and tree measurements. Forestry 2003, 76, 525–536. [Google Scholar]
- Jia, W.W.; Feng, W.J.; Li, F.R. Study on the number of lost rings in changbai larch plantation based on the node seed dissection data. J. Beijing For. Univ. 2020, 42, 87–98. [Google Scholar]
- Chen, D.S.; Li, F.R.; Sun, X.M.; Jia, W.W. Headnut size prediction model of the larch plantation based on a linear mixed model. For. Sci. 2011, 47, 121–128. [Google Scholar]
- Guan, Z.Z.; Lu, Q.F.; He, S.Y.; Qiu, Q.; Ma, W.J. Spatial distribution characteristics of the trunk nodes and their area prediction model. J. Cent. South Univ. For. Technol. 2021, 41, 20–28. [Google Scholar]
- Jia, W.W.; Cui, C.; Li, F.R. Artificial Korean pine knot attributes based on a mixed effect model. J. Appl. Ecol. 2018, 29, 33–43. [Google Scholar]
- Zhang, Z.C.; Li, F.R.; Chen, D.S. Study on the number of rings at different growth stages in larch plantation. Plant Res. 2010, 30, 320–324. [Google Scholar]
- Hao, J.; Meng, M.J.; Huang, D.W.; Wei, J.L.; Li, Z.G.; Tang, J.X.; Xu, D.P. Distribution characteristics and prediction model of grid plantation. J. Nanjing For. Univ. (Nat. Sci. Ed.) 2017, 41, 100–104. [Google Scholar]
- Gilbert, G.S.; Ballesteros, J.O.; Barrios-Rodriguez, C.A.; Bonadies, E.F.; Cedeño-Sánchez, M.L.; Fossatti-Caballero, N.J.; Trejos-Rodríguez, M.M.; Pérez-Suñiga, J.M.; Holub-Young, K.S.; Henn, L.A.W.; et al. Use of sonic tomography to detect and quantify wood decay in living tress. Appl. Plant Sci. 2016, 4, 60–72. [Google Scholar] [CrossRef]
- Espinosa, L.; Arciniegas, A.; Cortes, Y.; Prieto, F.; Brancheriau, L. Automatic segmentation of acoustic tomography images for the measurement of wood decay. Wood Sci. Technol. 2017, 51, 69–84. [Google Scholar] [CrossRef]
- Ladislav, R.; Martin, H. The type and degree of decay in spruce wood analyzed by the ultrasonic method in three anatomical direction. BioResources 2011, 6, 4953–4968. [Google Scholar]
- Maurer, H.; Schubert, S.I.; Bächle, F.; Clauss, S.; Gsell, D.; Dual, J.; Niemz, P. A simple anisotropy correction procedure for acoustic wood tomography. Holzforschung 2006, 60, 567–573. [Google Scholar] [CrossRef]
- Divos, F.; Divos, P. Resolution of stress wave based acoustic tomography. In Proceedings of the 14th International Symposium on Nondestructive Testing of Wood, Eberswalde, Germany, 2–4 May 2005; pp. 309–314. [Google Scholar]
- Liu, J.X.; Gao, J.Q.; Li, C. Wood-defect image reconstruction using the LandWeber algorithm. J. Northeast For. Univ. 2019, 47, 125–128. [Google Scholar]
- Yan, Z. Preliminary Study Based on 2D Image Reconstruction of Internal Defects; Northeast Forestry University: Harbin, China, 2007. [Google Scholar]
- Liu, L.J.; Xie, Z.H.; Yang, C. Ray tracing algorithm based on boundary linear walk interpolation. J. South China Univ. Technol. (Nat. Sci. Ed.) 2014, 42, 23–28+35. [Google Scholar]
- Cai, Y.L. Based on Shortest Path Ray Tracing; Northeast Forestry University: Harbin, China, 2015. [Google Scholar]
- Wu, T. Study of Wood Defect Fault Reconstruction Based on Cell Back Projection; Northeast Forestry University: Harbin, China, 2016. [Google Scholar]




| Sample log/No. | Diameter/cm | Number of Knots | Sample Log Shape | Species |
|---|---|---|---|---|
| 1 | 28 | 2 | Deviated from the positive circle | fir |
| 2 | 26 | 1 | Close to the round | fir |
| 3 | 21 | 1 | Close to the round | fir |
| 4 | 23 | 2 | Deviated from the positive circle | fir |
| 5 | 20 | 1 | Deviated from the positive circle | pine |
| 6 | 23 | 3 | Deviated from the positive circle | pine |
| 1 | 2 | 3 | 4 | 5 | 6 | 7 | 8 | 9 | 10 | 11 | 12 | |
|---|---|---|---|---|---|---|---|---|---|---|---|---|
| 1 | 0 | 0.48 | 7.63 | 4.89 | 2.66 | 1.02 | −17.68 | −5.38 | −1.66 | −8.85 | −8.53 | −20.08 |
| 2 | 0 | 0 | 3.04 | −0.88 | 3.39 | 3.07 | −12.84 | 1.98 | 3.38 | −0.20 | −1.83 | −19.17 |
| 3 | 0 | 0 | 0 | 5.10 | 5.54 | 3.93 | −13.90 | −1.15 | 4.07 | −260.35 | 1.17 | −15.19 |
| 4 | 0 | 0 | 0 | 0 | 3.13 | −0.17 | −17.18 | −3.99 | −199.46 | 3.13 | 0.86 | −15.76 |
| 5 | 0 | 0 | 0 | 0 | 0 | −5.17 | −22.95 | −6.89 | 0.41 | −392.81 | 4.42 | −13.66 |
| 6 | 0 | 0 | 0 | 0 | 0 | 0 | −23.33 | −8.61 | −7.04 | −3.91 | −2.64 | −11.77 |
| 7 | 0 | 0 | 0 | 0 | 0 | 0 | 0 | −19.58 | −16.27 | −14.30 | −15.16 | −34.96 |
| 8 | 0 | 0 | 0 | 0 | 0 | 0 | 0 | 0 | −3.31 | −3.51 | 1.80 | −13.42 |
| 9 | 0 | 0 | 0 | 0 | 0 | 0 | 0 | 0 | 0 | −3.16 | −1.24 | −14.75 |
| 10 | 0 | 0 | 0 | 0 | 0 | 0 | 0 | 0 | 0 | 0 | −3.42 | −19.08 |
| 11 | 0 | 0 | 0 | 0 | 0 | 0 | 0 | 0 | 0 | 0 | 0 | −39.03 |
| 12 | 0 | 0 | 0 | 0 | 0 | 0 | 0 | 0 | 0 | 0 | 0 | 0 |
| Number of Sample | Actual Measured Cross-Sectional Area/cm2 | Actual Measured Knot Area/cm2 | The Area Calculated by the Algorithm/cm2 | Relative Error/% |
|---|---|---|---|---|
| 1 | 639.945 | 72.326 | 60.479 | 16.38 |
| 2 | 590.761 | 22.202 | 18.199 | 18.29 |
| 3 | 328.242 | 15.520 | 11.711 | 24.54 |
| 4 | 441.630 | 36.669 | 25.342 | 30.88 |
| 5 | 332.706 | 14.142 | 16.357 | 15.66 |
| 6 | 400.037 | 37.801 | 18.111 | 52.08 |
Disclaimer/Publisher’s Note: The statements, opinions and data contained in all publications are solely those of the individual author(s) and contributor(s) and not of MDPI and/or the editor(s). MDPI and/or the editor(s) disclaim responsibility for any injury to people or property resulting from any ideas, methods, instructions or products referred to in the content. |
© 2024 by the authors. Licensee MDPI, Basel, Switzerland. This article is an open access article distributed under the terms and conditions of the Creative Commons Attribution (CC BY) license (https://creativecommons.org/licenses/by/4.0/).
Share and Cite
Liu, F.; Wang, Q.; Wu, C.; Chen, W.; Xiao, J. Study on Nondestructive Detection Imaging Method of Log Knot Based on Judging the Shortest Path of Stress Wave Propagation. Forests 2024, 15, 1748. https://doi.org/10.3390/f15101748
Liu F, Wang Q, Wu C, Chen W, Xiao J. Study on Nondestructive Detection Imaging Method of Log Knot Based on Judging the Shortest Path of Stress Wave Propagation. Forests. 2024; 15(10):1748. https://doi.org/10.3390/f15101748
Chicago/Turabian StyleLiu, Fenglu, Qinhui Wang, Chuanyu Wu, Wenhao Chen, and Jiawei Xiao. 2024. "Study on Nondestructive Detection Imaging Method of Log Knot Based on Judging the Shortest Path of Stress Wave Propagation" Forests 15, no. 10: 1748. https://doi.org/10.3390/f15101748
APA StyleLiu, F., Wang, Q., Wu, C., Chen, W., & Xiao, J. (2024). Study on Nondestructive Detection Imaging Method of Log Knot Based on Judging the Shortest Path of Stress Wave Propagation. Forests, 15(10), 1748. https://doi.org/10.3390/f15101748


