Article

Impact of Extreme Drought on Vegetation Greenness in Poyang Lake Wetland

1
Key Laboratory of Poyang Lake Watershed Agricultural Resources and Ecology (Co-Construction by Ministry and Province), Nanchang 330045, China
2
College of Land Resources and Environment, Jiangxi Agricultural University, Nanchang 330045, China
3
Natural Resources Policy Investigation and Evaluation Center of Jiangxi Province, Nanchang 330045, China
4
Remote Sensing Application Engineering Technology Research Center of Jiangxi Provincial, Nanchang 330045, China
*
Author to whom correspondence should be addressed.
Forests 2024, 15(10), 1756; https://doi.org/10.3390/f15101756 (registering DOI)
Submission received: 11 September 2024 / Revised: 28 September 2024 / Accepted: 4 October 2024 / Published: 6 October 2024
(This article belongs to the Topic Forest Carbon Sequestration and Climate Change Mitigation)

Abstract

:
The Poyang Lake Wetland, an internationally significant ecosystem, frequently experiences drought during the flood season. However, the total impact of extreme drought on wetland vegetation remains poorly understood. This study determined the standardised precipitation evapotranspiration index (SPEI) and analysed drought trends within the Poyang Lake Basin. Additionally, spatiotemporal variations in wetland vegetation under drought conditions were examined by analysing the mean normalised difference vegetation index (NDVI) values and categorising NDVI classifications. The key factors affecting wetland vegetation and its respective thresholds were determined. The Poyang Lake Basin has experienced increasing aridity over the past 3 years. In response to this trend, the wetland vegetation area in Poyang Lake expanded, whereas vegetation greenness declined. Notably, in the year following an extreme drought, Poyang Lake’s vegetation greenness was lower than that during the same period in previous years. Regardless, the correlation analysis showed no significant relationship between the SPEI values and the wetland vegetation greenness; however, water level changes significantly impacted the wetland vegetation, with a correlation coefficient of −0.89 (p < 0.001). A critical water level of 14 m was identified as the threshold at which sudden changes in the mean NDVI were observed. This research offers valuable insights into hydrological management strategies to protect Poyang Lake Wetland’s vegetation under drought conditions. Future studies should enhance the differentiation of drought tolerance among different wetland plant species, thereby achieving differentiated hydrological management.

1. Introduction

Drought is a disaster that not only triggers forest fires [1,2] but also leads to the death of biological communities [3], exacerbates soil carbon loss in arid regions [4], and reduces global terrestrial net primary productivity [5]. Recent reports indicate that over the past two decades, many regions worldwide have experienced drought impacts [6,7,8]. In 2022, Poyang Lake experienced a severe meteorological drought. The number of people affected by the disaster reached 5.31 million, with direct agricultural losses amounting to CNY 7.1 billion [9]. Historically, the Poyang Lake Basin has experienced more frequent floods than droughts [10]. However, over the past 50 years, the northern Poyang Lake Basin has experienced abrupt transitions from wet to dry conditions [11]. Since the turn of the century, Poyang Lake has entered a new phase, characterised by intensified droughts [12]. Between 2003 and 2013, it experienced six recorded droughts, with simultaneous droughts in spring, summer, and autumn becoming more pronounced [13]. The duration, frequency, intensity, and severity of these droughts have all increased [14]. Droughts significantly suppress the gross ecosystem productivity of the Poyang Lake Basin vegetation ecosystem, which decreases markedly as drought severity intensifies [15], seriously threatening the wintering grounds of water birds [16].
Although drought has been observed in Poyang Lake, the full extent of its impact on wetland vegetation remains unclear. Poyang Lake, the largest freshwater lake in China, is celebrated both domestically and internationally as the “Kingdom of Migratory Birds” and the “Freshwater Fish Reservoir.” This globally significant ecological zone plays a vital role in migratory bird routes, the conservation of finless porpoises, the supply of freshwater resources, and ecological preservation. Moreover, it serves as a crucial gene bank for species within China’s terrestrial freshwater ecosystems [17]. During years of extreme drought, water recession occurs earlier than average, prompting early vegetation growth on the Poyang Lake shoals [18], resulting in a notable increase in the lake’s biomass density, with the vegetation density exceeding normal levels [19]. Typically, as extreme climate events become increasingly common, vegetation growth suppression can lead to continuous vegetation cover loss [20]. During drought, vegetation function diminishes, and as the drought’s intensity increases, significant changes occur in both the vegetation’s function and structure [21]. Incidentally, ecosystems in areas dominated by dwarf vegetation experience faster development and higher stress [22]. Future droughts are expected to be more frequent, severe, and of longer duration than those in recent decades [23], with a non-linear increase in the frequency of severe droughts due to warming [24]. Current studies have predominantly observed the annual spatiotemporal characteristics of vegetation over long periods, with few studies focusing on monthly changes in wetland vegetation. This approach may overlook the sudden onset, rapid escalation, and abrupt end of droughts [25,26]. The exact timing and conditions under which a sudden shift in vegetation greenness occurs remain unclear. Observing the spatiotemporal characteristics of wetland vegetation at shorter intervals may address this limitation.
To date, several studies have focused on drought thresholds [27,28,29]. A threshold is a characteristic turning point at which features undergo qualitative changes when values fall below or above the threshold. Against the backdrop of the increased sensitivity of global vegetation productivity to drought, shortened response times [30], and intensified drought severity in low-frequency areas [31], it remains unclear how extreme drought impacts wetland vegetation and the key factors most significantly affecting wetland vegetation and its thresholds. To address these issues, we referred to related research [32,33] and selected the mean normalised difference vegetation index (NDVI) as a proxy indicator for vegetation, using its average value to characterise vegetation greenness. This study was divided into three parts. First, we calculated the standardised precipitation evapotranspiration index (SPEI) for the Poyang Lake Basin based on the collected and processed data and analysed the trend of drought occurrence in the basin. Second, we examined the spatiotemporal characteristics of the wetland vegetation over the past 3 years. Third, the relationship between drought and wetland vegetation was explored, identifying thresholds that cause abrupt changes in the Poyang Lake Wetland vegetation through linear and non-linear regression analyses. This study aimed to answer three questions: what are the spatiotemporal characteristics of the vegetation in the Poyang Lake wetlands? How does extreme drought affect the vegetation in the Poyang Lake Wetland? What are the main factors affecting vegetation changes in the Poyang Lake wetlands and their thresholds?

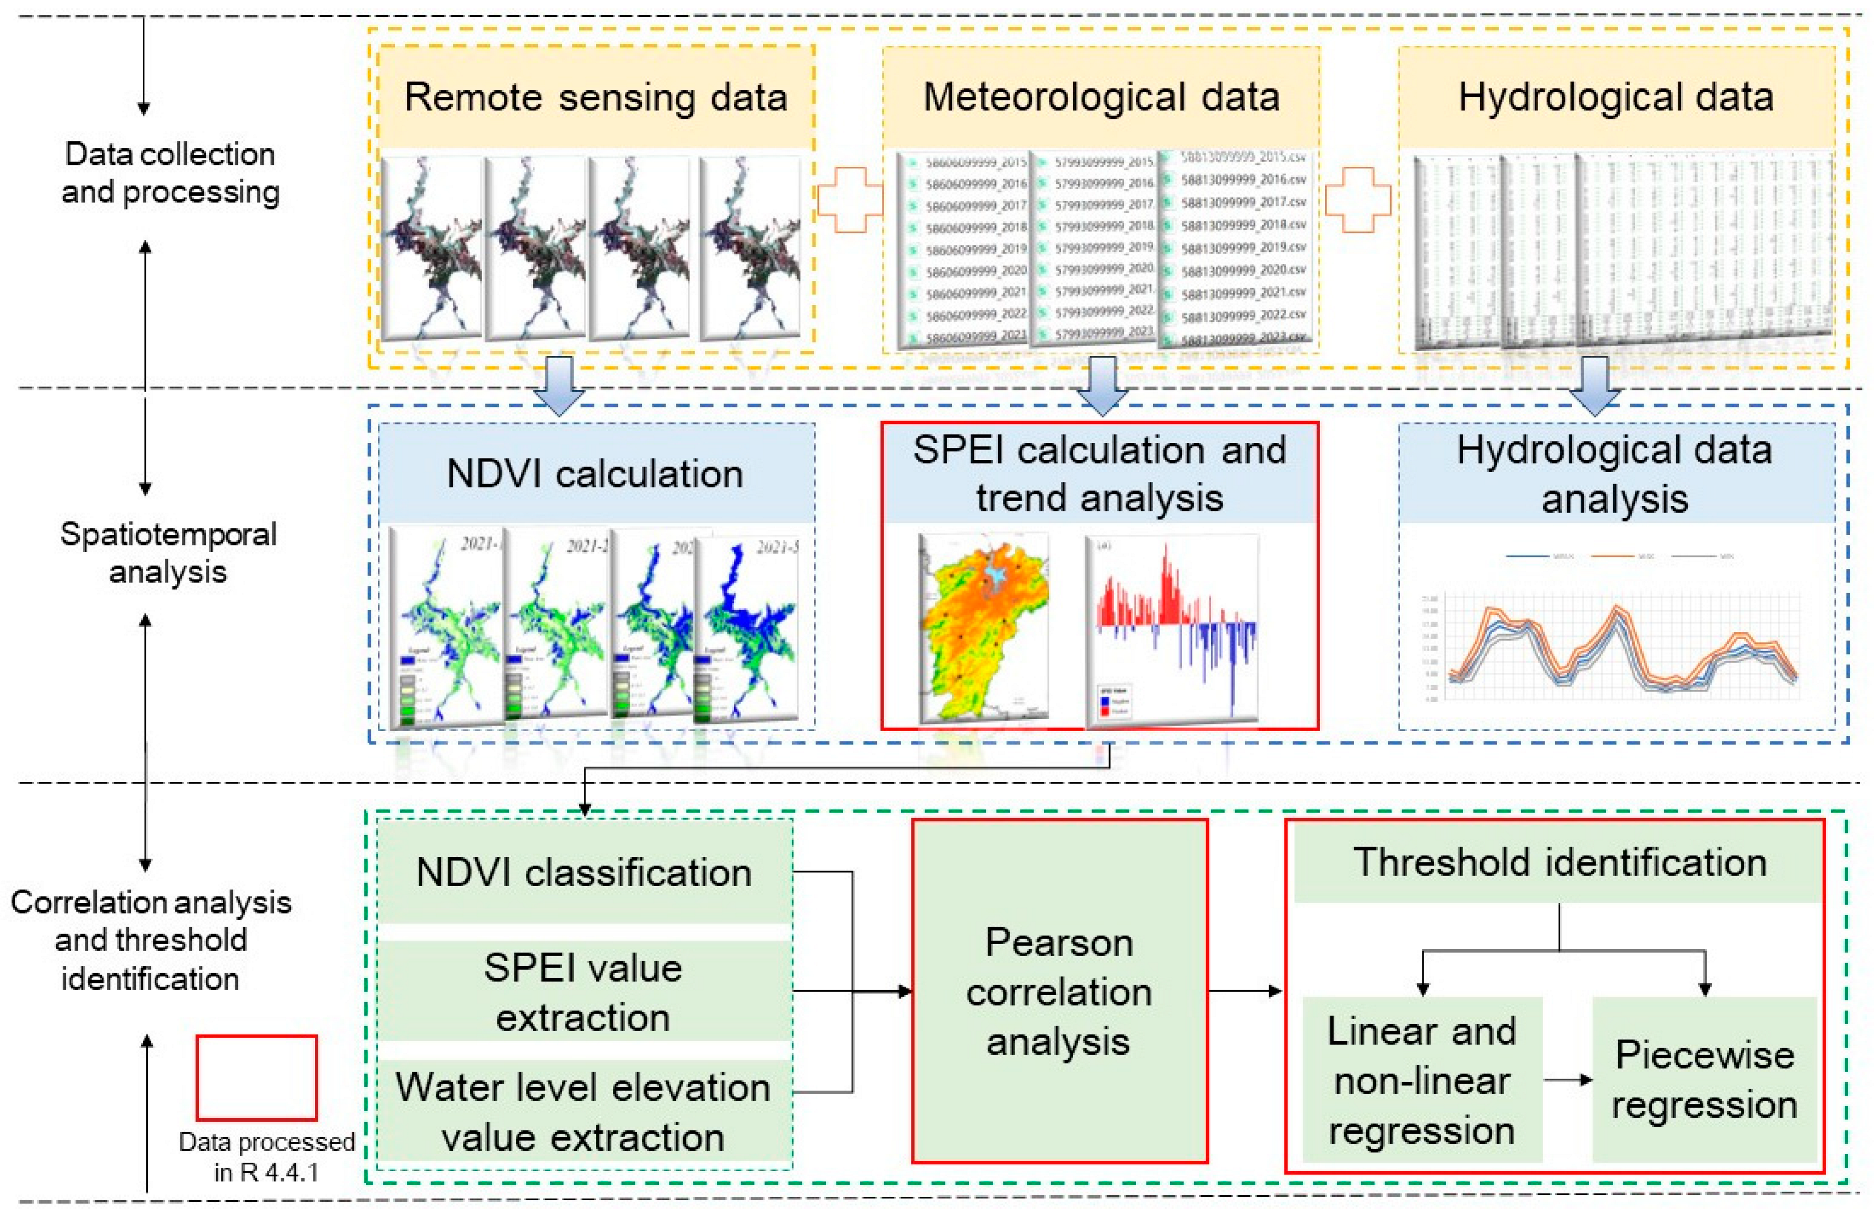
2. Data and Methodology
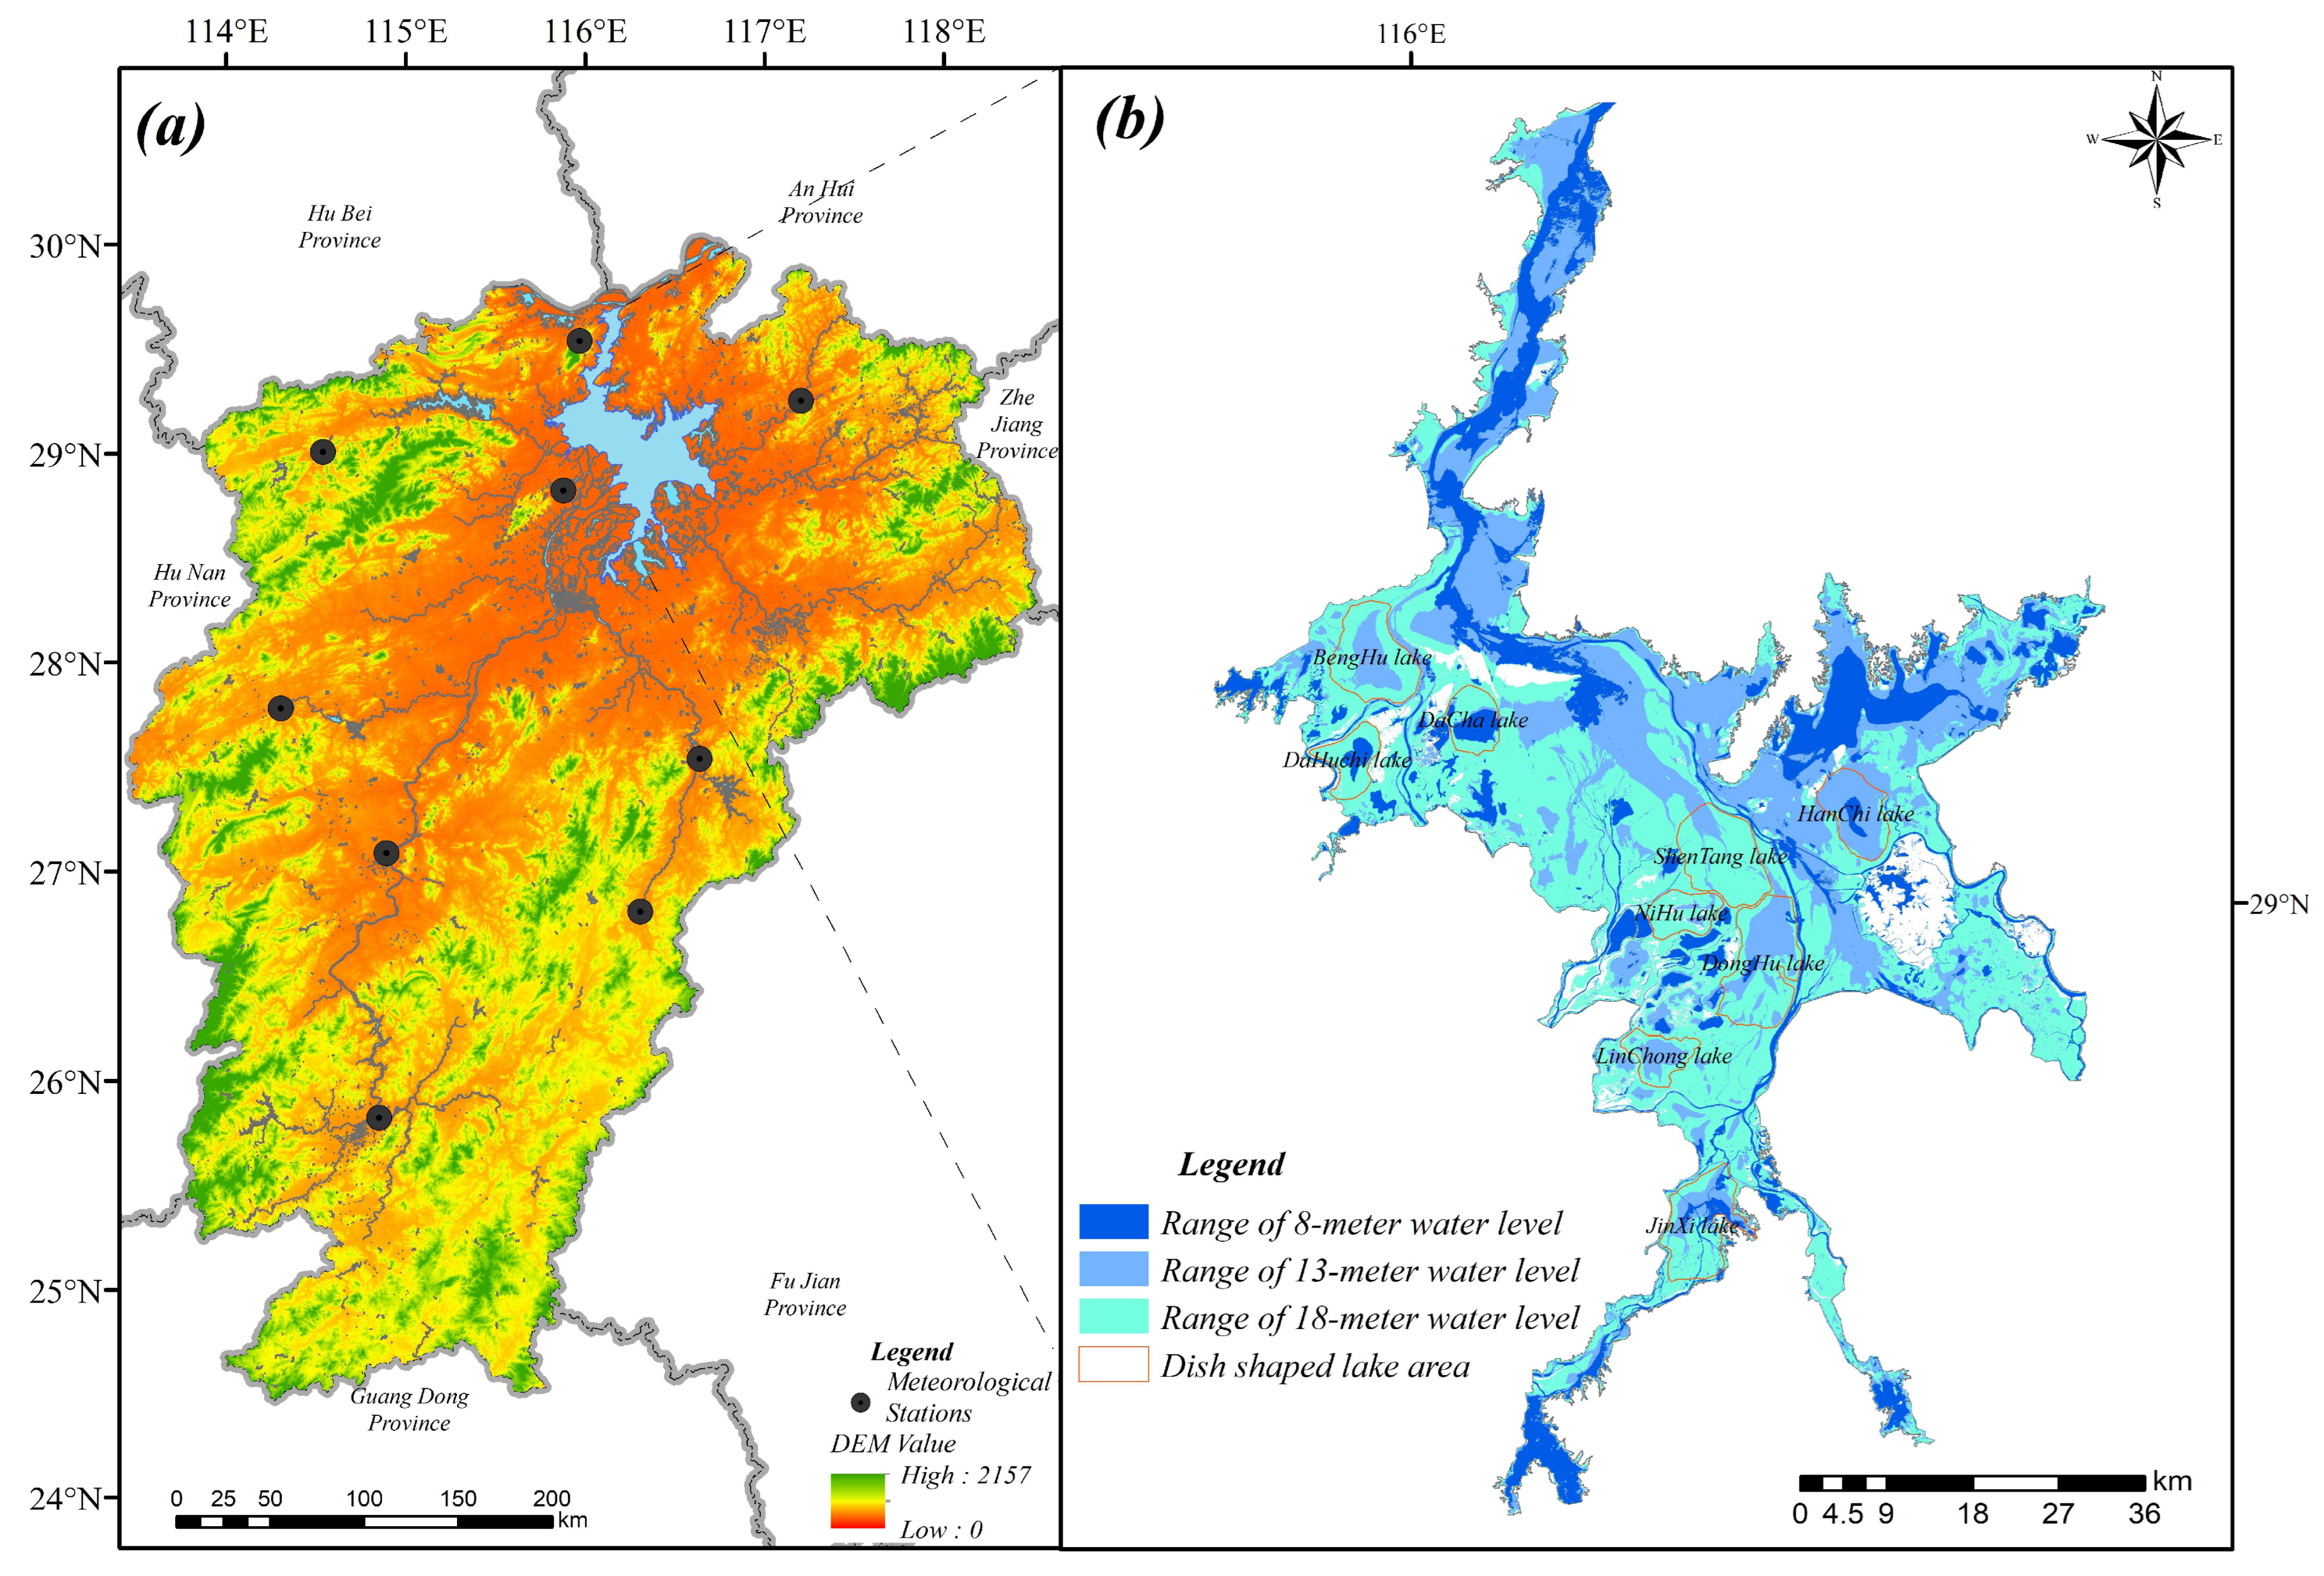
2.1. Research Area

Poyang Lake is located in a subtropical, moist monsoon climate zone on the southern banks of the middle and lower reaches of the Yangtze River, China. It spans from 28°24′ to 29°46′ N and from 115°49′ to 116°46′ E in the northern part of Jiangxi Province (Figure 1). The lake receives water from five major rivers: the Ganjiang, Fuhe, Xinjiang, Raohe, and Xiuhe. It discharges into the Yangtze River through Hukou in the north, forming a complex relationship with the Yangtze River, characterised by out-flows, backwaters, and reverse flows. Poyang Lake is a typical seasonally important lake with a unique morphology described as “high-water lake, low-water river”. The lake stretches up to 173 km from north to south and is 74 km wide from east to west, with an average maximum lake area of 2818 km2 over the years [34]. Carex species are the dominant vegetation in Poyang Lake, covering the largest area and accounting for 16.4% of the total wetland area [35].Influenced by land use practices and hydrological connectivity, the wetland area of Poyang Lake decreased from 5024.3 km2 in the 1930s to 3232.7 km2 in the 2010s [36]. The multi-year average temperature of Poyang Lake ranges from 16.5 to 17.8 °C, with an annual precipitation of 1542 mm. According to water level data from the Xingzi station, which represents the lake’s water level, the average annual water level from 2020 to 2023 was 12.18 m. In 2022, the historical lowest water level was recorded at 4.79 m, which is 7.88 m lower than the average water level on the same day for many years [9], showing a significant decrease in precipitation and flow compared with historical averages, leading to a phenomenon known as “flood season drought” [19].

2.2. Data Sources

Meteorological data were sourced from the National Oceanic and Atmospheric Administration (https://www.ncei.noaa.gov/ (accessed on 25 April 2024)), and nine weather stations within Jiangxi Province were selected, as shown in Figure 1. The meteorological data included the daily precipitation and the average, maximum, and minimum daily temperatures from 1995 to 2023. Hydrological data were obtained from the Jiangxi Provincial Hydrological Monitoring Center (http://weixin.jxsswj.cn/jxsw/v2/pyhRiverList.html (accessed on 1 January 2021 to 1 January 2024)). Monthly Sentinel-2 remote sensing data were acquired from the Copernicus Data Space Ecosystem (https://dataspace.copernicus.eu/ (accessed on 24 May 2024)) and filtered according to the criteria of “cloud cover <20%, time period from 1 January 2021 to 31 December 2023, and product level L2A”. Thirty images meeting these criteria were selected. The Sentinel-2 L2A image preprocessing, including mosaicking, band fusion, and clipping, was conducted using ENVI 5.6 (Harris Geospatial Solutions, Broomfield, CO, USA).
The water submergence range and corresponding water levels were matched [37] with water levels at the Xingzi station on Poyang Lake, classified as extremely low at 8 m, normal at 13 m, and high at 18 m (Wusong Elevation) [38]. Based on the historical water level data and corresponding remote sensing images (Table 1), the normalised difference water index was used to extract the ranges representing the water levels at 8, 13, and 18 m (Figure 1).

2.3. Methods

2.3.1. SPEI

SPEI is an index that normalises the cumulative probability distribution of the difference between precipitation and potential evapotranspiration (PET) [39]. It is used to analyse and monitor drought and was first proposed by Vicente-Serrano [40] and later improved by Beguería et al. [41]. The present study follows the methodology outlined by Beguería et al. [41] to determine SPEI, utilising the “SPEI” package in R 4.4.1 (R Foundation for Statistical Computing, Vienna, Austria) for computation. Because this study analysed interannual drought variability, the SPEI at a 1-month timescale was selected for calculation.

2.3.2. Trend Analysis

The Theil–Sen estimator, also known as the Sen slope, is a non-parametric statistical method that calculates the slopes of all the point pairs in a sample and selects the median of these slopes to obtain a robust estimate [42]. A negative value of the Sen slope indicates a downward trend, whereas a positive value indicates an upward trend. This study used this method to study the SPEI trends using the following calculation formula:
S = m e d i a n x j x i j i ( 1 < i < j < n )
where S represents the Sen’s trend, and xj and xi are the SPEI values at the times i and j in the time series, respectively.
The Mann–Kendall test was used to determine whether a time series exhibited an upward or downward trend. Since the Mann–Kendall test does not require data auto-correlation or normal distribution, it is widely used for the non-parametric testing of hy-drometeorological trends [43,44]. A positive value of the Mann–Kendall statistic Z indicates an upward trend, whereas a negative value indicates a downward trend. Typically, the Theil–Sen estimator and the Mann–Kendall test are combined to assess long-term data trends [39,44,45]. This study utilised the “Kendall” package in R 4.4.1 for the related calculations, adopting a 99% confidence level for all results.

2.3.3. Threshold Identification

The generalised additive model (GAM) was first introduced by Hastie and Tibshirani [46] as an extension of generalised linear models. It involves fitting some covariates linearly and others with smooth functions, thereby addressing the non-linear relationships between variables and predictors [47,48]. The formula is as follows:
g μ i = X i θ + f i x 1 i + f 2 x 2 i + + f j x j i + ϵ i i = 1 n
where i represents the ith time, n is the observed time, j is the value of the variable, µi is the expected value of the corresponding variable, g(µi) is the link function, fj are smooth functions for the variables representing the complex relationship between independent and dependent variables, X i θ is the component of the fully parametric model, and ϵ i is the residual.
Piecewise regression is a common method for detecting thresholds [28,49,50]. To identify the thresholds of the variables affecting vegetation change in the Poyang Lake wetlands, we employed piecewise linear regression. This approach involves identifying linear change turning points over a long time series and uses linear models to fit the data before and after these turning points [49]. The formula is as follows:
y t = a 0 + b 1 x t + ε         x t j a 0 + b 1 x t + b 2 x t j + ε    x t > j
where y t is the vegetation index value, x t is the dependent variable at t time, j is the time point of the y t abrupt change, b 1 and b 2 are regression coefficients, a 0 is the fitting intercept, and ε is the fitting residual. The trend of y t before the abrupt point is b 1 , and the trend after the abrupt point is b1 + b2.
This study used the “gam” function from the “mgcv” package in R 4.4.1 for the linear and non-linear regressions (including the quadratic and GAM regressions). The “segmented” function from the “segmented” package was then used for a piecewise regression to identify thresholds.
The data processing and analyses in this study were carried out according to Figure 2.

3. Results

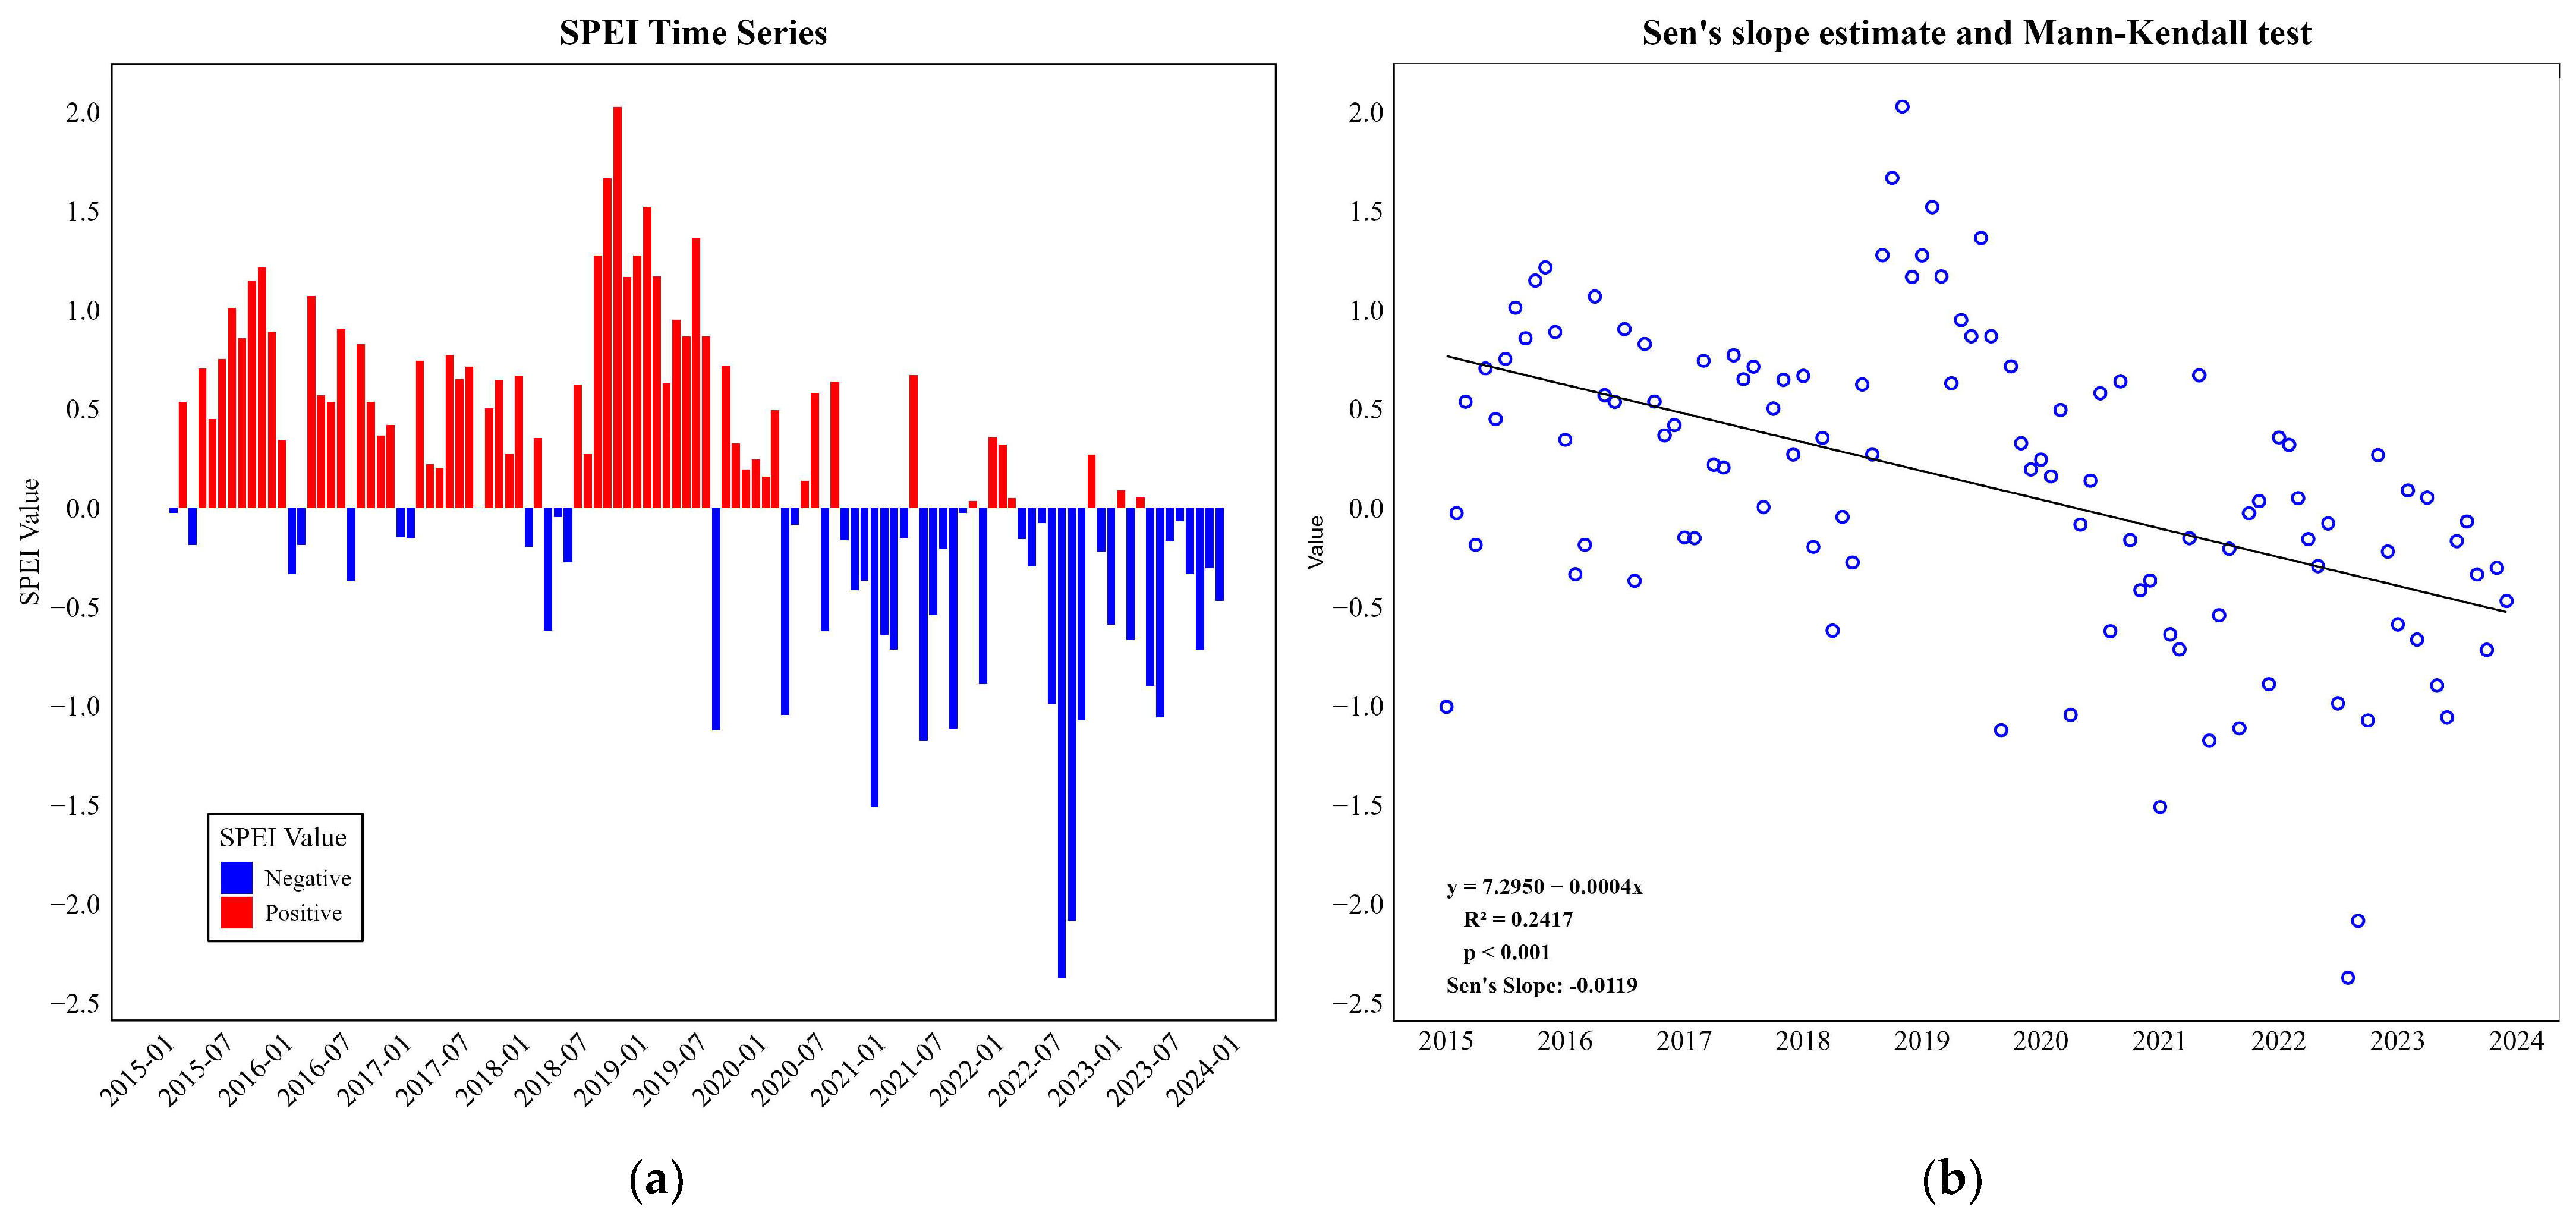
3.1. The SPEI Trend Analysis in the Poyang Lake Basin

The average SPEI values from the nine stations were used to represent the drought conditions in the Poyang Lake Basin. According to existing classification standards [39], Poyang Lake has experienced alternating dry and wet periods over the past decade (Figure 3a). From 2015 to 2020, the region was in an overall wet state, with 5 months of SPEI values below −0.5. In contrast, from 2021 to 2023, Poyang Lake was primarily affected by drought, with 16 months of SPEI values below −0.5. In 2022, the basin experienced extreme drought, characterised by a “dry spell during the flood season”. In August, Jiangxi Province rapidly transitioned from moderate to extreme drought (SPEI = −2.37), continuing into September. The intensity of the drought decreased thereafter and returned to near-normal levels by November. The Sen’s trend analysis and the Mann–Kendall tests on the SPEI (Figure 3b) indicate a declining trend in the monthly SPEI for the Poyang Lake Basin from 2015 to 2023. Both the Sen’s slope and the Z value from the Mann–Kendall test were negative, suggesting a trend towards increasing drought in the Poyang Lake Basin, which is consistent with other research findings [34,51].
This analysis shows that drought conditions in the Poyang Lake Basin will deteriorate from 2021 to 2023. Figure 4 presents a detailed analysis of the trends in the SPEI and water level changes. The fluctuating SPEI curve indicates frequent alternations between wet and dry periods in Poyang Lake. Notably, in July 2021 and September 2022, the SPEI values changed by 1.5 units, transitioning to moderate and extreme drought states, respectively. The water level at the Poyang Lake Xingzi station (Wusong elevation) experienced two peaks in 2021 and 2023. In June 2022, the water level peaked before declining sharply, falling below the 8 m mark by November. The water level in 2023 was lower than that in the previous 2 years.
Overall, the trends in the SPEI and the water level changes were not entirely consistent. However, from January to May 2021, both the SPEI and the water level showed upward trends, indicating increased wetness in the Poyang Lake Basin. Subsequently, while Poyang Lake maintained high water levels, the basin experienced drought, revealing desynchronisation between the two indicators. From June to August 2022, the SPEI and the water level changes followed a similar pattern, with a rapid transition from normal conditions to extreme drought and water levels dropping sharply from 18 to 10 m. Notably, the water level did not reach its lowest point when the SPEI reached its minimum value, indicating that the water level changes lagged slightly behind the SPEI. By comparing the onset of hydrological drought, marked by the water levels dropping below the extremely low threshold in September, with the onset of meteorological drought in August, it is evident that meteorological drought occurred earlier and lasted for a shorter duration, whereas hydrological drought was delayed and persisted longer. This observation highlights a lag effect between meteorological and hydrological droughts [52,53]. From November 2022 to May of the following year, the overall state of the Poyang Lake Basin was wet, but at this time, Poyang Lake was in a low water state. Due to the joint influence of the five lakes in Jiangxi and the Yangtze River, when the upstream water flow in the Yangtze River decreased, the difference in water levels between the river and Poyang Lake may have led to drainage effects on Poyang Lake [34].

3.2. The Analysis of the Spatiotemporal Characteristics of Vegetation in Poyang Lake Wetlands

From 2021 to 2023, as the drought conditions intensified and the water levels fluctuated dramatically in Poyang Lake, a further analysis of the spatiotemporal characteristics of vegetation in the Poyang Lake wetlands was conducted based on the reciprocal relationship between wetland vegetation and water bodies. After excluding water bodies, the average NDVI values from 2021 to 2023 were calculated, resulting in a continuous 3-year curve of the NDVI_MEAN changes within the wetland area. Additionally, the areas with NDVI > 0 were extracted, and their extents were measured.
Overall, the NDVI > 0 change curve exhibited a trend entirely opposite that of the NDVI_MEAN curve (Figure 5). In 2021, the NDVI curve displayed dual peaks, reaching maxima in May and September, with the NDVI value in May being higher than that in September. This confirmed that the wetland vegetation experienced two growth periods during that year [18]. From January to May, as the water level increased and the Poyang Lake Basin became wetter, the wetland vegetation underwent rapid growth, with the NDVI values increasing to 0.39. However, in June, the NDVI_MEAN decreased by 0.1 units compared with that in the previous month, and the area with the NDVI > 0 reached its minimum, indicating that although most of Poyang Lake was submerged at this time, the vegetation in the unsubmerged areas remained very dense.
From July 2022 to January 2023, the NDVI_MEAN for the vegetation in the Poyang Lake wetlands continued to decline. In August 2022, the NDVI_MEAN decreased by 0.1 units compared with that in July, while the area with the NDVI > 0 sharply expanded from 291.65 to 2542.07 km2. This indicated a rapid shrinkage of the water area in Poyang Lake and a swift expansion of the wetland vegetation area, although vegetation greenness was significantly affected. However, as the water level in Poyang Lake decreased and the transition from flood to drought occurred rapidly, the NDVI_MEAN did not reach an extreme minimum value. This is possibly because wetland vegetation is resilient and responds slowly to drought conditions [54]. Notably, the dominant species in the region, the Carex species, benefits from its robust root system, which provides strong regeneration capabilities and significant adaptability to water level fluctuations. It can withstand prolonged flooding during wet periods and sprout again after the water recedes in autumn [55]. Vegetation can adjust its water-use strategies by utilising the moisture stored deep in saturated soils, rocks, and groundwater to adapt to drought [56], experiencing a series of resistance, adaptation, or delay responses to water deficits [57,58].
In April 2023, the NDVI_MEAN suddenly increased to 0.30, rising by 0.15 units, and maintained this level until September, with the area of the NDVI > 0 stabilising between 1500 and 2000 km2. This indicates that under normal meteorological conditions, with the water level maintained at 11–13 m, the vegetation in the Poyang Lake wetlands experienced a longer growth period. However, as the water level dropped closer to the 8 m mark, the NDVI_MEAN fell to its lowest value in the year, and the area with the NDVI > 0 returned to levels comparable to those observed in March.
The NDVI was categorised into six levels for area statistics: NDVI < 0, 0–0.2, 0.2–0.4, 0.4–0.6, 0.6–0.8, and 0.8–1 (Figure 6). From 2021 to 2023, the vegetation area of the Poyang Lake wetlands was primarily dominated by the NDVI_0–0.2 and NDVI_0.2–0.4 categories, with the largest area being NDVI_0–0.2 (28,004.05 km2), followed by NDVI_0.2–0.4 (16,922.94 km2) and NDVI_0.4–0.6 (11,879.92 km2). During the flood seasons of 2020 and 2022, the areas of NDVI_0–0.2, NDVI_0.2–0.4, and NDVI_0.4–0.6 all dropped to their annual minimum values due to flooding. After July 2022, the areas of NDVI_0–0.2 and NDVI_0.2–0.4 showed an upward trend, with NDVI_0–0.2 covering the widest area and reaching its maximum value in January 2023 (2525.69 km2). Meanwhile, the area of NDVI_0.4–0.6 gradually decreased, indicating that despite the expansion of wetland vegetation after extreme drought, the area of lush vegetation shrank due to continued drought. In 2023, with minimal water level fluctuations from April to September, the area of NDVI_0.4–0.6 in the Poyang Lake wetlands remained around 600 km2, consistently exceeding that of NDVI_0–0.2 each month, indicating continuous vegetation growth during this period.
The spatiotemporal distribution characteristics of the vegetation in the Poyang Lake wetlands are shown in Figure 7. Vegetation in the Poyang Lake wetlands gradually increased from January to May, with dense vegetation growth. In Donghu and Banghu, the typical saucer-shaped lakes, the vegetation reached high greenness levels (NDVI values in the range of 0.6–0.8) in March 2021. As the water level increased, the wetland vegetation became progressively fragmented by water bodies. When the water area expanded further, only higher elevation areas, such as Songmen Island, retained their vegetation. Although the wetland vegetation area further shrank in May, it achieved the highest greenness level within its range. From July to December, when the water level dropped and the sandbanks were exposed, the vegetation experienced a new growth phase. During August and September 2022, despite the extreme drought in the Poyang Lake wetlands, the vegetation greenness in Donghu and Banghu remained high, with Banghu maintaining high greenness levels for a longer period (4 months), indicating that the wetland vegetation in these two saucer-shaped lakes had strong resilience to drought. After experiencing extreme drought in 2022, the greenness levels of the vegetation in November and December were lower than those of the previous 2 years. The greenness of the vegetation in the spring of the following year was also lower than that of the same period in previous years. This may be due to the residual effects of severe droughts [7].

3.3. The Correlation Analysis and Threshold Identification

The heatmap (Figure 8) shows no significant correlation between the SPEI and the water level or the vegetation index. Examining the correlation coefficient between the water level and the vegetation index revealed that as the water level rose, the area of wetland vegetation showed the opposite trend, while it remained positively correlated with the greenness of the wetland vegetation. The wetland vegetation with NDVI values in the range of 0–0.2 was most sensitive to fluctuations in water level, with a correlation coefficient of −0.89 (p < 0.001), followed by the vegetation with NDVI values in the range of 0.2–0.4. The relationship between the Poyang Lake wetland vegetation and the water level can be summarized as: “as water recedes, grass advances”. NDVI value ranging from 0 to 0.2 indicate sparse vegetation cover, primarily found in mudflats or at the leading edge of wetland zones. Due to their lower elevations, these areas are highly susceptible to inundation and are therefore most sensitive to fluctuations in water levels. Thus, wetland vegetation with lower NDVI value responds more significantly to changes in water levels compared to areas with higher vegetation cover. This indicates that the water level was the dominant factor affecting changes in the Poyang Lake Wetland vegetation. The water level of Poyang Lake is influenced by the climate, the hydrology of the five rivers, the Yangtze River, and basin management [59]. Among these factors, the impact of the Three Gorges Dam on flow changes in the Yangtze River affecting Poyang Lake far exceeds that of seasonal lake droughts [60]. This not only affects the water balance of Poyang Lake [61], alters the seasonal pattern of water flow [62], and accelerates the pace of hydrological changes [63] but also causes abnormally low water levels in Poyang Lake in October [16], potentially exacerbating drought conditions and altering the frequency of classified droughts [14].
Based on the results of the correlation analysis, we further examined the relationship between the vegetation and the water level using linear, quadratic, and GAM regressions and determined the best-fit model using the Akaike information criterion (AIC). From the results, the non-linear regressions performed better than the linear regressions for these variables, indicating the existence of thresholds [29]. This study employed piecewise regression to identify the thresholds at which the water level affects wetland vegetation. Our results indicated that when the water level reached 12 m, area 1 (NDVI > 0) (Figure 9a) and area 2 (NDVI 0–0.2) (Figure 9b) underwent abrupt changes, with the area of the NDVI in the range of 0–0.2 shifting from decline to stabilisation. At a water level of 10 m, the area with the NDVI in the range of 0.2–0.4 ((Figure 9c) gradually decreased. At a water level of 14 m, the greenness value of the Poyang Lake Wetland vegetation gradually decreased (Figure 9d). A 2 m water level difference between areas 2 and 3 indicated that at water levels exceeding 10 m, the area of higher greenness value wetland vegetation shrank, while a large area of low greenness value wetland vegetation remained. A 2 m water level difference between area 2 and the mean NDVI value was also observed; within the 12–14 m water level range, although the area of Poyang Lake Wetland vegetation decreased, its greenness value continuously increased, suggesting that the vegetation was in a growth phase. However, beyond the 14 m water level, the wetland vegetation may have experienced a functional decline due to submergence. Our findings indicate that a water level of 14 m can be considered as the ecological water level line for Poyang Lake, which is consistent with existing research [64].

4. Discussion

4.1. Spatial and Temporal Scales of Vegetation Response to Drought

This study found no significant correlation between the SPEI and the vegetation index, which could be related to scale issues. Due to the low density of meteorological stations, drought conditions on a global scale [54,65] are often assessed through spatial interpolation algorithms that average SPEI data from multiple grid points. Factors such as elevation [66] and regional differences [67] can cause local areas to diverge from the overall drought situation and severity, resulting in the emergence of local drought hotspots [68]. Furthermore, because lake wetlands have flood storage and drought prevention functions, they retain most of these functions until a critical water level is reached [69]. Therefore, the drought conditions within the Poyang Lake Wetland area may not correlate with those in the entire basin. To monitor local droughts on a small spatial scale, the Vegetation Health Index (VHI) [70,71] is an effective method. Additionally, combining a remote-sensing-based VHI with statistics-based meteorological data can enhance accuracy [6,72].
On a temporal scale, droughts primarily propagate through a long chain, involving meteorology, hydrology, agriculture, and groundwater [73]. The transmission time from meteorological to hydrological drought was 1 month, that from hydrological to soil drought was 2 months, and that from hydrological to vegetation drought was 2 to 3 months [70]. Regarding meteorological drought, when atmospheric vapour pressure deficit exceeds 3.5–4.0 kPa in high-latitude regions, the impact of droughts is exacerbated, reducing soil moisture and stomatal conductance, decreasing vegetation growth, leading to significant changes in vegetation productivity and thereby reducing the productivity of terrestrial ecosystems [74,75,76,77]. Because vegetation is extremely sensitive to soil moisture [78], when soil moisture falls below the critical threshold, it reduces evapotranspiration and increases heat emissions and surface temperature, making the air above the canopy drier and warmer [79], directly limiting leaf senescence dates [80]. Riparian plants in Poyang Lake grow along moisture gradients [81], and during non-flooding periods, vegetation can flexibly switch between different soil water sources according to the soil moisture content [82]. However, when the groundwater level was below 80 cm, growth was hindered by drought stress [83]. Moreover, when evaporation is limited by soil moisture, the atmospheric water supply is depleted, which can spread temporally and spatially [84].

4.2. Lagged Impact of Extreme Drought on Vegetation Greenness

The current study found that changes in vegetation greenness did not always synchronise with drought trends. Vegetation exhibits a certain tolerance to variations in hydrological stress, achieving maximum ecosystem water-use efficiency as drought increases significantly [3] and showing the strongest physiological downregulation at this time [54]. For example, when the Carex species is subjected to drought stress, it will shift towards lower elevations to adapt to the arid environment [64]. This is primarily because vegetation transports soil moisture to the canopy via the xylem, thereby avoiding damage from drought. However, exceeding the hydraulic threshold of vegetation can lead to vegetation death [85]. Owing to physiological damage during periods of extreme drought [7], vegetation functions are more or less impaired. Even after water scarcity ceases, this does not signify that vegetation function has recovered, especially under extreme climate conditions, where the recovery time for vegetation function may be extended [86]. The present study used monthly intervals for the related research because the time required for ecosystem resilience to recover varies significantly with the duration and severity of drought [86]. Future research should investigate the timing of different types of drought transmission to vegetation and ecosystems within the Poyang Lake Wetland area at smaller temporal scales, as well as the physiological responses of vegetation to different types of drought. In addition to studying the flood tolerance of wetland vegetation, research should also be strengthened on the drought tolerance of various wetland plant species.

4.3. Impact of Water Level Fluctuation Thresholds on Vegetation

The water level threshold affecting the Poyang Lake Wetland vegetation may also represent the ecological water level line. Owing to the influence of long-term hydrological rhythms and the varying sensitivities of different vegetation types to moisture [87], the wetland vegetation in Poyang Lake shows adaptability to hydrological fluctuations within certain cycles [88]. This leads to the formation of concentric or arcuate spatial distribution patterns based on the proximity to the lake shore, elevation, and water level gradients [35,55]. Different vegetation types occupy distinct ecological niches within Poyang Lake, each with a specific water level threshold. For example, for grassland vegetation, when the Xingzi water level exceeded 14 m, the area of the Poyang Lake grasslands declined linearly with the water body [64]. Submerged plants, while able to survive under inundated conditions, experience significant physiological changes and tend toward decline under prolonged high-water stress [89]. This is especially true when the inundation depth exceeds the average, leading to changes in the relationship between biomass and inundation [90]. Recent frequent droughts, coupled with the construction of the Three Gorges Dam, have caused the continuous shrinkage of Poyang Lake, particularly during the dry season [91]. Low-elevation vegetation has expanded, while high-elevation vegetation has degraded, increasing the risk of the shrinkage and degradation of the Poyang Lake vegetation [92]. The distribution of the major vegetation types in Poyang Lake is shifting towards lower elevations, gradually evolving towards the lake centre [93]. The 11–12 m elevation downstream from the lake’s centre is the primary area for increases in vegetation area and NDVI accumulation [94]. Without water level management measures, the water level thresholds affecting the Poyang Lake Wetland vegetation may continue to decline in the future. This study only examined the relationship between vegetation greenness and water-level fluctuations, neglecting the impacts of inundation duration [95] and depth [90] on different vegetation types. Future research should emphasise the effects of the inundation status and depth in Poyang Lake and implement targeted hydrological management to safeguard wetland vegetation health and sustainability.

5. Conclusions and Outlook

This paper analyses the characteristics of hydrological changes against the backdrop of drought trends in the Poyang Lake basin, as well as the spatiotemporal features of wetland vegetation greenness. By employing correlation analyses and both linear and non-linear models, it identifies key factors and detects the thresholds impacting the vegetation greenness of the Poyang Lake wetlands. The main results are summarised below.
(1)
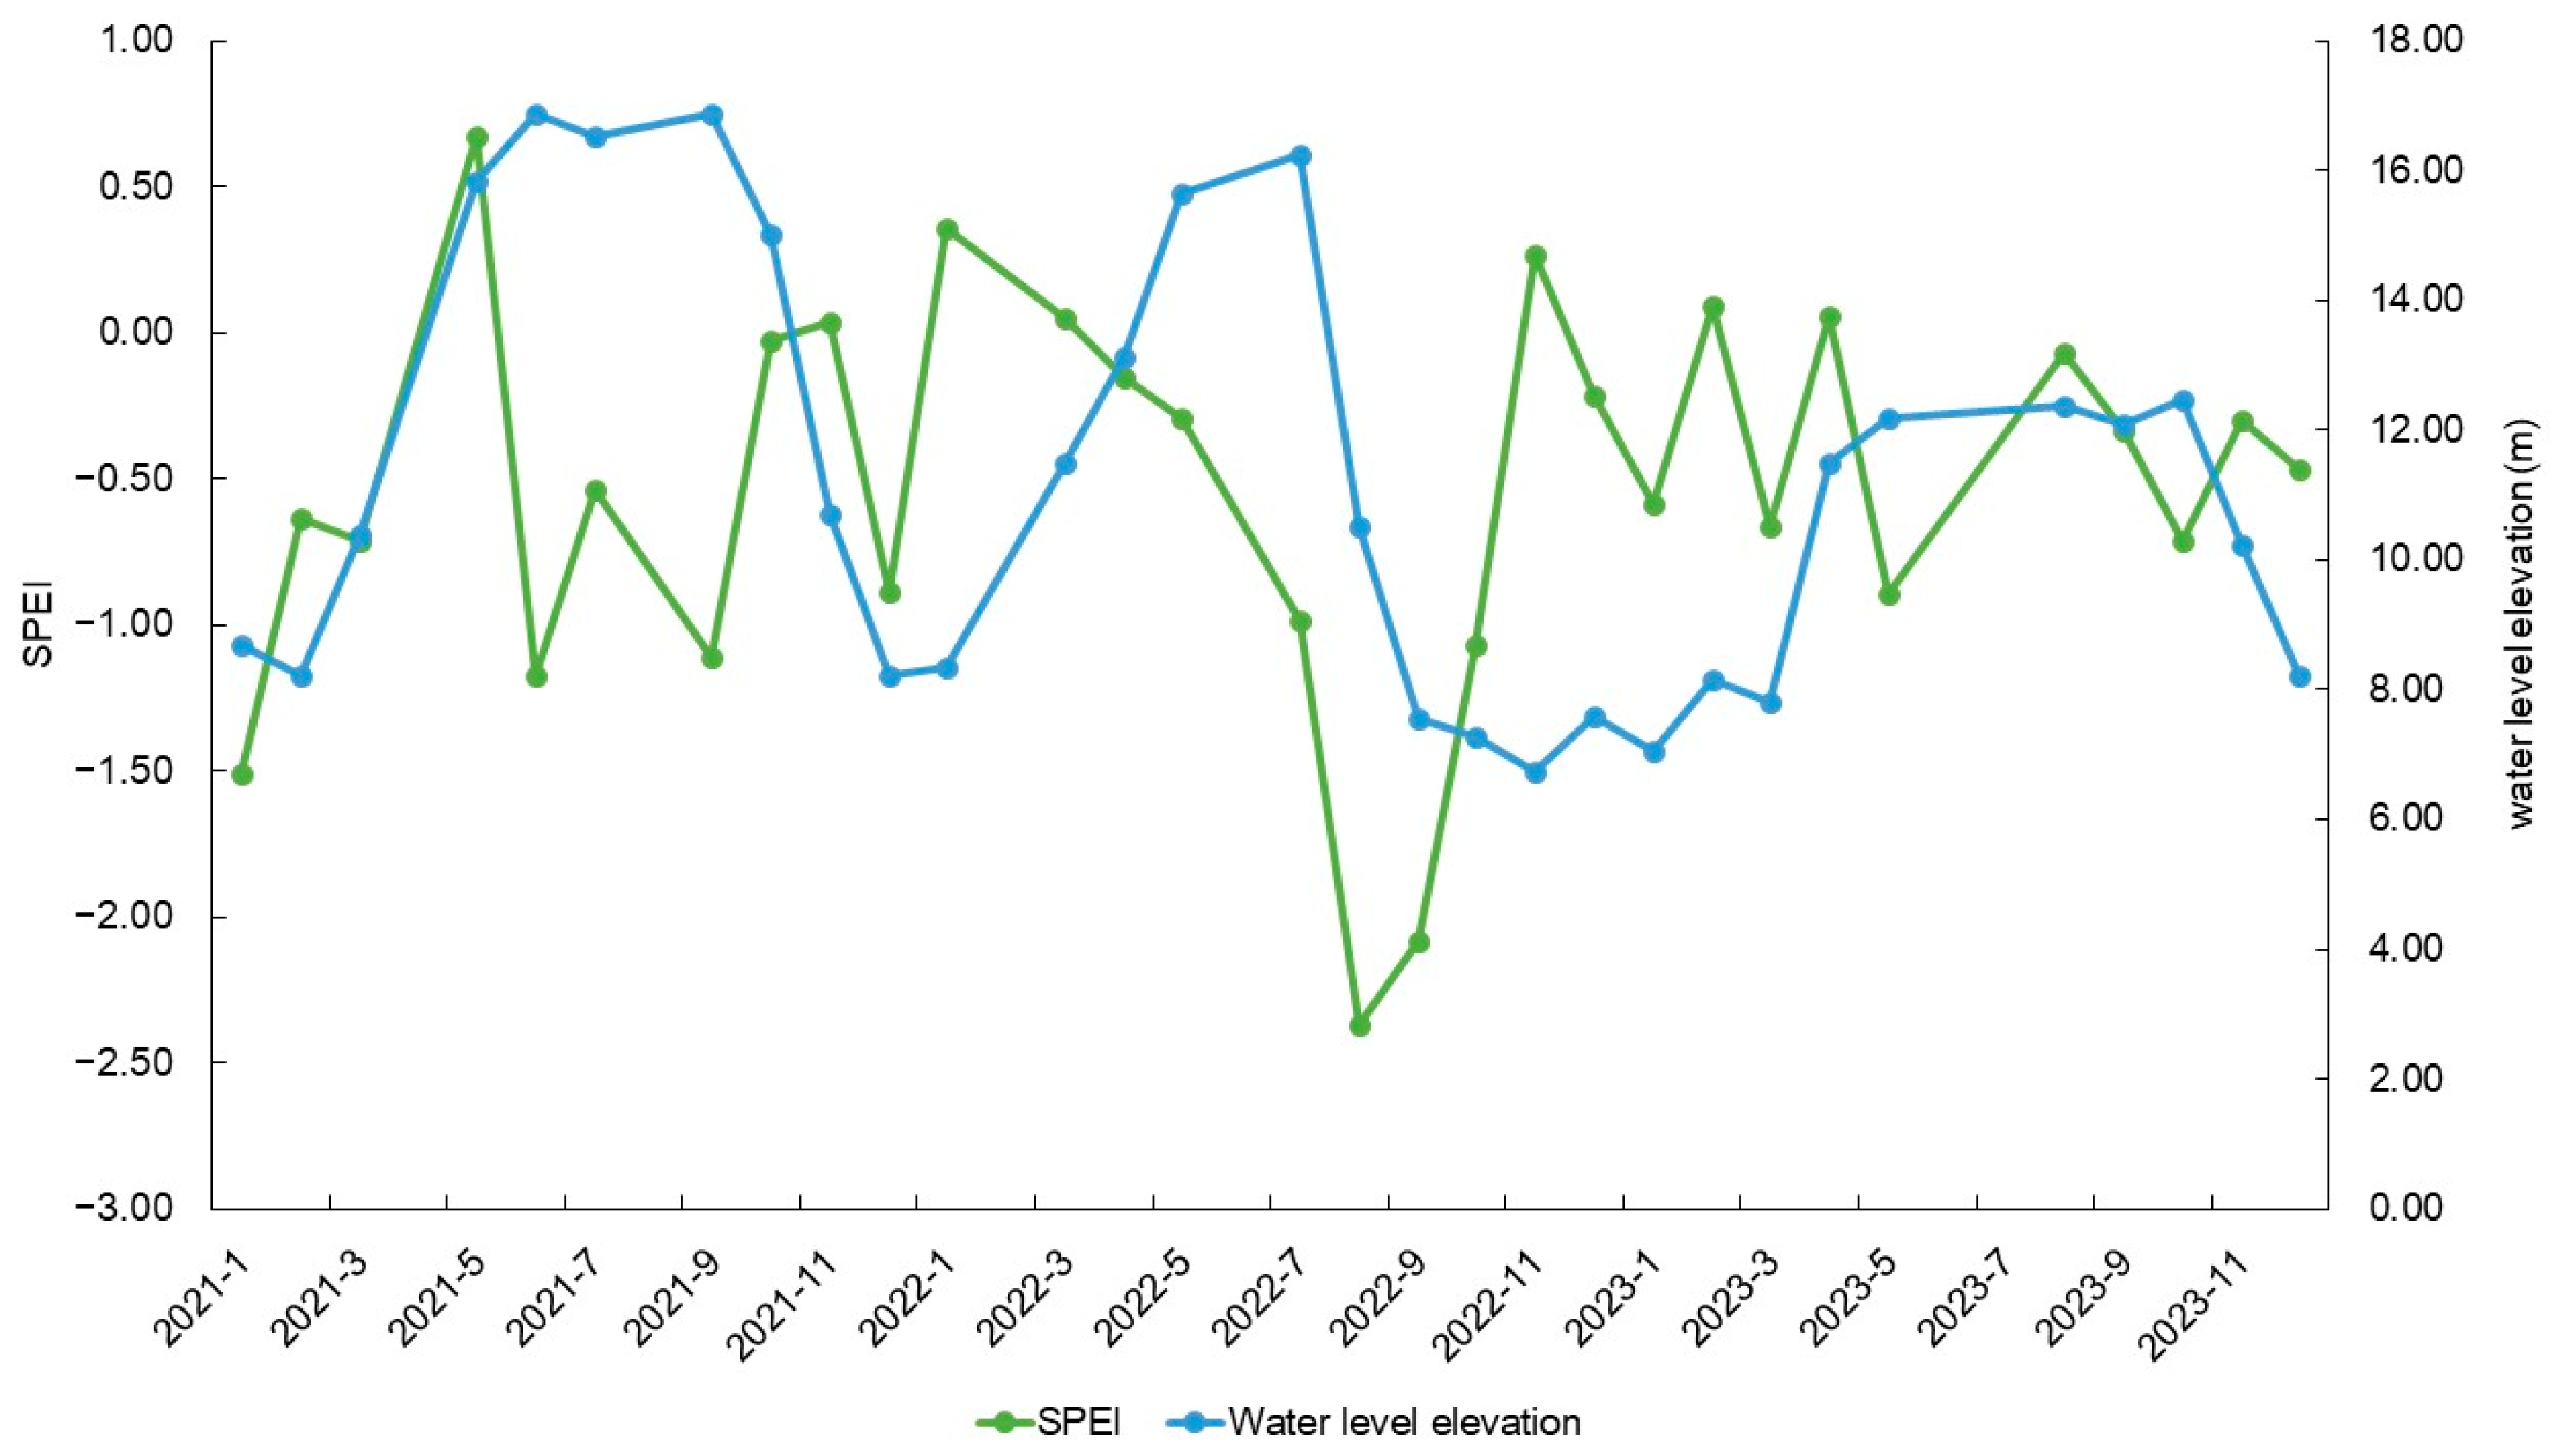
The drought conditions in Poyang Lake have worsened over the past 3 years, reaching an extreme state in August 2022. The SPEI and the water level trends were inconsistent; however, during rapid transitions between drought and flood, changes in the SPEI and the water levels were aligned.
(2)
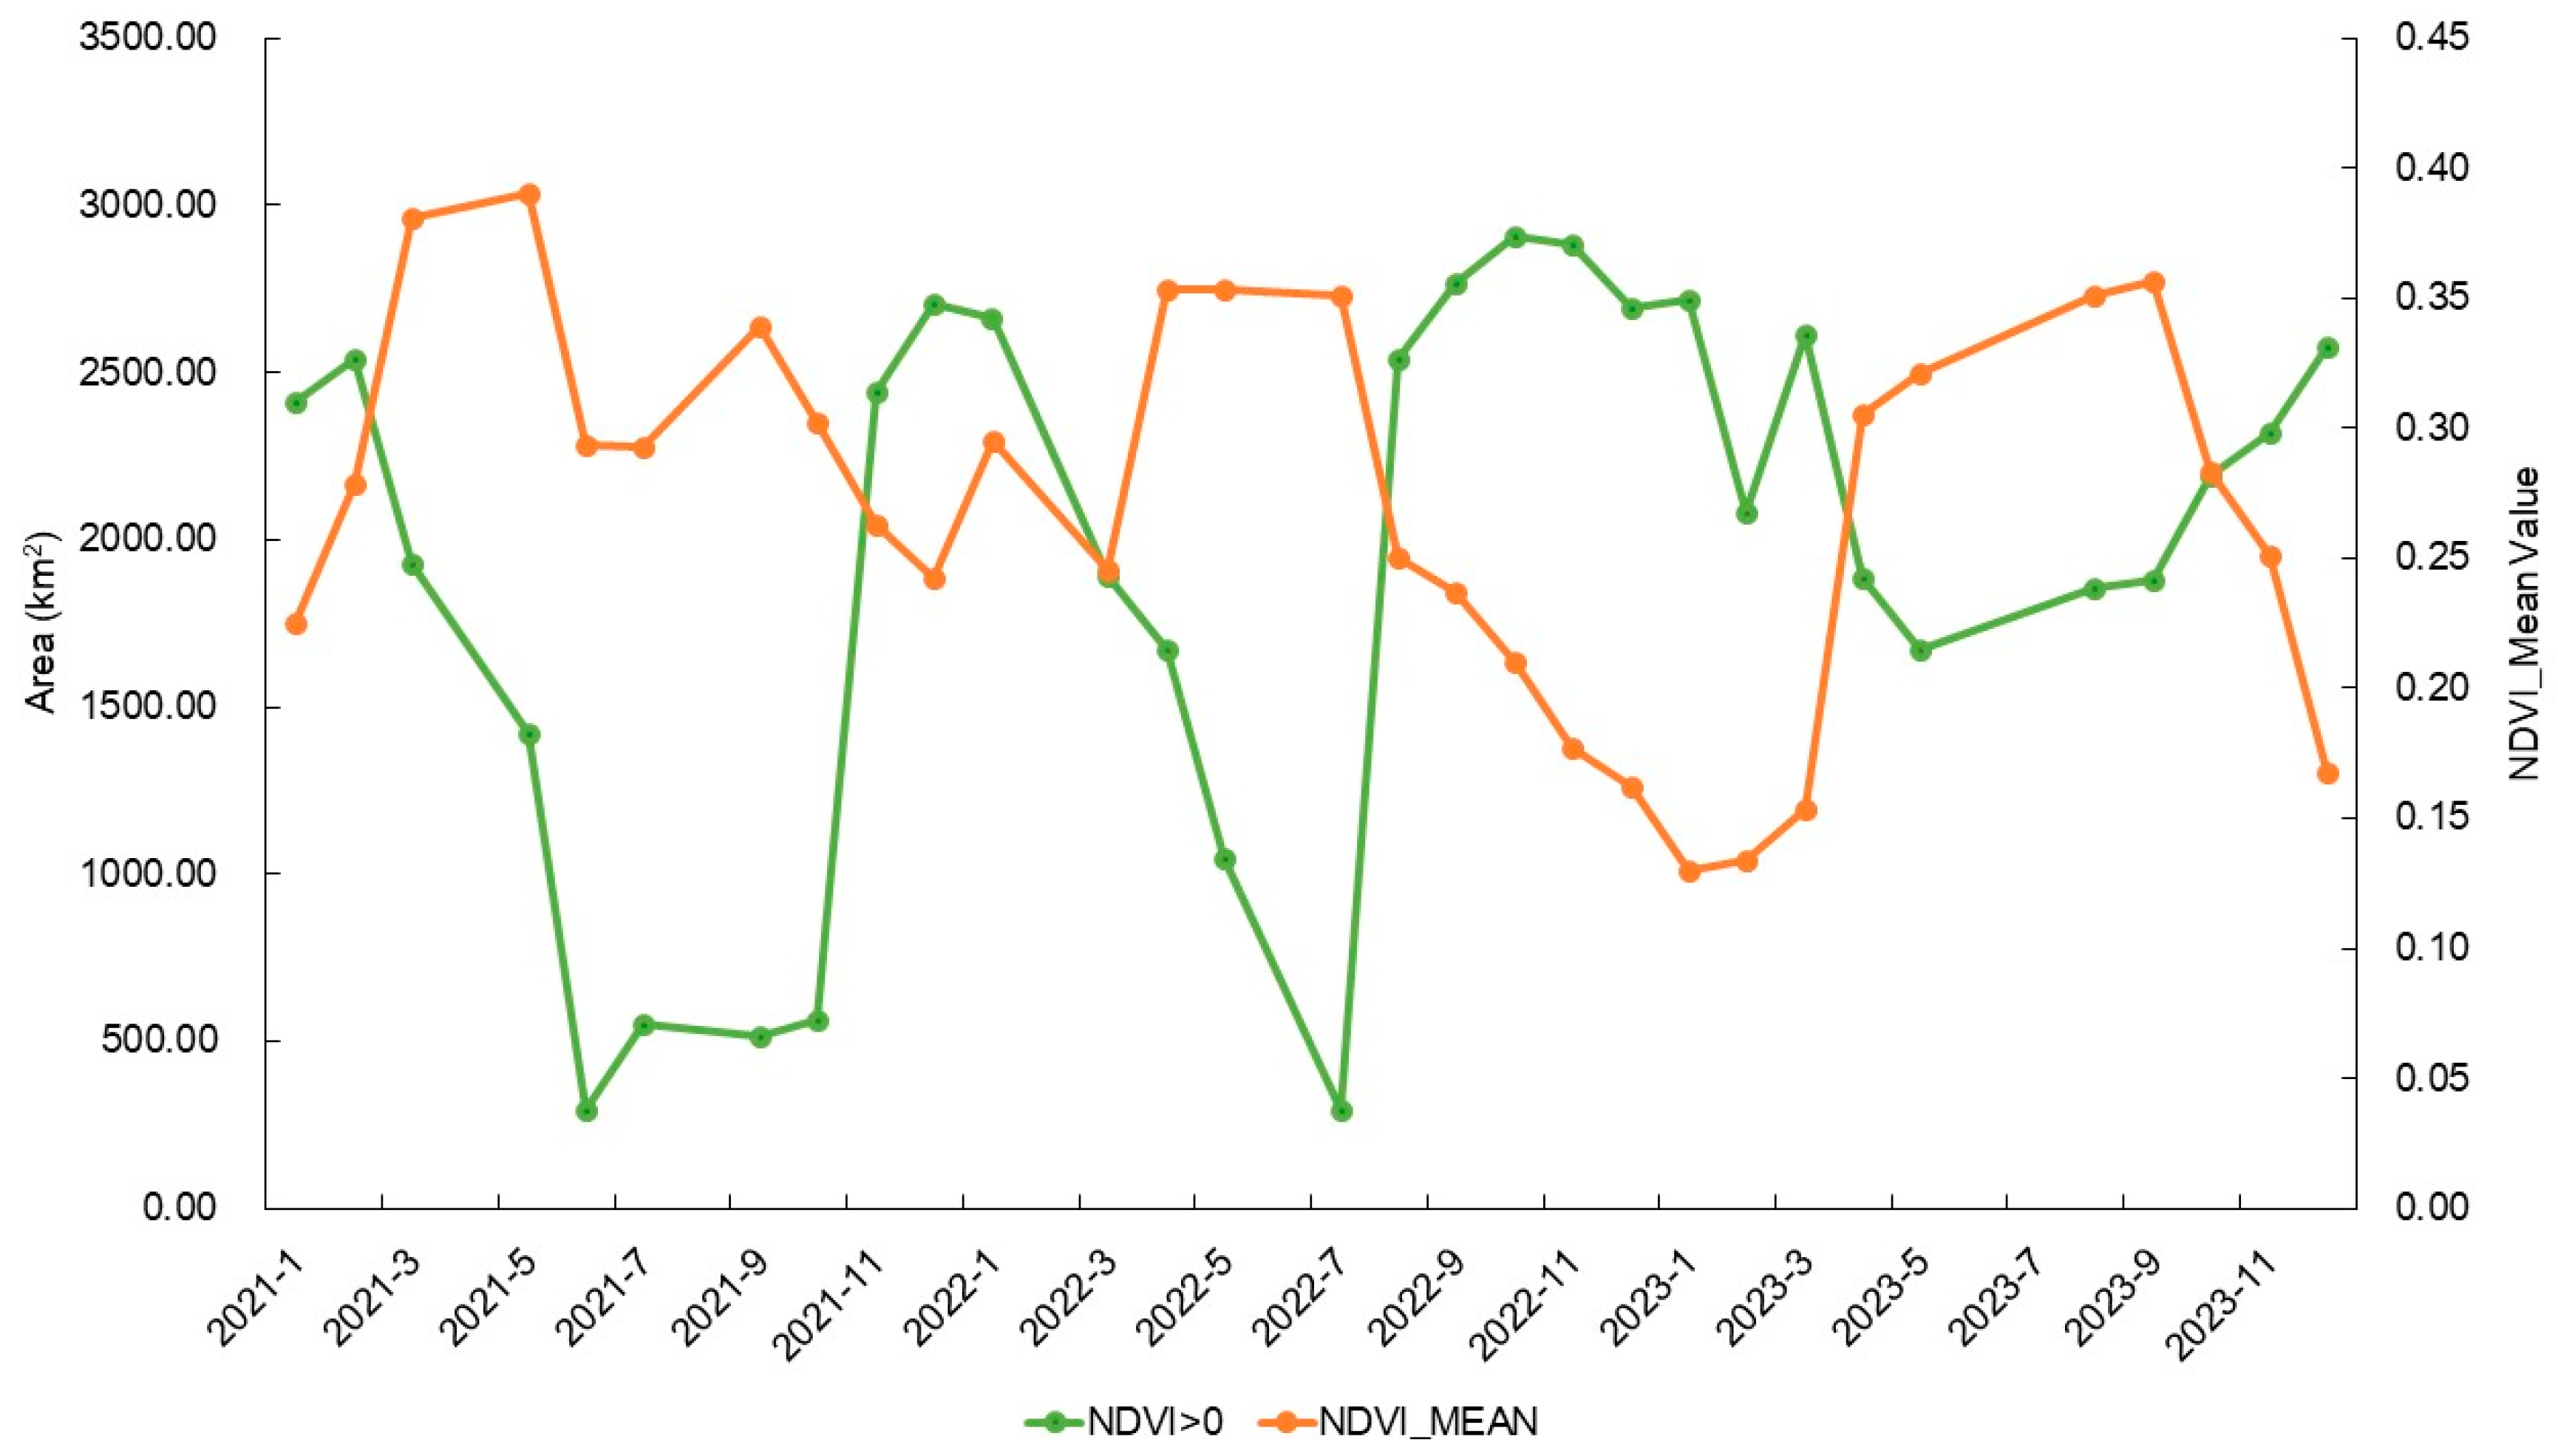
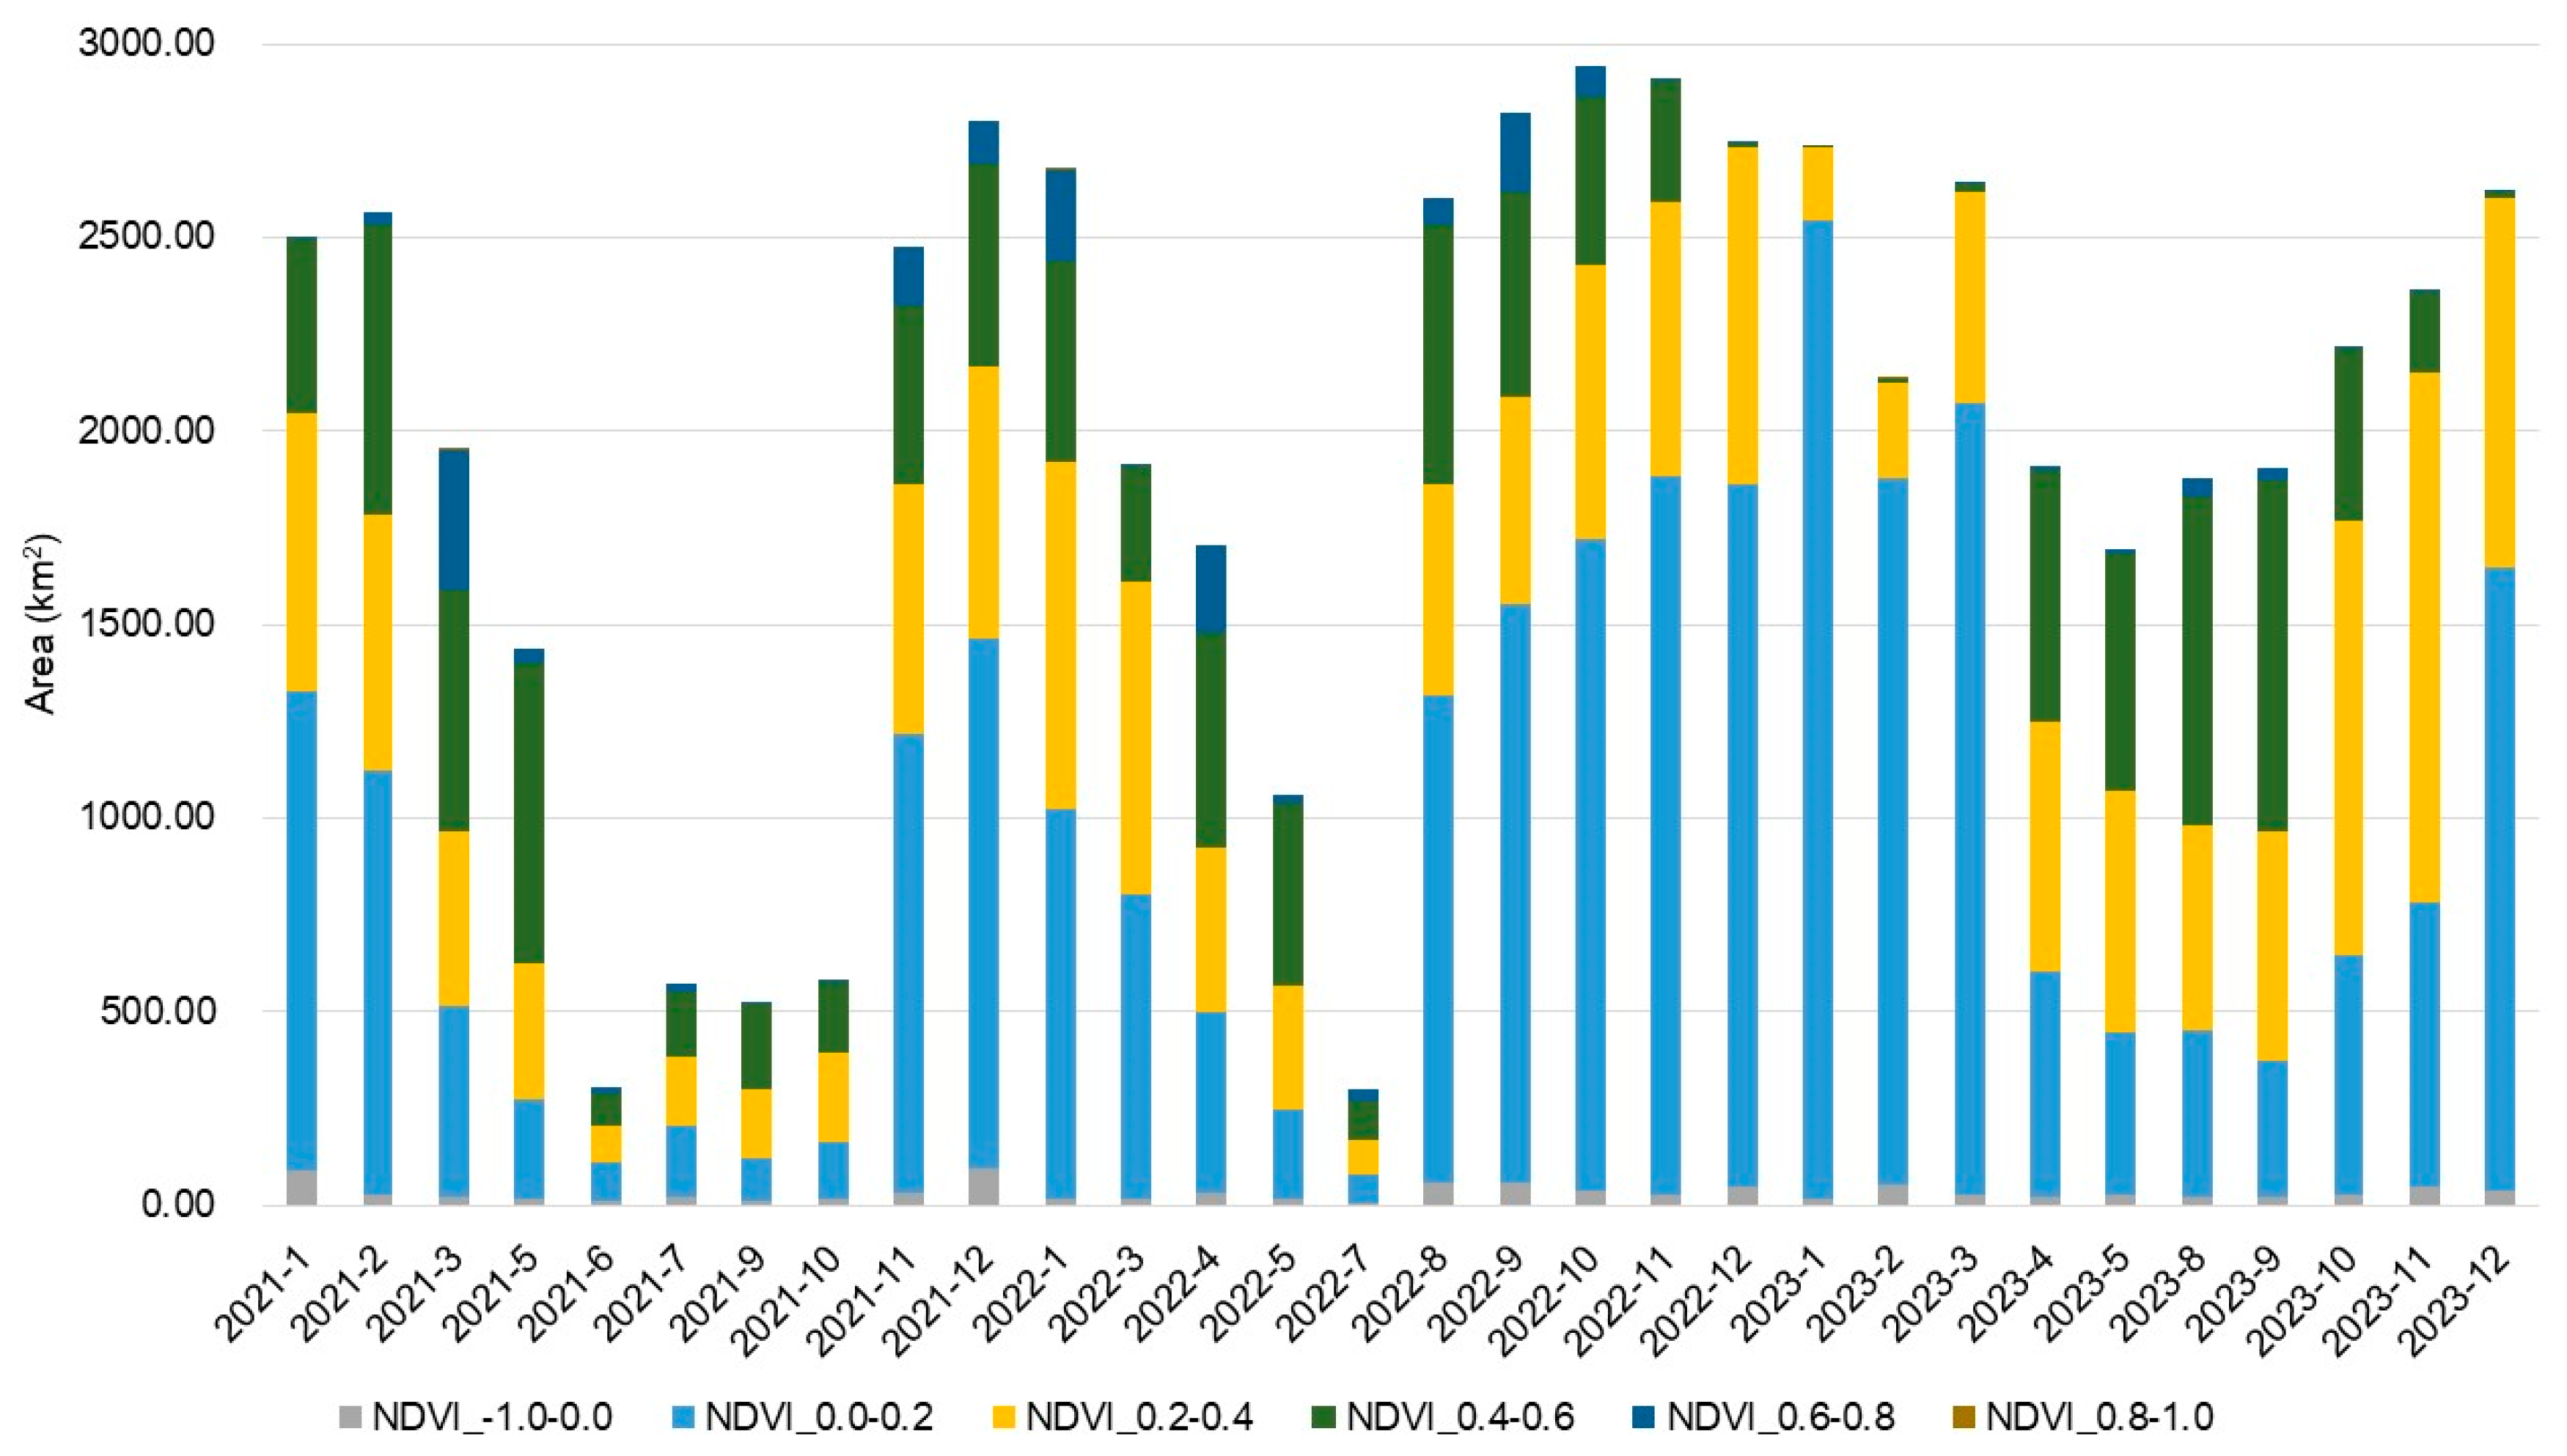
Regarding the wetland vegetation in Poyang Lake, the area of wetland vegetation and its greenness showed opposite trends. Under extreme drought conditions, the wetland vegetation area expanded rapidly, with a significant decrease in greenness, although it did not reach the minimum value. In spring, following an extreme drought year, the greenness value of the Poyang Lake Wetland vegetation was lower than that in 2021 and 2022. Regarding NDVI classification, the largest area of wetland vegetation fell within the range of 0–0.2, followed by 0.2–0.4.
(3)
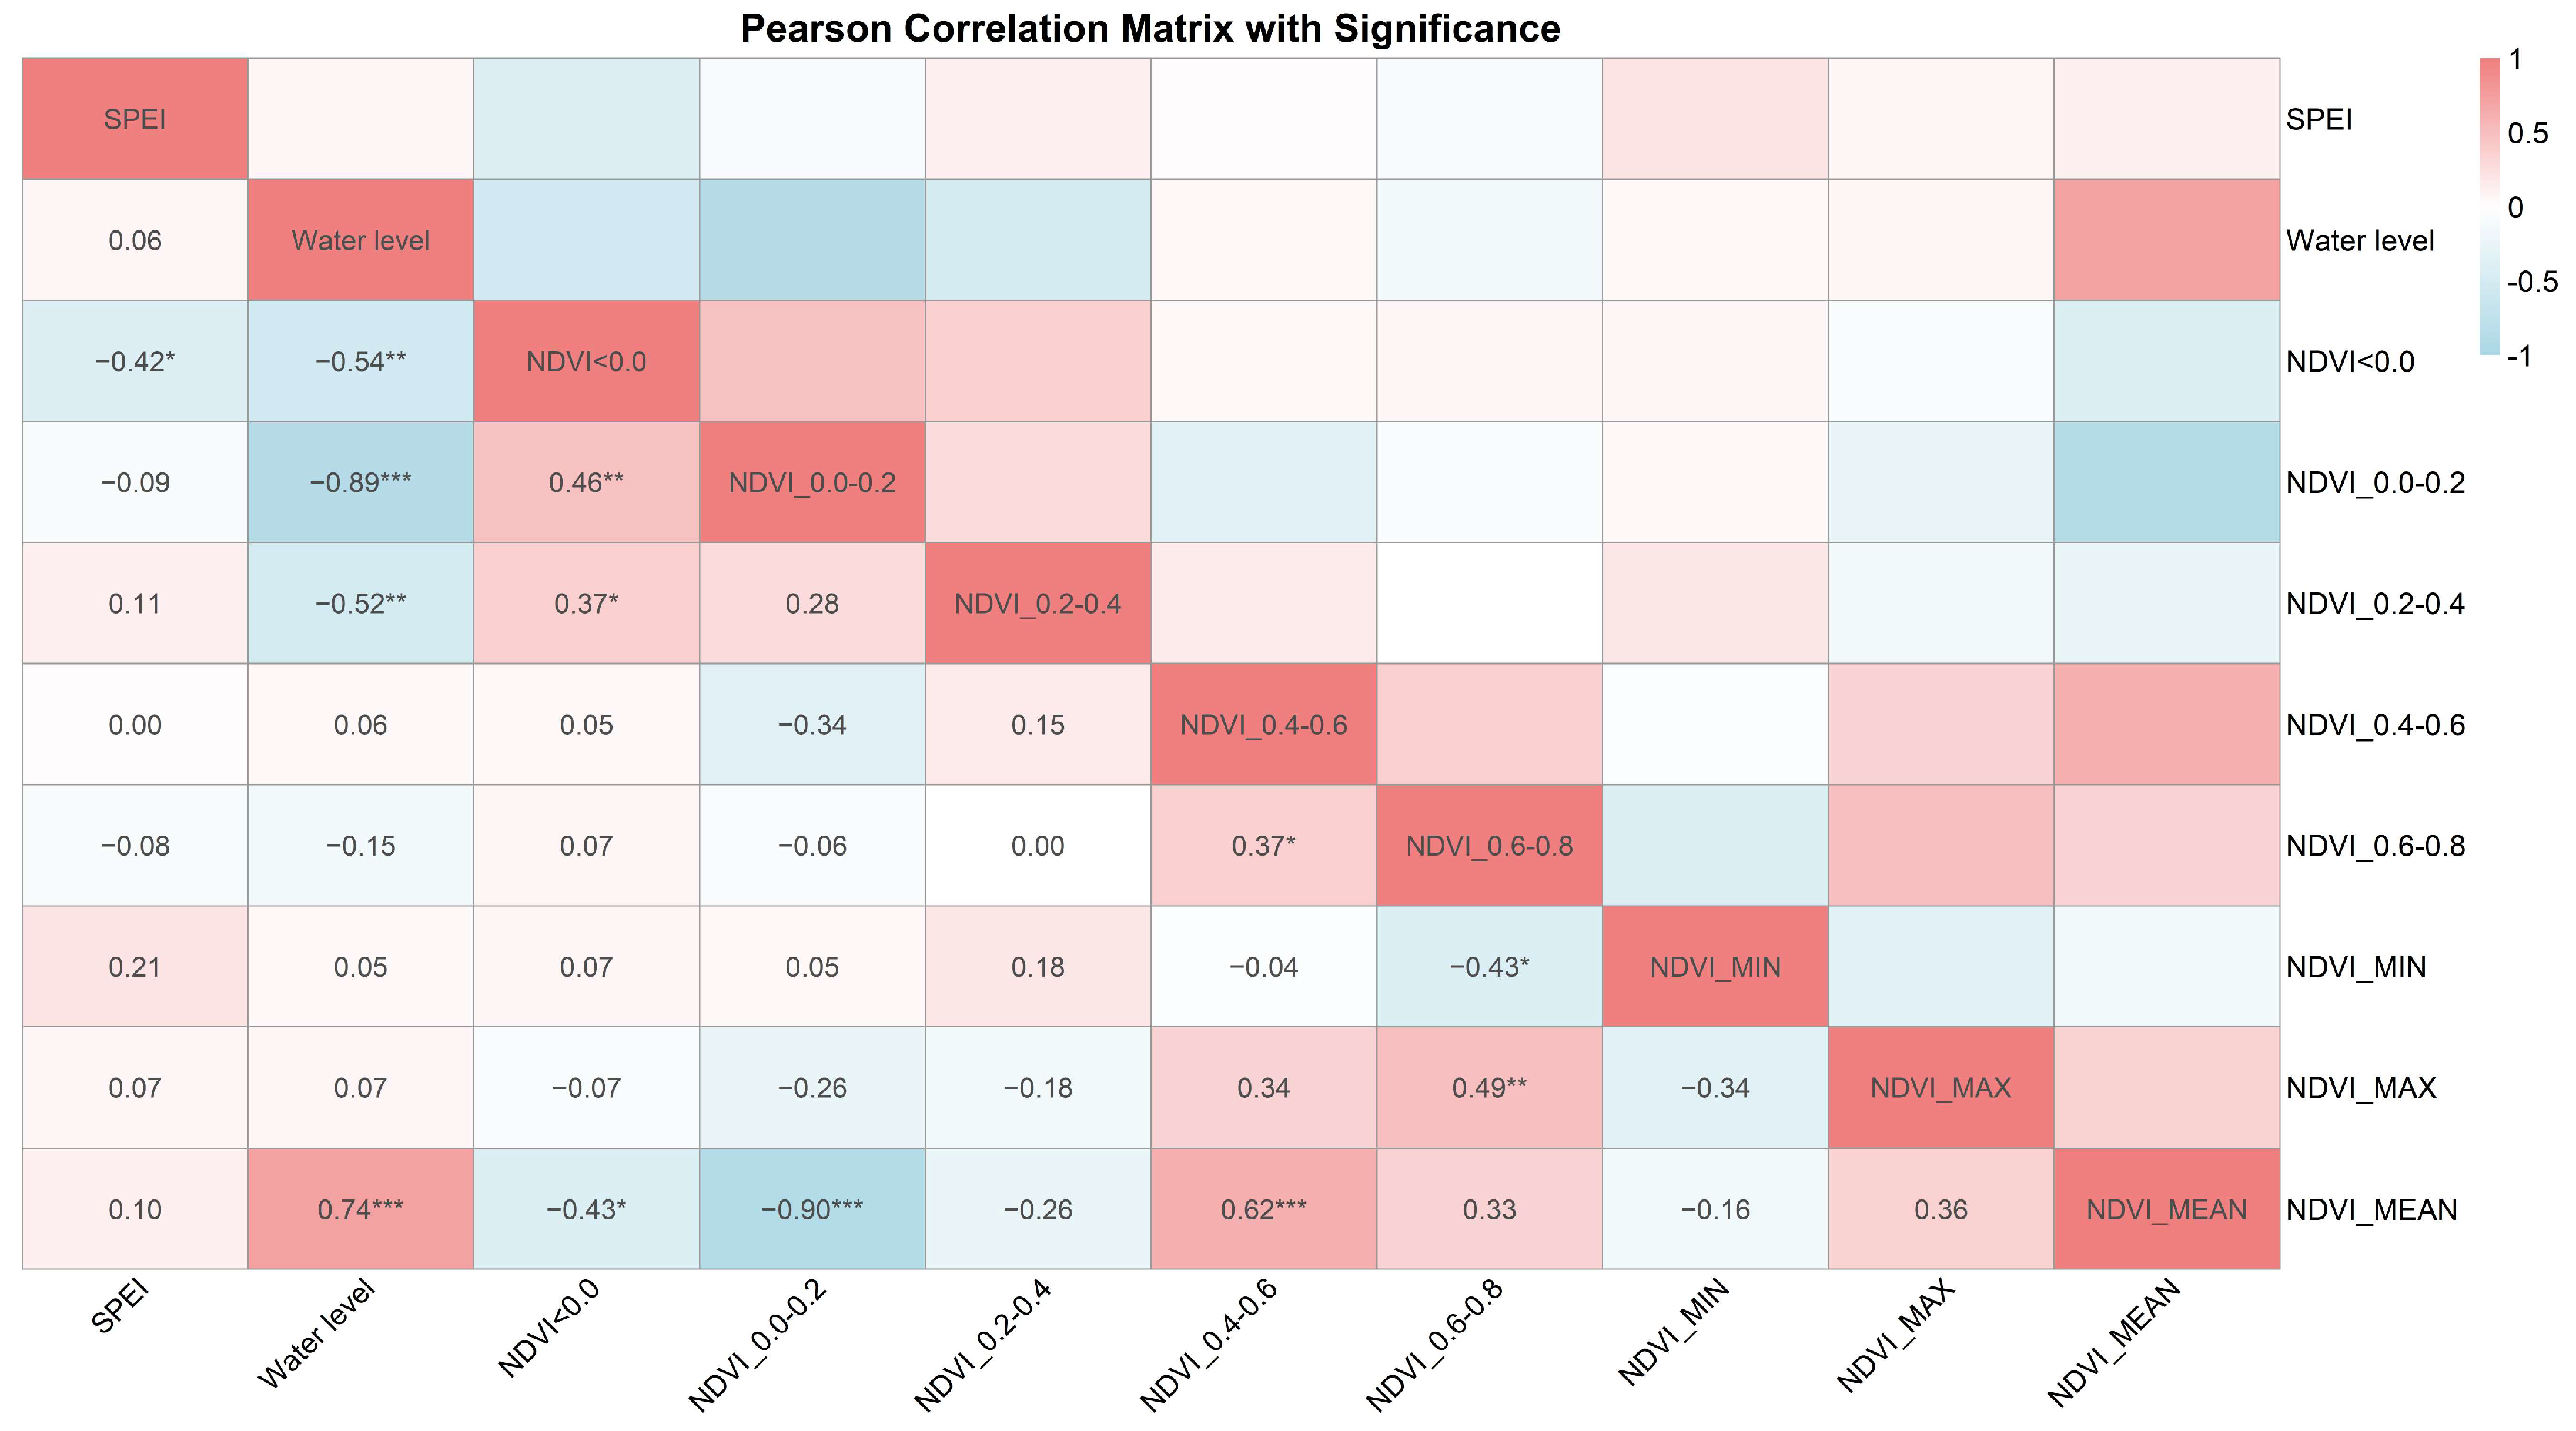
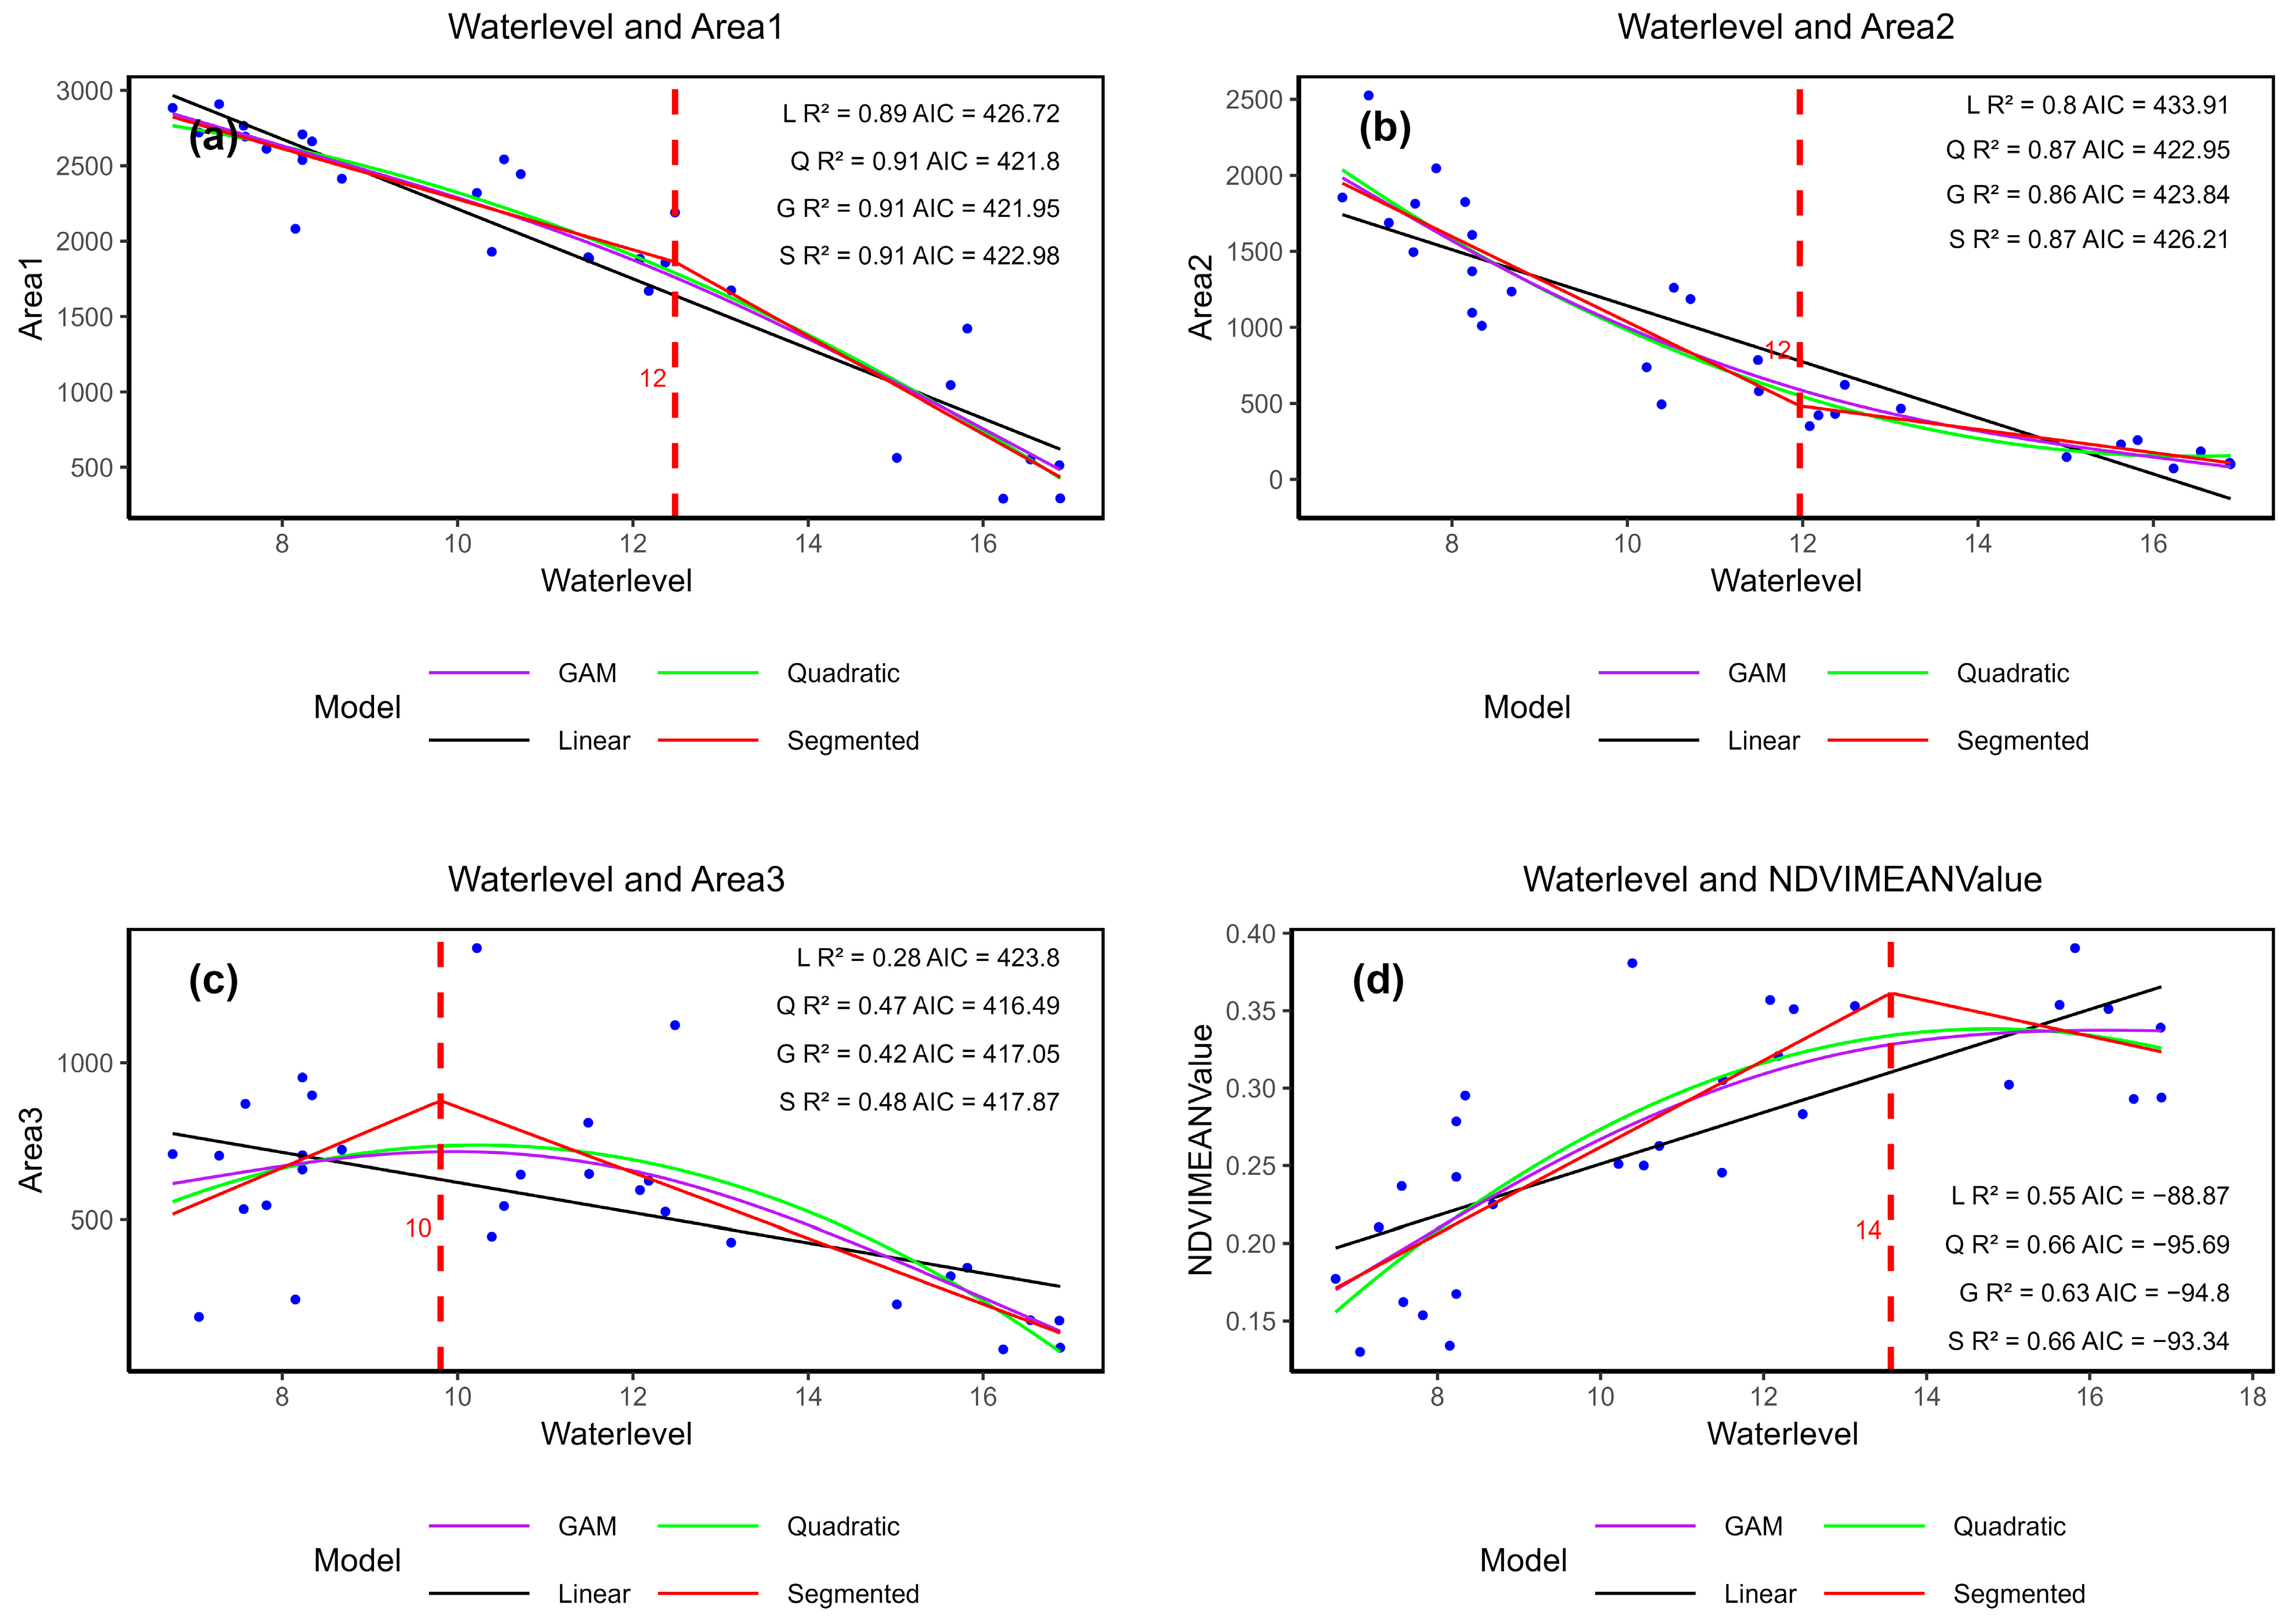
The correlation analysis showed no significant correlation between the SPEI and the vegetation, indicating that the water level is a key factor significantly affecting the vegetation of the Poyang Lake wetlands (p < 0.001). When water level thresholds reach 10 and 14 m, the area of wetland vegetation with an NDVI ranging from 0.2 to 0.4 and the average NDVI values suddenly decrease. When the water level threshold reaches 12 m, the area of wetland vegetation with an NDVI ranging from 0 to 0.2 stops decreasing and tends to stabilise.
This study mainly focused on the impact of extreme drought on wetland vegetation greenness, revealing the spatiotemporal characteristics of wetland vegetation and its influencing factors, as well as identifying the thresholds impacting vegetation. However, there are limitations in the following areas:
(1)
The lack of differentiation among wetland plant species. This study did not consider whether there are differences in greenness among these species. Future research should distinguish the greenness characteristics of wetland plant species and investigate their responses to drought stress.
(2)
Insufficient research on drought transmission mechanisms. Due to data availability, this study only considered the impacts of meteorological and hydrological droughts on vegetation. In the future, smaller time intervals should be used to explore how meteorological drought, hydrological drought, and agricultural drought transmit the thresholds that trigger this transmission and the characteristics exhibited by vegetation during this process.
(3)
The lack of consideration for inundation duration and depth. This study only focused on whether wetland vegetation was inundated. Future research should enhance the investigation of changes in wetland vegetation greenness under different inundation durations and depths.

Author Contributions

Conceptualization, X.L. and X.Z.; methodology, X.L.; software, H.Z. and Y.S.; validation, H.Z., Y.S. and X.L.; formal analysis, X.G.; investigation, X.L.; resources, H.Z.; data curation, X.L.; writing—original draft preparation, X.L.; writing—review and editing, X.Z.; visualisation, X.L.; supervision, X.Z.; project administration, X.Z.; funding acquisition, X.Z. All authors have read and agreed to the published version of the manuscript.

Funding

This research was funded by the National Key Research and Development Program (2020YFD1100603, 82-Y50G22-9001-22/23), the National Natural Science Foundation of China (41361049), and the Science and Technology Innovation Project of Jiangxi Provincial Department of Natural Resources (ZRKJ20242512).

Data Availability Statement

The original contributions presented in the study are included in the article, further inquiries can be directed to the corresponding author.

Acknowledgments

We thank Yefeng Jiang for his help in revising this manuscript.

Conflicts of Interest

The authors declare that they have no known conflicts of financial interest or personal relationships that could have appeared to influence the work reported in this paper.

References

  1. Aragão, L.E.; Anderson, L.O.; Fonseca, M.G.; Rosan, T.M.; Vedovato, L.B.; Wagner, F.H.; Silva, C.V.; Silva Junior, C.H.; Arai, E.; Aguiar, A.P.; et al. 21st Century drought-related fires counteract the decline of Amazon deforestation carbon emissions. Nat. Commun. 2018, 9, 536. [Google Scholar] [CrossRef] [PubMed]
  2. Brando, P.M.; Balch, J.K.; Nepstad, D.C.; Morton, D.C.; Putz, F.E.; Coe, M.T.; Silvério, D.; Macedo, M.N.; Davidson, E.A.; Nóbrega, C.C.; et al. Abrupt increases in Amazonian tree mortality due to drought–fire interactions. Proc. Natl. Acad. Sci. USA 2014, 111, 6347–6352. [Google Scholar] [CrossRef] [PubMed]
  3. Ponce-Campos, G.E.; Moran, M.S.; Huete, A.; Zhang, Y.; Bresloff, C.; Huxman, T.E.; Eamus, D.; Bosch, D.D.; Buda, A.R.; Gunter, S.A.; et al. Ecosystem resilience despite large-scale altered hydroclimatic conditions. Nature 2013, 494, 349–352. [Google Scholar] [CrossRef]
  4. Li, J.; Pei, J.; Fang, C.; Li, B.; Nie, M. Drought may exacerbate dryland soil inorganic carbon loss under warming climate conditions. Nat. Commun. 2024, 15, 617. [Google Scholar] [CrossRef] [PubMed]
  5. Cao, D.; Zhang, J.; Han, J.; Zhang, T.; Yang, S.; Wang, J.; Prodhan, F.A.; Yao, F. Projected increases in global terrestrial net primary productivity loss caused by drought under climate change. Earth’s Futur. 2022, 10, e2022EF002681. [Google Scholar] [CrossRef]
  6. Cunha, A.P.; Zeri, M.; Deusdará Leal, K.; Costa, L.; Cuartas, L.A.; Marengo, J.A.; Tomasella, J.; Vieira, R.M.; Barbosa, A.A.; Cunningham, C.; et al. Extreme drought events over Brazil from 2011 to 2019. Atmosphere 2019, 10, 642. [Google Scholar] [CrossRef]
  7. Schuldt, B.; Buras, A.; Arend, M.; Vitasse, Y.; Beierkuhnlein, C.; Damm, A.; Gharun, M.; Grams, T.E.E.; Hauck, M.; Hajek, P.; et al. A first assessment of the impact of the extreme 2018 summer drought on Central European forests. Basic Appl. Ecol. 2020, 45, 86–103. [Google Scholar] [CrossRef]
  8. Wang, W.; Shi, K.; Wang, X.; Wang, S.; Zhang, D.; Peng, Y.; Li, N.; Zhang, Y.; Zhang, Y.; Qin, B.; et al. A record-breaking extreme heat event caused unprecedented warming of lakes in China. Sci. Bull. 2023, 68, 578–582. [Google Scholar] [CrossRef]
  9. Hu, Z. Serious drought in Poyang Lake in 2022 and countermeasures fordrought prevention and disaster reduction. China FloodDrought Manag. 2023, 33, 1–6. [Google Scholar]
  10. Li, X.; Zhang, Q.; Zhang, D.; Ye, X. Investigation of the drought–flood abrupt alternation of streamflow in Poyang Lake catchment during the last 50 years. Hydrol. Res. 2016, 48, 1402–1417. [Google Scholar] [CrossRef]
  11. Li, X.; Ye, X. Spatiotemporal Characteristics of dry-wet abrupt transition based on precipitation in Poyang Lake Basin, China. Water 2015, 7, 1943–1958. [Google Scholar] [CrossRef]
  12. Wang, R.; Peng, W.; Liu, X.; Wu, W.; Chen, X.; Zhang, S. Responses of water level in China’s largest freshwater lake to the meteorological drought index (SPEI) in the past five decades. Water 2018, 10, 137. [Google Scholar] [CrossRef]
  13. Zhang, D.; Chen, P.; Zhang, Q.; Li, X. Copula-based probability of concurrent hydrological drought in the Poyang lake-catchment-river system (China) from 1960 to 2013. J. Hydrol. 2017, 553, 773–784. [Google Scholar] [CrossRef]
  14. Liu, Y.; Wu, G. Hydroclimatological influences on recently increased droughts in China’s largest freshwater lake. Hydrol. Earth Syst. Sci. 2016, 20, 93–107. [Google Scholar] [CrossRef]
  15. Liu, J.; Lu, J.; Tian, Q.; Chen, X. Impact of drought on GEP of Poyang Lake basin vegetation ecosystem. J. Cent. China Norm. Univ. (Nat. Sci.) 2022, 56, 513–522. [Google Scholar] [CrossRef]
  16. Mei, X.; Dai, Z.; Du, J.; Chen, J. Linkage between Three Gorges Dam impacts and the dramatic recessions in China’s largest freshwater lake, Poyang Lake. Sci. Rep. 2015, 5, 18197. [Google Scholar] [CrossRef]
  17. Xu, L.; Lai, X.; Wan, R.; Wang, X.; Li, X. Review of the development of lake wetlands eco-hydrology and case studies. Prog. Geogr. 2019, 38, 1171–1181. [Google Scholar] [CrossRef]
  18. Luo, J.; Yan, Y.; Xiao, F.; Cao, S.; Chen, M.; Du, Y. Monitoring and analysis of the Poyang Lake wetlands drought process in 2022 based on spatio-temporal information fusion Model. J. Lake Sci. 2024, 36, 1525–1536. [Google Scholar] [CrossRef]
  19. Ye, X.; Li, X.; Liu, J.; Xu, C.Y.; Zhang, Q. Response of wetland vegetation to drought and its impact factors in the Poyang Lake National Nature Reserve. J. Lake Sci. 2014, 26, 253–259. [Google Scholar]
  20. Li, X.; Wang, K.; Huntingford, C.; Zhu, Z.; Peñuelas, J.; Myneni, R.B.; Piao, S. Vegetation greenness in 2023. Nat. Reviews. Earth Environ. 2024, 5, 241–243. [Google Scholar] [CrossRef]
  21. Li, W.; Pacheco-Labrador, J.; Migliavacca, M.; Miralles, D.; van Dijke, A.H.; Reichstein, M.; Forkel, M.; Zhang, W.; Frankenberg, C.; Panwar, A.; et al. Widespread and complex drought effects on vegetation physiology inferred from space. Nat. Commun. 2023, 14, 1–13. [Google Scholar] [CrossRef] [PubMed]
  22. Sungmin, O.; Park, S.K. Global ecosystem responses to flash droughts are modulated by background climate and vegetation conditions. Commun. Earth Environ. 2024, 5, 88. [Google Scholar]
  23. Ault, T.R. On the essentials of drought in a changing climate. Science 2020, 368, 256–260. [Google Scholar] [CrossRef] [PubMed]
  24. Allen, C.D.; Breshears, D.D.; McDowell, N.G. On underestimation of global vulnerability to tree mortality and forest die-off from hotter drought in the Anthropocene. Ecosphere 2015, 6, 1–55. [Google Scholar] [CrossRef]
  25. Spinoni, J.; Barbosa, P.; De Jager, A.; McCormick, N.; Naumann, G.; Vogt, J.V.; Magni, D.; Masante, D.; Mazzeschi, M. A new global database of meteorological drought events from 1951 to 2016. J. Hydrol. Reg. Stud. 2019, 22, 100593. [Google Scholar] [CrossRef] [PubMed]
  26. Wang, Q.; Zeng, J.; Qi, J.; Zhang, X.; Zeng, Y.; Shui, W.; Xu, Z.; Zhang, R.; Wu, X.; Cong, J. A multi-scale daily SPEI dataset for drought characterization at observation stations over mainland China from 1961 to 2018. Earth Syst. Sci. Data 2021, 13, 331–341. [Google Scholar] [CrossRef]
  27. Greenwood, S.; Ruiz-Benito, P.; Martínez-Vilalta, J.; Lloret, F.; Kitzberger, T.; Allen, C.D.; Fensham, R.; Laughlin, D.C.; Kattge, J.; Bönisch, G.; et al. Tree mortality across biomes is promoted by drought intensity, lower wood density and higher specific leaf area. Ecol. Lett. 2017, 20, 539–553. [Google Scholar] [CrossRef]
  28. Li, X.; Piao, S.; Huntingford, C.; Peñuelas, J.; Yang, H.; Xu, H.; Chen, A.; Friedlingstein, P.; Keenan, T.F.; Sitch, S.; et al. Global variations in critical drought thresholds that impact vegetation. Natl. Sci. Rev. 2023, 10, nwad049. [Google Scholar] [CrossRef]
  29. Berdugo, M.; Delgado-Baquerizo, M.; Soliveres, S.; Hernández-Clemente, R.; Zhao, Y.; Gaitán, J.J.; Gross, N.; Saiz, H.; Maire, V.; Lehmann, A.; et al. Global ecosystem thresholds driven by aridity. Science 2020, 367, 787–790. [Google Scholar] [CrossRef]
  30. Tang, J.; Niu, B.; Hu, Z.; Zhang, X. Increasing susceptibility and shortening response time of vegetation productivity to drought from 2001 to 2021. Agric. For. Meteorol. 2024, 352, 110025. [Google Scholar] [CrossRef]
  31. Hong, X.; Guo, S.; Xiong, L.; Liu, Z. Spatial and temporal analysis of drought using entropy-based standardized precipitation index: A case study in Poyang Lake basin, China. Theor. Appl. Clim. 2014, 122, 543–556. [Google Scholar] [CrossRef]
  32. Yao, Y.; Liu, Y.; Fu, F.; Song, J.; Wang, Y.; Han, Y.; Wu, T.; Fu, B. Declined terrestrial ecosystem resilience. Glob. Chang. Biol. 2024, 30, e17291. [Google Scholar] [CrossRef]
  33. Piao, Z.; Li, X.; Xu, H.; Wang, K.; Tang, S.; Kan, F.; Hong, S. Threshold of climate extremes that impact vegetation productivity over the Tibetan Plateau. Sci. China Earth Sci. 2024, 67, 1967–1977. [Google Scholar] [CrossRef]
  34. Zhang, Q.; Xue, C.; Xia, J. Impact, contributing factors and countermeasures of extreme droughts in Poyang Lake. Bull. Chin. Acad. Sci. 2023, 38, 1894–1902. [Google Scholar]
  35. Tan, Z.; Zhang, Q.; Li, Y.; Xu, X.; Jiang, J. Distribution of typical vegetation communities along elevation in Poyang Lake wetlands. Wetl. Sci. 2016, 14, 506–515. [Google Scholar]
  36. Li, B.; Wan, R.; Yang, G.; Tan, Z.; Wang, D.; Wu, X. Investigating spatiotemporal dynamics of Lake Poyang wetland for the recent century. J. Lake Sci. 2022, 34, 1018–1029. [Google Scholar]
  37. Shuhua, Q.I.; Xiaobo, S.H.; Daniel, B. Flooding hazard mapping for Poyang Lake Region with remote sensing and water level rec-ords. J. Lake Sci. 2009, 21, 720–724. [Google Scholar] [CrossRef]
  38. Xie, D.; Zhou, Y.; Qian, H. Poyang Lake Wetland Complex Ecosystem Research; Science Press: Beijing, China, 2018. [Google Scholar]
  39. Xie, K.; Ding, M.; Zhang, H.; Chen, L. Spatiotemporal variation of drought in Poyang Lake Basin in recent sixty years Based on SPEI. Resour. Environ. Yangtze Basin 2021, 30, 2015–2027. [Google Scholar]
  40. Vicente-Serrano, S.M.; Beguería, S.; López-Moreno, J.I. A multiscalar drought index sensitive to global warming: The standardized precipitation evapotranspiration index. J. Clim. 2010, 23, 1696–1718. [Google Scholar] [CrossRef]
  41. Beguería, S.; Vicente-Serrano, S.M.; Reig, F.; Latorre, B. Standardized precipitation evapotranspiration index (SPEI) revisited: Parameter fitting, evapotranspiration models, tools, datasets and drought monitoring. Int. J. Clim. 2013, 34, 3001–3023. [Google Scholar] [CrossRef]
  42. Perez, M.; Lombardi, D.; Bardino, G.; Vitale, M. Drought assessment through actual evapotranspiration in Mediterranean vegetation dynamics. Ecol. Indic. 2024, 166. [Google Scholar] [CrossRef]
  43. Rahman, N.; Rony, R.H.; Jannat, F.A. Spatiotemporal evaluation of drought trend during 1979–2019 in seven climatic zones of Bangladesh. Heliyon 2021, 7, e08249. [Google Scholar] [CrossRef] [PubMed]
  44. En-Nagre, K.; Aqnouy, M.; Ouarka, A.; Naqvi, S.A.; Bouizrou, I.; El Messari, J.E.; Tariq, A.; Soufan, W.; Li, W.; El-Askary, H. Assessment and prediction of meteorological drought using machine learning algorithms and climate data. Clim. Risk Manag. 2024, 45, 100630. [Google Scholar] [CrossRef]
  45. Bera, B.; Shit, P.K.; Sengupta, N.; Saha, S.; Bhattacharjee, S. Trends and variability of drought in the extended part of Chhota Nagpur plateau (Singbhum Protocontinent), India applying SPI and SPEI indices. Environ. Chall. 2021, 5, 100310. [Google Scholar] [CrossRef]
  46. Wood, S.N. Generalized Additive Models: An Introduction with R; Chapman and Hall/CRC: Boca Raton, FL, USA, 2017. [Google Scholar]
  47. Kang, P.; Zhang, X.; Hu, C. Study of the spatial and temporal distribution of ozone and its influences factors over Sichuan Basin based on generalized additive mode. Acta Sci. Circumstantiae 2019, 39, 809–820. [Google Scholar]
  48. Hao, C.; Sun, X.; Wang, H. Application of Generalized Linear Geostatistical Model for digital soil mapping in typical subtropical hilly area. Acta Pedol. Sin. 2023, 60, 993–1006. [Google Scholar]
  49. Peng, J.; Tian, L.; Liu, Y.; Zhao, M.; Hu, Y.; Wu, J. Ecosystem services response to urbanization in metropolitan areas: Thresholds identification. Sci. Total Environ. 2017, 607–608, 706–714. [Google Scholar] [CrossRef]
  50. Toms, J.D.; Lesperance, M.L. Piecewise regression: A tool for identifying ecological thresholds. Ecology 2003, 84, 2034–2041. [Google Scholar] [CrossRef]
  51. Xue, C.; Zhang, Q.; Jia, Y.; Yuan, S. Intensifying drought of Poyang Lake and potential recovery approaches in the dammed middle Yangtze River catchment. J. Hydrol. Reg. Stud. 2023, 50, 101548. [Google Scholar] [CrossRef]
  52. Chen, L.; Zhu, X.; Tang, Y.; Liu, T.; Zhang, S.; Lu, Y.; Xu, K.; Guo, R. Time lag effect and influencing factors of meteorological and hydrological drought in the Yellow River Basin. Sci. Geogr. Sin. 2023, 43, 1861–1868. [Google Scholar]
  53. Zheng, J.; Zhou, Z.; Liu, J.; Yan, Z.; Li, G.; Wang, Q. Influencing mechanism of meteorological drought to hydrological drought propagation in the Fuhe River Basin. J. Water Resour. Hydropower Eng. 2023, 34, 27–34. [Google Scholar]
  54. Vicente-Serrano, S.M.; Gouveia, C.; Camarero, J.J.; Beguería, S.; Trigo, R.; Lopez-Moreno, J.I.; Azorin-Molina, C.; Pasho, E.; Lorenzo-Lacruz, J.; Revuelto, J.; et al. Response of vegetation to drought time-scales across global land biomes. Proc. Natl. Acad. Sci. USA 2013, 110, 52–57. [Google Scholar] [CrossRef] [PubMed]
  55. Zhang, Q.; Yu, X.; Hu, B. Research on the characteristics of plant communities in the Poyang Nanji Wetlands, China. Resour. Sci. 2013, 35, 42–49. [Google Scholar]
  56. Li, D.; An, L.; Zhong, S.; Shen, L.; Wu, S. Declining coupling between vegetation and drought over the past three decades. Glob. Chang. Biol. 2024, 30, e17141. [Google Scholar] [CrossRef]
  57. Cui, J.; Chen, A.; Huntingford, C.; Piao, S. Integrating ecosystem water demands into drought monitoring and assessment under climate change. Nat. Water 2024, 2, 215–218. [Google Scholar] [CrossRef]
  58. Wei, X.; He, W.; Zhou, Y.; Ju, W.; Xiao, J.; Li, X.; Liu, Y.; Xu, S.; Bi, W.; Zhang, X.; et al. Global assessment of lagged and cumulative effects of drought on grassland gross primary pro-duction. Ecol. Indic. 2022, 136, 108646. [Google Scholar] [CrossRef]
  59. Van Loon, A.; Laaha, G. Hydrological drought severity explained by climate and catchment characteristics. J. Hydrol. 2015, 526, 3–14. [Google Scholar] [CrossRef]
  60. Zhang, Q.; Ye, X.; Werner, A.D.; Li, Y.; Yao, J.; Li, X.; Xu, C. An investigation of enhanced recessions in Poyang Lake: Comparison of Yangtze River and local catchment impacts. J. Hydrol. 2014, 517, 425–434. [Google Scholar] [CrossRef]
  61. Zhang, Z.; Huang, Y.; Xu, C.; Chen, X.; Moss, E.M.; Jin, Q.; Bailey, A.M. Analysis of Poyang Lake water balance and its indication of river–lake interaction. SpringerPlus 2016, 5, 1555. [Google Scholar] [CrossRef] [PubMed]
  62. Zhang, Z.; Chen, X.; Xu, C.; Hong, Y.; Hardy, J.; Sun, Z. Examining the influence of river–lake interaction on the drought and water resources in the Poyang Lake basin. J. Hydrol. 2015, 522, 510–521. [Google Scholar] [CrossRef]
  63. Gao, J.; Jia, J.; Kettner, A.J.; Xing, F.; Wang, Y.; Xu, X.; Yang, Y.; Zou, X.; Gao, S.; Qi, S.; et al. Changes in water and sediment exchange between the Changjiang River and Poyang Lake under natural and anthropogenic conditions, China. Sci. Total Environ. 2014, 481, 542–553. [Google Scholar] [CrossRef]
  64. Tan, Z.; Jiang, J. Spatial–temporal dynamics of wetland vegetation related to water level fluctuations in Poyang Lake, China. Water 2016, 8, 397. [Google Scholar] [CrossRef]
  65. Li, Z.; Sun, F.; Wang, H.; Wang, T.; Feng, Y. Detecting the interactions between vegetation greenness and drought globally. Atmospheric Res. 2024, 304, 107409. [Google Scholar] [CrossRef]
  66. Feng, W.; Lu, H.; Yao, T.; Yu, Q. Drought characteristics and its elevation dependence in the Qinghai–Tibet plateau during the last half-century. Sci. Rep. 2020, 10, 14323. [Google Scholar] [CrossRef]
  67. Zhang, Q.; Kong, D.; Singh, V.P.; Shi, P. Response of vegetation to different time-scales drought across China: Spatiotemporal patterns, causes and implications. Glob. Planet. Chang. 2017, 152, 1–11. [Google Scholar] [CrossRef]
  68. Christian, J.I.; Basara, J.B.; Hunt, E.D.; Otkin, J.A.; Furtado, J.C.; Mishra, V.; Xiao, X.; Randall, R.M. Global distribution, trends, and drivers of flash drought occurrence. Nat. Commun. 2021, 12, 6330. [Google Scholar] [CrossRef]
  69. Salimi, S.; Almuktar, S.A.; Scholz, M. Impact of climate change on wetland ecosystems: A critical review of experimental wetlands. J. Environ. Manag. 2021, 286, 112160. [Google Scholar] [CrossRef] [PubMed]
  70. Li, R.; Chen, N.; Zhang, X.; Zeng, L.; Wang, X.; Tang, S.; Li, D.; Niyogi, D. Quantitative analysis of agricultural drought propagation process in the Yangtze River Basin by using cross wavelet analysis and spatial autocorrelation. Agric. For. Meteorol. 2019, 280, 107809. [Google Scholar] [CrossRef]
  71. Zeng, J.; Zhang, R.; Qu, Y.; Bento, V.A.; Zhou, T.; Lin, Y.; Wu, X.; Qi, J.; Shui, W.; Wang, Q. Improving the drought monitoring capability of VHI at the global scale via ensemble indices for various vegetation types from 2001 to 2018. Weather. Clim. Extremes 2022, 35, 100412. [Google Scholar] [CrossRef]
  72. Anderson, L.O.; Malhi, Y.; Aragão, L.E.O.C.; Ladle, R.; Arai, E.; Barbier, N.; Phillips, O. Remote sensing detection of droughts in Amazonian forest canopies. New Phytol. 2010, 187, 733–750. [Google Scholar] [CrossRef]
  73. Han, Z.; Huang, S.; Zhao, J.; Leng, G.; Huang, Q.; Zhang, H.; Li, Z. Long-chain propagation pathways from meteorological to hydrological, agricultural and groundwater drought and their dynamics in China. J. Hydrol. 2023, 625, 130131. [Google Scholar] [CrossRef]
  74. Huang, C.; Huang, J.; Xiao, J.; Li, X.; He, H.; Liang, Y.; Chen, F.; Tian, H. Global convergence in terrestrial gross primary production response to atmospheric vapor pressure deficit. Sci. China Life Sci. 2024, 67, 2016–2025. [Google Scholar] [CrossRef] [PubMed]
  75. Zhong, Z.; He, B.; Wang, Y.P.; Chen, H.W.; Chen, D.; Fu, Y.H.; Chen, Y.; Guo, L.; Deng, Y.; Huang, L.; et al. Disentangling the effects of vapor pressure deficit on northern terrestrial vegetation productivity. Sci Adv. 2023, 9, eadf3166. [Google Scholar] [CrossRef] [PubMed]
  76. Yuan, W.; Zheng, Y.; Piao, S.; Ciais, P.; Lombardozzi, D.; Wang, Y.; Ryu, Y.; Chen, G.; Dong, W.; Hu, Z.; et al. Increased atmospheric vapor pressure deficit reduces global vegetation growth. Sci. Adv. 2019, 5, eaax1396. [Google Scholar] [CrossRef] [PubMed]
  77. Zhao, Y.; Xiong, L.; Yin, J.; Zha, X.; Li, W.; Han, Y. Understanding the effects of flash drought on vegetation photosynthesis and potential drivers over China. Sci. Total. Environ. 2024, 931, 172926. [Google Scholar] [CrossRef] [PubMed]
  78. Li, W.; Migliavacca, M.; Forkel, M.; Denissen, J.M.C.; Reichstein, M.; Yang, H.; Duveiller, G.; Weber, U.; Orth, R. Widespread increasing vegetation sensitivity to soil moisture. Nat. Commun. 2022, 13, 1–9. [Google Scholar] [CrossRef] [PubMed]
  79. Fu, Z.; Ciais, P.; Wigneron, J.-P.; Gentine, P.; Feldman, A.F.; Makowski, D.; Viovy, N.; Kemanian, A.R.; Goll, D.S.; Stoy, P.C.; et al. Global critical soil moisture thresholds of plant water stress. Nat. Commun. 2024, 15, 4813–4826. [Google Scholar] [CrossRef]
  80. Wang, X.; Wu, C.; Liu, Y.; Peñuelas, J.; Peng, J. Earlier leaf senescence dates are constrained by soil moisture. Glob. Chang. Biol. 2022, 29, 1557–1573. [Google Scholar] [CrossRef]
  81. Ge, G.; Zhao, A.; Zhong, Y.; Wu, Z. Patterns of dominant populations of plants in Islets of Poyang Lake. Wetl. Sci. 2011, 9, 19–25. [Google Scholar]
  82. Xu, X.; Li, Y.; Tan, Z.; Guo, Q. Variation of water sources for a typical mesophyte vegetation in the Lake Poyang wetlands using stable isotopes. J. Lake Sci. 2020, 32, 1749–1760. [Google Scholar]
  83. Feng, W.; Xu, L.; Wang, X.; Chen, J.; Jiang, J.; Yan, Y. Ecophysiological responses of a wetland plant (Carex cinerascens) to different groundwater depths in Poyang Lake Wetlands. J. Lake Sci. 2018, 30, 763–769. [Google Scholar]
  84. Schumacher, D.L.; Keune, J.; Dirmeyer, P.; Miralles, D.G. Drought self-propagation in drylands due to land–atmosphere feedbacks. Nat. Geosci. 2022, 15, 262–268. [Google Scholar] [CrossRef] [PubMed]
  85. Choat, B.; Brodribb, T.J.; Brodersen, C.R.; Duursma, R.A.; López, R.; Medlyn, B.E. Triggers of tree mortality under drought. Nature 2018, 558, 531–539. [Google Scholar] [CrossRef]
  86. Schwalm, C.R.; Anderegg, W.R.L.; Michalak, A.M.; Fisher, J.B.; Biondi, F.; Koch, G.; Litvak, M.; Ogle, K.; Shaw, J.D.; Wolf, A.; et al. Global patterns of drought recovery. Nature 2017, 548, 202–205. [Google Scholar] [CrossRef] [PubMed]
  87. Zhang, L.; Yin, J.; Jiang, Y.; Wang, H. Relationship between the hydrological conditions and the distribution of vegetation communities within the Poyang Lake National Nature Reserve, China. Ecol. Informatics 2012, 11, 65–75. [Google Scholar] [CrossRef]
  88. Lv, X.; Ren, J.; Gao, D.; Yin, L.; Dou, J.; Li, H.; Xie, M.; Pan, Y. Impacts of hydrodynamic variation on submerged macrophytes in lakes: A review. Acta Ecol. Sin. 2022, 42, 4245–4254. [Google Scholar]
  89. Ma, X.; Han, Z.; Wang, S.; Liu, X.; Zhao, S.; Liu, C.; Meng, J.; Zhang, H.; Wang, L.; Zhu, B.; et al. Response characteristics of submerged plant Vallisneria spinulosa Yan to different flooding conditions in Poyang lake and implications for ecological restoration. Environ. Eng. 2023, 41, 204–212. [Google Scholar]
  90. Dai, X.; Yu, Z.; Yang, G.; Wan, R. Role of flooding patterns in the biomass production of vegetation in a typical herbaceous wetland, Poyang Lake Wetland, China. Front. Plant Sci. 2020, 11, 521358. [Google Scholar] [CrossRef] [PubMed]
  91. Mu, S.; Yang, G.; Xu, X.; Wan, R.; Li, B. Assessing the inundation dynamics and its impacts on habitat suitability in Poyang Lake based on integrating Landsat and MODIS observations. Sci. Total. Environ. 2022, 834, 154936. [Google Scholar] [CrossRef] [PubMed]
  92. Zheng, L.; Wang, X.; Li, D.; Xu, G.; Guo, Y. Spatial heterogeneity of vegetation extent and the response to water level fluctuations and mi-cro-topography in Poyang Lake, China. Ecol. Indic. 2021, 124, 1074200. [Google Scholar] [CrossRef]
  93. Ye, X.; Meng, Y.; Xu, L.; Xu, C. Net primary productivity dynamics and associated hydrological driving factors in the floodplain wetland of China’s largest freshwater lake. Sci. Total Environ. 2019, 659, 302–313. [Google Scholar] [CrossRef] [PubMed]
  94. Mu, S.; Li, B.; Yao, J.; Yang, G.; Wan, R.; Xu, X. Monitoring the spatio-temporal dynamics of the wetland vegetation in Poyang Lake by Landsat and MODIS observations. Sci. Total. Environ. 2020, 725, 138096. [Google Scholar] [CrossRef] [PubMed]
  95. Dai, X.; Qian, X.; Zhu, Y.; Guo, R.; Qin, D.; Wan, R.; You, H. Inundation dynamic changes of the Lake Poyang wetland in the post Three Gorges Dam era. J. Lake Sci. 2023, 35, 2048–2058. [Google Scholar]
Figure 1. (a) Digital elevation model (DEM) and the location of meteorological stations in Jiangxi Province. (b) Poyang Lake Wetland and the different water level ranges.
Forests 15 01756 g001
Figure 2. Data processing and analyses in this study.
Forests 15 01756 g002
Figure 3. (a) Standardised precipitation evapotranspiration index (SPEI) time series from 2015 to 2023. (b) Sen’s slope estimate and Mann–Kendall test results.
Forests 15 01756 g003
Figure 4. Standardised precipitation evapotranspiration index (SPEI) values and water level elevation changes during 2021–2023.
Forests 15 01756 g004
Figure 5. Trend of the NDVI _Mean value change and the area of the NDVI > 0. NDVI: normalised difference vegetation index.
Forests 15 01756 g005
Figure 6. Ratio of the area of different NDVI ranges. NDVI: normalised difference vegetation index.
Forests 15 01756 g006
Figure 7. Spatiotemporal characteristics of vegetation in Poyang Lake Wetland from 2021 to 2023.
Forests 15 01756 g007
Figure 8. Heat map of variables. *, p < 0.05; **, p < 0.01 and ***, p < 0.001.
Forests 15 01756 g008
Figure 9. (a) Water level threshold for area 1. (b) Water level threshold for area 2. (c) Water level threshold for area 3. (d) Water level threshold for the NDVIMEANVALUE.
Forests 15 01756 g009
Table 1. Correspondence between water levels and images at Xingzi Station of Poyang Lake.
Water Level Line (m)Actual Water Level at Xingzi Station (m)Date
8 (Extremely low water period)8.0511 January 2022
13 (Normal water period)12.5111 April 2022
18 (High water period) 17.4810 July 2022
Disclaimer/Publisher’s Note: The statements, opinions and data contained in all publications are solely those of the individual author(s) and contributor(s) and not of MDPI and/or the editor(s). MDPI and/or the editor(s) disclaim responsibility for any injury to people or property resulting from any ideas, methods, instructions or products referred to in the content.

