Article

Surface Morphology and Chemical Changes of Maple and Beech Cut Through by CO2 Laser Under Different Angles Relative to the Wood Grain

Faculty of Furniture Design and Wood Engineering, Transilvania University of Brasov, B-dul Eroilor, nr. 29, 500036 Brasov, Romania
*
Author to whom correspondence should be addressed.
Forests 2024, 15(10), 1767; https://doi.org/10.3390/f15101767
Submission received: 3 September 2024 / Revised: 24 September 2024 / Accepted: 30 September 2024 / Published: 8 October 2024
(This article belongs to the Special Issue Wood Treatments and Modification Technologies—2nd Edition)

Abstract

:
This paper examined the surface morphology of maple and beech cut through by CO2 laser under different angles relative to the wood grain: 0°, 15°, 30°, 45°, 60°, 75°, and 90°. In the analysis, stylus measurements, stereo-microscopic images, and chemical changes were considered. Laser uncovers more wood anatomical details, with enhanced clarity, when the cutting transitions from along the grain to across the grain. This is particularly noticeable in the earlywood and is more pronounced in maple compared to beech. The first tissue of earlywood was deeply ablated by the laser, leading to a wavy anatomical pattern, which is more visible for higher angles of laser cutting in relation to the wood grain. The anatomical structure of beech was more affected by carbonization in comparison to maple and had a significantly higher core roughness, Rk. For both species, the worst surface roughness occurred when cutting at 15°. In maple, the laser caused more degradation of the polysaccharides compared to beech, and this impact was particularly noticeable parallel to the grain rather than at a 90° angle. The degradation of hemicelluloses occurred in parallel with more advanced cellulose degradation for beech compared to maple and for cutting along the grain compared to across the grain. Structural changes in lignin, such as condensation processes, were observed for both species.

1. Introduction

CO2 lasers are the most suitable lasers for cutting wood because wood has a low thermal conductivity and can absorb electromagnetic energy of a 10.6 µm wavelength [1]. However, because wood is an anisotropic material, it presents some challenges when cut by laser due to, among many other factors, the variability between wood species and their different anatomies and chemical composition, or the different cutting directions with regard to the wood grain [2,3,4,5,6,7,8,9]. A review of the parameters that influence wood cutting by a CO2 laser was provided by Martínez-Conde et al. [1], who included the following parameters: the laser processing parameters (the laser power, the laser feed speed, optical adjustments, gas jet system, and pressure); the wood properties (optical properties, moisture content, density, and material thickness), and the result on the final surface (surface roughness, cutting kerf, and heat affected zone).
Another topic of interest was the chemical changes that occur in wood as a result of laser treatment. In [10], the authors studied the chemical changes in beech wood engraved by different CO2 laser irradiation doses and concluded that polysaccharide structures are modified considerably when the irradiation dose increases. They reported the degradation of hemicelluloses, together with decarboxylation (mainly deacetylation) and bond cleavage in lignin. These modifications were also confirmed by other studies, such as Kubovsky and Kačík on lime [11]; Kubovsky et al. on maple, beech, and lime [12]; Kúdela et al. on oak [8]; Kúdela et al. on spruce on engraved surfaces [6]; and Gurău et al. on maple cut through by CO2 laser [5]. The magnitude of these chemical changes is species-dependent [8].
The chemical changes in the wood composition and structure of its main chemical components can be revealed by the changes in the infrared (IR) spectra. These highlight the selective absorption of IR radiation, which corresponds to the energy associated with the specific vibration modes of different chemical bonds, functional groups, and other specific chemical features of the organic compounds. Fourier-transform infrared spectroscopy (FTIR) was, therefore, frequently employed to highlight and compare the chemical changes brought about by the laser processing of wood surfaces of various wood species (e.g., [10,11,12]).
CO2 laser is increasingly used for wood surface treatment, not only for engraving or cutting, but also to achieve specific changes in surface properties, especially those regarding the wood’s morphology and color [6].
The energy of the laser beam is absorbed in wood, causing the sublimation of a thin surface layer, producing structural changes in wood, material melting, and the formation of a carbonized layer [7]. The higher the laser power, the higher the heat affecting the wood, leading to enhanced melting, vaporization, and the removal of wood material [8,13]. The thickness of the sublimated layer and the changes in the wood surface structure depend on the species and its structural heterogeneity [6,14]. The heat-affected wood zone, among other factors, depends on the wood species, earlywood and latewood zones, cutting direction in relation to the wood grain, and the laser processing parameters [8,13,14,15].
Some authors acknowledged the presence of a wood reaction, characterized by anatomical waviness, especially when the wood is cut across the grain. Adamčík et al. [2] have cut spruce, beech, and oak using a CO2 laser and examined the surface quality when the wood was cut at a 90° angle to the grain. They suggested that the surface morphology should be best described by the primary profile parameters, which include surface roughness and the particular earlywood/latewood waviness, with the latter being caused by a deeper ablation of the earlywood. They found that spruce had the highest anatomical waviness after laser cutting; this result was attributed to the greater density difference between the earlywood/latewood among the studied species. Similar observations about the occurrence of earlywood/latewood waviness were made by other researchers, such as Guo et al. on the surface of pine [16], Gurău et al. on larch [17], and Gurău et al. on maple cut through by CO2 laser [5]. Kúdela et al. [14] reported a similar phenomenon for the surfaces of spruce, beech, and oak processed by engraving with a CO2 laser. A study by Li et al. on poplar [18] also found similar results. As far as the surface roughness is concerned, Kúdela et al. [19] measured the parameters Ra, Rz, and RSm on beech wood engraved with a CO2 laser at different laser irradiation doses, but there were no significant morphological changes except for the highest irradiation values (laser power 45 W and 6 mm/s speed), which led to a complete surface carbonization and the occurrence of surface cracks. When the roughness was measured perpendicular to the grain, for CO2-laser-engraved surfaces, the roughness parameters were significantly influenced by the wood species and the variation in laser ablation between the earlywood and latewood. This ablation produced an undulated surface corresponding to the sequence of annual growth zones in spruce, beech, and oak, depending on the irradiation dose and raster density [8,14]. In all these studies, the roughness profiles included this specific species’ behavior as surface undulation. Rezaei et al. [9] studied the anatomical and morphological changes in beech wood after CO2 laser cutting in a direction parallel to the grain and on a tangential section with a high power of 3200 W. The roughness parameter Ra did not differ significantly with the laser feed speed (3 or 3.5 m/min), but changes were observed in the middle lamella, which was completely degraded at the low feed speed. The influence of the cutting direction of the CO2 laser relative to the wood grain on surface quality was studied by Gurău et al. on maple [5], where the core roughness, Rk, did not show significant differences relative to the direction of cutting. The laser enhanced the anatomical waviness, with the earlywood being processed more deeply.
The modification of the wooden surfaces produced by the laser beam represents a fundamental technology with many potential applications [20]. Johansson and Sandberg [21] have used the technique of UV laser ablation instead of a microtome to obtain thin sections of wood for microscopic characterization. They found that this cutting method has little influence on the material, and very little chemical change is produced in wood. The laser-cutting method proved to be particularly useful for studying end-grain wood sections, which are brittle and more difficult to process with a microtome without damaging the wood structure. Apart from ablation, the laser beam can be used to remove microscopical amounts of wood, to clean or to prepare the surface for coatings by controlling the energy input [8,20,22]. Haller et al. [20] mentioned that a suitable parameter set, including the case of CO2 laser cutting, can make it possible to obtain damage-free surfaces without carbonization after laser ablation. Seltman [23] initially proposed this technique to eliminate a thin wood layer containing tool marks and fibers that were dislodged during prior mechanical processing (sawing and planing). This process effectively exposes the wood structure. In 1998, Wu and Seltman observed that UV laser irradiation is a useful and practical method for revealing wood anatomical details, especially on the wood cross-section, and it is comparable with very fine sanding, such as over 800 mesh [24]. Similarly, Guo et al. [25] stated that an optimal laser power density can smooth the wood surface and can reach the targeted effect of ablation, making the usual operations of milling and sanding unnecessary. The study was performed with a nanosecond laser on four wood species, among which are beech and pine. In a review study of Martínez-Conde et al. [1], cutting by the CO2 laser was compared to sawing. The saw blade penetrates the workpiece and disintegrates wood by chipping it and developing a new surface, which will contain the tool’s cycloidal marks on it, whereas the laser cuts by burning and vaporization, generating a smooth surface that does not require further sanding.
In comparing the CNC and CO2 cutting of maple using different angles relative to the wood grain, Gurău et al. [5] found that, at 75° and 90°, the CNC machine processing causes dust clogging in the pores. At the same time, the laser seems to open the cells’ cavities. The surface processed by the laser was used as a reference, contributing to the quantification of deep anatomical cavities, which helped better understand the origin of surface irregularities (anatomical or processing) in the case of CNC-processed surfaces. The fact that the laser can open the wood structure could be a comparative reference in further studies intending to evaluate the processing roughness after mechanical processing, where the anatomical irregularities must be disregarded.
The literature contains different studies on cutting wood with CO2 lasers, conducted under various conditions and using different cutting parameters, making comparisons between studies unreliable [1]. It is necessary to conduct comprehensive research on wood surface property modifications for different wood species, using an identical methodology [6]. Therefore, the research in this paper uses the same laser parameters and cutting variables as in our previous studies on larch [17] and maple [5], to have the same term of comparison and to observe the different species’ behavior when cut through by CO2 laser, under different angles relative to the grain. The quantification of wood anatomy, revealed by the laser, may stand as a reference for milling applications. For instance, it can be used to assess processing marks while eliminating the influence of wood anatomical irregularities [2,26].
The purpose of this paper research is to understand the following:
  • The morphological changes (surface topography and microscopic changes) of maple and beech wood when cut under similar conditions, and at different angles relative to the wood grain, where the stratified surface topography will be interpreted using measured profile irregularities, quantified by quality parameters and compared with microscopic images;
  • If the laser can uncover wood anatomical details and the cutting direction relative to the grain is a factor of influence;
  • If the chemical changes, measured by FTIR, depend on the cutting direction relative to the grain;
  • If there are any differences in surface morphology and chemical changes between the two species.

2. Materials and Methods

2.1. Wood Samples and Laser Processing

Maple wood (Acer pseudoplatanus) and beech wood (Fagus sylvatica) panels, with radial cut faces, were first processed by straightening one face and one edge, followed by precision planning on the other face and edge (separate machining), so that the final dimensions were 370 mm × 200 mm × 12 mm. After that, samples 80 mm × 11 mm × 12 mm were cut out from the radial face by a CO2 laser (with continuous wave beam, a wavelength of 10.6 µm, 88.9 mm focal length, and 0.150 mm spot size). The samples length was at 0°, 15°, 30°, 45°, 60°, 75°, and 90° angles relative to the wood grain (Figure 1a). The surface quality was evaluated on the laser-cut edges (80 mm × 12 mm) (Figure 1b). Two edges were examined for each cut-out sample. The specimens had a mean density of 556 kg/m3 for maple and 681 kg/m3 for beech, with a moisture content of 6.4% for maple and 6.6% for beech, measured after laser cutting.
The cutting process was carried out using a CO2 laser-cutting machine, specifically the OmniBEAM 150 from COHERENT, Inc. in Santa Clara, CA, USA. The machine operated at a maximum power of 150 W and a maximum feed speed of 50.8 mm/min, while utilizing nitrogen as the purge gas.2.2.

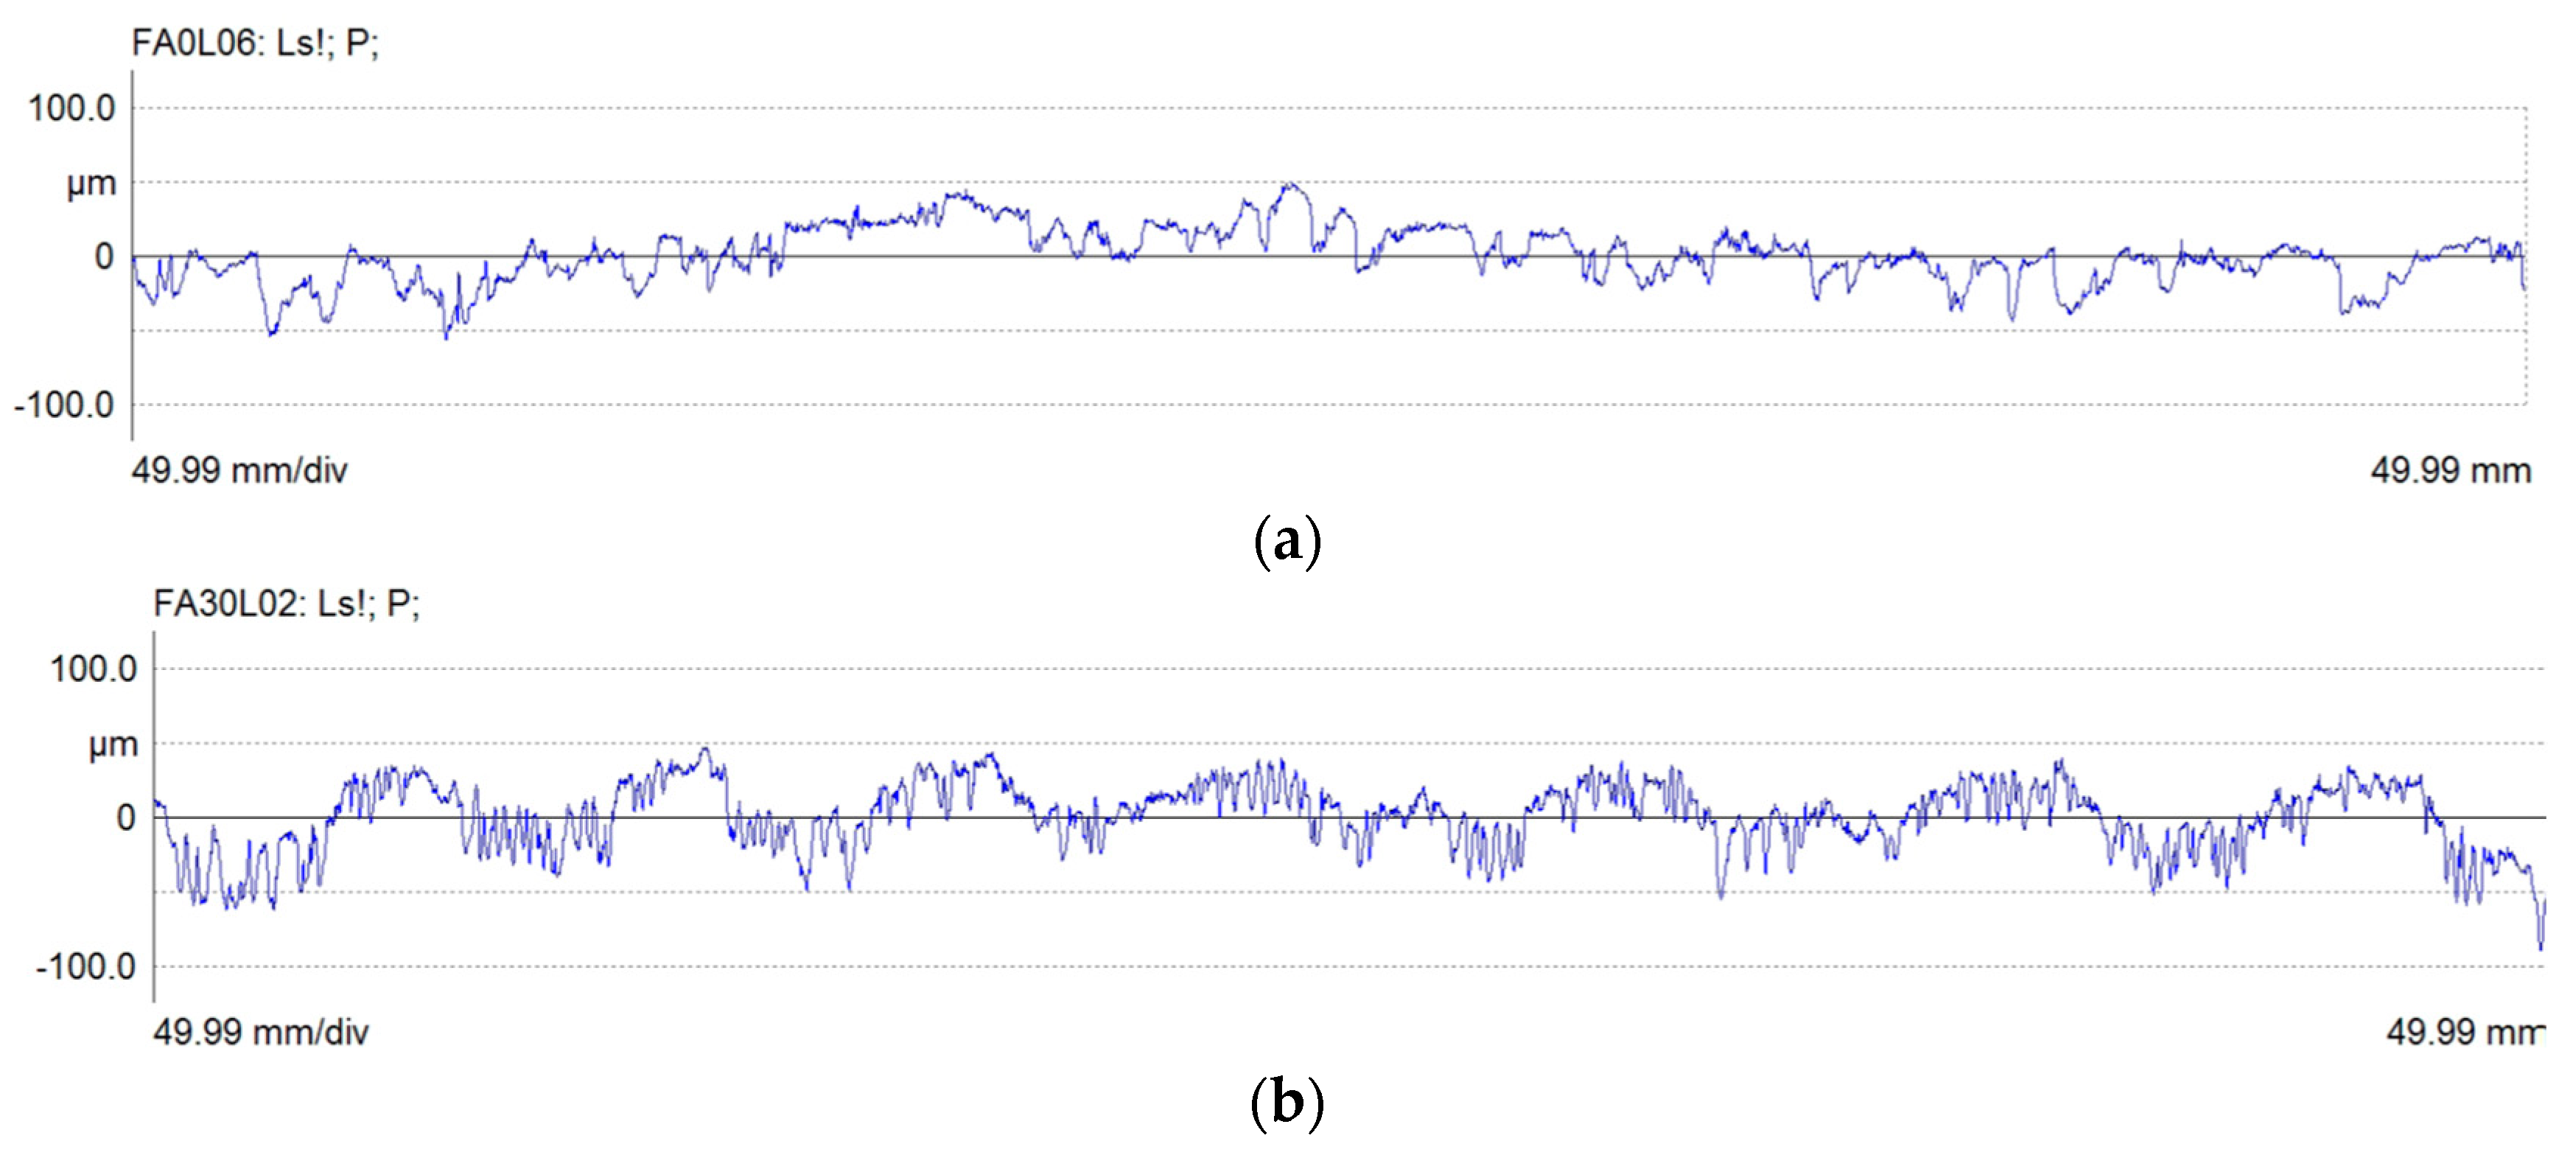
2.2. Surface Quality Measurements

A MarSurf XT20 instrument manufactured by MAHR Gottingen GMBH (Göttingen, Germany) was used for surface measurements. It was equipped with an MFW 250 scanning head having a tracing arm in the range of ±750 µm and a stylus with the following characteristics: 2 µm tip radius and 90° tip angle. The measurements were made on the specimens’ edges, along the processing direction. The stylus moved with a speed of 0.5 mm/s and exerted a low scanning force of 0.7 mN. For each measured edge, three profiles with a length of 50 mm were recorded at a lateral resolution of 5 µm, which meant six profiles were analyzed for each sample, with each of the seven angles of laser cut relative to the wood grain.
Next, the measured profiles were processed using the MARWIN XR20 software provided with the instrument. The initial step involves removing form errors. To achieve this, polynomial regressions were utilized to identify the best-fitting curves for the measured profiles. The “primary profile” is then derived by subtracting the best-fit curve from the measured profile, as detailed in ISO 4287 [27] (now replaced by ISO 21920-2:2021 [28]). The primary profile consists of irregularities in two different wavelength ranges: waviness and roughness. The longest wavelengths represent the waviness and the shortest represent the roughness. To separate the waviness from roughness, a robust Gaussian regression filter was used, following the guidelines of ISO/TS 16610-31 [29]. The selected cut-off length was 2.5 mm as recommended for wood [26,30,31]. Various parameters were used to analyze the surface topography, including Rv (the largest absolute profile valley depth), Rsk (skewness of the profile), RSm (mean width of the profile elements), and Wa (arithmetical mean deviation of the waviness profile) [28]. Wood has a stratified structure with specific wood anatomy, so the Abbot-curve parameters are recommended [26,31]. For this study, we selected Rk (the core roughness depth), Rpk (the reduced peak height), and Rvk (the reduced valley depth) from ISO 13565-2 [32], which has been replaced by [28]. The explanation regarding the calculation of Abbot-curve parameters can be found in Gurău et al. [17]. It is important to analyze a range of parameters, as each of them describes a certain characteristic of a surface and can help interpret its morphology.

2.3. Stereo-Microscopy Analysis

The cut edges were examined using a stereo-microscope NIKON SMZ 18-LOT2 (Nikon Corporation, Tokyo, Japan). The micrographs taken from all the samples processed by laser were compared and thoroughly analyzed together with the results of the surface quality measurements.

2.4. Chemical (FTIR) Analysis

Fourier-transform infrared spectroscopy (FTIR) was the method selected to investigate the temperature-induced chemical changes on the maple and beech wood surfaces cut through by laser, as reported in previous research [5]. FTIR-ATR spectra were obtained from the cut-through surfaces processed by laser at angles of 0° and 90° relative to the wood grain, in comparison with control samples, which were processed at the same angles using a CNC machine [5]. An ALPHA Bruker spectrometer (Bruker, Ettlingen, Germany) equipped with an attenuated total reflectance (ATR) unit was used for this purpose.
To conduct the analysis, thin, small samples (with a thickness of about 0.2–0.4 mm and surfaces of about 5 × 5 mm) were extracted from the areas of interest using a sharp, flexible blade. All FTIR-ATR spectra were recorded in the range of 4000–400 cm−1, with a resolution of 4 cm−1 and 24 scans. Three spectra were taken for each category of wood samples. The spectra underwent baseline correction and smoothing, and average spectra were generated using OPUS software (version 7.2, Bruker, Ettlingen, Germany)). The average spectra were normalized (by Min–Max normalization) and then analyzed to identify the specific chemical composition of the wood material and the chemical changes caused by laser processing. The characteristic absorption bands were determined by referencing literature (Table 1).
The next step was to integrate a series of relevant absorption bands from the FTIR spectra using the OPUS software. Some ratios of relevant absorption bands were calculated to gain a better understanding of the temperature-induced chemical changes on the wood surface resulting from laser cutting. Factors such as wood species and the angles of laser cut relative to the wood grain were considered during data processing, as they could potentially have an impact.

3. Results

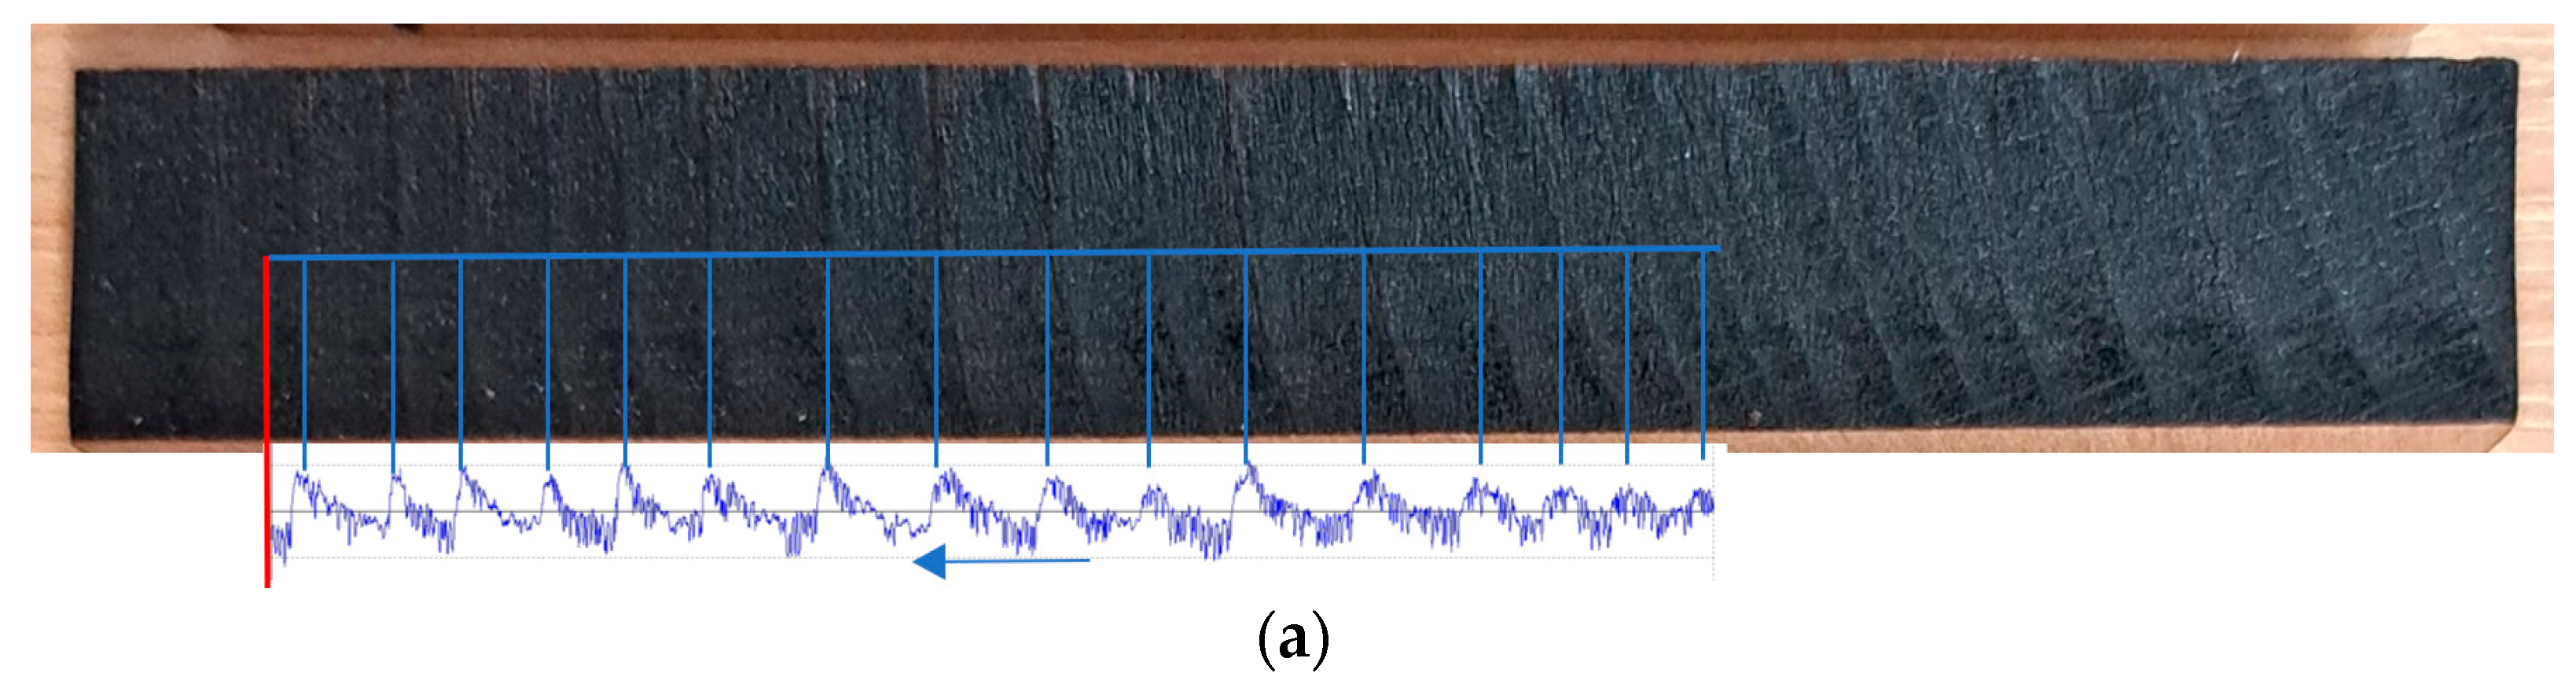
3.1. Surface Quality Measurements and Stereo-Microscopy Analysis

Table 2 presents the mean values and standard deviations for the parameters analyzed in the surface morphology of beech and maple when processed by laser at seven angles relative to the wood grain.
The highest concentration of data points is best represented by the parameter Rk, a stable parameter that excludes the influence of isolated peaks (surface fuzziness) or isolated gaps (deep pores or surface cracks) on the surface. Table 2 and Figure 2 show how Rk changes with the angles of laser cut relative to the wood grain and species.
An ANOVA pairwise comparison has shown significant differences in Rk between species for all angles relative to the wood grain, except for 0° (cutting along the grain). Table 3 indicates that the interaction effect of species on the Rk parameter was significant. This means that the core roughness of beech was significantly higher than that of maple. For example, the Rk for beech cut at 75° was two times higher than that for maple. However, for cutting along the grain, the Rk was similar for both species.
In the same species, the ANOVA test revealed no significant differences in Rk based on the angles of laser cut in relation to the wood grain (Table 4). However, an exception was observed in beech, where Rk for cutting along the grain was significantly lower compared to the other cutting directions relative to the grain. For both species, the highest Rk values were found when cutting at 15° (Figure 2). Similarly, Gurău et al. [5] also reported that the worst Rk values for maple were observed when cut with a laser at a 15° angle relative to the grain.
Next, comparative roughness profiles along with comparative microscopic images were explored to gain a deeper understanding. The roughness profiles were selected for 0°, 45°, and 90°, and are contained in Figure 3.
The profiles shown in Figure 3 should be understood as a superposition of the surface fuzziness (Rpk) above the processed surface and deep wood pores below the processed surface (Rvk). The processed surface is measured by the core roughness parameter, Rk, which evaluates the height of the central profile region around the zero line (above and below). This region contains the traces/marks of the cutting tool and the anatomical wood voids within its limits. In the case of laser processing, this central region will also contain the zone affected by carbonization and melting, as well as anatomical cavities uncovered by the laser, characterized by frequent occurrences such as fiber cavities. Larger wood anatomical cavities, like pore lumens, will be deeper and less frequent, and will be depicted by the parameter Rvk, which measures the depth of the zone located below the central zone (Table 2). Higher values of Rvk compared to Rpk, as well as a negative skewness, Rsk, indicate that the valleys in the profiles have a higher magnitude than the peaks. Maple had higher Rvk values compared to beech, which aligns with their different anatomy as revealed by the laser. The parameter Rv, which measures the deepest valley in a profile, also showed higher values for maple compared to beech (Table 2). Within the same species, Rv remained almost constant from the 30° angle onwards and was within the range of mean wood pores for both species. At a cutting angle of 15°, Rv for both species was notably higher than the values for the other angles, possibly due to the presence of cracks on the surface at the lower side of those samples (Figure 4). This finding indicates that the 15° angle not only yielded the worst surface quality as measured by Rk but also revealed cracks depicted by Rv for both species. The lower side, corresponding to the deepest laser penetration, was more affected than the upper side. According to Martínez-Conde et al. [1], only the top layer is directly cut by vaporization while going deeper, the material is cut by burning. Similarly, Corleto et al. [4] found a lighter color on the upper side when cutting beech with a CO2 laser.
As the angle of the laser cut relative to the wood grain increased from 0° to 90°, more anatomical details were uncovered in both species. The density/frequency of irregularities in the roughness profiles visibly increased (Figure 3). At 0°, the pores were cut longitudinally, appearing as wide and deep features in the roughness profiles. The width of irregularities actually measures the length of the pores’ cavities revealed by the laser processing. The number of measured irregularities increased as the angle of laser cut relative to the wood grain increased from 15° to 90°, displaying a higher number of crosscut pores, which gradually decreased the value of the RSm parameter (Table 2). RSm quantifies the width of irregularities and was higher for maple compared to beech, regardless of the cutting direction. This can be explained by the larger pore width in maple compared to beech.
The roughness profiles shown in Figure 3 indicate that the data density of beech is higher than that of maple. This corresponds to the species anatomy: the frequency of pores in beech ranges from 80–125–160/mm2, while, for maple, it ranges from 34–38–44/mm2 [37]. It might be that, due to their high frequency, some of the small-sized pores in beech were retained in Rk, causing it to appear higher than in maple. The more scattered the core data, the higher the Rk value.
Furthermore, to understand why the surface roughness, Rk, was higher in beech than in maple, it is worth looking at comparative microscopic images taken for both species in Figure 5.
From Figure 5, it can be observed that the anatomical structure of maple looks less affected by carbonization compared to beech at the same laser processing angle relative to the wood grain. As the angle increases, the anatomical details of the maple become more clearly identifiable. The higher presence of carbonized tissues in beech may have also contributed to the difference in Rk between the two species.
By looking at the wood fibers in maple, their lumens become very visible as the cutting transitions from along to across the grain. In contrast, in beech wood, the fiber lumens are hard to distinguish. According to the literature, the size of fiber lumens in maple ranges from 6.5 to 10 to 14.5 µm, while, in beech, they are narrower, measuring 3.5 to 7.1 to 11.2 µm [37]. The lower density and larger lumen size in maple suggest that it behaves differently when subjected to laser heat. When cut at higher angles relative to the wood grain, especially between 45° to 90°, the material melts, carbonizes, and evaporates, revealing new, almost untouched tissue beneath. This is particularly noticeable in the earlywood regions. The latewood, with narrower cell lumens, undergoes carbonization at the annual growth limit. The wood pores of maple have a size of (25) 30–50–70 (110) µm in some 34–38–44/mm2. The middle of the range is similar to the size of pores in beech, 45 µm (8–45–85 µm). However, beech has a higher frequency of pores, numbering 80–125–160 pores/mm2. The higher frequency of pores in beech can be seen in the comparative micrographs (Figure 5) as well as in the roughness profiles (Figure 3).
Except for the pores’ lumens from earlywood, all the other types of beech cells appear carbonized or melted. The wood structure at the edge of the annual ring is unidentifiable, with mostly carbonized tissue in the latewood. The area before the ring boundary is mainly in a molten state (Figure 5j). The first layer of earlywood tissue was strongly ablated by the laser, forming a sudden gap in the surface, which, after the volatilization of material, has left identifiable earlywood pores. The laser ablation effect can be best seen in the primary profiles, which contain not only the roughness but also the waviness (Figure 6). Cells with small lumens (fibers or ray cells) remained in a melting–carbonization stage without progressing to the next stage of volatilization, an observation similar to Kudela et al. [19] and Adamčík et al. [2]. According to Martínez-Conde et al. [1], in the case of dense species, the laser would need a longer time for the vaporization and burning. This shows that wood–laser interaction depends on the wood species and its structure, as well as its chemical composition, as will be discussed later.
The thermal conductivity increases gradually as the cutting direction changes from along the grain (0°) to across the grain (90°). At 90°, the cells expose more lumens and air, which speeds up the carbonization process. This is especially noticeable in earlywood, where material vaporization occurs. This explains why laser cuts at higher angles relative to the wood grain (90°, 75°, or 60°) display the wood’s anatomy with more clarity and detail compared to smaller angles (0°, 15°, 30°, or 45°) as shown in Figure 2 and Figure 4. These results appear to confirm the findings of Haller et al. [20], who stated that a laser can reveal the wood’s anatomical structure.
The micrographs confirm the observations in the roughness profiles: the laser seems to reveal more wood anatomical details when the cutting is progressing from along to across the grain, and the wood structure is displayed with more clarity, especially in tissues of earlywood and generally, in those with large cavities. The deposition of residue and molten material in those cavities might be possible; however, the micrographs show no evidence of the sealing or complete closure of lumens (similar to Nath et al. [13]).
To observe the ablation caused by the laser, the primary profiles were examined. The primary profiles contain not only surface roughness but also waviness, which measures the irregularities of the surface at higher wavelengths. Figure 6 is an example of primary profiles taken from beech, which show how the laser generates a wavy pattern as the angle of the laser cut relative to the wood grain increases from a cutting along the grain (0°) to a perfect crosscut direction (90°).
To gain a better understanding of the effects of laser processing, the primary profiles were overlapped onto the specimens’ images, precisely at the locations where those profiles were measured. An example was selected for both species, which were cut by the laser at 75° relative to the wood grain (Figure 7).
The laser has deeply ablated the earlywood, creating a noticeable gap in the first tissue of the annual ring, which appears as a sudden void in the primary profile. The ridges correspond to the denser latewood, which is affected to a lesser extent than the earlywood. Similar observations were made by various researchers: Kúdela et al. [14] noticed the highest magnitude in spruce, then oak, and, lastly, on beech wood; Kudela et al. on spruce wood [6]; Adamčík et al. on spruce, beech, and oak wood [2]; Gurău et al. on maple [5]; and Gurau et al. on larch [17]. The waviness created by the laser on the beech and maple surfaces corresponds to the sequence of earlywood–latewood and their location on the surface. The anatomical waviness influences the parameter Wa, whose values are presented in Table 2 and seem to decrease towards the high cutting directions, with the pattern increasing in frequency, for both species.
In conclusion, concerning the morphological changes, the earlywood anatomy is revealed by a sublimation process, which removes a layer of material, leaving the anatomical pattern below almost unchanged. The way the laser uncovers the wood anatomy of earlywood–latewood depends on the species.
In further work, the Rvk and Rv determined after processing with laser could serve as a good approximation of the depth to which a stylus penetrates the pores of earlywood. These parameters can provide a reference point for analyzing the surface morphology of maple and beech that have been processed using a mechanical tool. This analysis can help researchers identify isolated features on the surface that extend deeper than the wood’s anatomical voids, such as material pull-out, surface fissures, and cracks. Having a reference point for the maximum stylus penetration depth in the earlywood of a specific species can help differentiate between anatomical roughness, processing roughness, and occasional surface defects. Such an attempt was successful in the study of Gurău et al. [5], where the surface quality of maple edges routed with an integral helical CMS milling cutter on a CNC machine was compared to that processed by a CO2 laser. The laser revealed the wood anatomy in the earlywood cells, particularly when cutting the wood at high angles in relation to the grain (45–90°). In that previous study, the laser-cut surfaces helped to understand the origin of irregularities (whether anatomical or caused by processing) that occurred after CNC through routing.

3.2. FTIR Investigation of Chemical Changes

The spectra of the control (C) and laser (L) cut-through maple and beech wood surfaces in the fingerprint region (1800–600 cm−1) are presented in Figure 8a,b. These spectra correspond to the laser-cut angles of 0° and 90° in relation to the grain.
The control samples of maple and beech wood both demonstrate similar absorption bands. These include approximately 1733 cm−1 (stretching of unconjugated carbonyl groups in hemicelluloses/pentosans and C=O groups in lignin), 1635–1645 cm−1 (vibration of conjugated carbonyl groups/aromatic ketones in lignin), 1594 cm−1 (aromatic skeletal breathing and C=O groups stretch in lignin), 1504 cm−1 (aromatic skeletal vibration in lignin), 1456 cm−1 (asymmetric deformation of aromatic C-H, asymmetric bending –CH3 in lignin), 1421 cm−1 (asymmetric C-H deformation in lignin and carbohydrates), 1369 cm−1 (symmetric C-H deformation in cellulose and hemicelluloses), 1324 cm−1 (C–O vibration in syringil derivatives, syringil ring breathing, and C-O alkyl-aryl ether bond assigned to methoxyl groups in lignin), 1234 cm−1 (C-O stretch in lignin and xylan, and syringyl ring), 1153–1155 cm−1 (antisymmetric stretching of C-O-C ether bridge in cellulose and hemicelluloses), cca 1030 cm−1 (C-O stretching in cellulose/hemicelluloses and, alcoholic –OH groups), and cca 900 cm−1 (C-H deformation in cellulose ring) [33,38]. This demonstrates both the similar main chemical features of hardwoods and the particularities of each species, with slightly different relative intensities or shifting of certain absorptions.
Available data of wet chemical analysis indicate, for maple, a content of 38.3% cellulose, 20.3% pentosans, 25.3% lignin, and 2.5% extractives, while the corresponding values for beech were 49.1% cellulose, 22.0% pentosans, 23.8% lignin, and 0.8% extractives [39]. Although the variability of wood chemical composition as a function of many factors is well-acknowledged [39], the above data indicate some differences in the ratios of the main chemical components for the two wood species (e.g., pentosans–cellulose ratios of 0.53 for maple and 0.44 for beech; and cellulose–lignin ratios of 1.5 for maple and 2.2 for beech).
The process of laser cutting resulted in noticeable changes in the surface chemistry of both wood types and the angles of the laser cut relative to the wood grain. The angle of the laser cut only had a direct observable influence in the case of beech (in the range of 1730–1600 cm−1). Similar to what has been previously reported for maple wood [5], the most significant common change was a substantial decrease in the absorption at around 1732 cm−1 (mainly due to hemicelluloses, specifically pentosans), along with a shift towards lower wavenumbers (approximately 1717 cm−1), indicating the degradation of hemicelluloses primarily by deacetylation [8,12]. Additionally, the absorptions at around 1369 cm−1 (related to hemicelluloses and cellulose) and around 900 cm−1 (related to cellulose) appeared to be less affected (a slight decrease visible for the band at 1369 cm−1), suggesting a more advanced degradation of hemicelluloses compared to cellulose, which is in line with their relative thermal stability. The noticeable change we observed was a significant decrease and almost disappearance of absorption at around 1635–1645 cm−1, which is associated with conjugated carbonyl and aromatic ketones in lignin. This was accompanied by a significant increase and broadening of the absorption band at 1594 cm−1, characteristic of aromatic ring breathing. These changes suggest an increase in structural diversity around the aromatic rings, resulting in the absorption of a wider range of frequencies due to structural changes in lignin. At the same time, the most characteristic absorption band of lignin at around 1504 cm−1 (aromatic skeletal vibration) seemed less affected in intensity (apparent slight increase for beech, more evident at laser cutting along the grain), although it was shifted to 1508 cm−1 for both wood species, regardless of the angle of laser cut relative to the wood grain. This might indicate some thermal demethoxylation of syringyl rings to guaiacyl rings, with hardwood lignins being found to be more sensitive than softwood lignins [40].
The observations confirm that there are changes in the structure of lignin, such as condensation processes. These changes may involve the reactive conjugated carbonyl groups in the α position of the propane side chain, as discussed by Kubovský and Kačík [11]. Those authors proposed a reaction pathway that includes the oxidation of α-C=O groups followed by decarboxylation and further condensation with adjacent benzene rings in an acidic medium forming diphenylmethane structures. The slight decrease in absorption at 1324 cm−1, which seems to be more significant in the beech laser-processed samples, could indicate the removal of methoxy groups from the syringyl units [8] due to the cleavage of the C-O alkyl-aryl ether bond. This process may lead to more free reactive sites, potentially favoring the further condensation of lignin. The absorption at 1234 cm−1, which represents the syringyl ring with C-O vibration in the lignin and xylan acetyl groups, decreased in intensity and became broader for all laser-cut surfaces. This aligns with previously observed changes in the structure of hemicelluloses and lignin. Another notable observation is the absorptions at 1153–1155 cm−1 (C-O-C ether bridges in the structure of polysaccharides) and 1105 cm−1, which appeared as shoulders on the broader absorption band with a maximum at around 1030 cm−1. These absorptions became more pronounced after laser processing, especially in the case of maple cut by laser along the grain, indicating modifications in the structure of cellulose. These changes may involve dehydration processes and the formation of new ether bridges, as discussed by Kubovský and Kačík [11]. The chemical changes and differences between the two species under study, as well as the effect of the angle of laser cutting in relation to wood grain, are more accurately shown in Table 5 and Table 6. These tables provide numerical data resulting from a semi-quantitative evaluation based on the integration of the areas of the relevant absorption bands, along with the calculation of relative values laser/control. The laser/control relative areas are presented as ratios of the areas corresponding to the laser-cut surfaces and the control surfaces processed by CNC routing (in Table 5). On the other hand, the relative ratios of relevant absorption bands are calculated by dividing the ratio of those bands for laser-cut samples to the ratio of control samples and are presented in Table 6. In both cases, values close to 1.0 would indicate no change due to laser cutting. Values significantly lower or higher than 1.0 would suggest a decrease or increase in the respective absorptions or ratios of components, as a result of chemical changes caused by laser processing.
Based on the discussion and data provided, it can be concluded that FTIR analysis highlighted thermal-induced surface chemical changes that occur after laser cutting. It also indicated some influences of the wood species and angle of laser cut relative to the wood grain. These changes affected both polysaccharides (as indicated by the relative integrated areas of absorption bands at 1732 cm−1, 1369 cm−1, 1030 cm−1, and 900 cm−1) and lignin (as indicated by the relative integrated areas of absorption bands at 1635–1645–1594 cm−1, and 1504–1508 cm−1) (Table 5). These changes are also reflected in the relative ratios of the relevant absorption bands (Table 6).
The main changes of polysaccharides involved advanced deacetylation and the further degradation of hemicelluloses (pentosans). These changes were more pronounced in maple than in beech, as indicated by the relative areas of absorption at 1732 cm−1, which were 0.26 and 0.44 for maple at 0° and 90°, respectively, compared to 0.74 and 0.61 for beech. Additionally, the relative ratios of the relevant absorptions A1732/A1369 were 0.49 (0°) and 0.59 (90°) for maple. The comparative values of 1.30 and 1.09 for beech suggest that hemicellulose degradation happens alongside some cellulose degradation. This means that the FTIR ratio of hemicellulose to hollocellulose is not affected (1.09 at 90°) or may even slightly increase when cutting along the grain (1.30 at 0°). The structure of cellulose may experience some loss of hydroxyl groups and cross-linking by ether bridges. Cellulose degradation is more advanced in beech than in maple, especially when cutting along the grain rather than across it, as indicated by the relative areas of the absorptions at 900 cm−1. These areas are all lower than 1.0 and smaller for beech compared to maple, with the lowest value (0.42) for cutting along the grain. Additionally, the relative ratio values A900/A1369 (cellulose/hollocellulose) are lower than 1.0 for beech. The differences in the content of cellulose and hemicelluloses (pentosans) and the pentosans–cellulose ratios of 0.53 for maple and 0.44 for beech might explain their different behavior.
Previous studies on the effect of the CO2 laser beam on the color and surface chemistry of maple and beech wood indicated that higher levels of irradiation doses led to a gradual decrease in the saccharides content and a noticeable loss of hemicelluloses. Additionally, the degradation of amorphous regions of cellulose was observed. Variations were noted in the rates of hemicelluloses degradation between maple and beech, and species-dependent patterns in the FTIR spectra in the range of 1800–1500 cm−1 were reported in the same study [12]. The decrease in the absorption band at 1030 cm−1 for CO2-laser-engraved oak surfaces was considered to indicate degradation processes in the cellulose [8].
The degradation of polysaccharides resulted in a higher ratio of lignin to hemicellulose (A1504/A1369), which was more significant for beech (2.22 and 1.90) than for maple (1.57 and 1.14), and was higher for cutting along the grain than across the grain. In the case of beech, laser cutting appeared to increase the amount of lignin, as indicated by the relative areas of lignin absorption at 1504–1508 cm−1 (laser/control), with values of 1.26 when cutting along the grain and 1.09 when cutting across the grain. For maple, the corresponding values suggested a slight degradation (0.85–0.87). It is important to note that the two species have different chemical compositions, with the cellulose/lignin ratios being 1.5 for maple and 2.2 for beech. Therefore, even though laser-induced hemicellulose degradation seemed to be more advanced for maple than beech, and cellulose degradation more advanced for beech than maple, the ratio of lignin to hemicellulose could still be higher for laser-processed beech compared to maple. The changes observed in the FTIR spectrum between 1635–1600 cm−1 indicate that lignin condensation occurred through various mechanisms involving reactive α-carbonyl groups and alkyl–aryl ether linkages, leading to cleavage and condensation processes. Consequently, the interaction of a laser beam with wood surfaces is expected to cause surface chemistry changes that depend on the wood species. Factors such as laser parameters, experimental setup, chemical composition, anatomical features, and wood density should be taken into account as influencing factors. These findings are supported by other studies [8,11,12,15,38,41], which have also shown that the chemical changes depend on the wood species, the type of laser, its power, and other laser processing parameters.

4. Conclusions

The morphological and chemical changes of maple and beech cut through with a CO2 laser were investigated.
The laser reveals more details about the wood’s anatomy when the cutting progresses from along to across the grain. This is especially noticeable in the earlywood tissues and cells with large cavities and it is more obvious in maple than in beech. The first tissue of earlywood was strongly ablated by the laser, forming a sudden gap in the surface, which, after the volatilization of the material, has left identifiable earlywood pores and a wavy pattern corresponding to the sequence earlywood–latewood, that was more evident for high angles of laser cut relative to the wood grain. The cells with a small lumen (fibers or ray cells) remained in a stage of melting–carbonization without progressing to the next stage of volatilization, more noticeable in beech than in maple. The anatomical structure of maple was less affected by carbonization in comparison to beech for the same angle of laser cut relative to the wood grain. The roughness profiles of beech had a higher data density than those of maple, reflecting the anatomy of each species and the greater frequency of pores in beech.
The presence of more carbonized tissues in beech leads to a significantly higher core roughness, Rk, compared to maple. However, the influence of the laser-cut angle in relation to the grain direction on Rk was not significant within species, except for 0°, which was significantly lower for beech compared to the other angles. For both species, the highest Rk was found when cutting at 15°, and the surface was affected by cracks depicted by Rv.
The maple wood had higher Rvk values compared to beech, which is consistent with their different anatomical structures as revealed by the laser. For the same species, Rv remained almost constant from the 30° angle onwards and fell within the range of mean wood pores for both species. These parameters, determined after laser processing, provide a good estimate of the depth of pores in earlywood, as detected by the stylus. They can be used as a reference for further studies on surface morphology changes following mechanical wood processing, where only processing roughness is of interest and wood anatomy is not relevant.
The chemical analysis of control samples (CNC-processed) from maple and beech wood showed similar absorption bands, with some slight differences in the intensities or shifts of certain absorptions for each species. Laser cutting caused thermal-induced surface chemistry changes for both wood species at both 0° and 90° angles relative to the wood grain. These changes affected both polysaccharides and lignin. The main changes in polysaccharides involved advanced deacetylation and the further degradation of hemicelluloses (pentosans), which were more pronounced for maple than for beech and along the grain than at 90°. The degradation of hemicelluloses occurred alongside cellulose degradation, which was more advanced for beech than for maple and for cutting along the grain than across the grain. These results were consistent with microscopic observations and core roughness, Rk, measurements. Laser cutting also led to structural changes in lignin, for both species, including condensation processes.
In conclusion, how the laser affects the surface morphology uncovering the wood anatomy to a certain degree, and the chemical changes that it induces are species-dependent. Further work will consider other species processed by laser to understand their specific morphology and chemical changes when cut through under different angles relative to the grain and using the same cutting parameters.

Author Contributions

Conceptualization, L.G.; methodology, L.G. and M.C.T.; surface quality software, L.G. and A.-M.A.; microscopy, L.G. and A.-M.A.; data analysis, L.G. and M.C.T.; validation, L.G. and M.C.T.; formal analysis, L.G. and A.-M.A.; investigation, L.G., A.-M.A. and M.C.T.; resources, L.G. and M.C.T.; writing—original draft preparation, L.G. and M.C.T.; editing, A.-M.A.; supervision, L.G. and M.C.T. All authors have read and agreed to the published version of the manuscript.

Funding

This research received no external funding.

Data Availability Statement

The data are contained within the article.

Acknowledgments

We hereby acknowledge the structural funds project PRO-DD (POS-CCE, O.2.2.1., ID 123, SMIS 2637, No. 11/2009) for providing the infrastructure used in this work and the Contract No. 7/9.01.2014.

Conflicts of Interest

The authors declare no conflicts of interest.

References

  1. Martínez-Conde, A.; Krenke, T.; Frybort, S.; Müller, U. Review: Comparative analysis of CO2 laser and conventional sawing for cutting of lumber and wood-based materials. Wood Sci. Technol. 2017, 51, 943–966. [Google Scholar] [CrossRef]
  2. Adamčík, L.; Igaz, R.; Štefančin, L.; Kubovský, I.; Kminiak, R. Evaluation of the Surface Irregularities of the Cross-Section of the Wood after CO2 Laser Cutting. Materials 2023, 16, 7175. [Google Scholar] [CrossRef] [PubMed]
  3. Castañeda, C.H.J.; Kursad, S.H.; Li, L. The effect of moisture content in fibre laser cutting of pine wood. Opt. Lasers Eng. 2011, 49, 1139–1152. [Google Scholar] [CrossRef]
  4. Corleto, R.; Gaff, M.; Ditommaso, G.; Rezaei, F.; Nemeth, R.; Valente, F.; Sethy, A.K.; Todaro, L. Effect of Moisture Content Levels on the Quality of Beech Wood Cut by CO2 Laser. J. Adv. Manuf. Technol. 2024, 134, 159–169. [Google Scholar] [CrossRef]
  5. Gurău, L.; Coșereanu, C.; Timar, M.C.; Lungu, A.; Condoroţeanu, C.D. Comparative Surface Quality of Maple (Acer pseudoplatanus) Cut through by CNC Routing and by CO2 Laser at Different Angles as Related to the Wood Grain. Coatings 2022, 12, 1982. [Google Scholar] [CrossRef]
  6. Kúdela, J.; Andrejko, M.; Kubovský, I. The Effect of CO2 Laser Engraving on the Surface Structure and Properties of Spruce Wood. Coatings 2023, 13, 2006. [Google Scholar] [CrossRef]
  7. Kúdela, J.; Kubovský, I.; Andrejko, M. Surface Properties of Beech Wood after CO2 Laser Engraving. Coatings 2020, 10, 77. [Google Scholar] [CrossRef]
  8. Kúdela, J.; Kubovský, I.; Andrejko, M. Influence of Irradiation Parameters on Structure and Properties of Oak Wood Surface Engraved with a CO2 Laser. Materials 2022, 15, 8384. [Google Scholar] [CrossRef]
  9. Rezaei, F.; Wimmer, R.; Gaff, M.; Gusenbauer, C.; Frömel-Frybort, S.; Kumar, S.A.; Corleto, R.; Ditommaso, G.; Niemz, P. Anatomical and morphological characteristics of beech wood after CO2—Laser cutting. Wood Mater. Sci. Eng. 2022, 17, 459–468. [Google Scholar] [CrossRef]
  10. Kačík, F.; Kubovský, I. Chemical changes of beech wood due to CO2 laser irradiation. J. Photochem. Photobiol. Chem. 2011, 222, 105–110. [Google Scholar] [CrossRef]
  11. Kubovský, I.; Kačík, F. Colour and chemical changes of the lime wood surface due to CO2 laser thermal modification. Appl. Surf. Sci. 2014, 321, 261–267. [Google Scholar] [CrossRef]
  12. Kubovsky, I.; Kacik, F.; Velkova, V. The Effects of CO2 Laser Irradiation on Color and Major Chemical Component Changes in Hardwoods. BioResources 2018, 13, 2515–2529. [Google Scholar] [CrossRef]
  13. Nath, S.; Waugh, D.G.; Ormondroyd, G.A.; Spear, M.J.; Pitman, A.J.; Sahoo, S.; Curling, S.F.; Mason, P. CO2 laser interactions with wood tissues during single pulse laser-incision. Opt. Laser Technol. 2020, 126, 106069. [Google Scholar] [CrossRef]
  14. Kúdela, J.; Andrejko, M.; Mišíková, O. Wood Surface Morphology Alteration Induced by Engraving with CO2 Laser Under Different Raster Density Values. Acta Fac. Xylologiae Zvolen 2021, 63, 35–47. [Google Scholar] [CrossRef]
  15. Barcikowski, S.; Koch, G.; Odermatt, J. Characterisation and modification of the heat affected zone during laser material processing of wood and wood composites. Eur. J. Wood Wood Prod. 2006, 64, 94–103. [Google Scholar] [CrossRef]
  16. Guo, X.; Deng, M.; Hu, Y.; Wang, Y.; Ye, T. Morphology, mechanism and kerf variation during CO2 laser cutting pine wood. J. Manuf. Process. 2021, 68, 13–22. [Google Scholar] [CrossRef]
  17. Gurău, L.; Coşereanu, C.; Paiu, I. Comparative Surface Quality of Larch (Larix decidua Mill.) Fretwork Patterns Cut through by CNC Routing and by Laser. Appl. Sci. 2021, 11, 6875. [Google Scholar] [CrossRef]
  18. Li, R.; He, C.; Xu, W.; Wang, X.A. Prediction of surface roughness of CO2 laser modified poplar wood via response surface methodology. Maderas Cienc. Tecnol. 2022, 24, 1–12. [Google Scholar] [CrossRef]
  19. Kúdela, J.; Reinprecht, L.; Vidholdová, Z.; Andrejko, M. Surface Properties of Beech Wood Modified by CO2 Laser. Acta Fac. Xylologiae Zvolen 2019, 61, 5–18. [Google Scholar] [CrossRef]
  20. Haller, P.; Beyer, E.; Wiedemann, G.; Panzner, M.; Wust, H. Experimental Study of the Effect of a Laser Beam on the Morphology of Wood Surfaces. In Proceedings of the First International Conference of the European Society for Wood Mechanics, Lausanne, Switzerland, 19–21 April 2001; Available online: https://www.researchgate.net/publication/237543545_Experimental_study_of_the_effect_of_a_laser_beam_on_the_morphology_of_wood_surfaces (accessed on 1 May 2018).
  21. Johansson, J.; Sandberg, D. Preparation of wood with pulsed UV-laser ablation for characterisation of the wood structure. In Fracture Mechanics and Micromechanics of Wood and Wood Composites with Regard to Wood Machining, Proceedings of the 3rd Symposium of Wood-Machining in 2007, Cost action E35, Lausanne, Switzerland, 21–23 May 2007; Navi, P., Guidoum, A., Eds.; Presses Polytechniques et Universitaires Romandes (PPUR): Lausanne, Switzerland, 2007; pp. 191–194. [Google Scholar]
  22. Panzner, M.; Wiedemann, G.; Henneberg, K.; Fischer, R.; Wittke, T.; Dietsch, R. Experimental investigation of the laser ablation process on wood surfaces. Appl. Surf. Sci. 1998, 127–129, 787–792. [Google Scholar] [CrossRef]
  23. Seltman, J. Opening the wood structure by UV-irradiation. Holz Als Roh-Und Werkst. 1995, 53, 100. [Google Scholar] [CrossRef]
  24. Wu, R.; Seltman, J. Microstructural investigation of UV-laser irradiated pine (Pinus silvestris L.). Wood Sci. Technol. 1998, 32, 183–195. [Google Scholar] [CrossRef]
  25. Guo, Q.; Wu, Z.; Zhang, C.; Yang, C.; Ma, Y.; Xu, F.; Cao, Z. Study on a new clean machining method instead of sanding technology for wood. Alex. Eng. J. 2021, 60, 2369–2380. [Google Scholar] [CrossRef]
  26. Gurău, L.; Irle, M. Surface Roughness Evaluation Methods for Wood Products: A Review. Curr. For. Rep. 2017, 3, 119–131. [Google Scholar] [CrossRef]
  27. ISO 4287:1997; Geometrical Product Specifications (GPS). Surface Texture, Profile Method, Terms. Definitions and Surface Texture Parameters. International Organization for Standardization: Geneva, Switzerland, 2009.
  28. ISO 21920-2:2021; Geometrical Product Specifications (GPS)—Surface Texture: Profile Part 2: Terms, Definitions and Surface Texture Parameters. International Organization for Standardization: Geneva, Switzerland, 2021.
  29. ISO/TS 16610-31:2016; Geometrical Product Specification (GPS)—Filtration, Part 31: Robust Profile Filters, Gaussian Regression Filters. International Standards Organisation: Geneva, Switzerland, 2016.
  30. Gurău, L.; Mansfield-Williams, H.; Irle, M. Filtering the roughness of a sanded wood surface. Holz Als Roh-Und Werkst. 2006, 64, 363–371. [Google Scholar] [CrossRef]
  31. Tan, P.L.; Sharif, S.; Sudin, I. Roughness models for sanded wood surfaces. Wood Sci. Technol. 2012, 46, 129–142. [Google Scholar] [CrossRef]
  32. ISO 13565-2:1998; Geometrical Product Specifications (GPS)—Surface Texture: Profile Method. Surfaces having Stratified Fu nctional Properties. Part 2: Height Characterisation Using the Linear Material Ratio Curve. International Organization for Standardization: Geneva, Switzerland, 1998.
  33. Pandey, K.K.; Pitman, A.J. FTIR studies of the changes in wood chemistry following decay by brown-rot and white-rot fungi. Int. Biodeterior. Biodegrad. 2003, 52, 151–160. [Google Scholar] [CrossRef]
  34. Rosu, D.; Teaca, C.A.; Bodirlau, R.; Rosu, L. FTIR and color change of the modified wood as a result of artificial light irradiation. J. Photochem. Photobiol. B 2010, 99, 144–149. [Google Scholar] [CrossRef]
  35. Tolvaj, L.; Faix, O. Artificial Ageing of Wood Monitored by DRIFT Spectroscopy and CIE L*a*b* Color Measurements. 1. Effect of UV Light. Hfsg 1995, 49, 397–404. [Google Scholar] [CrossRef]
  36. Schwanninger, M.; Rodrigues, J.C.; Pereira, H.; Hinterstoisser, B. Effects of short-time vibratory ball milling on the shape of FT-IR spectra of wood and cellulose. Vib. Spectrosc. 2004, 36, 23–40. [Google Scholar] [CrossRef]
  37. Wagenführ, R. Holzatlas, 5th ed.; Fachbuchverlag: Leipzig, Germany, 2000; p. 707. [Google Scholar]
  38. Petutschnigg, A.; Stöckler, M.; Steinwendner, F.; Schnepps, J.; Gütler, H.; Blinzer, J.; Holzer, H.; Schnabel, T. Laser Treatment of Wood Surfaces for Ski Cores: An Experimental Parameter Study. Adv. Mater. Sci. Eng. 2013, 2013, 1–7. [Google Scholar] [CrossRef]
  39. Fengel, D.; Wegener, D. Wood—Chemistry, Ultrastructure, Reactions; Walter de Gruyter: Berlin, Germany, 1984; 613p, ISBN 3-11-008481-3. [Google Scholar]
  40. Esteves, B.; Velez Marques, A.; Domingos, I.; Pereira, H. Chemical changes of heat treated pine and eucalypt wood monitored by FTIR. Maderas Cienc. Tecnol. 2013, 15, 245–258. [Google Scholar] [CrossRef]
  41. Kubovský, I.; Kačík, F. FT-IR study of maple wood changes due to CO2 laser irradiation. Cellul. Chem. Technol. 2009, 43, 235–240. [Google Scholar]
Figure 1. Example of beech specimens cut under different angles relative to the wood grain (a) and their edges cut through by laser (b).
Forests 15 01767 g001
Figure 2. Comparative core roughness, Rk, for beech and maple processed by laser at different angles relative to the wood grain.
Forests 15 01767 g002
Figure 3. Comparative roughness profiles for beech and maple processed by laser at 0°, 45°, and 90°: (a) beech, 0°; (b) maple, 0°; (c) beech, 45°; (d) maple, 45°; (e) beech, 90°; and (f) maple, 90°.
Forests 15 01767 g003aForests 15 01767 g003b
Figure 4. Surface defects (cracks) that occur when cutting wood with the laser at a 15° angle relative to the grain: (a) maple; and (b) beech. The red arrow indicates the location of the defects, which are on the lower side of the specimens.
Forests 15 01767 g004
Figure 5. Comparative microscopic images of maple and beech processed at different angles of the laser relative to the wood grain. Magnification 180× (red indicates annual growth limit; arrows show growth direction). White scale bar for maple—200 µm; black scale bar for beech—100 µm. (a) 0°_maple; (b) 0°_beech; (c) 30°_maple; (d) 30°_beech; (e) 45°_maple; (f) 45°_beech; (g) 60°_maple; (h) 60°_beech; (i) 90°_maple; and (j) 90°_beech.
Forests 15 01767 g005aForests 15 01767 g005b
Figure 6. Primary profiles of beech cut by laser at different angles relative to the wood grain: (a) 0°; (b) 30°; (c) 75°; and (d) 90°.
Forests 15 01767 g006aForests 15 01767 g006b
Figure 7. Surfaces cut by the laser at 75° relative to the grain, with an example of an overlapped primary profile. The arrow indicates the wood growth direction. The red line serves as a guide to align the measured line with the actual profile being measured: (a) beech; and (b) maple.
Forests 15 01767 g007aForests 15 01767 g007b
Figure 8. FTIR-ATR spectra in the fingerprint region (1800–600 cm−1), comparing cut-through wood surfaces, at angles of 0° and 90° relative to the wood grain, for control (C_0, C_90) and laser processed (L_0, L_90) samples of (a) maple (code P) and (b) beech (code F).
Forests 15 01767 g008
Table 1. Literature reference data about the main absorption bands (peaks) observable in the FTIR spectra of wood, in the range of 1800–600 cm−1.
Wavenumber Range
[cm−1]
General Vibrational Assignment
Chemical Bonds/Structural Features of Organic Compounds
Relevance for Wood Spectra
Assignment to the Wood Main Chemical Components
1740–1730Unconjugated C=O stretching vibration in aldehydes, ketones, esters, and carboxylic acidsC=O in acetyl groups in xylans/Hemicelluloses
1645–1630Conjugated C=O stretching vibration in aromatic or conjugated ketones;
water absorbed in wood.
Lignin
1605–1594Aromatic ring C=C stretching vibration in the aromatic ringLignin
1510–1504Aromatic skeletal vibration of ligninLignin
1455C-H deformation in lignin and carbohydrates
Aromatic vibration in lignin
Asymmetric C-H bending from methoxyl groups (in lignin)
Lignin
Cellulose
Hemicelluloses
1425–1421C-H bending
C-H deformation in lignin and carbohydrates
Lignin
Cellulose
Hemicelluloses
1330–1319C-H vibration and C-O stretching relative to syringyl (lignin)
Syringyl ring breathing (lignin)
C-H vibration in cellulose
Lignin (mostly hardwoods)

Cellulose
1235–1230Syringyl ring stretching (lignin)
C-C plus C-O plus C=O stretching vibration in acetyl groups (xylan)
Lignin (mostly hardwoods)
Hemicelluloses/Xylans in hardwoods
1170–1150C-O-C stretching vibration in polysaccharidesCellulose
Hemicelluloses
1030–1020C-O vibration in polysaccharides
C-O-C deformations in polysaccharides
Cellulose
Hemicelluloses
898–896C-H deformation in celluloseCellulose
Data compiled from literature references [33,34,35,36]
Table 2. Mean values roughness parameters measured for beech and maple cut by laser at different angles relative to the wood grain.
SpeciesAngleEvaluated Parameters (in µm)
RkRpkRvkRk + RpkRskRvRSmWa
beech0mean18.2211.1415.6429.35−0.8639.43790.0618.87
st.dev 2.322.521.914.220.522.7767.617.07
beech15mean31.5913.9618.9045.55−0.7366.32637.6725.31
st.dev 5.476.033.219.490.6115.1047.7911.81
30mean26.088.2617.4834.34−1.0945.64402.1713.04
st.dev1.901.421.982.400.214.5439.373.81
45mean28.238.1717.6536.40−1.0350.19320.1110.64
st.dev 4.383.061.997.100.386.1712.895.38
60mean25.018.1919.2233.21−1.2953.09309.4212.86
st.dev 3.453.261.636.260.295.2526.466.30
75mean28.2511.9617.6840.21−0.7949.61270.107.06
st.dev 2.286.181.878.330.505.7023.082.22
90mean29.288.5819.2337.86−1.1254.85272.088.94
st.dev 3.292.241.704.940.195.4331.412.26
maple0mean19.9412.8028.6632.75−1.6957.331023.0416.44
st.dev 3.321.675.283.610.356.81170.223.90
15mean20.6111.4424.7632.06−1.5261.84788.6115.41
st.dev 6.046.324.5111.810.8713.36170.057.32
30mean18.967.9121.5326.87−1.7954.65599.4616.15
st.dev 4.312.451.726.310.387.15102.809.29
45mean15.566.9221.9322.48−1.9752.91483.5514.12
st.dev 2.344.071.745.600.456.4344.518.45
60mean16.836.5622.8023.39−2.0654.52412.4316.34
st.dev6.512.331.938.500.3612.9883.747.68
75mean14.104.9720.1419.07−2.1750.77355.126.79
st.dev2.271.591.283.560.227.8635.262.38
90mean16.564.8221.1621.38−2.0957.37374.707.26
st.dev3.941.261.395.030.285.3852.822.47
Table 3. ANOVA test examining the impact of species on the Rk parameter, for seven laser-cut angles relative to the wood grain.
SourceType III Sum of SquaresdfMean SquareFSig.
Corrected model3068.56713236.04414.9740.000
Intercept47,814.415147,814.4153033.2220.000
Species angle3068.56713236.04414.9740.000
Error1324.1408415.764
Total52,207.12198
Corrected total4392.70697
Table 4. ANOVA test assessing the impact of seven laser-cut angles relative to maple wood grain on the Rk parameter.
SourceType III Sum of SquaresdfMean SquareFSig.
Corrected model240.984640.1642.0890.075
Intercept15,024.862115,024.862781.3230.000
Angle240.984640.1642.0890.075
Error807.6624219.230
Total16,073.50749
Corrected total1048.64548
Note: The test between subject effects has shown no significant effect produced by the processing angle on the Rk parameter (p = 0.075 > 0.05).
Table 5. Laser/control relative integrated areas of the main FTIR absorptions for maple and beech wood cut at angles of 0° and 90° relative to the wood grain.
Absorption Band
[cm−1]
Relative Integrated Areas (Ratios ALaser/AControl)
Maple (Acer pseudoplatanus)Beech (Fagus sylvatica)
P_L_0°/P_C_0°P_L_90°/P_C_90°F_L_0°/F_C_0°F_L_90°/F_C_90°
17320.260.440.740.61
1635–11601.151.261.261.17
15040.850.871.261.07
13690.540.760.570.56
12340.510.630.670.62
10300.820.810.750.69
9000.670.760.420.52
Table 6. Relative absorption bands’ ratios (RatioLaser/RatioControl) for maple and beech wood cut at angles of 0° and 90° relative to the wood grain.
Absorption Bands’ RatioSignificanceRelative Absorption Bands’ Ratios (RatioLaser/RatioControl)
Maple (Acer pseudoplatanus)Beech (Fagus sylvatica)
P_L_0°/P_C_0°P_L_90°/P_C_90°F_L_0°/F_C_0°F_L_90°/F_C_90°
A1504/A1369Lignin/Hollocellulose1.571.142.221.90
A1732/A1369Hemicelluloses/Hollocellulose0.490.591.301.09
A900/A1369Cellulose/Hollocellulose1.251.000.740.92
Disclaimer/Publisher’s Note: The statements, opinions and data contained in all publications are solely those of the individual author(s) and contributor(s) and not of MDPI and/or the editor(s). MDPI and/or the editor(s) disclaim responsibility for any injury to people or property resulting from any ideas, methods, instructions or products referred to in the content.

