Article

Comparative Genomics of Eight Complete Chloroplast Genomes of Phyllostachys Species

1
Co-Innovation Center for Sustainable Forestry in Southern China, Bamboo Research Institute, Nanjing Forestry University, Nanjing 210037, China
2
Bamboo Research Institute, Nanjing Forestry University, Nanjing 210037, China
*
Author to whom correspondence should be addressed.
Forests 2024, 15(10), 1785; https://doi.org/10.3390/f15101785
Submission received: 18 August 2024 / Revised: 16 September 2024 / Accepted: 9 October 2024 / Published: 11 October 2024
(This article belongs to the Section Genetics and Molecular Biology)

Abstract

:
(1) Background: The genus Phyllostachys belongs to the subfamily Bambusoideae within the family Gramineae. Bamboos of this genus are distinguished by their remarkable genetic traits, including exceptional resistance to both cold and drought conditions. These species possess considerable economic, ecological, and aesthetic value, finding extensive use in forestry and landscape design across China. (2) Methods: This study employed Illumina’s second-generation sequencing technology to sequence the chloroplast genomes of eight Phyllostachys species, followed by their assembly and annotation. (3) Results: The chloroplast genomes of the genus exhibit a characteristic tetrad structure with an average sequence length of 139,699 bp and an average GC content of 38.9%. A total of 130 genes have been annotated across eight bamboo species, comprising 75 protein-coding genes, 28 tRNA genes, and four rRNA genes. Global alignment and nucleotide polymorphism analyses indicate that the chloroplast genome of Phyllostachys is highly conserved overall. The boundaries of the four chloroplast regions are relatively conserved and exhibit minimal differences. Among these regions, three coding region genes—atpH, trnQ-UUG, and petB—and five non-coding regions—rpl32-trnL-UAG, rpl14-rpl16, rpl22-rps19, rps12-clpP, and trnR-UCU-trnM-CAU—exhibit high polymorphism and can be used as potential hotspot areas for subsequent research. A total of 266 simple sequence repeat (SSR) loci were identified by SSR analysis in the chloroplast genomes of eight bamboo species; the largest number of mononucleotide repeats was 154, predominantly consisting of A/T. Codon bias in the chloroplast genomes of the eight bamboo species indicates a preference for codons ending with A and U. Additionally, the UUA codon, which encodes leucine (Leu), is positioned between codons encoding phenylalanine (Phe), lysine (Lys), leucine (Leu), serine (Ser), and tyrosine (Tyr), indicating certain differences among these species. (4) Conclusions: This study aims to offer novel insights into the population genetics, phylogenetic relationships, and evolutionary patterns of Phyllostachys.

1. Introduction

The chloroplast, a type of plastid, is ubiquitously found in terrestrial plants, algae, and some protozoa. It stands as one of the most crucial organelles in green plants and serves as the principal site of photosynthesis. Chloroplasts are encased in a double-membrane structure that encloses the thylakoid and stroma. The thylakoid membrane contains numerous pigment molecules, including chlorophyll and carotenoids, which are essential for capturing and transducing light energy during the process of photosynthesis [1]. The matrix within chloroplasts encompasses a variety of enzymes, inorganic salts, and a modest quantity of DNA, serving as the pivotal site for carbon assimilation during photosynthesis [1]. This organelle is integral to life processes, producing not only sugars but also synthesizing complex organic molecules such as amino acids and fatty acids, thereby fueling biological evolution [2]. The chloroplast is a self-regulating organelle containing its own genetic material, known as the chloroplast genome or chloroplast DNA. Most chloroplast DNA exhibits a quintessential tetrad structure, consisting of a large single-copy region (LSC), a small single-copy region (SSC), and a pair of inverted repeat regions (IRs). This configuration encompasses 120–130 genes responsible for encoding proteins and RNAs crucial to photosynthetic transcription and translation [3]. The chloroplast genome exhibits a higher degree of conservation compared to both the nuclear and mitochondrial genomes. However, certain plant species, particularly angiosperms, display significant variations in their chloroplast genomes throughout evolutionary processes and adaptation [4]. The common types of structural variation include insertions/deletions, duplications, inversions, and gene rearrangements. These variations can alter the structure or function of encoded proteins, thereby affecting photosynthetic efficiency and plant adaptability [5]. Point mutations are among the most frequent mutation types in the chloroplast genome. Certain point mutations may modify the activity of key enzymes encoded by chloroplasts, influencing the rate and efficiency of photosynthesis [6]. Deletion events can result in changes to the length and structure of the chloroplast genome [7].
The variation in nucleotide repeat sequences is a significant form of plant variation in the chloroplast genome. These repeats, encompassing single-nucleotide repeats, dinucleotide repeats, and longer repeat units, not only constitute an essential component of the chloroplast genome but also play a crucial role in plant evolutionary adaptability and diversity [8]. Variations in nucleotide repeat sequences can be manifested as changes in the number of repeated units. Such variations can generate new genotypes that influence chloroplast function and overall plant performance. For instance, variations in certain nucleotide repeat sequences may be associated with traits such as photosynthetic efficiency and stress resistance [9,10]. Single-nucleotide repeats are the most common and significant class in the chloroplast genome, with A/T repetitions being particularly prevalent, likely due to the high AT content in this genome [9]. Single-nucleotide repeats are highly variable and prone to slippage mismatches and length variations, which further enhance their diversity and evolutionary importance [11]. Additionally, other types of repeats, such as dinucleotide and trinucleotide repeats, can impact gene expression and regulate protein structure and function [12]. In recent years, advancements in high-throughput sequencing technology have enabled more in-depth studies of chloroplast nucleotide repeat variations in plants. These studies not only elucidate the patterns and mechanisms of repeat sequence variation but also offer valuable information and tools for plant breeding, genetic improvement, and molecular evolution [4].
In addition, the chloroplasts exhibit a unique codon bias at the gene expression level, reflecting their adaptability and optimization mechanisms throughout evolution. Studying this codon deviation reveals several intriguing phenomena in protein synthesis. Firstly, the chloroplasts preferentially utilize certain initiation codons, which are significantly more prevalent in the chloroplasts than other organelles or nuclei [13]. This bias may be associated with the demand for efficient protein synthesis in the chloroplasts, allowing them to initiate protein synthesis more quickly and accurately by optimizing start codon usage. Furthermore, the chloroplasts show a preference for specific codons when encoding amino acids. Although some amino acids have multiple possible codons in the chloroplasts, certain codons are used more frequently than others [14]. This bias may be linked to the type and quantity of tRNA in chloroplasts, as tRNA is crucial for converting mRNA codons into corresponding amino acids. By optimizing the recognition and use of specific codons through the type and quantity of tRNA, the chloroplasts can enhance the accuracy and efficiency of protein synthesis [14]. Therefore, comparing the variation in the chloroplast genome across different plant species or under varying conditions can elucidate genetic mechanisms and adaptive strategies employed by plants in response to environmental changes. Additionally, variations in the chloroplast genome can provide novel insights for plant breeding and genetic improvement, facilitating the cultivation of crops with enhanced traits such as higher yields and stronger stress resistance by leveraging beneficial mutations.
Bamboo, a pivotal component of forest ecosystems, encompasses the diverse subfamily Bambusoideae, comprising approximately 1700 species globally. This makes it the third largest subfamily within the Poaceae family [15,16]. Its distribution spans across Asia–Pacific, Central and South America, and Africa [15,16,17,18]. Notably, China stands as the world’s most bamboo-rich nation, boasting an extensive array of about 40 genera and over 500 species, surpassing other countries in both genetic diversity and habitat breadth. As a renewable resource, bamboo is distinguished by its rapid growth, short maturation cycle, high productivity, versatile applications, and substantial economic, ecological, and societal benefits [19]. Phyllostachys species exhibit a wide distribution in China, with numerous varieties characterized by diverse leaf and stem colors. Notable examples include Phyllostachys edulis ‘Tao Ki-ang’, P. edulis viridisulcata, P. vivax aureocanlis, P. vivax ‘Huangwenzhu’, Phyllostachys nigra (Lodd. ex Lindl.) Munro, P. nigra var. punctata, and P. nigra var. henonis (Mitford) Stapf ex Rendle. In our early research, we found that the variation in stem and leaf color was primarily related to the development of chloroplasts in the cells of non-green parts. In contrast, the green parts contained a large number of chloroplasts, which resulted in the distinct colors of bamboo stalks and leaves. The development of chloroplasts was influenced by multiple factors, with variations in chloroplast gene structure and expression playing significant roles [20,21]. For instance, the substitution of C for U in the RNA of protein-coding genes is essential for the proper folding and functionality of organelle proteins in flowering plants [11]. Prior research has extensively examined the chloroplast genomes of the genus Phyllostachys. In a study by Huang et al., the phylogenetic analysis of the chloroplast genomes of Phyllostachys reticulata and P. edulis ‘Pachyloen’ was conducted [22]. Zhang et al. reported and characterized the chloroplast genome of P. heterocycla [23]. Zhou et al. found that P. nidularia f. farcta is closely related to P. reticulata through phylogenetic analysis [24]. Additionally, Pei et al. conducted a comparative analysis of the chloroplast genomes of P. edulis and five other bamboo species, identifying rpoC2 as a potential marker for distinguishing different bamboo species [24]. Currently, chloroplast genomic information of several bamboo species is available [25,26,27,28,29,30,31], but this genome information focuses on species taxonomy and genetic tag construction [32,33,34]. The characteristics of gene variation in the bamboo genome have not been studied. Therefore, in this study, we sequenced the chloroplast genomes of eight Phyllostachys species using second-generation sequencing techniques, assembled and annotated these genomes, identified nucleotide polymorphisms and codon deviations associated with IR boundary repeat sequences, and provided a molecular foundation for studying the phenotypic specificity of these eight bamboo species.

2. Materials and Methods

2.1. Plant Materials and Genome Sequencing

The collection information of eight Phyllostachys bamboo species can be found in Supplementary Table S1. Ten trees were randomly selected from each bamboo species, and mature and healthy leaves were collected from each tree. The collected leaves were cleaned, drained, and then subjected to rapid dehydration with silica gel for DNA extraction. Total DNA was extracted from the leaves using the CTAB method [35]. The DNA degradation was monitored on 1% agarose gels, and the DNA concentration was measured using the Qubit® DNA Assay Kit in the Qubit® 3.0 Fluorometer (Invitrogen, Waltham, MA, USA). The library construction and sequencing of high-quality DNA samples were performed by Novogene Co., Ltd. (Beijing, China) on the Illumina high-throughput sequencing platform NovaSeq 6000 (Illumina, Inc., San Diego, CA, USA). The insert size was 350 bp, and 150 bp paired-end reads were generated.

2.2. Genome Assembly and Annotation

We used the default settings of Fastp v0.12.0 [36] to filter and clean the raw data, removing all low-quality reads to obtain high-quality sequencing data (clean data). We employed GetOrganelle v1.7.5.0 [37] software to separate de novo splice clean data under Linux. The basic steps are as follows: target reads automatically assemble contigs of the chloroplast genome with SPAdes, with the extraction round set to 15, k-mer values defaulting to 21, 45, 65, 85, and 105. Two paths with different directions were compared with the reference genome sequence (Phyllostachys edulis, NC_015817) in Geneious v2021.2.2 [38], and the paths with the same direction were screened using MAFFT Alignment. The assembled chloroplast genome was preliminarily annotated by CPGAVAS2 (http://47.96.249.172:16019/analyzer/home, accessed on 6 December 2023) [39], and the annotation results were manually corrected using Geneious software. We performed physical mapping of the chloroplast genome using OGDRAW v.1.3.1 (https://chlorobox.mpimp-golm.mpg.de/OGDraw.html, accessed on 6 December 2023) [40].

2.3. Comparative Genomic Analysis and Identification of Variation Hotspots

Utilize CPJSdraw v1.0.0 [41] to visualize the tetrad structure and boundaries of the chloroplast genome, subsequently comparing variations in gene size and distribution within these boundaries. Conduct a global comparative analysis using mVISTA (https://genome.lbl.gov/vista/mvista/submit.shtml, accessed 15 December 2023), employing the chloroplast genome of Phyllostachys edulis (NC_015817) as a reference for eight corresponding genome sequences from Phyllostachys species [42]. Perform alignments under default settings in Shuffle-LAGAN mode, followed by visualization of the outcomes. Identify mutational hotspots within the Phyllostachys chloroplast genome via DnaSP v6.12.03, calculating nucleotide polymorphisms across both gene and intergenic regions [43]. The window length was set to 600 bp with a step size of 100 bp.

2.4. Characterization of Repeat Sequences and SSRs

Tandem repeats were identified in eight Phyllostachys chloroplast genomes using Tandem Repeats Finder v.4.09 with the following settings: a match probability of 80%; an indel probability of 10%; a minimum alignment score of 50; and a maximum period size of 500 [44]. To localize repeat sequences, REPuter v.3.0 (https://bibiserv.cebitec.uni-bielefeld.de/reputer, accessed on 28 December 2023) was used with parameters set to identify forward, reverse, palindromic, and complementary repeat sequences in the genome. These parameters included a repeat base unit n of at least 30 bp, a sequence consistency of not less than 90% (Hamming distance of 3), a minimum repeat size of 30 bp, a maximum number of displayed repeat sequences set to 1000, an edit distance set to its default value (not specified), and checking for all four types of match direction repeat sequence types [45]. The MISA software (https://webblast.ipk-gatersleben.de/misa/index.php?action=1, accessed on 28 December 2023) was utilized to predict simple repeat sequence SSRs, with single, two, three, four, five, and six nucleotide repeats set to ten, five, four, three, three, and three, respectively [46].

2.5. Codon Usage Analysis

Using Python script to delete protein-coding genes with sequence lengths less than 300 bp [47,48] that do not start with ATG and are repetitive, 48 common protein-coding genes were screened as analysis samples. Perform codon preference analysis using CodonW v1.4.2 in a Linux v.22.04 environment [49]. The codon preference parameters include relative synonymous codon usage (RSCU), effective number of codons (ENC), codon adaptation index (CAI), etc. Use Python v.3.10.13 script to calculate the GC content of the three base positions of each sample codon. Perform neutral plot analysis with GC12 content as the vertical axis and GC3 content as the horizontal axis. Using gene GC3 as the horizontal axis and ENC content as the vertical axis, scatter plot and draw a standard curve. The formula for calculating the number of effective codons is ENC = 2 + GC3s + 29/[GC32 + (1 − GC3) 2]. Perform PR2 plot bias analysis with A3/(A3 + T3) as the horizontal axis and G3/(G3 + C3) as the horizontal axis for the third base of the codon [50].

3. Results

3.1. Chloroplast Genome Organization and Content

The average GC content in the chloroplast genome of Phyllostachys bamboo species is 38.90%. The GC content in the IR region ranges from 44.22% (P. edulis) to 44.24% (P. heteroclada), while in the LSC region, it varies from 36.97% (P. edulis) to 36.98% (P. nigra). In the SSC region, the GC content fluctuates between 33.14% (P. aureosulcata spectabilis) and 33.17% (P. edulis). The GC content in the IR region is higher than that in the LSC and SSC regions. The chloroplast genome typically exhibits a four-part circular structure (Figure 1), with sizes ranging from 139,669 bp (P. heteroclada) to 139,715 bp (P. vivax aureocanlis). In these four regions, the LSC region ranges from 83,199 bp (P. heteroclada) to 83,234 bp (P. nigra var. hanonis); the SSC region spans from 12,870 bp (P. edulis) to 12,899 bp (P. vivax aureocanlis), and the IR regions are each 21,798 bp (Table 1). Analysis of the assembly results revealed no significant differences in the fundamental characteristics of chloroplast genomes among the eight Phyllostachys bamboo species, indicating conserved structures. Following annotation and manual verification using CPGAVAS2 software, a total of 130 genes were identified in the chloroplast genomes of these species. This includes 82 protein-coding genes (CDS), 39 tRNA genes, and eight rRNA genes (Table 1 and Figure 1). Among the species examined, P. vivax aureocanlis and P. vivax ‘Huangwenzhu’ are notable for their absence of the petB gene. In contrast, the other six bamboo species collectively possess 130 genes. These include those involved in photosynthesis, self-replication, and chloroplast gene expression, as well as several genes with currently unknown functions. There are 83 protein-encoding genes, 39 tRNA genes, and eight rRNA genes in total. Among these genes, there are a total of 19 double-copy genes, including eight tRNA-encoding genes (trnA-UGC, trnH-GUG, trnL-CAA, trnM-CAU, trnN-GUU, trnR-ACG, trnT-CGU, trnV-GAC), four rRNA encoding genes (rrn16S, rrn23S, rrn4.5S, rrn5S), and seven protein-encoding genes (ndhB, rpl2, rpl23, rps12, rps15, rps19, rps7) (Table 2). Among these, seven protein-encoding genes (ndhA, ndhB, atpF, rpl16, rpl2, rps16, rpoC2) and six tRNA genes (trnA-UGC, trnK-UUU, trnL-UAA, trnS-CGA, trnT-CGU, trnV-UAC) each contain one intron, while the genes rps12 and ycf3 contain two introns (Figure 1).

3.2. Genome Comparative Analyses

By comparing the IR boundary positions and adjacent genes among eight bamboo species in the Phyllostachys genus, it was found that the chloroplast genomes of these selected bamboo species had a total of four boundaries (Figure 2). The JLB (LSC/IRb) boundaries of the eight bamboo species are located between the rpl22 gene and the rps19 gene; the JSB (IRb/SSC) boundaries are situated between the rps15 gene and the ndhF gene. The JSA (SSC/IRa) boundary is located within the ndhH gene in the SSC region, and its length has expanded into the IRa region by 187 bp. The JLA (IRa/LSC) boundaries are located between the rps19 gene and the psbA gene (Figure 2). From the above analysis, it can be seen that the chloroplast genome structure of the Phyllostachys genus is relatively conserved.
To examine intraspecific variations in the chloroplast genomes of eight bamboo species, Phyllostachys edulis (NC_015817) was designated as the reference sequence. The mVISTA Shuffle LANGAN model facilitated a comprehensive visualization of the chloroplast genome sequence diversity (Figure 3). Notably, the intergenic regions of Phyllostachys exhibited greater variations compared to the coding regions. Moreover, variations within the IRs region were significantly less pronounced than those observed in both the LSC and SSC regions. Furthermore, the majority of genes exhibit a similarity exceeding 90%, with the rRNA-encoding genes (rrn4.5, rrn5, rrn16, rrn23) being notably conserved across all eight bamboo species, showing no variation. Protein-encoding genes such as atpA, atpH, matK, ndhC, ndhD, ndhK, psaB, psbA, psbC, rbcL, rpl22, rpoC1, rpoC2, rps11, along with rps18, display varying degrees of divergence in their sequences. Additionally, intergenic regions, including psbA-trnK-UUU, matK-trnK-UUU, rps16-trnQ-UUG, trnR-UCU, and trnM-CAU, also demonstrate differential levels of variation (Figure 3). These comparative analyses highlight that the Phyllostachys chloroplast genome is highly conserved, with minimal interspecific variation observed. Only a limited number of regions fall below the 90% similarity threshold among bamboo species, underscoring the overall conservation of these genomes.
From the polymorphism analysis, it is evident that the non-coding region of the chloroplast genome exhibits higher polymorphism in eight bamboo species compared to the coding regions. The sequence variation in the IR regions of the genome is relatively minor compared to the single-copy regions. In the coding region, petB, trnQ-UUG, and atpH display relatively high polymorphism levels with pi values of 0.0952, 0.004, and 0.0035, respectively. Notably, the intergenic region rpl32-trnL-UAG has the highest pi value at 0.0053, followed by rpl14-rpl16, rpl22-rps19, rps12-clpP, and trnR-UCU-trnM-CAU, with pi values of 0.0052, 0.0043, 0.004, and 0.0033, respectively (Figure 4 and Table S5). By identifying these highly mutable sites, we can enhance our understanding of the evolutionary characteristics of chloroplast genome fragments in eight Phyllostachys species. Additionally, these potential mutation hotspots can be utilized to develop DNA barcodes, thereby providing a scientific foundation for the systematic classification of Phyllostachys species.

3.3. SSR and Repeat Sequences Analysis

The MISA online analysis software was utilized to statistically analyze the nucleotide repeat types and motifs of SSRs in the chloroplast genomes of eight species within the Phyllostachys genus. Among these, Phyllostachys edulis exhibited the highest number of SSR sequences with 55, while Phyllostachys heteroclada had the fewest at 52. Mononucleotide repeats constituted the largest proportion of the six types of nucleotide repeats, accounting for 58.87% of all SSR sequences, with a repeat count ranging from 30 to 34. Tetranucleotide repeats were the second most common, comprising 26.08% of all SSR sequences and having a repeat count between 13 and 14. Dinucleotide, trinucleotide, and pentanucleotide repeats are present across the same number of bamboo species, with four, three, and one occurrence, respectively. Hexanucleotide repeats were not detected in any of the eight species within the Phyllostachys genus (Figure 5A and Table S2). The chloroplast genomes of the eight bamboo species under study exhibit two types of single-nucleotide repeats: A/T accounts for 98.17%, while C/G constitutes 1.83%. The varieties P. nigra, P. nigra var. henosis, and P. nigra var. punctata lack the C/G motif inversion type. Dinucleotide repeats are characterized by two motifs: AG/CT and AT/AT. Trinucleotide repeats include AAG/CTT and AAT/ATT motifs, while four-nucleotide repeats encompass seven motif types: AAAC/GTTT, AAAG/CTTT, AAAT/ATTT, AACG/CGTT, AAGG/CTT, ACAT/ATGT, and ACCT/AGGT. Among these, AAAT/ATTT is the predominant repeat type, accounting for 42.27% of the chloroplast genomes within the Phyllostachys genus. AAAG/CTTT and AACG/CGTT each represent 14.43%, whereas AAAC/GTTT, AAGG/CTT, ACAT/ATGT, and ACCT/AGGT collectively account for 7.22%. Notably, AAAT/ATTT occurs five times in P. edulis and six times in the remaining species. The five-nucleotide repeat is limited to a single-motif type, AAAAT/ATTTT (Figure 5B and Table S2).
Further analysis revealed that the majority of microsatellite repeats were distributed in the intergenic regions, while a similar proportion was found in both introns and protein-coding regions. Additionally, these microsatellite repeats are predominantly localized to the LSC region, with fewer occurrences in the IR and SSC regions (Figure 5C,D). Nine genes associated with SSR loci included rpoC1, rpoC2, ndhH, ndhK, trnM-CAU, infA, rpl22, rpl32, and rrn4.5S, all located within the CDS regions of the Phyllostachys chloroplast genomes (Table S2). The longest single-nucleotide repeat type A in P. nigra var. henosis and P. nigra var. punctata measured 26 bp (Figure 5E and Table S3).
A study on the arrangement of tandem and scattered repeat sequences in the chloroplast genome revealed 95 repeat sequences in P. edulis, including tandem, palindromic, forward, reverse, and complementary repeat sequences. Similarly, 98, 99, 99, 99, 99, 99, 99, 97, and 96 repeat sequences were detected in P. nigra, P. nigra var. henosis, P. nigra var. punctata, P. vivax aureocanlis, P. vivax ‘Huangwenzhu’, P. aureosulcata spectabilis, and P. heteroclada, respectively. P. edulis had no reverse repeat sequences, while the remaining seven bamboo species each had one. None of the eight bamboo species had complementary repeat sequences (Figure 6A). Among them, there is a large number of tandem repeat sequences, mainly distributed in the LSC region, while other repeat sequences are distributed in the SSC and IR regions (Figure 6B). The length of tandem repeat sequences is mainly concentrated in the range of 10–19 bp, and tandem repeat sequences exceeding 40 bp appear four times across all eight bamboo species (Figure 6C). Dispersed repetitive sequences appear most frequently in the CDS and IGS regions and least frequently in the intron region (Figure 6D and Table S4). Dispersed repetitive sequences are most abundant in the LSC region, appearing more than 55 times across all eight bamboo species. There are fewer repetitive sequences distributed in the SSC and IR regions, with fewer than 10 occurrences (Figure 6E). Dispersed repeat sequences with lengths between 30–44 bp are the most common, followed by those with lengths between 45 and 59 bp. Dispersed repeat sequences with lengths greater than 60 bp are less common (Figure 6F and Table S4).

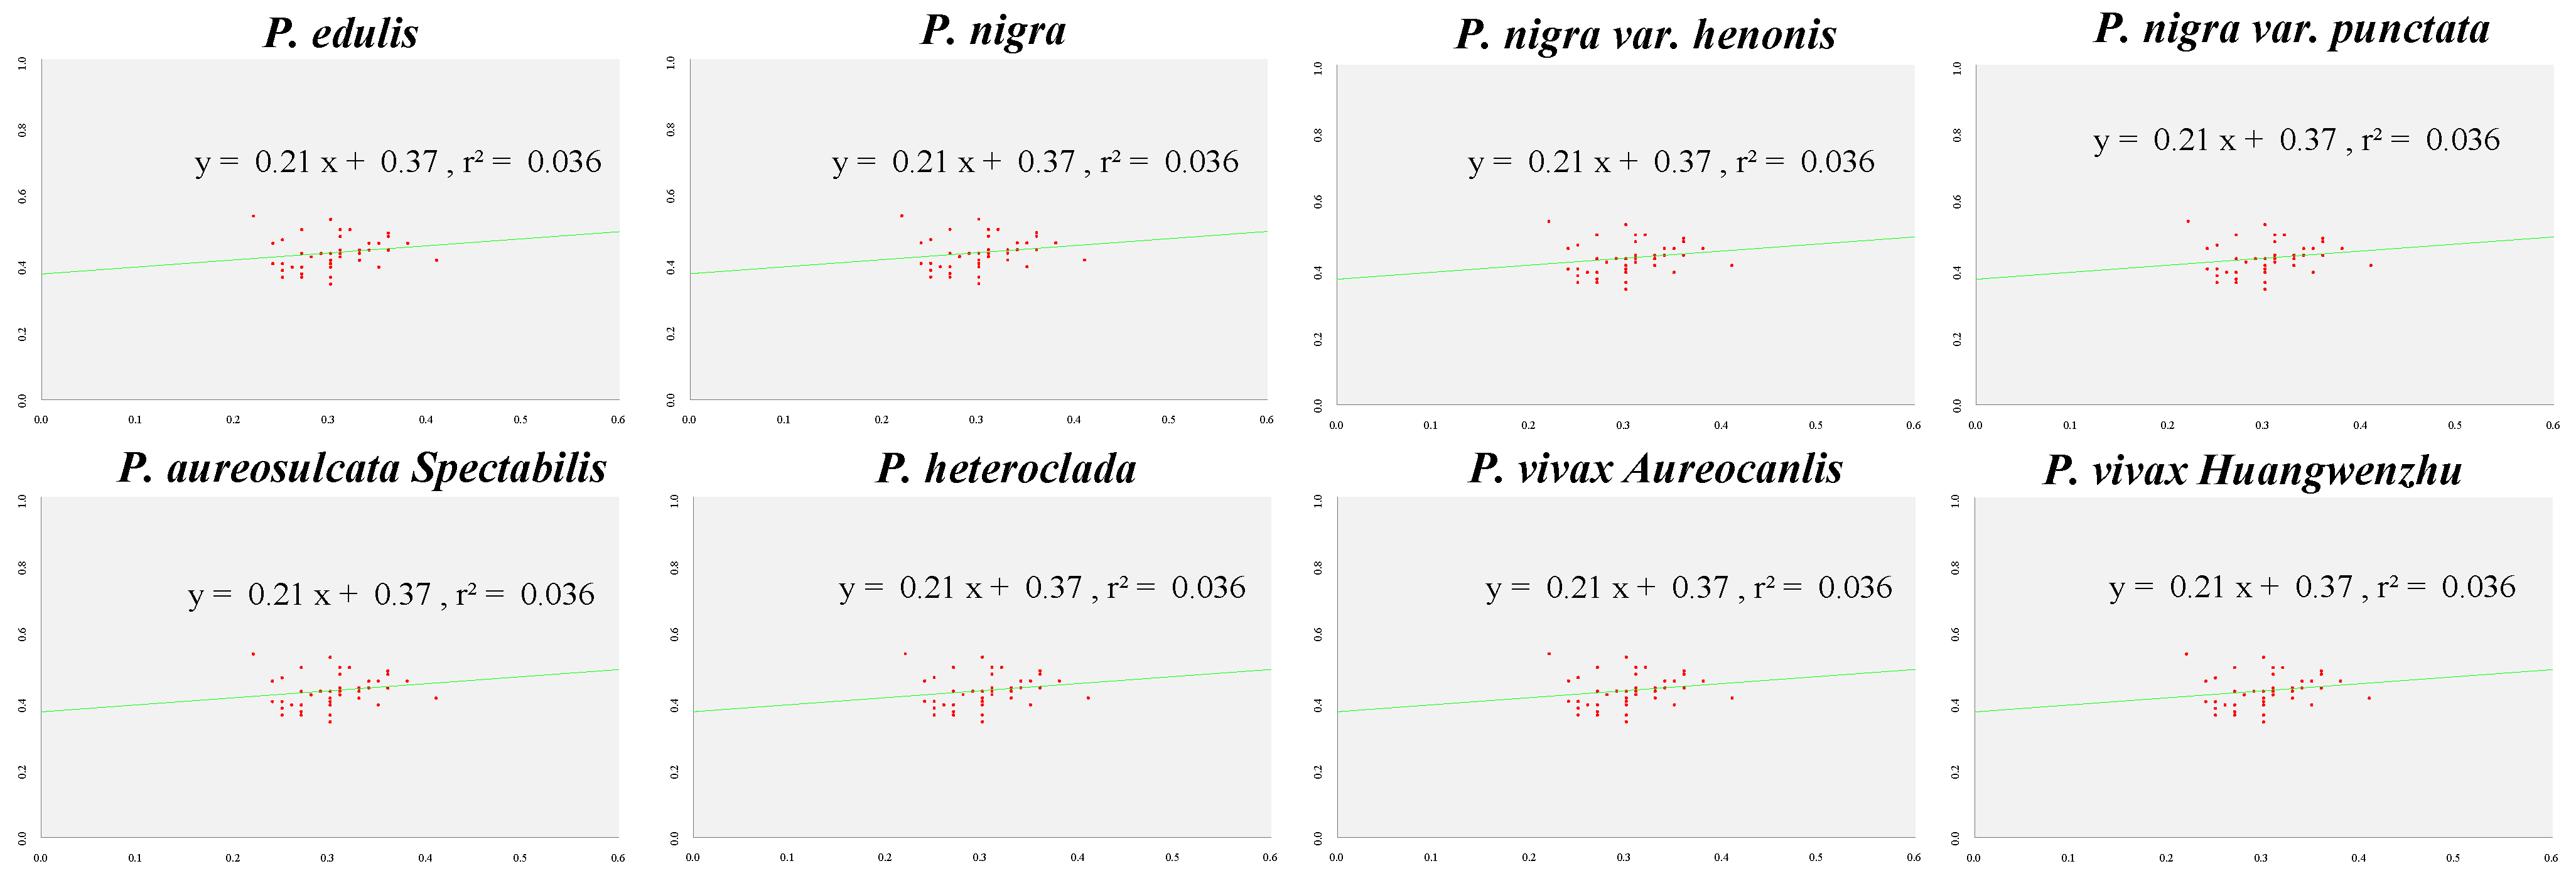
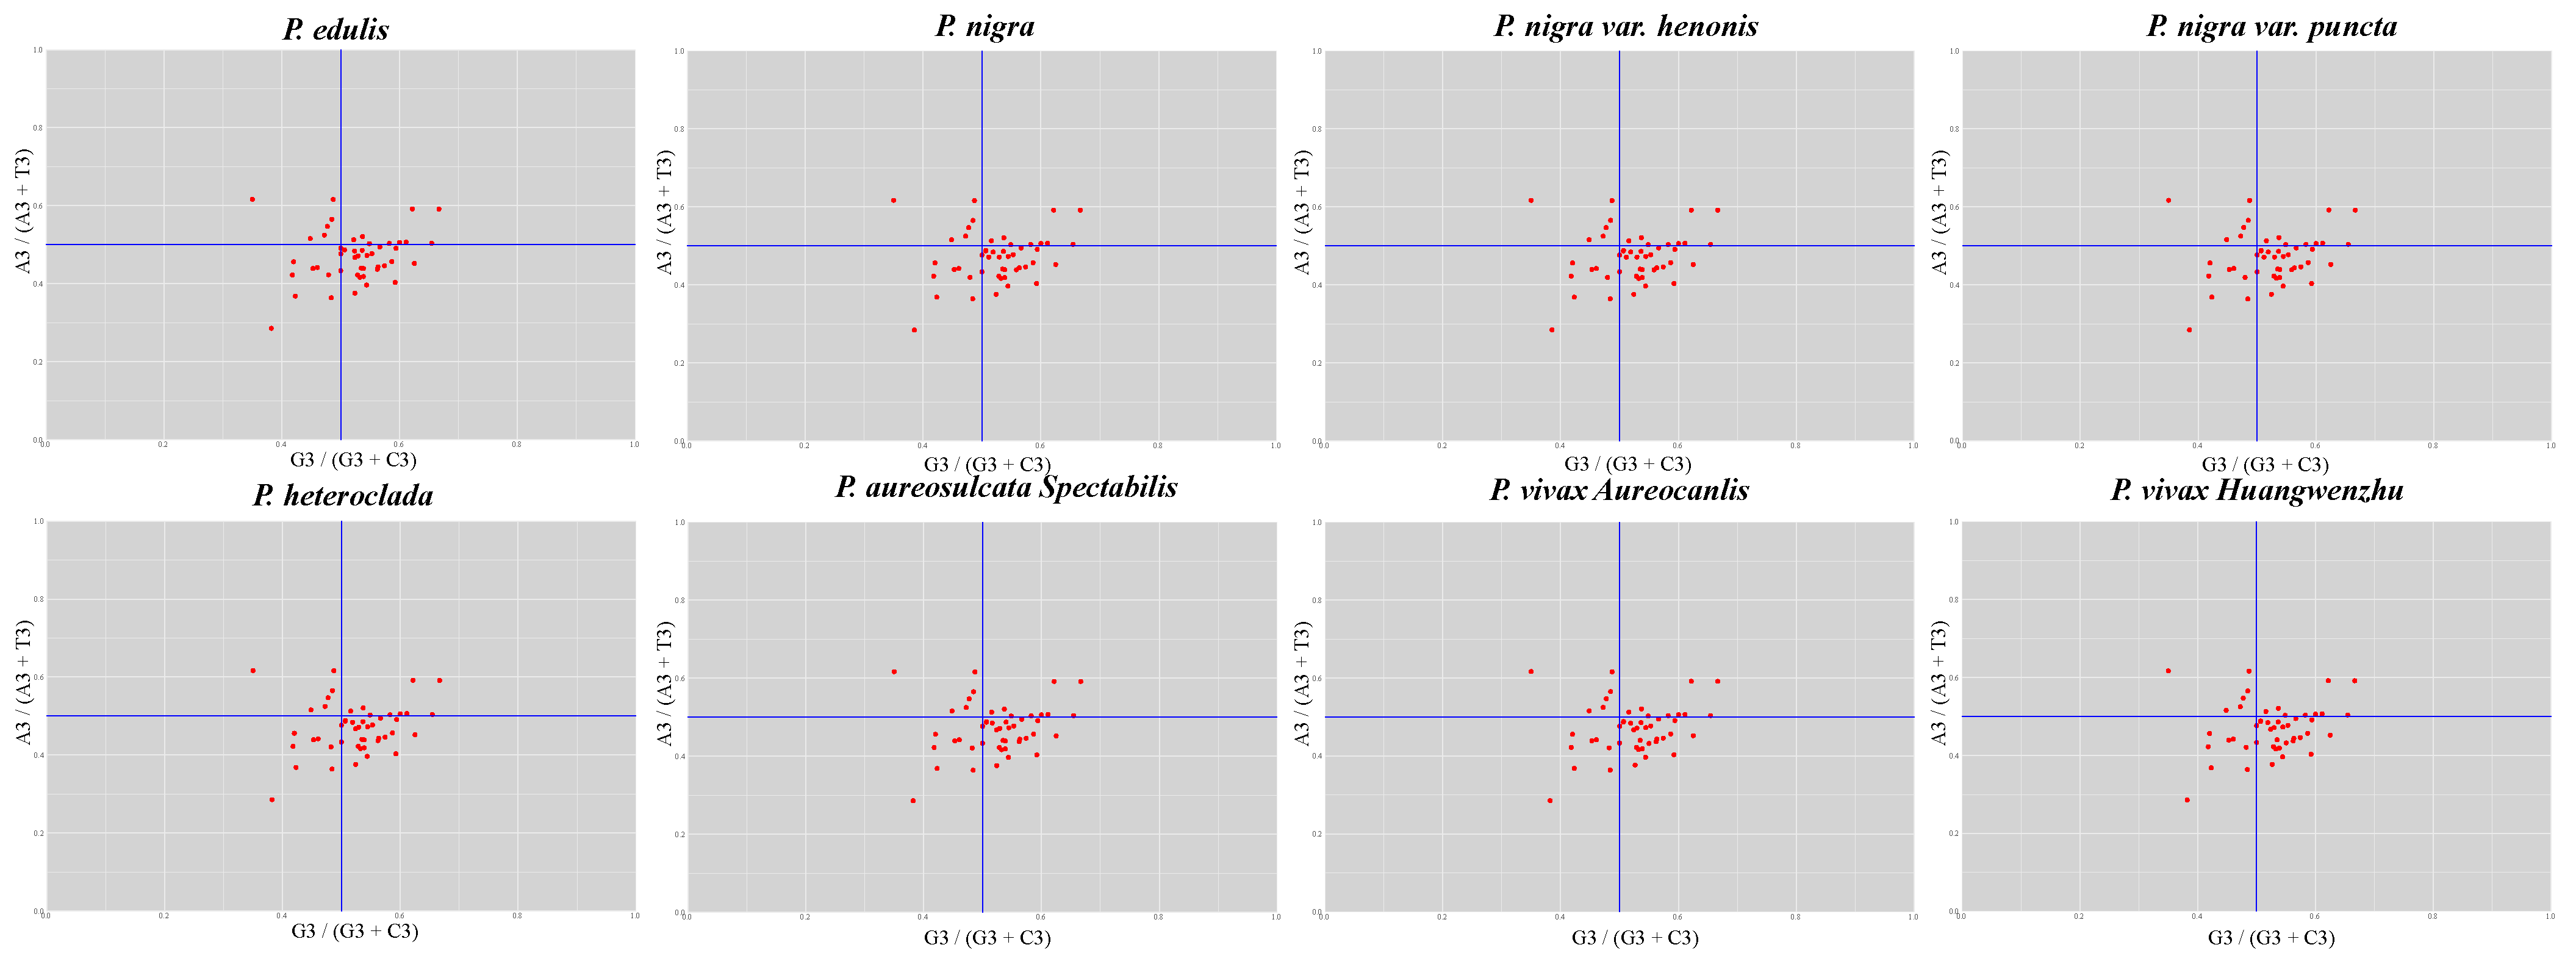
3.4. Codon Preference Analysis

The total codon count in the CDS of eight bamboo species from the genus Phyllostachys is 16,433. The average GC content at the first, second, and third codon positions are 0.4777, 0.3933, and 0.309, respectively, all of which are less than 0.5. This indicates a bias toward A and T at these codon positions across the chloroplast genomes. The ENC for the chloroplast genomes of these bamboo species averages 50.417, with P. edulis having the lowest ENC value of 50.4 and all other species at 50.42. Given that ENC values exceed 50, this suggests weak codon usage bias (Table 3 and Table S7). To further investigate codon preferences among the eight bamboo species, we analyzed the CAI and RSCU of their chloroplast genomes (Figure 7 and Table S6). The CAI values for all species are uniformly 0.167, closely approximating zero and aligning with the ENC results, indicating minimal codon bias. RSCU analysis reveals Leu as the most frequently used amino acid, averaging 1766 codons, whereas Cys is the least frequent, with an average of 173 codons. Specifically, the UUA codon encoding Leu exhibits the highest usage frequency among these species, with RSCU values exceeding 1, peaking at 1.94. Conversely, the CUG codon has the lowest frequency, registering RSCU values of 0.32 (Figure 7 and Table S6).
To identify the primary factors influencing synonymous codon usage preferences in chloroplast genomes, we conducted a neutrality plot analysis on eight species within the genus Phyllostachys. A regression coefficient proximate to one signifies that codon preference is predominantly shaped by gene mutations, whereas a coefficient near zero suggests a stronger influence of natural selection. The GC12 and GC3 content exhibit a scattered pattern, with GC12 values spanning from 0.3442 to 0.5417 and GC3 from 0.2222 to 0.4074. Both regression coefficients are 0.21, implying that codon usage bias in Phyllostachys chloroplast genomes is chiefly driven by natural selection (Figure 8 and Table S7). The standard curve indicates gene mutations as the determinant factor for codon bias. Further exploration into mutation pressure’s impact on codon bias reveals ENC values ranging between 20 and 61; notably, codon preference intensifies as these values decrease, correlating with elevated gene expression levels. Gene distribution across the standard curve shows variability, with many genes positioned below it and a select few displaying ENC values below 35, reinforcing the role of natural selection in shaping codon bias within Phyllostachys chloroplast genomes (Figure 9 and Table S7). In order to further explore the factors affecting the preference for synonymous codon usage, parity analysis was conducted on the relationship between the third base A/T (A3 and T3) and C/G (C3 and G3) of codons in eight chloroplast genomes of Phyllostachys. The tested genes of Phyllostachys exhibited an uneven distribution across the four quadrants, with a substantial number of genes concentrated in the third and fourth quadrants. This pattern indicates that the usage frequency of T exceeds that of A, and the usage frequency of G surpasses that of C. These findings further corroborate the impact of natural selection on codon bias (Figure 10 and Table S8).

4. Discussion

The chloroplast genome of plants typically consists of a large single-copy region, a small single-copy region, and a pair of inverted repeat regions [51]. The eight bamboo species studied in this article, like the vast majority of plants, possess a closed circular double-stranded DNA with a typical quadripartite structure. The chloroplast genome size of this group ranges from 139,669 bp (P. heteroclada) to 139,715 bp (P. vivax aureocanlis), which is similar to the chloroplast gene structure of previously reported bamboo species in the Phyllostachys genus, such as P. reticulata [22], P. sulphurea [29], P. edulis f. curviculmis [52], and P. nidularia [33]. The average GC content of the chloroplast genomes of these eight bamboo species is 38.90%, consistent with the average content of other Phyllostachys species ranging from 38.80% to 38.90% [22,52]. The GC content in the IR region is higher than that in the LSC and SSC regions, likely due to the large distribution of rRNA with high GC content in the IR region [53]. Higher GC content is beneficial for maintaining genome stability and sequence complexity [54], and similar properties are observed in the chloroplast genomes of other Phyllostachys bamboo species [22,52]. A total of 130 genes were identified in the chloroplast genome of the Phyllostachys species, including 82 protein-coding genes, 39 tRNAs, and eight rRNA genes. Among them, P. vivax aureocanlis and P. vivax ‘Huangwenzhu’ have at least 129 genes annotated due to the deletion of the petB gene, while the other six bamboo species have 130 genes, including those related to photosynthesis, self-replication, and some with unknown functions. There are 83 protein-encoded genes, 39 tRNA genes, and eight rRNA genes. Among these genes, 19 are duplicated, including eight tRNA-encoding genes, four rRNA-encoding genes, and seven protein-encoding genes; among them, seven protein-encoding genes (ndhA, ndhB, atpF, rpl16, rpl2, rps16, rpoC2) and six tRNA genes (trnA-UGS, trnK-UUU, trnL-UAA, trnS-CGA, trnT-CGU, trnV-UAC) each contain one intron, while rps12 and ycf3 genes each contain two introns. The petB gene, which encodes the cytochrome b6/f complex, was not identified in the chloroplast genome of P. vivax aureocanlis and P. vivax ‘Huangwenzhu’. The cytochrome b6/f complex is an integral thylakoid membrane-bound protein complex that mediates electron transport from reduced plastoquinone to plastocyanin or cyclic electron flow around photosystem I from ferredoxin to plastocyanin in plant chloroplasts [55]. This study suggests that the gene deletion in P. vivax aureocanlis and P. vivax ‘Huangwenzhu’ may be related to their specific habitat. Meanwhile, previous studies have found that functional genes missing from chloroplasts are transferred to the nucleus, such as the infA gene in Arabidopsis, Lotus, and Elaeagnus [56,57] and the rpl22 gene in Castanea and Passiflora genera [58].
The IR region is the most conserved segment in the chloroplast genome, and the size of this genome in angiosperms is closely associated with the expansion and contraction of boundaries between the IR and single-copy regions [59,60]. This study compared the chloroplast genome boundary regions of eight bamboo species from the genus Phyllostachys and found that gene sizes and distributions within this group tended to be conserved. On the one hand, this finding confirms the previous hypothesis that the contraction and expansion of the IR region are crucial factors influencing the size of the chloroplast genome. On the other hand, it further illustrates that the evolutionary development of Phyllostachys also depends on changes in other genes. The mVISTA analysis revealed that the entire alignment sequence exhibited high similarity, with only a few regions having sequence identity below 90%, indicating considerable conservation within the chloroplast genome of Phyllostachys. Genomic variations exist among the chloroplasts of the eight studied bamboo species within this genus. Compared to LSC and SSC regions, IR differentiation is smaller, CDS regions are more conserved, and non-coding regions exhibit greater changes, consistent with previous plant chloroplast genome analyses [61]. When combining nucleotide polymorphism analysis of both gene regions and intergenic regions, variation in non-coding regions of the chloroplast genome generally exceeds that in coding regions, aligning with most plant research findings. Mutation rates for petB, trnQ-UUG, and atpH in the gene regions are notably high, suggesting that these could serve as potential high-mutation sites for developing DNA barcodes. Conversely, the rpl32-trnL-UAG, rpl14-rpl16, rpl22-rps19, rps12-clpP, and trnR-UCU-trnM-CAU fragments in the intergenic regions show relatively high levels of variation and can be developed as molecular markers for systematic classification and phylogenetic studies of Phyllostachys.
Repetitive sequences and SSRs are prevalent in plant chloroplast genomes. Their type, quantity, and location vary among species. These sequences aid in identifying genomic mutation hotspots [62,63]. Microsatellite repeats, characterized by their widespread distribution and high polymorphism, serve as popular genetic markers in research [64]. In genome rearrangements, repetitive sequences significantly increase the likelihood of replication fork arrest, leading to incorrect recruitment of specific sequence regions over evolutionary timeframes. They facilitate intermolecular recombination, enhancing chloroplast genome diversity by amplifying both prokaryotic and eukaryotic sequences within genomic regions [65]. Single-nucleotide duplications contribute to substitutions, insertions, and reversals [66]. Our study on Phyllostachys chloroplast genomes revealed that single-nucleotide repeats predominate, particularly A/T motifs, with fewer dinucleotide and no hexanucleotide repeats. Notably, P. nigra variants lack C/G motifs, with the majority of repeats concentrated in the LSC and IGS regions—a pattern mirrored in other bamboo species [67]. These regions are potential hotspots for genomic restructuring [68]. Within SSR loci of Phyllostachys, nine genes, including rpoC1, rpoC2, ndhH, ndhK, trnM-CAU, infA, rpl22, rpl32, and rrn4.5S, are located in CDS regions. Repetitive sequences drive genome rearrangements and variations via illegitimate recombination and slipped-strand mispairing [69,70]. Prior research indicates that SSR distribution and regional GC content disparities correlate with IR boundary dynamics [71]. Our analysis of Phyllostachys species uncovered diverse repeat types: tandem; forward; reverse; palindromic; and non-complementary, with forward repeats being the most frequent. Despite their abundance, the origins of tandem repeats remain elusive [72]. Predominantly, longer (>30 bp), repetitive elements reside in the LSC region, suggesting that they contribute to the irregular length and sequence variability observed in plant chloroplast genomes. Harnessing these sequences provides a robust basis for understanding genetic diversity and facilitating taxonomic classification within Phyllostachys [73].
The preference for codon usage not only reflects the origin, evolution, and mutation patterns of species genes but also significantly impacts gene function and expression [47,74,75]. Although the substitution of the third base of a codon may not directly change the corresponding encoded amino acid, it directly reflects the usage preference pattern of the codon. The RSCU values of various codons and their corresponding amino acids are less than one, indicating that the codons are more frequently used; an RSCU value of 1 shows no bias [76]. Among the eight types of bamboo studied, Leu has the highest number, with an average of 1766, while Cys has the lowest number, with an average of 173. This indicates that Leu and Cys are the most and least-used amino acids, respectively, in the chloroplast genomes of these eight bamboo species. The UUA codon encoding Leu has the highest frequency of use among these eight species, with RSCU values greater than 1 and up to 1.94. The codon with the lowest frequency of use is CUG, with RSCU values of 0.32, which is consistent with the analysis results of other bamboo species [24]. The GC content of the chloroplast genome in Phyllostachys is 38.9%, and it preferentially ends with base A/T, which is consistent with the codon preference of most angiosperms [77,78]. Additionally, all tested species showed weak codon preference (ENC value > 50), which may be related to the conservation of chloroplast genes. Gene mutations are the main factor affecting codon preference. If codon usage patterns were affected by natural selection, the correlation between GC12 and GC3 would be significant. In this study, regression analysis was conducted on eight species of Phyllostachys, and the coefficients were close to 0, indicating that natural selection played an important role in codon usage preferences in the chloroplast genome of Phyllostachys. This result is consistent with most studies on angiosperms. The results of ENC analysis and parity bias analysis also support the idea that natural selection is the main factor affecting codon preference. Furthermore, the study of codon bias can reveal genetic differences between different species or populations, laying an important theoretical foundation for molecular research of bamboo species in the genus Phyllostachys.

5. Conclusions

This study utilized Illumina second-generation sequencing technology to sequence the chloroplast genomes of eight Phyllostachys species, subsequently assembling and annotating these sequences. The chloroplast genomes of Phyllostachys exhibited a typical quadripartite structure, with an average size of 139,699 bp and an average GC content of 38.9%. A total of 130 genes were identified, comprising 76 protein-coding genes, 28 tRNA genes, and four rRNA genes. The boundaries of the four chloroplast regions are relatively conserved. SSR loci in Phyllostachys plants are abundant, with single-nucleotide repeats being the most common type, showing a preference for A/T. Global comparison and nucleotide polymorphism analysis revealed that the chloroplast genomes of Phyllostachys were generally conserved, with minor differences. Notably, three genes (atpH, trnQ-UUG, and petB), as well as five non-coding intervals (rpl32-trnL-UAG, rpl14-rpl16, rpl22-rps19, rps12-clpP, and trnR-UCU-trnM-CAU), exhibit high polymorphism and may serve as potential hotspots for further research. Codon usage patterns across the eight Phyllostachys species are predominantly influenced by natural selection, gene expression, and the first base of the codon. Leu is the most frequently used amino acid, while Cys is the least used.

Supplementary Materials

The following supporting information can be downloaded at https://www.mdpi.com/article/10.3390/f15101785/s1, Table S1: Some information of eight Phyllostachys species; Table S2: Distribution of simple sequence repeats (SSR) loci in the eight Phyllostachys chloroplast genomes; Table S3: Number of SSR length in eight Phyllostachys chloroplast genomes; Table S4: A list of repeated sequences and their locations identified in the eight Phyllostachys chloroplast genomes; Table S5: Nucleotide diversity (Pi) values in eight Phyllostachys chloroplast genomes; Table S6: Codon usage in eight chloroplast genomes; Table S7: Codon features of Phyllostachys chloroplast genomes; Table S8: The content of the third nucleotide A, T, C, G in the codon of Phyllostachys chloroplast genomes.

Author Contributions

C.L. conceived and designed this research; G.L. (Guolei Li) conducted data analysis and wrote this manuscript; G.L. (Guolei Li) and C.L. conducted experiments and data analysis; G.L. (Guohua Liu) and C.L. revised this manuscript. All authors have read and agreed to the published version of the manuscript.

Funding

This research was funded by the National Key Research & Development Program of China (Grant Nos. 2023YFD220120302 and 2023YFD2201901).

Data Availability Statement

The original contributions presented in the study are included in Supplementary Materials, further inquiries can be directed to the corresponding author.

Acknowledgments

The authors thank Jianjun Zhang for helping with the sample collection.

Conflicts of Interest

The authors declare no conflicts of interest.

References

  1. Buchanan, B.B.; Gruissem, W.; Jones, R.L. Biochemistry and Molecular Biology of Plants, 1st ed.; John Wiley & Sons: Hoboken, NJ, USA, 2015. [Google Scholar]
  2. Daniell, H.; Lin, C.S.; Yu, M.; Chang, W.J. Chloroplast genomes: Diversity, evolution, and applications in genetic engineering. Genome Biol. 2016, 17, 134. [Google Scholar] [CrossRef] [PubMed]
  3. Zhang, D.; Liu, Y.; Gao, L. The complete chloroplast genome sequence of Phyllostachys heterocycla, a fast-growing non-timber bamboo (Poaceae: Bambusoideae). Conserv. Genet. Resour. 2017, 9, 217–219. [Google Scholar] [CrossRef]
  4. Pei, J.; Wang, Y.; Zhuo, J.; Gao, H.; Vasupalli, N.; Hou, D.; Lin, X. Complete chloroplast genome features of Dendrocalamus farinosus and its comparison and evolutionary analysis with other Bambusoideae species. Genes 2022, 13, 1519. [Google Scholar] [CrossRef] [PubMed]
  5. Gao, T.; Yao, H.; Song, J.; Zhu, Y.; Liu, C.; Chen, S. Evaluating the feasibility of using candidate DNA barcodes in discriminating species of the large Asteraceae family. BMC Evol. Biol. 2010, 10, 324. [Google Scholar] [CrossRef]
  6. Wang, W.; Lanfear, R. Long-Reads Reveal That the Chloroplast Genome Exists in Two Distinct Versions in Most Plants. Genome Biol. Evol. 2019, 11, 3372–3381. [Google Scholar] [CrossRef]
  7. De Vries, J.; Archibald, J.M. Plastid genomes. Curr. Biol. 2018, 28, R336–R337. [Google Scholar] [CrossRef]
  8. Delannoy, E.; Fujii, S.; Colas des Francs-Small, C.; Brundrett, M.; Small, I. Rampant Gene Loss in the Underground Orchid Rhizanthella gardneri Highlights Evolutionary Constraints on Plastid Genomes. Mol. Biol. Evol. 2011, 28, 2077–2086. [Google Scholar] [CrossRef]
  9. Wu, C.; Chaw, S. Highly rearranged and size-variable chloroplast genomes in conifers II clade (cupressophytes): Evolution towards shorter intergenic spacers. Plant Biotechnol. J. 2014, 12, 344–353. [Google Scholar] [CrossRef]
  10. Wheeler, G.L.; Dorman, H.E.; Buchanan, A.; Challagundla, L.; Wallace, L.E. A review of the prevalence, utility, and caveats of using chloroplast simple sequence repeats for studies of plant biology. Appl. Plant Sci. 2014, 2, 1400059. [Google Scholar] [CrossRef]
  11. Wu, L.; Nie, L.; Wang, Q.; Xu, Z.; Wang, Y.; He, C.; Song, J.; Yao, H. Comparative and phylogenetic analyses of the chloroplast genomes of species of Paeoniaceae. Sci. Rep. 2021, 11, 14643. [Google Scholar] [CrossRef]
  12. Wang, Q.; Yue, J.; Yan, J. Research progress on maintaining chloroplast homeostasis under stress conditions: A review. Acta Biochim. Biophys. Sin. 2023, 55, 173–182. [Google Scholar] [CrossRef] [PubMed]
  13. Zhang, Y.; Tian, L.; Lu, C. Chloroplast gene expression: Recent advances and perspectives. Plant Commun. 2023, 4, 5. [Google Scholar] [CrossRef] [PubMed]
  14. Dobrogojski, J.; Adamiec, M.; Lucinski, R. The chloroplast genome: A review. Acta Physiol. Plant. 2020, 42, 98. [Google Scholar] [CrossRef]
  15. Fages-Lartaud, M.; Hundvin, K.; Hohmann-Marriott, M.F. Mechanisms governing codon usage bias and the implications for protein expression in the chloroplast of Chlamydomonas reinhardtii. Plant J. 2022, 112, 919–945. [Google Scholar] [CrossRef] [PubMed]
  16. Zeng, Y.; Shen, L.; Chen, S.; Qu, S.; Hou, N. Codon Usage Profiling of Chloroplast Genome in Juglandaceae. Forests 2023, 14, 378. [Google Scholar] [CrossRef]
  17. Clark, L.G.; Londono, X.; Ruiz-Sanchez, E. Bamboo taxonomy and habitat. In Bamboo: Tropical Forestry; Liese, W.K., Ed.; Springer: Cham, Switzerland, 2015; Volume 10, pp. 1–30. [Google Scholar]
  18. Ohrnberger, D. The Bamboos of the World: Annotated Nomenclature and Literature of the Species and the Higher and Lower Taxa; Elsevier: Amsterdam, The Netherlands, 1999. [Google Scholar]
  19. Gielis, J.; Potters, G. An updated tribal and subtribal classification of the bamboos (Poaceae: Bambusoideae). In Proceedings of the IX World Bamboo Congress 2012, Antwerp, Belgium, 10–12 April 2012; pp. 3–27. [Google Scholar]
  20. Clark, L.G.; Oliveira, R.P. Diversity and Evolution of the New World Bamboos. In Proceedings of the World Bamboo Congress, Xalapa, Mexico, 14–18 August 2018. [Google Scholar]
  21. Zhou, G.; Meng, C.; Jiang, P.; Xu, Q. Review of carbon fixation in bamboo forests in China. Bot. Rev. 2011, 77, 262–270. [Google Scholar] [CrossRef]
  22. McCormac, D.J.; Litz, H.; Wang, J.X.; Gollnick, P.D.; Berry, J.O. Light-associated and processing-dependent protein binding to 5′ regions of rbcL mRNA in the chloroplasts of a C4 plant. J. Biol. Chem. 2001, 276, 3476–3483. [Google Scholar] [CrossRef]
  23. Mahapatra, K.; Mukherjee, A.; Suyal, S.; Dar, M.A.; Bhagavatula, L.; Datta, S. Regulation of chloroplast biogenesis, development, and signaling by endogenous and exogenous cues. Physiol. Mol. Biol. Plants 2024, 30, 167–183. [Google Scholar] [CrossRef]
  24. Wu, F.-H.; Kan, D.-P.; Lee, S.-B.; Daniell, H.; Lee, Y.-W.; Lin, N.-S.; Lin, C.-S. Complete nucleotide sequence of Dendrocalamus latiflorus and Bambusa oldhamii chloroplast genomes. Tree Physiol. 2009, 29, 847–856. [Google Scholar] [CrossRef]
  25. Ma, P.-F.; Zhang, Y.-X.; Guo, Z.-H.; Li, D.-Z. Evidence for horizontal transfer of mitochondrial DNA to the plastid genome in a bamboo genus. Sci. Rep. 2015, 5, 11608. [Google Scholar] [CrossRef]
  26. Zhang, Y.J.; Ma, P.F.; Li, D.Z. High-throughput sequencing of six bamboo chloroplast genomes: Phylogenetic implications for temperate woody bamboos (Poaceae: Bambusoideae). PLoS ONE 2011, 6, e20596. [Google Scholar] [CrossRef] [PubMed]
  27. Burke, S.V.; Grennan, C.P.; Duvall, M.R. Plastome sequences of two New World bamboos—Arundinaria gigantea and Cryptochloa strictiflora (Poaceae)—Extend phylogenomic understanding of Bambusoideae. Am. J. Bot. 2012, 99, 1951–1961. [Google Scholar] [CrossRef] [PubMed]
  28. Gao, J.; Gao, L. The complete chloroplast genome sequence of Phyllostachys sulphurea (Poaceae: Bambusoideae). Mitochondrial DNA Part A 2016, 27, 983–985. [Google Scholar] [CrossRef] [PubMed]
  29. Wysocki, W.P.; Clark, L.G.; Attigala, L.; Ruiz-Sanchez, E.; Duvall, M.R. Evolution of the bamboos (Bambusoideae; Poaceae): A full plastome phylogenomic analysis. BMC Evol. Biol. 2015, 15, 50. [Google Scholar] [CrossRef]
  30. Ma, P.-F.; Zhang, Y.-X.; Zeng, C.-X.; Guo, Z.-H.; Li, D.-Z. Chloroplast phylogenomic analyses resolve deep-level relationships of an intractable bamboo tribe Arundinarieae (Poaceae). Syst. Biol. 2014, 63, 933–950. [Google Scholar] [CrossRef]
  31. Hu, Y.; Zhou, J.; Yu, Z.-Y.; Li, J.-J.; Xu, M.-Y.; Guo, Q.-R. The complete chloroplast genome of Phyllostachys heteroclada f. solida (Poaceae). Mitochondrial DNA Part B 2021, 6, 566–567. [Google Scholar]
  32. Jie, Z.; Ya, H.; Zhaoyan, Y.; Zhou, J.; Hu, Y.; Yu, Y.; Li, J.; Xu, M.; Guo, Q. The complete chloroplast genome of a solid type of Phyllostachys nidularia (Bambusoideae: Poaceae), a species endemic to China. Mitochondrial DNA Part B 2021, 6, 978–979. [Google Scholar] [CrossRef]
  33. Liu, X.; Liu, L.; Li, L.; Yue, J. The complete chloroplast genome of Phyllostachys edulis f. tubiformis (Bambusoideae): A highly appreciated type of ornamental bamboo in China. Mitochondrial DNA Part B 2022, 7, 185–187. [Google Scholar] [CrossRef]
  34. Jj, D. A rapid DNA isolation procedure for small quantities of fresh leaf tissue. Phytochem. Bull. 1987, 19, 11–15. [Google Scholar]
  35. Chen, S.; Zhou, Y.; Chen, Y.; Gu, J. fastp: An ultra-fast all-in-one FASTQ preprocessor. Bioinformatics 2018, 34, i884–i890. [Google Scholar] [CrossRef]
  36. Jin, J.-J.; Yu, W.-B.; Yang, J.-B.; Song, Y.; Depamphilis, C.W.; Yi, T.-S.; Li, D.-Z. GetOrganelle: A fast and versatile toolkit for accurate de novo assembly of organelle genomes. Genome Biol. 2020, 21, 241. [Google Scholar] [CrossRef] [PubMed]
  37. Kearse, M.; Moir, R.; Wilson, A.; Stones-Havas, S.; Cheung, M.; Sturrock, S.; Buxton, S.; Cooper, A.; Markowitz, S.; Duran, C.; et al. Geneious Basic: An integrated and extendable desktop software platform for the organization and analysis of sequence data. Bioinformatics 2012, 28, 1647–1649. [Google Scholar] [CrossRef] [PubMed]
  38. Shi, L.; Chen, H.; Jiang, M.; Wang, L.; Wu, X.; Huang, L.; Liu, C. CPGAVAS2, an integrated plastome sequence annotator and analyzer. Nucleic Acids Res. 2019, 47, W65–W73. [Google Scholar] [CrossRef] [PubMed]
  39. Greiner, S.; Lehwark, P.; Bock, R. OrganellarGenomeDRAW (OGDRAW) version 1.3. 1: Expanded toolkit for the graphical visualization of organellar genomes. Nucleic Acids Res. 2019, 47, W59–W64. [Google Scholar] [CrossRef]
  40. Li, H.; Guo, Q.; Xu, L.; Gao, H.; Liu, L.; Zhou, X. CPJSdraw: Analysis and visualization of junction sites of chloroplast genomes. PeerJ 2023, 11, e15326. [Google Scholar] [CrossRef]
  41. Frazer, K.A.; Pachter, L.; Poliakov, A.; Rubin, E.M.; Dubchak, I. VISTA: Computational tools for comparative genomics. Nucleic Acids Res. 2004, 32, W273–W279. [Google Scholar] [CrossRef]
  42. Rozas, J.; Ferrer-Mata, A.; Sánchez-DelBarrio, J.C.; Guirao-Rico, S.; Librado, P.; Ramos-Onsins, S.E.; Sánchez-Gracia, A. DnaSP 6: DNA sequence polymorphism analysis of large data sets. Mol. Biol. Evol. 2017, 34, 3299–3302. [Google Scholar] [CrossRef]
  43. Benson, G. Tandem repeats finder: A program to analyze DNA sequences. Nucleic Acids Res. 1999, 27, 573–580. [Google Scholar] [CrossRef]
  44. Kurtz, S.; Choudhuri, J.V.; Ohlebusch, E.; Schleiermacher, C.; Stoye, J.; Giegerich, R. REPuter: The manifold applications of repeat analysis on a genomic scale. Nucleic Acids Res. 2001, 29, 4633–4642. [Google Scholar] [CrossRef]
  45. Beier, S.; Thiel, T.; Münch, T.; Scholz, U.; Mascher, M. MISA-web: A web server for microsatellite prediction. Bioinformatics 2017, 33, 2583–2585. [Google Scholar] [CrossRef]
  46. Zhang, R.; Zhang, L.; Wang, W.; Zhang, Z.; Du, H.; Qu, Z.; Li, X.-Q.; Xiang, H. Differences in codon usage bias between photosynthesis-related genes and genetic system-related genes of chloroplast genomes in cultivated and wild solanum species. Int. J. Mol. Sci. 2018, 19, 3142. [Google Scholar] [CrossRef] [PubMed]
  47. Wang, Z.; Xu, B.; Li, B.; Zhou, Q.; Wang, G.; Jiang, X.; Wang, C.; Xu, Z. Comparative analysis of codon usage patterns in chloroplast genomes of six Euphorbiaceae species. PeerJ 2020, 8, e8251. [Google Scholar] [CrossRef] [PubMed]
  48. Chakraborty, S.; Yengkhom, S.; Uddin, A. Analysis of codon usage bias of chloroplast genes in Oryza species: Codon usage of chloroplast genes in Oryza species. Planta 2020, 252, 67. [Google Scholar] [CrossRef] [PubMed]
  49. Sun, X.; Yang, Q. An improved implementation of effective Number of Codons (N c). Mol. Biol. Evol. 2013, 30, 191–196. [Google Scholar] [CrossRef] [PubMed]
  50. Ravi, V.; Khurana, J.P.; Tyagi, A.K.; Khurana, P. An update on chloroplast genomes. Plant Syst. Evol. 2008, 271, 101–122. [Google Scholar] [CrossRef]
  51. Huang, N.J.; Li, J.P.; Yang, G.Y.; Yu, F. Two plastomes of Phyllostachys and reconstruction of phylogenic relationship amongst selected Phyllostachys species using genome skimming. Mitochondrial DNA Part B 2020, 5, 69–70. [Google Scholar] [CrossRef]
  52. Gao, L.Q.; Li, Y.L.; Zhang, W.G.; Yang, G.Y. The complete chloroplast genome of Phyllostachys edulis f. curviculmis (Bambusoideae): A newly ornamental bamboo endemic to China. Mitochondrial DNA Part B 2021, 6, 941–942. [Google Scholar] [CrossRef]
  53. Hurt, E.; Günter, H. A cytochrome f/b6 complex of five polypeptides with plastoquinol-plastocyanin-oxidoreductase activity from spinach chloroplasts. Eur. J. Biochem. 1981, 3, 591–599. [Google Scholar] [CrossRef]
  54. Jansen, R.K.; Raubeson, L.A.; Boore, J.L.; Depamphilis, C.W.; Chumley, T.W.; Haberle, R.C.; Wyman, S.K.; Alverson, A.J.; Peery, R.; Herman, S.J.; et al. Methods for obtaining and analyzing whole chloroplast genome sequences. Methods Enzymol. 2005, 395, 348–384. [Google Scholar]
  55. Kaila, T.; Chaduvla, P.K.; Saxena, S.; Bahadur, K.; Gahukar, S.J.; Chaudhury, A.; Sharma, T.R.; Singh, N.K.; Gaikwad, K. Chloroplast genome sequence of Pigeonpea (Cajanus cajan (L.) Millspaugh) and Cajanus scarabaeoides (L.) Thouars: Genome organization and comparison with other legumes. Front. Plant Sci. 2016, 7, 1847. [Google Scholar] [CrossRef]
  56. Choi, K.S.; Ogyeong, S.; Seonjoo, P. The chloroplast genome of Elaeagnus macrophylla and trnH duplication event in Elaeagnaceae. PLoS ONE 2015, 10, e0138727. [Google Scholar] [CrossRef] [PubMed]
  57. Jansen, R.K.; Cai, Z.; Raubeson, L.A.; Daniell, H.; dePamphilis, C.W.; Leebens-Mack, J.; Müller, K.F.; Guisinger-Bellian, M.; Haberle, R.C.; Hansen, A.K.; et al. Analysis of 81 genes from 64 plastid genomes resolves relationships in angiosperms and identifies genome-scale evolutionary patterns. Proc. Natl. Acad. Sci. USA 2007, 104, 19369–19374. [Google Scholar] [CrossRef] [PubMed]
  58. Jansen, R.K.; Saski, C.; Lee, S.-B.; Hansen, A.K.; Daniell, H. Complete plastid genome sequences of three rosids (Castanea, Prunus, Theobroma): Evidence for at least two independent transfers of rpl22 to the nucleus. Mol. Biol. Evol. 2011, 28, 835–847. [Google Scholar] [CrossRef]
  59. Dugas, D.V.; Hernandez, D.; Koenen, E.J.; Schwarz, E.; Straub, S.; Hughes, C.E.; Jansen, R.K.; Nageswara-Rao, M.; Staats, M.; Trujillo, J.T.; et al. Mimosoid legume plastome evolution: IR expansion, tandem repeat expansions and accelerated rate of evolution in clpP. Sci. Rep. 2015, 5, 16958. [Google Scholar] [CrossRef] [PubMed]
  60. He, L.; Qian, J.; Li, X.; Sun, Z.; Xu, X.; Chen, S. Complete chloroplast genome of medicinal plant Lonicera japonica: Genome rearrangement, intron gain and loss, and implications for phylogenetic studies. Molecules 2017, 22, 249. [Google Scholar] [CrossRef] [PubMed]
  61. Kuang, D.-Y.; Wu, H.; Wang, Y.-L.; Gao, L.-M.; Zhang, S.-Z.; Lu, L. Complete chloroplast genome sequence of Magnolia kwangsiensis (Magnoliaceae): Implication for DNA barcoding and population genetics. Genome 2011, 54, 663–673. [Google Scholar] [CrossRef] [PubMed]
  62. Powell, W.; Morgante, M.; McDevitt, R.; Vendramin, G.G.; A Rafalski, J. Polymorphic simple sequence repeat regions in chloroplast genomes: Applications to the population genetics of pines. Proc. Natl. Acad. Sci. USA 1995, 92, 7759–7763. [Google Scholar] [CrossRef]
  63. Qin, Z.; Wang, Y.; Wang, Q.; Li, A.; Hou, F.; Zhang, L. Evolution analysis of simple sequence repeats in plant genome. PLoS ONE 2015, 10, e0144108. [Google Scholar] [CrossRef]
  64. Tautz, D.; Renz, M. Simple sequences are ubiquitous repetitive components of eukaryotic genomes. Nucleic Acids Res. 1984, 12, 4127–4138. [Google Scholar] [CrossRef]
  65. Kalia, R.K.; Rai, M.K.; Kalia, S.; Singh, R.; Dhawan, A.K. Microsatellite markers: An overview of the recent progress in plants. Euphytica 2011, 177, 309–334. [Google Scholar] [CrossRef]
  66. Iram, S.; Hayat, M.Q.; Tahir, M.; Gul, A.; Abdullah; Ahmed, I. Chloroplast genome sequence of Artemisia scoparia: Comparative analyses and screening of mutational hotspots. Plants 2019, 8, 476. [Google Scholar] [CrossRef] [PubMed]
  67. Zhou, B.; Yao, W.; Guo, C.; Bian, L.; Ding, Y.; Lin, S. Chloroplast Genome Variation and Phylogenetic Analyses of Seven Dwarf Ornamental Bamboo Species. Forests 2022, 13, 1671. [Google Scholar] [CrossRef]
  68. Gao, L.; Yi, X.; Yang, Y.-X.; Su, Y.-J.; Wang, T. Complete chloroplast genome sequence of a tree fern Alsophila spinulosa: Insights into evolutionary changes in fern chloroplast genomes. BMC Evol. Biol. 2009, 9, 130. [Google Scholar] [CrossRef] [PubMed]
  69. Cavalier-Smith, T. Chloroplast evolution: Secondary symbiogenesis and multiple losses. Curr. Biol. 2002, 12, R62–R64. [Google Scholar] [CrossRef] [PubMed]
  70. Lu, R.S.; Li, P.; Qiu, Y.X. The complete chloroplast genomes of three Cardiocrinum (Liliaceae) species: Comparative genomic and phylogenetic analyses. Front. Plant Sci. 2017, 7, 2054. [Google Scholar] [CrossRef]
  71. Wei, X.; Li, X.; Chen, T.; Chen, Z.; Jin, Y.; Malik, K.; Li, C. Complete chloroplast genomes of Achnatherum inebrians and comparative analyses with related species from Poaceae. FEBS Open Bio 2021, 11, 1704–1718. [Google Scholar] [CrossRef]
  72. Vieira, L.N.; Faoro, H.; Rogalski, M.; de Freitas Fraga, H.P.; Cardoso, R.L.A.; de Souza, E.M.; de Oliveira Pedrosa, F.; Nodari, R.O.; Guerra, M.P. The complete chloroplast genome sequence of Podocarpus lambertii: Genome structure, evolutionary aspects, gene content and SSR detection. PLoS ONE 2014, 9, e90618. [Google Scholar] [CrossRef]
  73. Nie, X.; Lv, S.; Zhang, Y.; Du, X.; Wang, L.; Biradar, S.S.; Tan, X.; Wan, F.; Weining, S. chloroplast genome sequence of a major invasive species, crofton weed (Ageratina adenophora). PLoS ONE 2012, 7, e36869. [Google Scholar] [CrossRef]
  74. Quax, T.E.; Claassens, N.J.; Söll, D.; van der Oost, J. Codon bias as a means to fine-tune gene expression. Mol. Cell 2015, 59, 149–161. [Google Scholar] [CrossRef]
  75. Tuller, T.; Waldman, Y.Y.; Kupiec, M.; Ruppin, E. Translation efficiency is determined by both codon bias and folding energy. Proc. Natl. Acad. Sci. USA 2010, 107, 3645–3650. [Google Scholar] [CrossRef]
  76. Uddin, A. Indices of codon usage bias. J. Proteomics Bioinform. 2017, 10, 1000e34. [Google Scholar] [CrossRef]
  77. Tang, D.; Wei, F.; Cai, Z.; Wei, Y.; Khan, A.; Miao, J.; Wei, K. Analysis of codon usage bias and evolution in the chloroplast genome of Mesona chinensis Benth. Dev. Genes Evol. 2021, 231, 1–9. [Google Scholar] [CrossRef] [PubMed]
  78. Nie, X.; Deng, P.; Feng, K.; Liu, P.; Du, X.; You, F.M.; Weining, S. Comparative analysis of codon usage patterns in chloroplast genomes of the Asteraceae family. Plant Mol. Biol. Rep. 2014, 32, 828–840. [Google Scholar] [CrossRef]
Figure 1. Map of Phyllostachys chloroplast genome. Genes are color-coded based on their function, as shown in the legend. The inner circle indicates the inverted repeat boundaries and the genome’s GC content. The arrows indicate the direction of gene transcription.
Forests 15 01785 g001
Figure 2. Comparisons of LSC, SSC, and IR region boundaries among the plastomes of Phyllostachys species. Genes adjacent to the junctions are shown as blocks of different colors.
Forests 15 01785 g002
Figure 3. Sequence identity plots among chloroplast genomes of P. edulis, P. nigra, P. nigra var. henonis, P. nigra var. punctata, P. aureosulcata spectabilis, P. heteroclada, P. vivax aureocanlis, and P. vivax ‘Huangwenzhu’ with P. edulis (NC_015817) as a reference. Annotated genes are displayed along the top. The vertical scale represents the percent identity between 50 and 100%. Genome regions are color-coded as exon, intron, and conserved non-coding sequences (CDS).
Forests 15 01785 g003
Figure 4. Nucleotide polymorphism analysis of chloroplast Genomes in the Phyllostachys. (A) Nucleotide polymorphism of intergenic region. (B) Nucleotide polymorphism of gene region. Window length: 600 bp; step size: 100 bp; X-axis: position of the midpoint of a window; Y-axis: nucleotide diversity of each window. Regions with high nucleotide polymorphism have been labeled with values. The red marker indicates the region with the highest nucleotide polymorphism.
Forests 15 01785 g004
Figure 5. Analysis of SSRs in eight Phyllostachys chloroplast genomes. (A) Number of SSR repeat types. (B) Number of identified SSR motifs in different repeat types. (C) Number of identified SSRs in IGS, CDS, and intron regions. (D) Number of identified SSRs in LSC, SSC, and IR regions. (E) Number of SSRs by length.
Forests 15 01785 g005
Figure 6. Analysis of large repeat sequences in eight Phyllostachys chloroplast genomes. (A) A total of five repeat types. (B) Number of tandem repeats in LSC, SSC, and IR regions. (C) Number of tandem repeats by length. (D) Number of dispersed repeats in IGS, CDS, and intron regions. (E) Number of dispersed repeats in LSC, SSC, and IR regions. (F) Number of dispersed repeats by length.
Forests 15 01785 g006
Figure 7. RSCU value of eight chloroplast genomes of Phyllostachys species. Different colors represent various types of codons.
Forests 15 01785 g007
Figure 8. Neutrality plot analysis of eight chloroplast genomes of Phyllostachys species.
Forests 15 01785 g008
Figure 9. ENC-plot analysis of eight chloroplast genomes of Phyllostachys species.
Forests 15 01785 g009
Figure 10. PR2-plot analysis of eight chloroplast genomes of Phyllostachys species.
Forests 15 01785 g010
Table 1. Characteristics of complete chloroplast genomes of eight species of Phyllostachys.
CharacteristicsP. edulisP. nigraP. nigra var.
punctata
P. aureosulcata
spectabilis
P. heterocladaP. vivax
aureocanlis
Total size (bp)139,679139,708139,709139,701139,669139,715
LSC length (bp)83,21383,23383,23483,22383,19983,220
IR length (bp)21,79821,79821,79821,79821,79821,798
SSC length (bp)12,87012,87912,87912,88212,87412,899
Total genes108108108108108107
Protein-coding genes767676767675
tRNA genes282828282828
rRNA genes444444
Total GC (%)38.938.938.938.938.938.9
LSC of GC (%)36.9736.9836.9836.9736.9836.97
IR of GC (%)44.2244.2244.2244.2244.2244.22
SSC of GC (%)33.1733.1533.1533.1433.1533.14
Accession
number
PQ325516PQ325517PQ325523PQ325519PQ325520PQ325521
P. nigra var. henonis is the same as P. nigra var. Punctata; P. vivax ‘Huangwenzhu’ is the same as P. vivax aureocanlis. P. nigra var. henonis’s accession number is PQ325518; P. vivax ‘Huangwenzhu’’s accession number is PQ325522.
Table 2. List of genes identified in the studied chloroplast genomes of eight species of Phyllostachys.
Gene GroupGene Name
Photosystem IpsaA, psaB, psaC, psaI, psaJ
Photosystem IIpsbA, psbB, psbC, psbD, psbE, psbF, psbH, psbI, psbJ, psbK, psbL, psbM, psbN, psbT, psbZ
NADPH dehydrogenasendhA a, ndhB ac, ndhC, ndhD, ndhE, ndhF, ndhG, ndhH, ndhI, ndhJ, ndhK
Cytochrome b/f complexpetA, petB, petD, petG, petL, petN
ATP synthaseatpA, atpB, atpE, atpF a, atpH, atpI
RubiscorbcL
Large ribosomal unitsrpl14, rpl16 a, rpl2 ac, rpl20, rpl22, rpl23 c, rpl32, rpl33, rpl36
Small ribosomal unitsrps11, rps12 bc, rps14, rps15 c, rps16 a, rps18, rps19 c, rps2, rps3, rps4, rps7 c, rps8
RNA polymerase sub-unitsrpoA, rpoB, rpoC1, rpoC2 a
Ribosomal RNArrn16S c, rrn23S c, rrn4.5S c, rrn5S c
Transfer RNAtrnA-UGC ac, trnC-GCA, trnD-GUC, trnE-UUC, trnF-GAA, trnG-GCC, trnH-GUG c, trnK-UUU a, trnL-CAA c, trnL-UAA a, trnL-UAG, trnM-CAU c, trnN-GUUc, trnP-UGG, trnQ-UUG, trnR-ACG c, trnR-UCU, trnS-CGA a, trnS-GCU, trnS-GGA, trnS-UGA, trnT-CGU ac, trnT-GGU, trnT-UGU, trnV-GAC c, trnV-UAC a, trnW-CCA, trnY-GUA
MaturasematK
ProteaseclpP
Envelope membrane proteincemA
c-Type cytochrome synthesisccsA
Translation initiation factorinfA
Hypothetical genes reading framesycf3 b, ycf4
Note: a indicates one intron; b indicates two introns; c represents multiple copies of genes.
Table 3. Codon features of Phyllostachys chloroplast genomes.
SpeciesCodon No.GC1GC2GC3GCCAIENC
P. edulis16,4330.47780.39340.30890.39340.16750.40
P. aureosulcata spectabilis16,4330.47770.39330.3090.39330.16750.42
P. heteroclada16,4330.47770.39340.3090.39340.16750.42
P. nigra var. henonis16,4330.47770.39330.30910.39340.16750.42
P. nigra var. punctata16,4330.47770.39330.30910.39340.16750.42
P. nigra16,4330.47770.39330.30910.39340.16750.42
P. vivax aureocanlis16,4330.47770.39320.3090.39330.16750.42
P. vivax ‘Huangwenzhu’16,4330.47770.39320.3090.39330.16750.42
Disclaimer/Publisher’s Note: The statements, opinions and data contained in all publications are solely those of the individual author(s) and contributor(s) and not of MDPI and/or the editor(s). MDPI and/or the editor(s) disclaim responsibility for any injury to people or property resulting from any ideas, methods, instructions or products referred to in the content.

