Article

Soil Enzyme Activities and Microbial Nutrient Limitation of Various Temperate Forest Types in Northeastern China

1
School of Hydraulic and Electric Power, Heilongjiang University, Harbin 150080, China
2
International Joint Laboratory of Hydrology and Hydraulic Engineering in Cold Regions of Heilongjiang Province, Harbin 150080, China
*
Author to whom correspondence should be addressed.
Forests 2024, 15(10), 1815; https://doi.org/10.3390/f15101815
Submission received: 10 September 2024 / Revised: 15 October 2024 / Accepted: 15 October 2024 / Published: 17 October 2024
(This article belongs to the Section Forest Soil)

Abstract

:
Soil enzymes mediate organic matter decomposition and nutrient cycling, and their stoichiometry can indicate microbial nutrient demands. However, research on the variations in soil enzymes and microbial nutrient limitation under different temperate forest types still lacks insight. In this study, we sampled soils under five typical forest types (including Betula platyphylla Suk. forest, Fraxinus mandschurica Rupr forest, Larix gmelinii (Rupr.) Kuzen. forest, Populus davidiana Dode forest, and Pinus koraiensis Siebold et Zucc.forest) in the temperate climatic region of northeast China. Soil enzyme activities and soil microbial community composition and diversity were determined for each, and vector analysis was used to quantify the value of microbial limitation. The results showed that soil enzyme activity, enzyme stoichiometry, and microbial community structure were significantly different among the five temperate forest types. The ratios of soil C:N:P acquiring enzyme activity were close to 1:1:1. All the forests showed prevalent P limitation over N limitation (all vector angles > 45°), and the degree of impact varied among different forest types. Redundancy analysis (RDA) and Pearson’s test demonstrated that soil enzyme activities and microbial nutrient limitation were mainly determined by soil physical properties and microbial community. These results contribute to understanding the mechanisms that link plant composition, soil enzyme activity, and microbial nutrient limitation in temperate forests.

1. Introduction

In terrestrial ecosystems, forests account for nearly one-third of the area and are the major components of the global carbon cycle [1]. Plant species and the soil environment can lead to differences in the quantity and quality of litter and root systems, ultimately affecting subsurface nutrient cycling in forest ecosystems [2]. Soil microbes, as essential components of the soil, play a vital role in regulating the decomposition of soil organic matter and subsurface nutrient cycling [3]. As basic nutrients, carbon (C), nitrogen (N), and phosphorus (P) directly impact plant growth, soil nutrient status, and microbial activities [4]. Soil enzyme activities are recognized as reflecting the variations in microbial energy and nutrient requirements, along with the uptake and utilization of C, N, and P in soil [5,6]. Moreover, soil enzyme stoichiometric ratios can serve as indicators for determining microbial resource allocation during their processes of acquiring energy and mediating the nutrient cycle among plant, soil, and microbe [7]. Thus, it is essential to explore the dynamics of soil enzyme activities and stoichiometry in response to forest vegetation composition, as it can provide a precise assessment of the impact of the above-ground environmental changes on subsurface ecological processes.
Soil enzymes directly mediate organic matter decomposition and catalyze C, N, and P cycling, which are mainly affected by vegetation composition, soil type, and microbial community [8,9,10]. Previous studies have reported that vegetation types differ in the magnitude of rhizosphere effects, which leads to differences in soil enzyme activity [10,11]. Different types of soil have a profound impact on the activity distribution of soil enzymes due to their unique physical structure, chemical composition, and biological community characteristics. Specifically, multiple factors such as soil texture, pH, and organic matter C work together to significantly affect soil enzymes, thereby regulating soil biochemical processes and ultimately determining soil fertility [12,13,14]. However, the degree of these influences showed significant differences among forests. Adamczyk et al. [15] compared the potential enzyme activity in relation to C, N, and P cycling under three tree species and suggested that the soil β-1,4-glucosidase (BG) activity was higher in the pine than that in the birch, whereas the β-1,4-N-acetylglucosaminidase (NAG), leucine aminopeptidase (LAP), and acid phosphatase (ACP) activities showed similar activities regardless of tree species. A notable difference in soil BG activity was also found between the Populus euphratica and Tamarix arceuthoides stands [16]. In contrast, a study of secondary succession in boreal forests suggested that BG, NAG, and ACP activities were all similar among the three forest types [17]. Meanwhile, soil enzyme stoichiometry is also a vital factor that is commonly employed to assess the metabolic characteristics of microorganisms represented by C, N, and P. Waring et al. [18] found that the soil enzyme stoichiometry in temperate forests was significantly higher than that in tropical ecosystems, and this was attributed to the climate factors. Qi et al. [19] investigated the temperate primary coniferous and broad-leaved mixed forests and found that the stoichiometry of soil enzymes was higher in the broad-leaved forests. However, Li et al. [20] found no substantial variations in enzyme ratios across three distinct ecosystem types in subtropical areas. These results emphasize the differences regarding soil enzyme activity and stoichiometry across various forest types. Hence, further investigation is required to identify the patterns and driving factors that affect soil enzymes in forest ecosystems.
Microorganisms produce a diverse array of enzymes to facilitate the degradation of soil carbon and to derive energy and essential nutrients from the soil [21]. These enzymes are generated through cellular metabolism and reflect the potential of nutrients in the environment. Soil enzyme activity reflects nutrient requirements and utilization efficiency of microbes, and enzyme stoichiometry reflects the limitations of microbial nutrition [22,23]. Thus, enzymes are essential for the success of microorganisms that depend on the degradation of polymeric substrates, making it imperative to prioritize the allocation of C, N, and P for enzyme production to avoid starvation. However, the microbial nutrient limitation in different forest ecosystems usually shows different characteristics. Changes in forest types and soil conditions are frequently recognized as pivotal factors that affect the fluctuations in enzyme activity and stoichiometry at the regional scale [24]. For instance, different dominant tree species in forest ecosystems often correspond to distinct soil properties and microbial communities, which has a consequential impact on the soil microbial metabolism and further impacts soil enzymes [25,26,27]. Nevertheless, related research has focused on broad-leaved and deciduous tropical and subtropical forest ecosystems, with a relative lack of research on temperate broad-leaved and coniferous forests. This restricts the understanding of the interconnected relationship among plant composition, soil microbes, and soil nutrient cycling in temperate ecosystems.
Temperate forests of northeastern China occupy 37% of the total national forest area in the country and play pivotal roles in regulating nutrient cycling and climate [28,29]. Here, the primary objective of this study was to examine the impact of forest types on soil enzyme activities, microbial nutrient limitation, and microbial community composition in temperate China. Specifically, we selected five forest ecosystems including Betula platyphylla Suk. forest (B. platyphylla), Fraxinus mandschurica Rupr forest (F. mandschurica), Larix gmelinii (Rupr.) Kuzen. forest (L. gmelinii), Populus davidiana Dode forest (P. davidiana), and Pinus koraiensis Siebold et Zucc.forest (P. koraiensis). Soil properties, enzyme activity, microbial nutrient limitation, and microbial communities in the surface soil (0–20 cm) were measured to gain a more profound insight into the underlying mechanism of soil microbe metabolism. In our study, we propose the following hypotheses: (1) Soil enzyme activity, enzyme stoichiometry, and microbial communities differ among the five forest types, and their variation patterns also differ among forests. (2) Microbial nutrient limitation, as indicated by soil enzyme stoichiometry, varies across the five forest types. (3) Changes in soil microbial communities affect enzyme activities and microbial nutrient limitation.

2. Materials and Methods

2.1. Site Description

This research was conducted in the Xiaoling of Heilongjiang Province in Northeast China (127°05′~127°34′ E, 45°23′~45°52′ N), which belongs to Zhangguangcailing vein (Figure 1). The area is under the influence of continental monsoonal climate with an average annual temperature of 2.0 °C and average annual precipitation of 550–700 mm, 85% of which occurs between May and September. The frost-free period for plant growth is approximately 130 days. The average elevation is 570 m. The classification of the soils as Alfisols (specifically, Eutroboralfs) is determined according to the United States Soil Taxonomy.

2.2. Experimental Design and Soil Sampling

In July 2023, we selected five typical forest ecosystems, including B. platyphylla, P. davidiana, F. mandschurica, L. gmelinii, and P. koraiensis each separated by more than 1 km. In each forest, three replicates of 20 m × 20 m plots were randomly established, totaling 15 plots). Investigated the basic information of different forest types and dominant species of understory vegetation (Table 1 and Table 2). All plots were spaced more than 20 m apart in each forest type to ensure the independence of data acquisition. Soil samples were gathered from 15 replicate locations arranged in an “S” pattern within each plot, at a depth ranging from 0 to 20 cm, using a stainless-steel auger with a 5 cm diameter, then mixing the samples into one composite sample for each plot.
The mixed soil samples were then separated into three parts after all visible plant roots, stones, and other debris were removed. One section of the sample was air-dried and sieved to a size of less than 2 mm for physicochemical analysis. The remaining two sections were preserved: one at −80 °C for DNA extraction and the other at 4 °C for enzymatic activity analysis.

2.3. Soil Analysis

2.3.1. Soil Chemical Analyses

Soil moisture (SWC) was determined by gravimetric analysis after drying the soil samples at 105 °C for 24 h. Soil pH was determined using a pH meter (PHS–3C, Shanghai, China). Soil total C (TC) and N (TN) concentrations were determined with an elemental CN analyzer (LECO, St Joseph, MI, USA), and total soil P (TP) concentrations were measured by using the molybdenum-blue colorimeter [30,31].

2.3.2. Soil Enzymatic Activity Analyses

In this study, four enzymes associated with C, N, and P cycling were selected, including β-1,4-glucosidase (BG), β-1,4-N-acetylglucosaminidase (NAG), leucine aminopeptidase (LAP), and acid phosphatase (ACP). Among them, BG is related to C cycling, NAG and LAP are related to N cycling, and ACP is related to P cycling. All these enzymes were determined using the method of Verchot and Borelli [32]. In brief, the activity of the enzymes was evaluated colorimetrically, utilizing the substrates listed in Table 3. We added 50 mL of 50 mM acetate buffer to 2.5 g of fresh soil and shook it in a constant temperature shaker at 180 r/min for 40 min at 25 °C. Next, 2 mL of slurry was added to 2 mL of the enzyme substrate solution. After incubation, the sample was centrifuged at 2000 rpm for 5 min. Then, 1 mL of supernatant was added to 0.2 mL of 1 M NaOH solution diluted with deionized water to 10 mL. The absorbance of the released ρ-nitrophenol (ρNP) was measured spectrophotometrically at a wavelength of 410 nm, using the colorimetric method. Finally, all results were reported in units of nmol h−1g−1 dry soil.

2.3.3. Soil Microbial Community Properties and the Fungi-to-Bacteria Ratio Assays

Soil microbial DNA was extracted from 0.5 g of fresh sample using the PowerSoil® DNA Isolation Kit (MoBio Inc., Carlsbad, CA, USA). DNA quality and quantity were determined using the Agarose gel electrophoresis and the Nanodrop1000 Spectrophotometer (Thermo Fisher Scientific, Waltham, MA, USA). The V3–V4 region of bacterial 16S rRNA gene was amplified with primer pairs 338F/806R (5′-CCTAYGGGRBGCASCAG-3′/5′-GGACTACNNGGGTATCT AAT-3′). The fungal ITS-1 region was amplified by using fungi specific primers ITS1F (5′-CTTGGTCATTTAGAGGAAGTAA-3′) and ITS2R (5′- GCTGCGTTCTTCATCGA TGC-3′) [33]. The protocol of 16S rRNA gene PCR amplification was operated as described previously [34]. The PCR amplification of fungi was denatured at 95 °C for 2 min, and then amplified by 30 cycles of 95 °C for 30 s, 55 °C for 30 s, 72 °C for 30 s, and a final extension at 72 °C for 5 min. Sequence analysis was conducted using the Microbial Ecology pipeline software (QIME 1.6.0). The sequences were allocated to operational taxonomic units (OTUs) based on a similarity threshold of 97%. The complete dataset in this study was deposited in the National Center for Biotechnology Information (NCBI) under accession numbers of PRJNA1055189 for bacteria and fungi. The ratio of fungi to bacteria (F:B ratio) was determined using the abundances of soil total bacterial and fungal communities. The Shannon diversity index was calculated using the software Mothur (Version 1.41.3) to assess the alpha diversity of soil bacterial and fungal communities. Moreover, to visualize the beta diversity of soil bacterial and fungal communities across different forest types, non-metric multidimensional scaling (NMDS) was utilized.

2.4. Data Analysis

Microbial nutrient limitation was assessed by examining the vector lengths and angles of enzymatic activity, which were calculated by the following equation [5,35]:
V e c t o r   L e n g t h = X 2 + Y 2
Vector Angle(°) = Degrees[ATAN2(X,Y)]
where X is ln BG/ln(NAG + LAP), and Y is ln BG/ln (ACP). Vector length served as an indicator of soil microbial C limitation. When the vector angle < 45° indicates the relative extent of N limitation; the greater the deviation, the stronger the limitation. Otherwise, the microbial P limitation exists [36].

2.5. Statistical Analysis

Soil properties, enzyme activity, microbial nutrient limitation, and soil microbial community properties among forest types were analyzed based on the one-way analysis of variance (ANOVA) followed by the LSD test. Duncan’s post hoc test was used to perform the multiple comparisons. Pearson’s correlation analysis was conducted to determine the relationship among soil properties, enzyme activity, microbial nutrient limitation, and soil microbial community properties in this study. All statistical analyses were conducted using SPSS software (version 19.0 for Windows, SPSS Institute, Inc., Chicago, IL, USA) with a significance level set at p < 0.05 or 0.01. Redundancy analysis (RDA), conducted using the vegan package in R software (Version 4.0.3), was utilized to investigate the relationships between soil microbial community composition and soil properties.

3. Results

3.1. Soil Properties

Soil moisture, pH, TC, TN, and TP contents were significantly affected by forest type (Table 4). SWC showed significant differences among five forest types, with P. koraiensis > B. platyphylla > F. mandschurica > P. davidiana > L. gmelinii (p < 0.05). The pH in the F. mandschurica was significantly higher than that in the other forest types (p < 0.05). TC and TN contents were highest in P. koraiensis, then in B. platyphylla, F. mandschurica, and L. gmelinii, and lowest in P. davidiana (p < 0.05). Meanwhile, significant differences in the soil TP contents among five forest types were found, showing P. koraiensis > L. gmelinii > B. platyphylla > F. mandschurica > P. davidiana (p < 0.05).

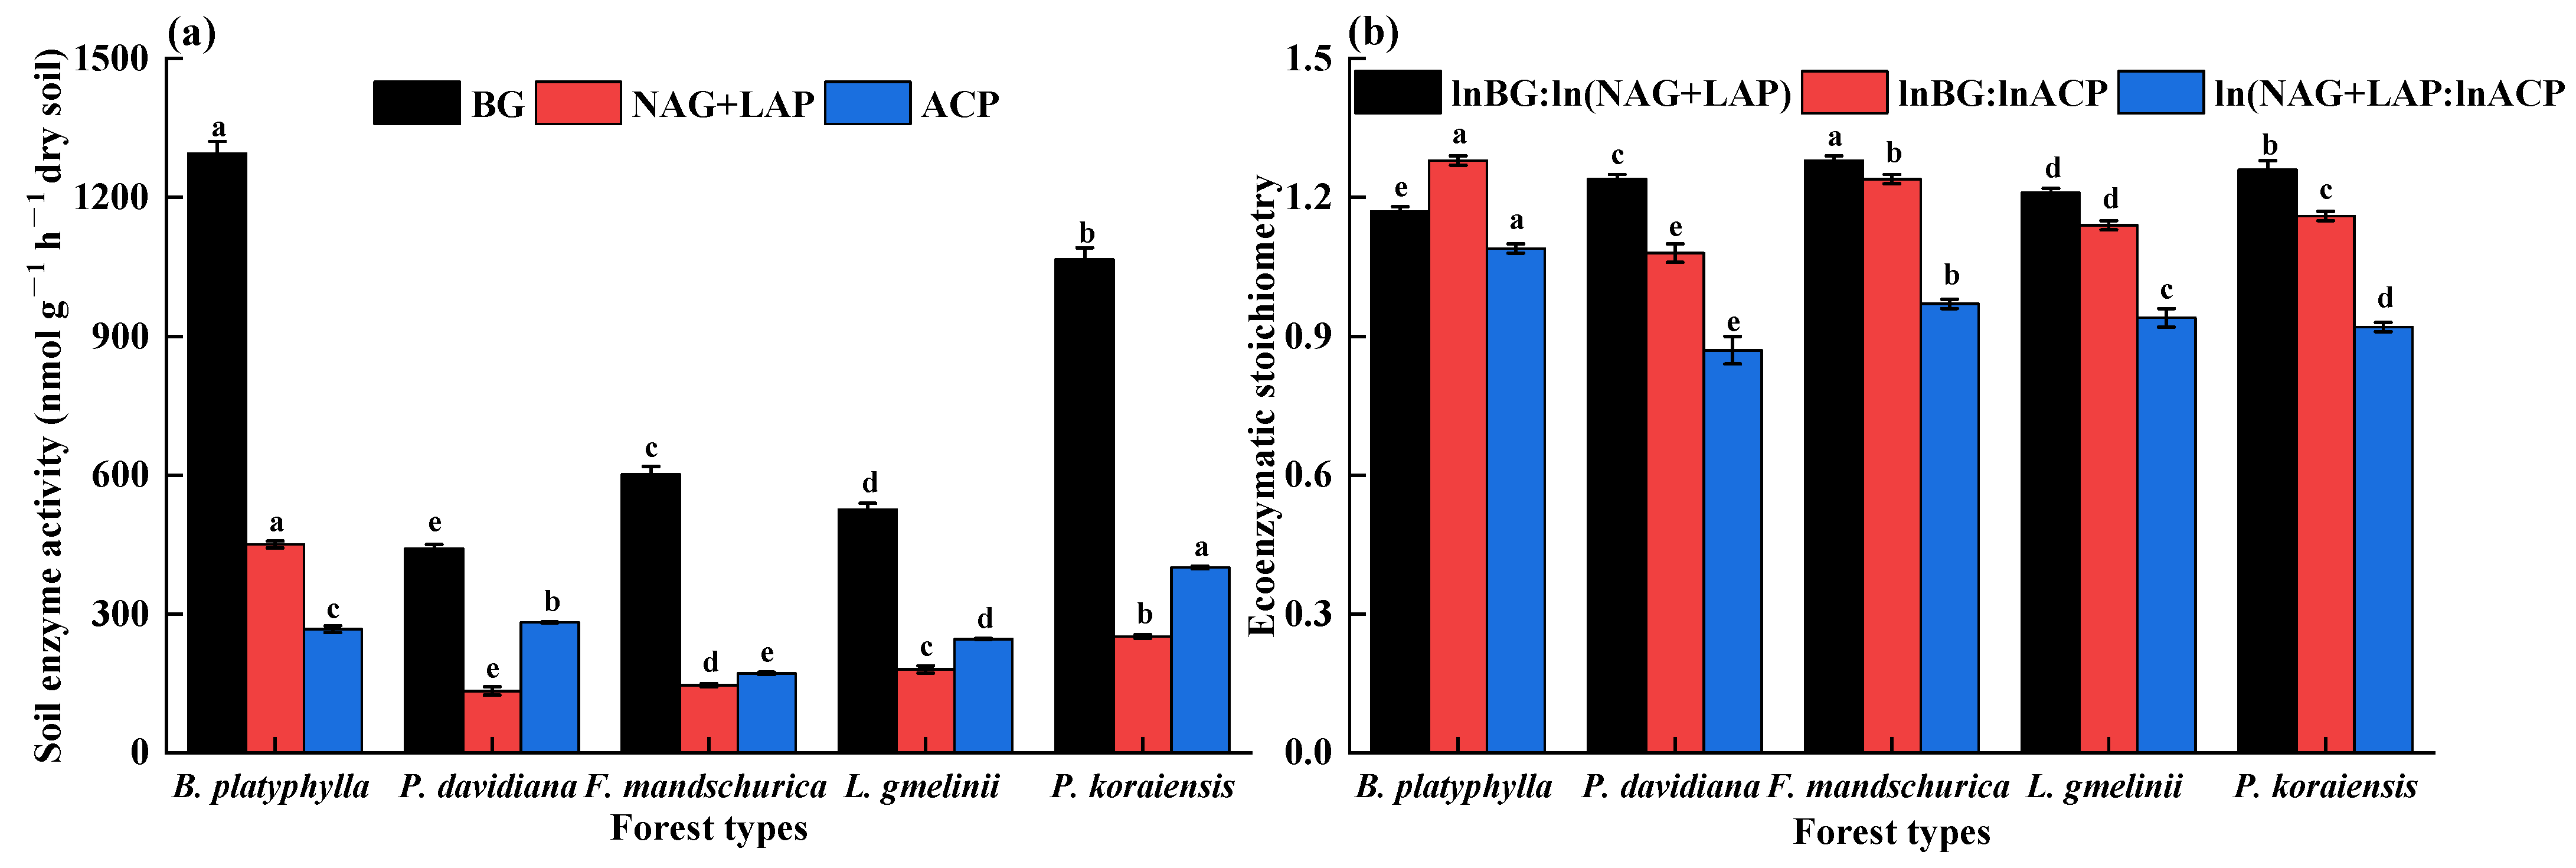
3.2. Soil Enzyme Activity and Stoichiometry

As illustrated in Figure 2, significant differences in soil enzyme activity and stoichiometry were observed among the five forest types (p < 0.05). The BG and (NAG + LAP) activities were the highest in B. platyphylla, but the lowest in P. davidiana. The ACP activity was ranked in the order of P. koraiensis > P. davidiana > B. platyphylla > L. gmelin > F. mandschurica (p < 0.05). The lnBG:ln(NAG + LAP) was significantly different among forest types, with the pattern of F. mandschurica > P. koraiensis > P. davidiana > L. gmelin > B. platyphylla (p < 0.05). The lnBG:lnACP and ln(NAG + LAP):lnACP were the highest in B. platyphylla, but the lowest in P. davidiana (p < 0.05).

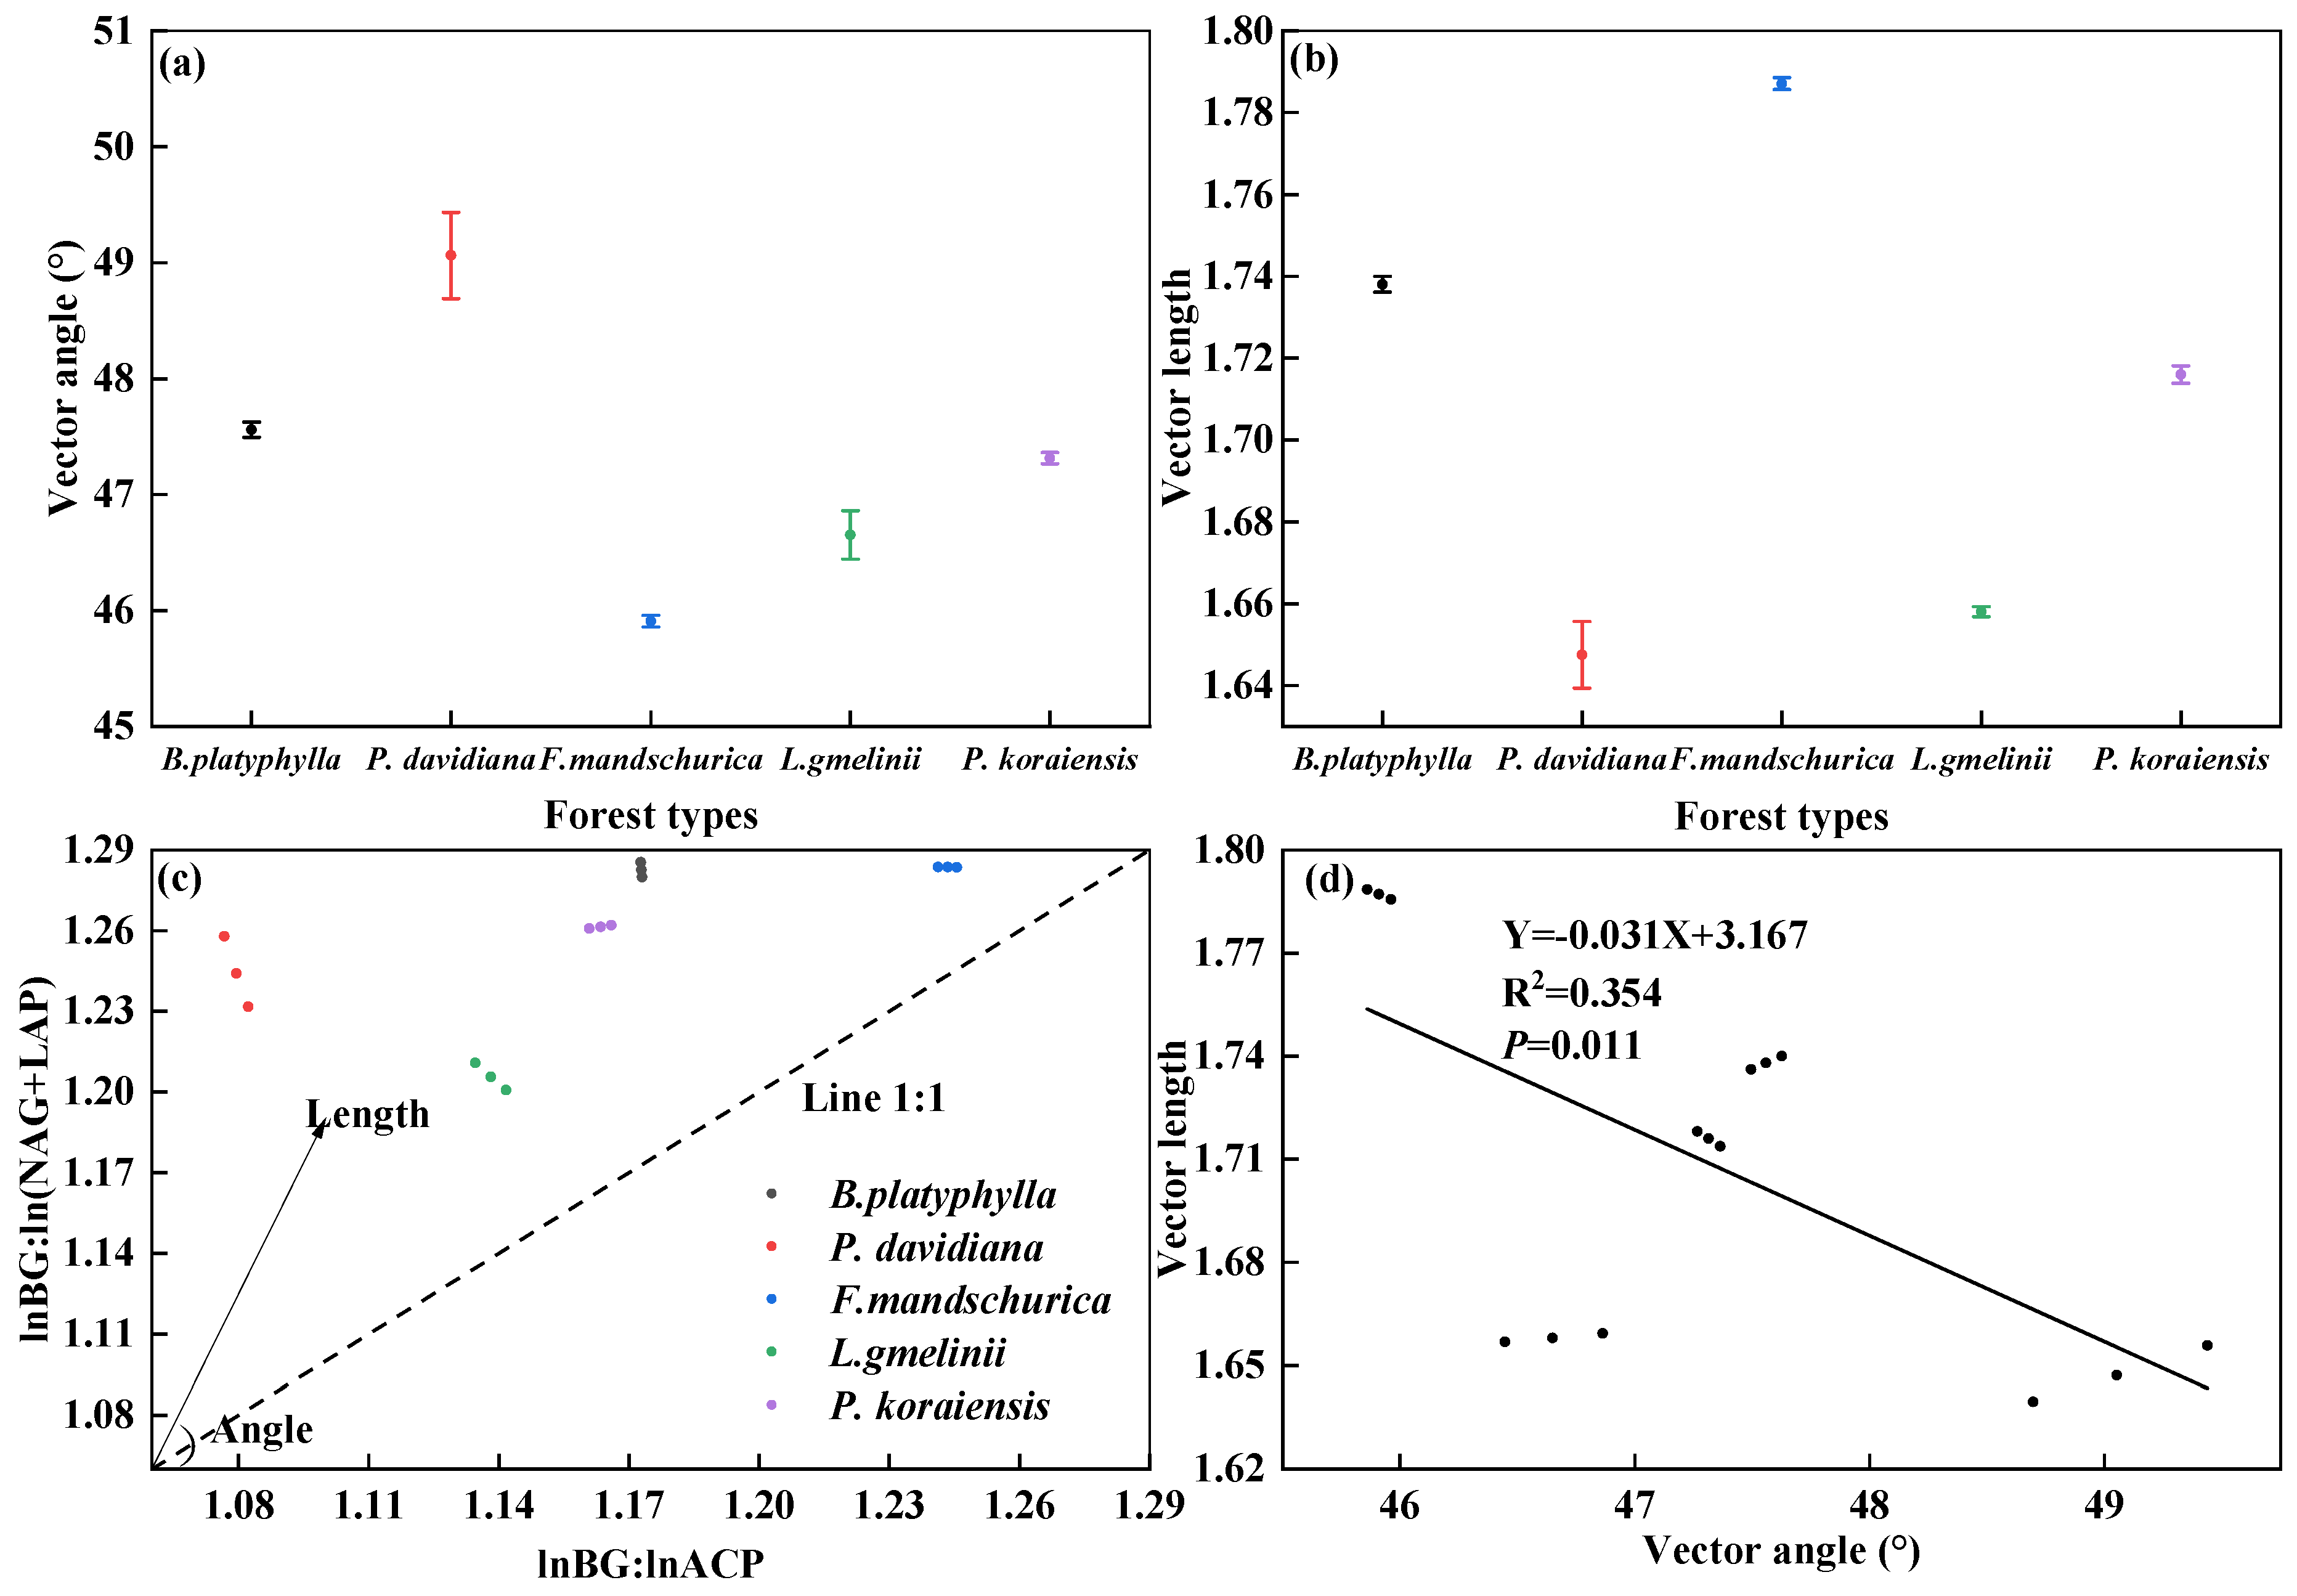
3.3. Microbial Nutrient Limitation

Significant differences in the soil enzymatic vector angles and lengths among five forest types were found (Figure 3) (p < 0.05). Soil enzymatic vector lengths in the five forest types were greater than one. The highest value was observed at F. mandschurica, followed by B. platyphylla, P. koraiensis, L. gmelinii, and P. davidiana. For all forest types, the vector angle was higher than 45°, suggesting that all forests were experiencing P limitation, although the degree of limitation varied significantly across the forest types. The severity of the microbial P limitation was ranked in the following order: P. davidiana > B. platyphylla > P. koraiensis > L. gmelinii > F. mandschurica (p < 0.05). Moreover, there was a significant linear negative correlation between vector length and vector angle (Figure 3) (p < 0.05).

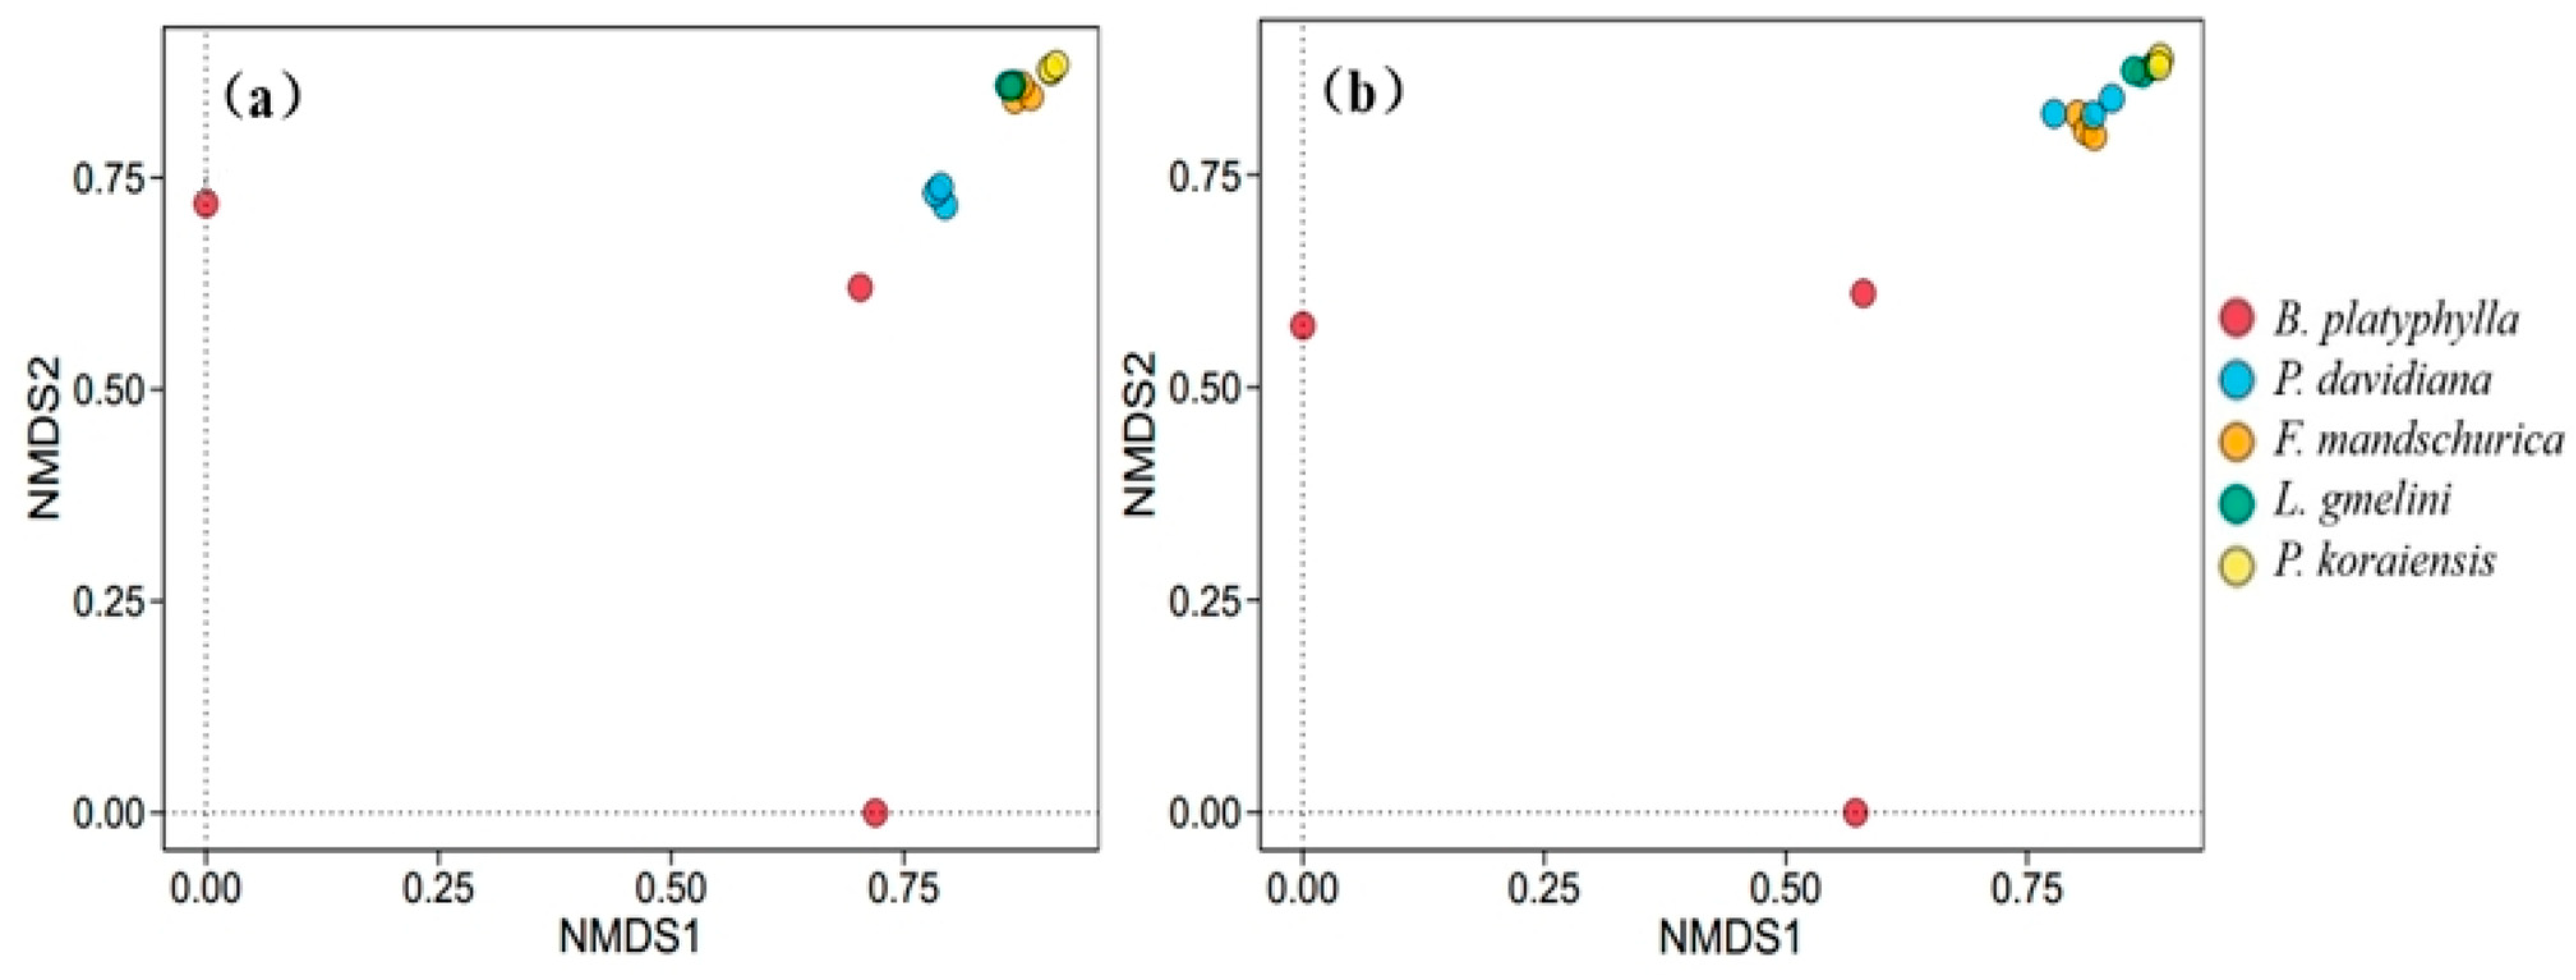
3.4. Soil Microbial Community Structure

The Shannon index describes the bacterial and fungal alpha diversity. The result revealed differences in soil microbial community diversity across various forest types (Table 5). The fungi-to-bacteria ratio was significantly different among five forest types, with L. gmelinii > F. mandschurica > B. platyphylla > P. koraiensis > P. davidiana > (p < 0.05). The NMDS results showed that soil bacterial and fungal communities were tightly clustered according to forest types (Figure 4). Variations in forest types led to changes in bacterial and fungal beta diversity. The dominant phyla of the bacterial community were Proteobacteria, Acidobacteriota, Actinobacteriota, and Verrucomicrobiota in soil across all the forest types; other taxa were present in low abundances (Figure 5a). The dominant phyla of the fungal community were Ascomycota, Basidiomycota, and Mucoromycota in soil across all the forest types (Figure 5b).

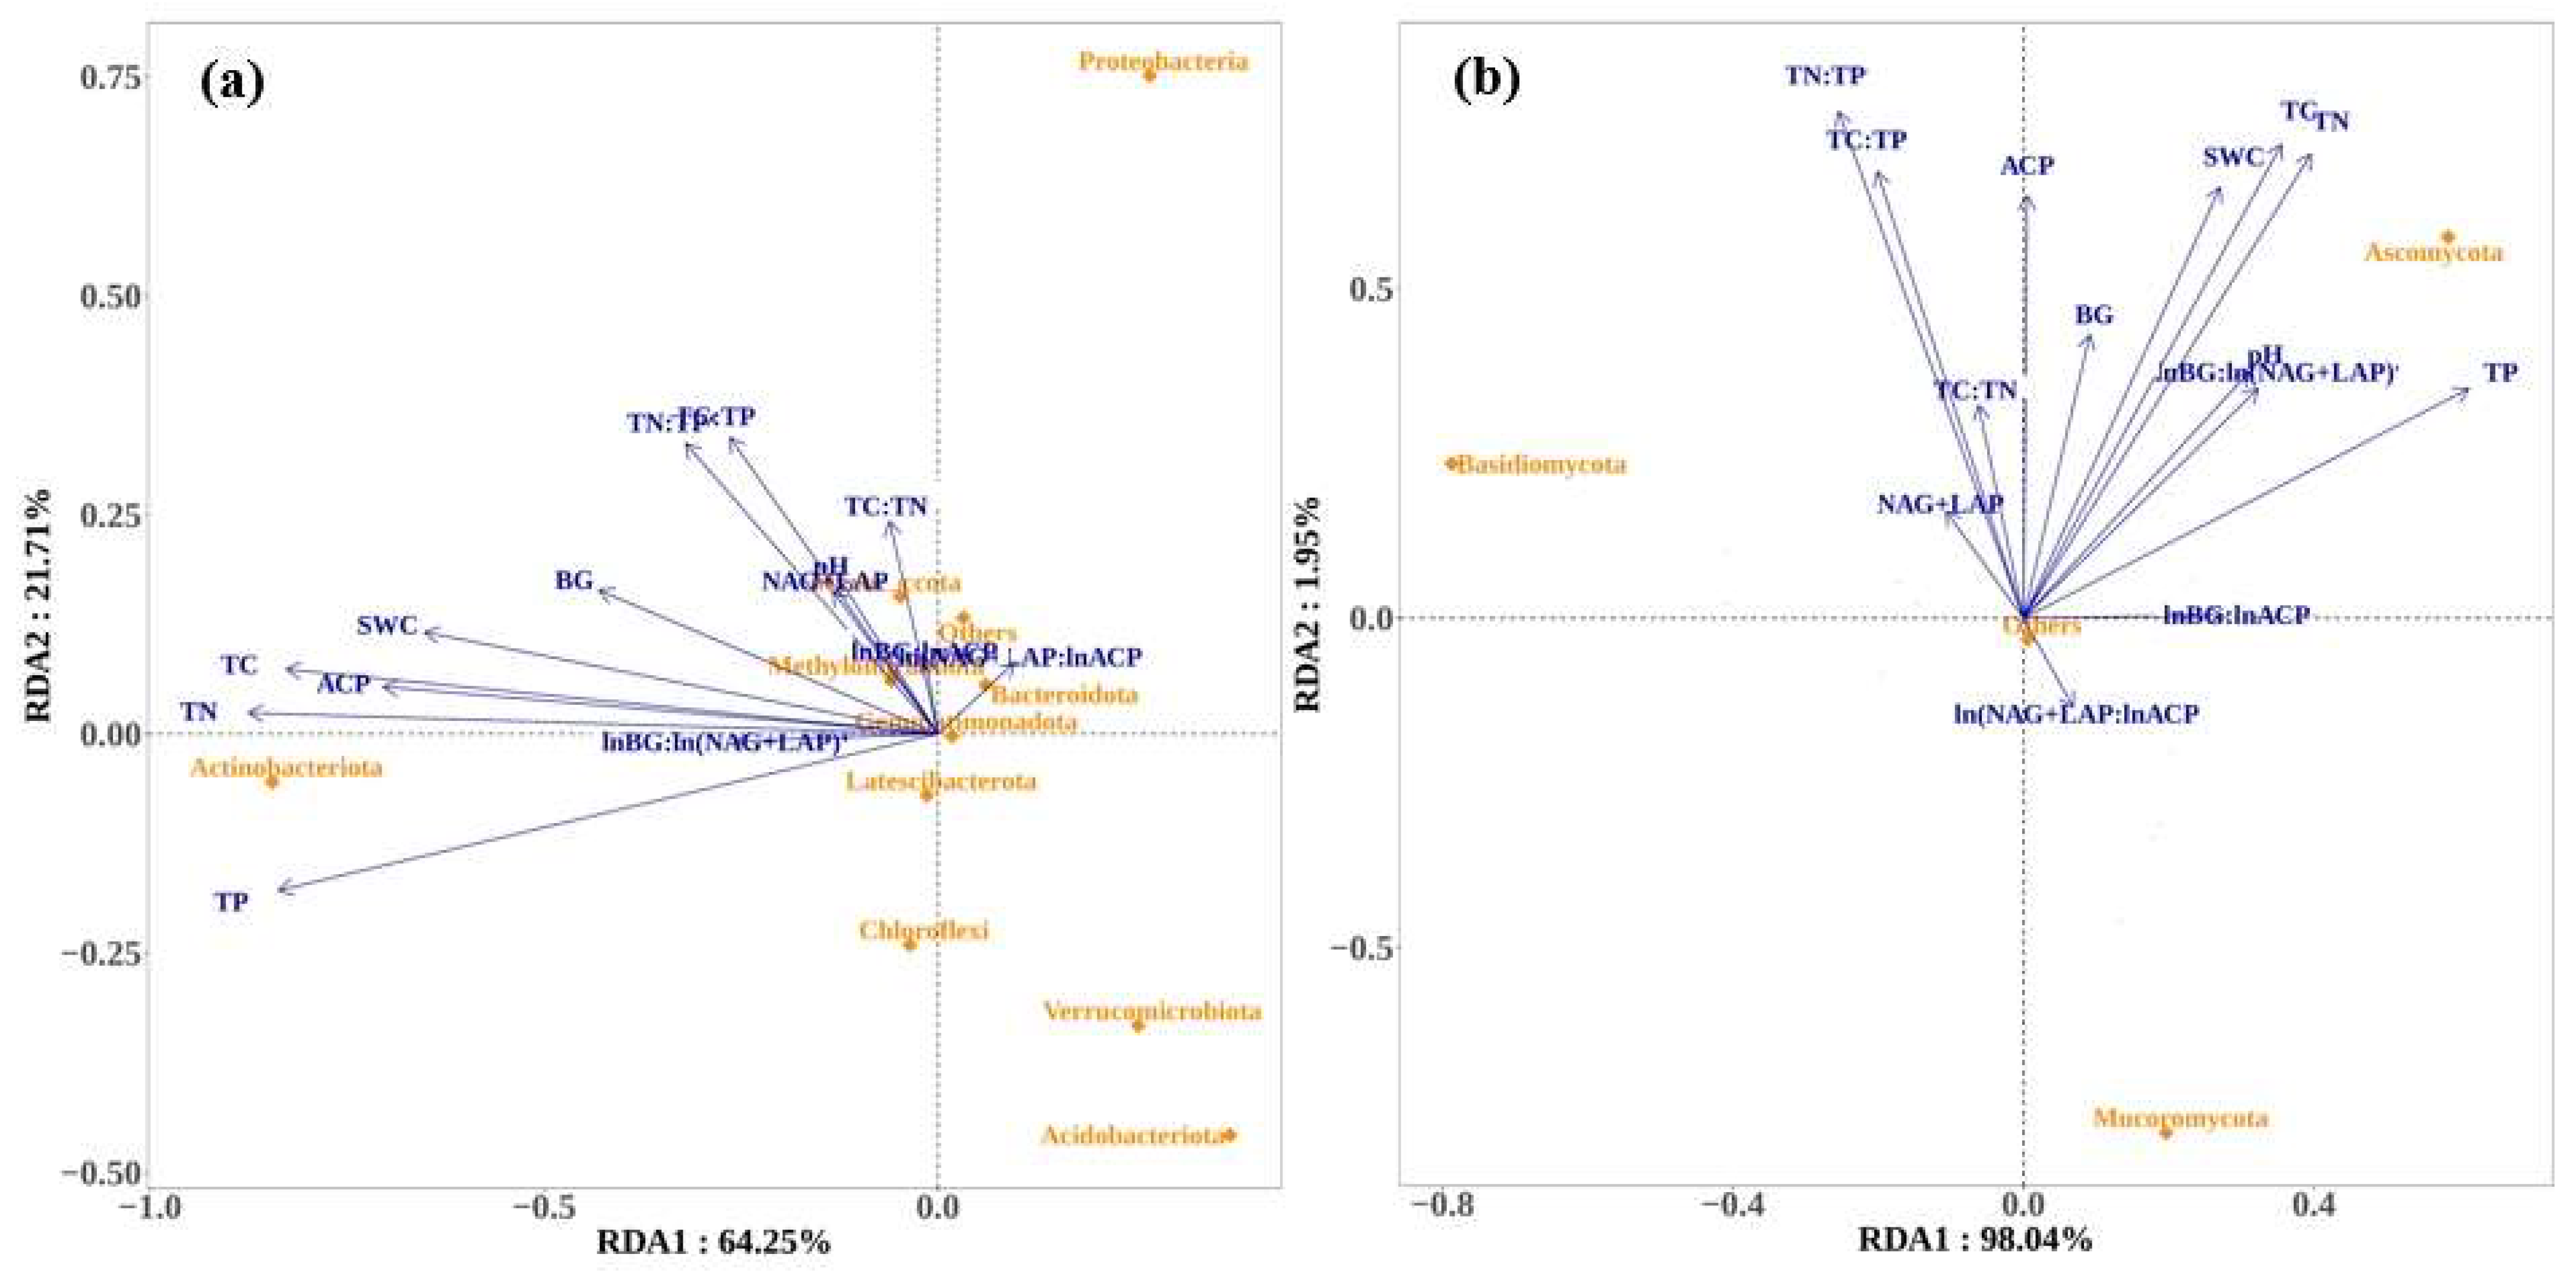
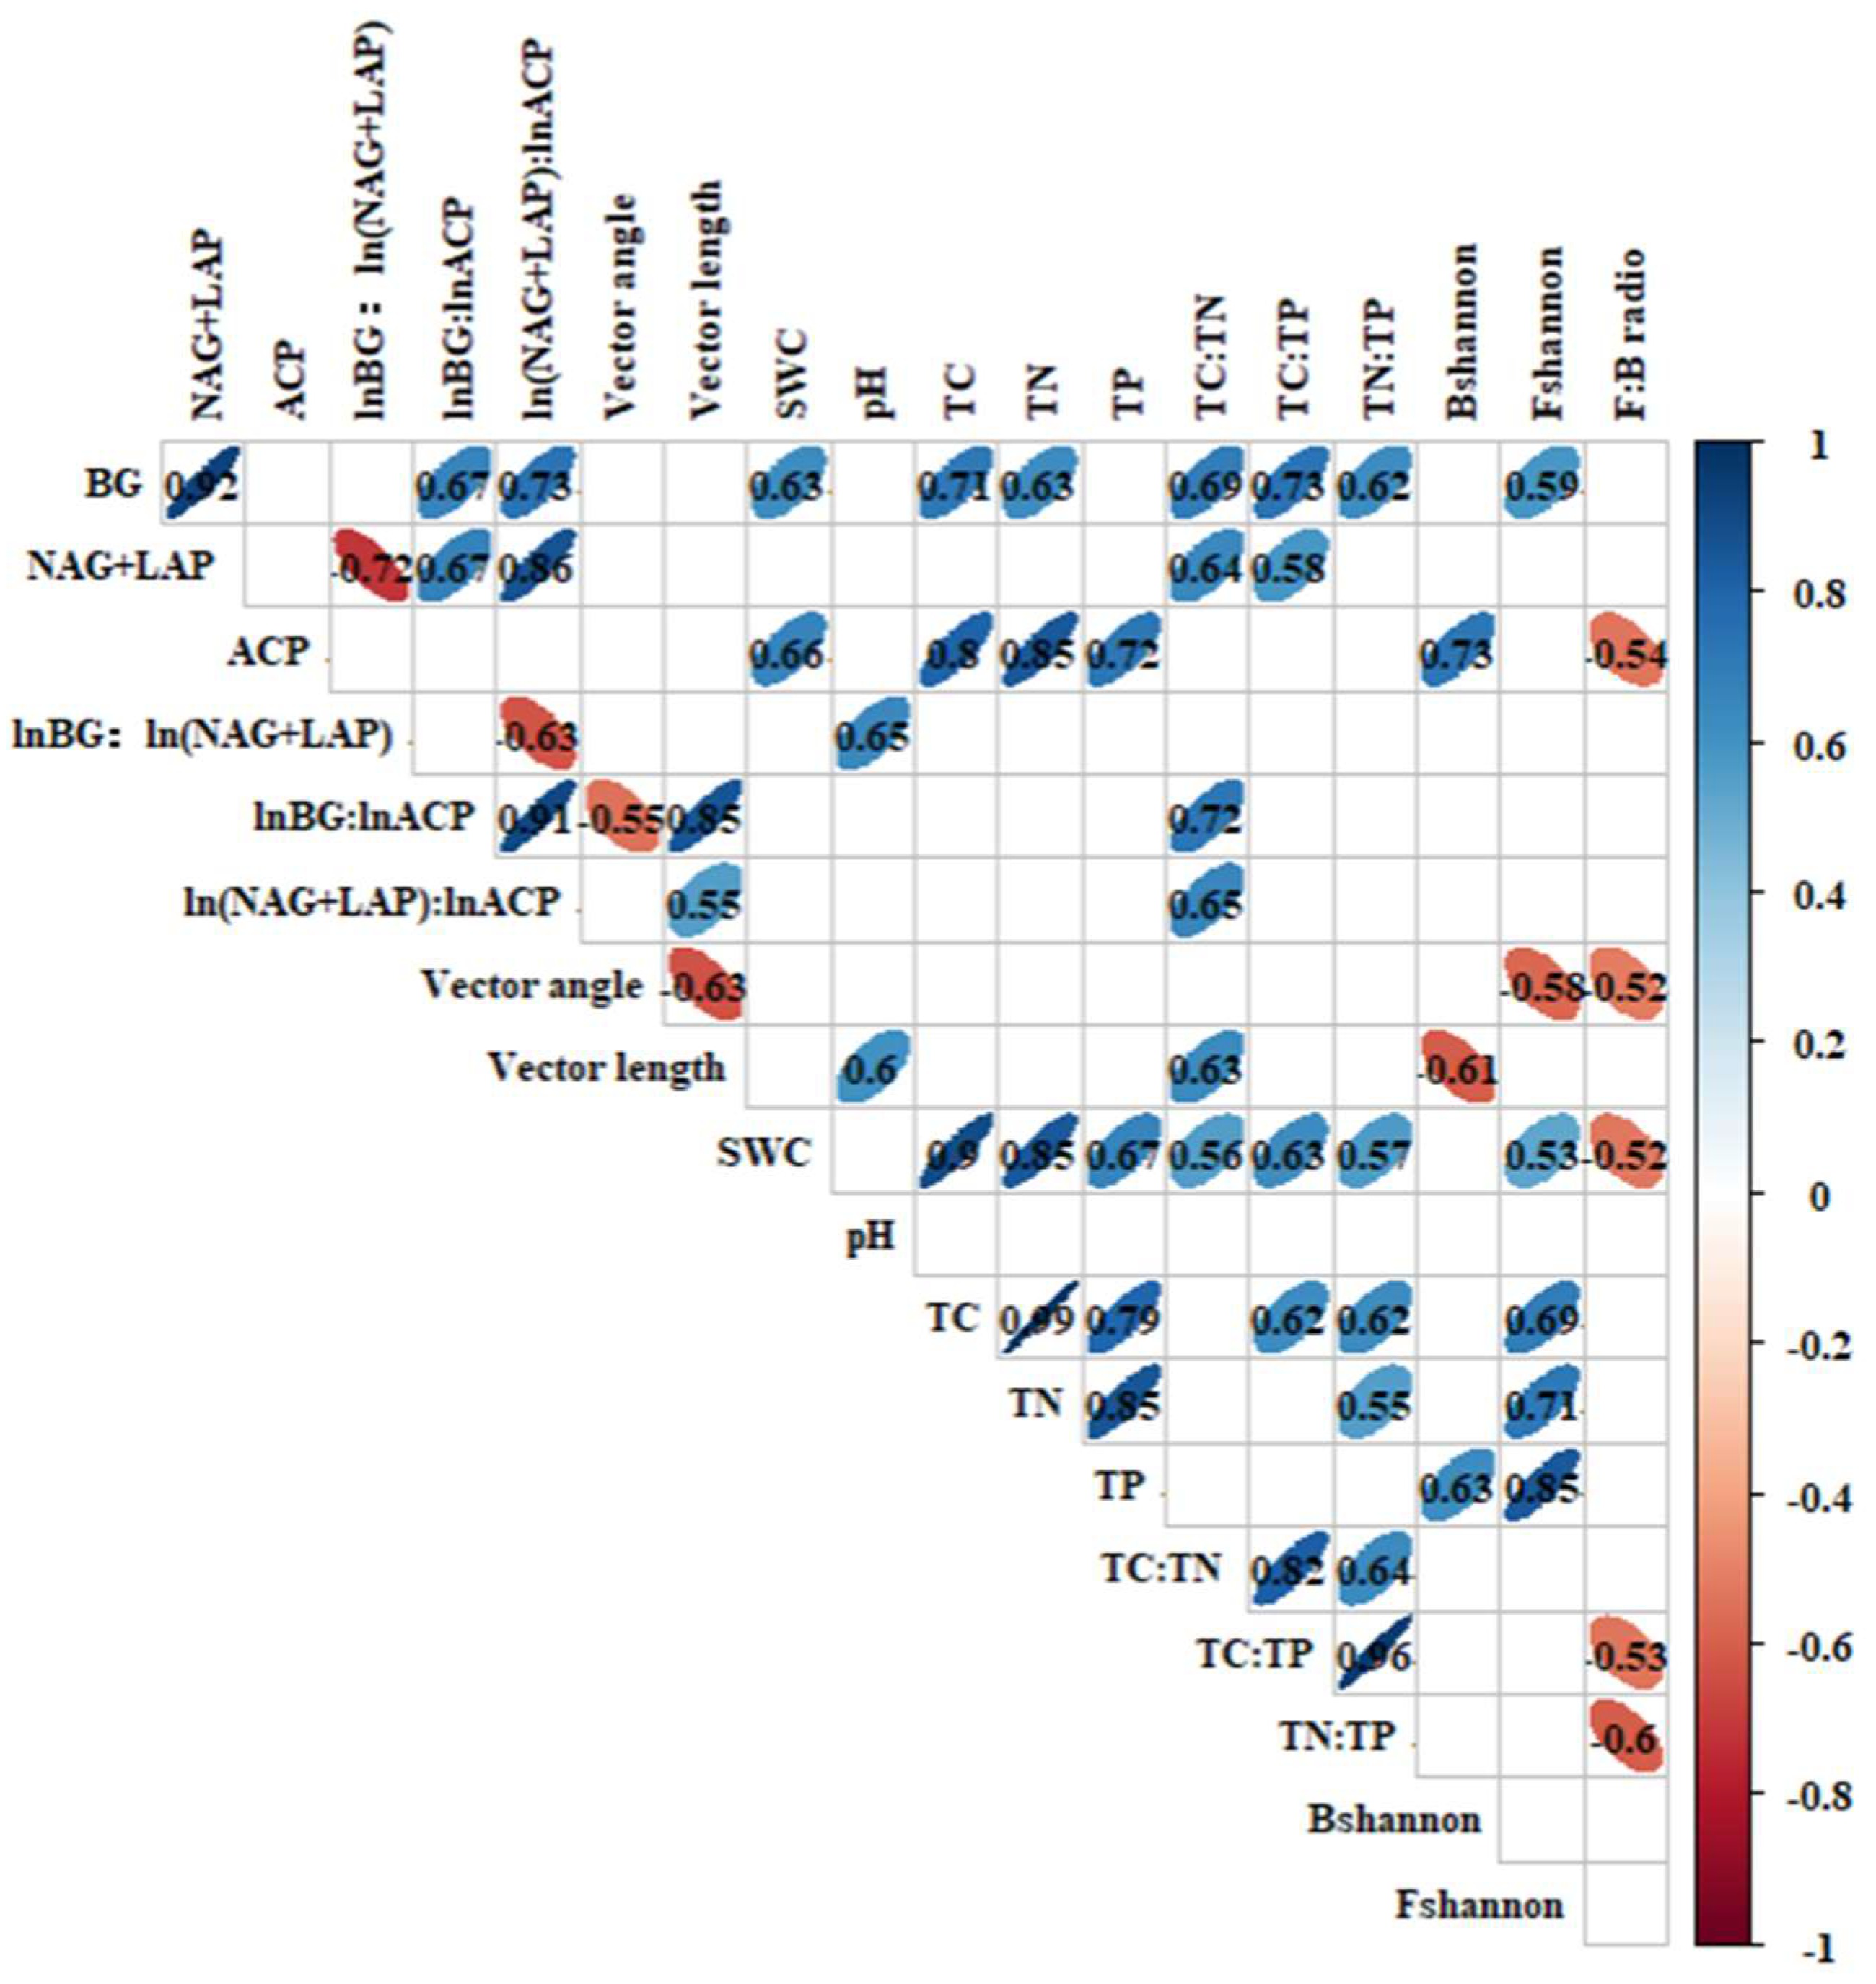
3.5. Relationship Among Soil Enzyme Activities, Microbial Nutrient Limitation, and Microbial Communities

Based on the results of RDA (Figure 6 and Table 6), the cumulative contribution of microbial community variances to soil properties accounted for 85.96% and 99.99% along the first two axes, respectively. The results of correlation analysis and eigenvalue calculations indicated that soil moisture, TC, TN, and TP contents, and ACP activity exhibited statistically significant associations with the composition of bacterial and fungal communities (p < 0.05). Soil lnBG:lnACP and ln(NAG + LAP):lnACP were closely associated with the composition of bacterial communities (p < 0.05). Soil TC:TP and TN:TP were strongly associated with the composition of fungal communities (p < 0.05). The correlation analysis showed that soil BG activity was positively correlated with SWC, the content of TC and TN, and the fungal Shannon index (Figure 7, p < 0.05). Soil ACP activity was significantly positively correlated with SWC, the content of TC, TN, and TP, and bacterial Shannon index but negatively correlated with the fungi-to-bacteria ratio (p < 0.01). Soil lnBG:ln(NAG + LAP) was positively correlated with pH (p < 0.01). Soil enzymatic vector angle was negatively correlated with the fugal Shannon index, the ratio of fungi to bacteria, and the abundance of Chloroflexi, Methylomirabilota, Latescibacterota, Ascomycota, and Mucoromycota, but positively correlated with the abundance of Basidiomycota. (p < 0.05). Vector length was significantly positively correlated with pH and the abundance of Myxococcota, but negatively correlated with bacterial Shannon index (p < 0.01) (Figure 7, Table 7).

4. Discussion

4.1. Impact of Forest Types on Soil Enzymatic Parameters and Microbial Nutrient Limitations

Soil enzymes can timely interpret the status of soil microbes and soil physicochemical properties, and have significant effects on mineral nutrient cycling and soil structure and function [37]. We found evidence to support our first hypothesis that forest types had a significant influence on soil enzyme activity and stoichiometry, and their variation patterns differed among forests. A reasonable explanation for these different results may come from the differences between litter input and the rate of decomposition, which can affect the quality and quantity of substrates for these soil enzymes. Furthermore, prior studies have indicated that alterations in root exudation rates, driven by diverse vegetation types and soil nutrient statuses, will affect soil enzyme activity and stoichiometric characteristics [20,38]. The positive relationships of soil enzyme activity and stoichiometry with soil nutrients confirmed that the quality of soil was crucial for the secretion of enzymes by microbes (Figure 6). Additionally, soil ln(BG):ln(NAG +LAP):ln(ACP) in all forest types was close to 1:1:1 in our study, which is in line with the global average C:N:P acquisition ratio [21]. This result supports the theory that the availability of substrates for microbial growth is comparable to soil C, N, and P repositories, and that resources limiting microbial growth are easily transferred among C, N, and P.
The relative investment of microbes in C, nutrient acquisition (vector length), and P and N acquisition (vector angle) was quantified throughout the entire decomposition process [39]. Partially, consistent with our second hypothesis, we found that the B. platyphylla, P. davidiana, F. mandschurica, L. gmelinii, and P. koraiensis (all vector angles > 45°) collectively indicated prevalent P limitation over N limitation (Figure 3). However, compared to other forest types, P. davidiana had a greater degree of P limitation. Our result reported that microbial growth in temperate forest soil was more susceptible to P limitation, and the degree of impact varies among different forest types. Moreover, it is noteworthy that the relatively lower N:P ratio observed in this study is speculated due to low P leaching losses and high N volatilization losses. When the forest soil has a P limitation, the decreased availability of P leads microbes to enhance the production of P-acquiring enzymes, leading to an enzyme C: N ratio greater than one. Additionally, the overall enzyme C:N ratio exceeded one and the enzyme N:P ratio was less than one, which supports our hypothesis that soil microbes were primarily limited by P in our study, even though P-acquiring enzyme activities also contributed C to microbes.

4.2. Impact of Forest Types on Soil Microbial Community

As a crucial part of the soil environment, soil microbes play an indispensable role in the biogeochemical cycle [22]. The investigation of soil microbial community structure and diversity enhances our comprehension of the intricate interplay among microbes, environment, and plants, especially for the interaction between soil microbial diversity and vegetation diversity [40]. Our results showed that soil microbial diversity and the F:B ratio varied significantly across the forest types (Table 5). Such differences in microbial community structure can be explained by the following reasons: first, the variations in vegetation composition can lead to variations in soil environmental factors, such as pH, soil moisture, and temperature, which in turn can significantly affect soil microbial community structure and diversity. We observed that soil moisture was correlated with fungal diversity and the F:B ratio, while soil bacterial diversity was correlated with pH (Table A1). This result indicated that soil microbial community structure and diversity are also directly and indirectly correlated with edaphic factors [7,41]. Second, vegetation type determines soil nutrient conditions and is also a vital factor in shaping soil microbial community structure. Prior investigations have indicated that changes in microbial communities are driven by soil organic matter and nutrient levels [42]. Similarly, our results also indicate that the content of TC, TN, and TP were positively correlated with bacterial and fungal diversity (Table 6).
In addition, Proteobacteria, Acidobacteriota, Actinobacteriota, and Verrucomicrobiota were the dominant bacterial phyla in our study, which agrees with previous findings [43,44]. These bacterial phyla are a ubiquitous and abundant group in many terrestrial ecosystems [45]. Meanwhile, Ascomycota, Basidiomycota, and Mucoromycota were the dominant soil fungal phyla. Our research showed that there was no significant effect of forest types on the dominant soil bacteria. However, the relative abundance of these soil bacterial and fungal phyla was significantly different among forest types (Figure 5). The correlation analysis showed that the abundance of microbes was significantly correlated with soil TP content (Table A2). Zhang et al. [46] also found the dominant bacterial phyla, including Proteobacteria, Acidobacteria, and Actinobacteria, were correlated with soil P concentration. Other researchers found a strong correlation between fungi and soil P in temperate forest ecosystems [47]. Consequently, clear spatial variations in soil microbial structure and diversity in the different forest ecosystems could be attributed primarily to the significant differences in physicochemical properties of the soils (e.g., soil moisture, pH, and soil nutrients).

4.3. Relationships between Soil Enzymatic Parameters, Microbial Nutrient Limitation, and Microbial Community

Soil enzymes are mainly synthesized and secreted by soil microbes and vegetation roots, providing valuable information on soil health and biological community functions [48,49]. As a consequence, soil enzyme activities are commonly linked to microbial activity and ecosystem processes, and are thought to be significantly correlated to microbial community composition [50]. Consistent with our third hypothesis, the RDA and Pearson correlation analysis were applied to identify that soil ACP activity had significant correlations with the microbial community composition, indicating that the microbial communities play vital roles in determining soil enzyme activities in the forest ecosystem (Figure 6 and Figure 7). Furthermore, soil ACP activity was strongly correlated with soil moisture and the content of TC, TN, and TP. These findings corroborate previous studies that observed the generation of soil ACP activity accelerated the decomposition of soil organic matter, changed the physical and chemical properties of soil, further changed the proliferation of soil microbes, and promoted the secretion of soil acid phosphatase by soil microbes [10,51].
The composition of soil microbial communities is influenced by soil C, N, and P nutrient limitations, and enzyme stoichiometry reflects the microbial demand for C, N, and P resources [52]. We observed the soil microbial community composition was notably associated with nutrient limitation. Specifically, there was a significant negative relationship between soil bacterial diversity and microbial C limitation (vector length), whereas fungal diversity had significant negative correlations with microbial P limitation (vector angle) (Table 4). These results may be from the difference in metabolic preferences among these microbial communities. Moreover, the abundance of bacteria was also strongly correlated with microbial C and P limitations. For instance, the abundance of Myxococcota was positively correlated with the C limitation, and the abundance of Chloroflexi, Methylomirabilota, and Latescibacterota was negatively correlated with the P limitation (Table 7). For fungi, the dominant phyla Ascomycota, Basidiomycota, and Mucoromycota were all significantly correlated with P limitation (Table 7). Collectively, these results suggested strong relationships between microbial community characteristics and nutrient limitations. Furthermore, there was a significant negative correlation between the microbial P limitation and microbial C limitation in this study (Figure 7). These results showed that with the increase in microbial P limitation, the decrease in C imitation was conducive to microbial utilization of labile carbonaceous compounds in soil [53,54].

4.4. Limitations

Plant species play a vital role in regulating soil microbial communities and biogeochemical cycling [34]. Our study demonstrated that forest types had significant impacts on soil microbial communities, enzyme activity, and stoichiometry. Notably, soil P has a stronger limiting effect on soil microbe growth than nitrogen among all forests in our study. Although our study strengthens the knowledge of plant species, soil, and microbes in forest ecosystems, there are also some several limitations in our study. For example, soil texture, litter, and roots are recognized to have profound effects on soil enzyme activity and resource limitation [12,55]. Specifically, plants differ in litter and root trails, which are the main sources of soil organic matter. The decomposing of plant residues in five forest types in our study can also affect soil enzyme activity and nutrient limitation. Meanwhile, previous studies have also shown that soil enzymes were also related to soil clay, silt, and sand percentage [56]. However, there was a lack of this type of information in our study. Given that these factors varied across forest types, this limits our comprehensive understanding of the mechanism of plant species affecting soil enzyme activities and microbial nutrient limitation. Thus, soil enzymatic activities and nutrient limitations involved in the decomposition of litter and root and soil texture factors should also be evaluated for further study in the future.

5. Conclusions

The results showed the differences in soil enzyme activities and microbial community among different temperate forest types. Furthermore, our results provided direct evidence to illustrate that the microbial P limitation rather than N limitation was identified based on the enzymatic stoichiometry of temperate forest types in northeastern China. However, the degree of microbial P limitation varied among different forest types. This indicated that the differences in vegetation composition and soil properties among different forest types can lead to variations in soil microbial community structure and function. These factors collectively affect the ability of microbes to acquire and utilize phosphorus, leading to differences in the degree of microbial phosphorus limitation in different forest types. Additionally, this research also clearly proved the strong correlation among soil microbial composition, enzyme activity, and microbial nutrient limitation. These results strengthen the understanding of the interaction among plant, soil, and microbe, and have important implications for temperate forest ecosystem management. Nonetheless, considering the complexity of soil nutrient cycling, further studies should be mindful of the long-term potential mechanisms of microbes to soil nutrient limitation under various plant compositions.

Author Contributions

Conceptualization, R.X.; experiment conception and design, R.X. and C.D.; investigation, R.X. and B.D.; data analysis, R.X. and Y.W.; funding acquisition, R.X. and B.D.; writing, R.X. All authors have read and agreed to the published version of the manuscript.

Funding

This work was funded by the Basic Scientific Research Fund of Heilongjiang Provincial Universities (Grant No. 2023-KYYWF-1946; Grant No. 2023-KYYWF-1947).

Data Availability Statement

The data that support the findings of this study are available from the corresponding author upon reasonable request.

Acknowledgments

The financial support mentioned in the Funding part is gratefully acknowledged. We are especially grateful to Li Dongmei and Xiao Yong for their help in the field experiment.

Conflicts of Interest

The authors disclose no competing interests.

Appendix A

Table A1. Pearson correlation analyses of the soil properties, soil microbial alpha diversity (Shannon diversity index), and fungi-to-bacteria ratio.
VariablesSWCpHSOCTNTPSOC/TNSOC/TPTN/TP
Bshannon0.332−0.471 *0.4120.488 *0.631 *−0.272−0.126−0.043
Fshannon0.531 *0.0170.693 **0.712 **0.850 **0.1500.0920.015
F:B ratio−0.512 *−0.209−0.423−0.398−0.101−0.245−0.529 *−0.604 *
Notes: ** significant at the 0.01 level; * significant at the 0.05 level.
Table A2. Pearson correlation analyses of the soil enzymatic parameters and the abundance of microbial communities.
Microbial CommunitySWCpHSOCTNTPSOC/TNSOC/TPTN/TP
Bacterial communitiesProteobacteria−0.2600.035−0.381−0.445−0.630 *0.1370.1720.164
Acidobacteriota−0.570 *−0.274−0.678 **−0.709 **−0.576 *−0.077−0.329−0.408
Actinobacteriota0.699 **0.1140.893 **0.948 **0.889 **0.0430.2960.377
Verrucomicrobiota−0.414−0.063−0.501−0.469−0.448−0.339−0.295−0.200
Chloroflexi−0.148−0.280−0.074−0.0180.345−0.289−0.511−0.574 *
Myxococcota0.4160.621 *0.3830.3420.1530.3640.4010.376
Methylomirabilota0.525 *0.1620.554 *0.519 *0.553 *0.4000.2630.131
Gemmatimonadota−0.355−0.199−0.508−0.477−0.022−0.429−0.761 **−0.855 **
Bacteroidota−0.294−0.006−0.388−0.506−0.593 *0.4990.2080.017
Latescibacterota0.013−0.1360.1640.1530.2540.1610.006−0.100
Fungal communitiesAscomycota0.3860.3850.4840.525 *0.704 **−0.018−0.114−0.156
Basidiomycota−0.259−0.316−0.347−0.391−0.640 *0.0820.2460.306
Mucoromycota−0.0840.095−0.0420.0040.395−0.227−0.544 *−0.641 **
Notes: ** significant at the 0.01 level; * significant at the 0.05 level.

References

  1. Zhang, S.; Yang, X.; Li, D.; Li, S.; Chen, Z.; Wu, J. A meta-analysis of understory plant removal impacts on soil properties in forest ecosystems. Geoderma 2022, 426, 116116. [Google Scholar] [CrossRef]
  2. Xu, M.; Li, W.; Wang, J.; Zhu, Y.; Feng, Y.; Yang, G.; Zhang, W.; Han, X. Soil ecoenzymatic stoichiometry reveals microbial phosphorus limitation after vegetation restoration on the loess plateau, china. Sci. Total Environ. 2022, 815, 152918. [Google Scholar] [CrossRef]
  3. Zheng, H.; Vesterdal, L.; Schmidt, I.K.; Rousk, J. Ecoenzymatic stoichiometry can reflect microbial resource limitation, substrate quality, or both in forest soils. Soil Biol. Biochem. 2022, 167, 108613. [Google Scholar] [CrossRef]
  4. Xu, H.; Qu, Q.; Li, G.; Liu, G.; Geissen, V.; Ritsema, C.J.; Xue, S. Impact of nitrogen addition on plant-soil-enzyme C–N–P stoichiometry and microbial nutrient limitation. Soil Biol. Biochem. 2022, 170, 108714. [Google Scholar] [CrossRef]
  5. Moorhead, D.L.; Sinsabaugh, R.L.; Hill, B.H.; Weintraub, M.N. Vector analysis of ecoenzyme activities reveal constraints on coupled C, N and P dynamics. Soil Biol. Biochem. 2016, 93, 1–7. [Google Scholar] [CrossRef]
  6. Weedon, J.T.; Kowalchuk, G.A.; Aerts, R.; van Hal, J.R.; van Logtestijn, R.K.S.P.; Taş, N.; Roling, W.F.; van Bodegom, P.M. Summer warming accelerates sub-arctic peatland nitrogen cycling without changing enzyme pools or microbial community structure. Glob. Change Biol. 2012, 18, 138–150. [Google Scholar] [CrossRef]
  7. Liu, D.; Liu, Y.; Li, J.; Mo, Q.; Tang, J.; Liu, W.; Batyrbek, M.; Liu, T.; Zhang, X.; Han, Q. Shaping the succession patterns of different soil nutrients, enzyme stoichiometry, and microbial communities through rotation systems. Catena 2024, 236, 107740. [Google Scholar] [CrossRef]
  8. Stone, M.M.; DeForest, J.L.; Plante, A.F. Changes in extracellular enzyme activity and microbial community structure with soil depth at the luquillo critical zone observatory. Soil Biol. Biochem. 2014, 75, 237–247. [Google Scholar] [CrossRef]
  9. Curtright, A.J.; Tiemann, L.K. Intercropping increases soil extracellular enzyme activity: A meta-analysis. Agric. Ecosyst. Environ. 2021, 319, 107489. [Google Scholar] [CrossRef]
  10. Wang, L.; Pang, X.; Li, N.; Qi, K.; Huang, J.; Yin, C. Effects of vegetation type, fine and coarse roots on soil microbial communities and enzyme activities in eastern Tibetan Plateau. Catena 2020, 194, 104694. [Google Scholar] [CrossRef]
  11. Pausch, J.; Kuzyakov, Y. Carbon input by roots into the soil: Quantification of rhizodeposition from root to ecosystem scale. Glob. Change Biol. 2017, 24, 1–12. [Google Scholar] [CrossRef]
  12. Ai, L.; Wu, F.; Fan, X.; Yang, Y.; Zhang, Y.; Zheng, X.; Zhu, J.; Ni, X. Different effects of litter and root inputs on soil enzyme activities in terrestrial ecosystems. Appl. Soil Ecol. 2023, 183, 104764. [Google Scholar] [CrossRef]
  13. Zheng, H.; Liu, Y.; Zhang, J.; Chen, Y.; Yang, L.; Li, H.; Wang, L. Factors influencing soil enzyme activity in China’s forest ecosystems. Plant Ecol. 2017, 219, 31–44. [Google Scholar] [CrossRef]
  14. Brockett, B.F.T.; Prescott, C.E.; Grayston, S.J. Soil moisture is the major factor influencing microbial community structure and enzyme activities across seven biogeoclimatic zones in western canada. Soil Biol. Biochem. 2012, 44, 9–20. [Google Scholar] [CrossRef]
  15. Adamczyk, B.; Kilpeläinen, P.; Kitunen, V.; Smolander, A. Potential activities of enzymes involved in N, C, P and S cycling in boreal forest soil under different tree species. Pedobiologia 2014, 57, 97–102. [Google Scholar] [CrossRef]
  16. Avazpoor, Z.; Moradi, M.; Basiri, R.; Mirzaei, J.; Taghizadeh-Mehrjardi, R.; Kerry, R. Soil enzyme activity variations in riparian forests in relation to plant species and soil depth. Arab. J. Geosci. 2019, 12, 708. [Google Scholar] [CrossRef]
  17. Liu, G.; Wang, H.; Yan, G.; Wang, M.; Jiang, S.; Wang, X.; Xue, J.; Xu, M.; Xing, Y.; Wang, Q. Soil enzyme activities and microbial nutrient limitation during the secondary succession of boreal forests. Catena 2023, 230, 107268. [Google Scholar] [CrossRef]
  18. Waring, B.G.; Weintraub, S.R.; Sinsabaugh, R.L. Ecoenzymatic stoichiometry of microbial nutrient acquisition in tropical soils. Biogeochemistry 2014, 117, 101–113. [Google Scholar] [CrossRef]
  19. Qi, D.; Feng, F.; Lu, C.; Fu, Y. C:N:P stoichiometry of different soil components after the transition of temperate primary coniferous and broad-leaved mixed forests to secondary forests. Soil Tillage Res. 2022, 216, 105260. [Google Scholar] [CrossRef]
  20. Li, Y.; Zhang, J.; Qiu, Q.; Zhou, Y.; You, W. Changes in soil properties and enzyme stoichiometry in three different forest types changed to tea plantations. Forests 2023, 14, 2043. [Google Scholar] [CrossRef]
  21. Sinsabaugh, R.L.; Hill, B.H.; Follstad Shah, J.J. Ecoenzymatic stoichiometry of microbial organic nutrient acquisition in soil and sediment. Nature 2009, 462, 795–798. [Google Scholar] [CrossRef]
  22. Li, Q.; Liu, Y.; Gu, Y.; Guo, L.; Huang, Y.; Zhang, J.; Xu, Z.; Tan, B.; Zhang, L.; Chen, L.; et al. Ecoenzymatic stoichiometry and microbial nutrient limitations in rhizosphere soil along the hailuogou glacier forefield chronosequence. Sci. Total Environ. 2020, 704, 135413. [Google Scholar] [CrossRef]
  23. Xiao, H.; Rong, Y.; Li, P.; Liu, Y. Soil moisture drives the response of soil microbial nutrient limitation to N and P additions in an inner mongolian meadow steppe. Eur. J. Soil Biol. 2024, 120, 103601. [Google Scholar] [CrossRef]
  24. Shen, F.; Liu, N.; Shan, C.; Ji, L.; Wang, M.; Wang, Y.; Yang, L. Soil extracellular enzyme stoichiometry reveals the increased p limitation of microbial metabolism after the mixed cultivation of Korean pine and manchurian walnut in northeast china. Eur. J. Soil Biol. 2023, 118, 103539. [Google Scholar] [CrossRef]
  25. Cui, Y.; Bing, H.; Fang, L.; Jiang, M.; Shen, G.; Yu, J.; Wang, X.; Zhu, H.; Wu, Y.; Zhang, X. Extracellular enzyme stoichiometry reveals the carbon and phosphorus limitations of microbial metabolisms in the rhizosphere and bulk soils in alpine ecosystems. Plant Soil 2021, 458, 7–20. [Google Scholar] [CrossRef]
  26. He, Q.; Wu, Y.; Bing, H.; Zhou, J.; Wang, J. Vegetation type rather than climate modulates the variation in soil enzyme activities and stoichiometry in subalpine forests in the eastern tibetan plateau. Geoderma 2020, 374, 114424. [Google Scholar] [CrossRef]
  27. Yan, B.; Wang, X.; Sun, Y.; Fan, B.; Shi, L.; Liu, G. Vegetation rehabilitation increases soil enzyme activities in degraded land via carbon supply and nitrogen retention. Eur. J. Soil Biol. 2020, 98, 103186. [Google Scholar] [CrossRef]
  28. Zhu, Y.; Zhao, B.; Zhu, Z.; Jia, B.; Xu, W.; Liu, M.; Gao, L.; Gregoire, T.G. The effects of crop tree thinning intensity on the ability of dominant tree species to sequester carbon in a temperate deciduous mixed forest, northeastern china. For. Ecol. Manag. 2022, 505, 119893. [Google Scholar] [CrossRef]
  29. Lin, S.; Fan, C.; Wang, J.; Zhang, C.; Zhao, X.; von Gadow, K. Chronic anthropogenic disturbance mediates the biodiversity-productivity relationship across stand ages in a large temperate forest region. J. Appl. Ecol. 2024, 61, 502–512. [Google Scholar] [CrossRef]
  30. Yuan, X.; Niu, D.; Gherardi, L.A.; Liu, Y.; Wang, Y.; Elser, J.J.; Fu, H. Linkages of stoichiometric imbalances to soil microbial respiration with increasing nitrogen addition: Evidence from a long-term grassland experiment. Soil Biol. Biochem. 2019, 138, 107580. [Google Scholar] [CrossRef]
  31. Zhong, Z.; Li, W.; Lu, X.; Gu, Y.; Wu, S.; Shen, Z.; Han, X.; Yang, G.; Ren, C. Adaptive pathways of soil microorganisms to stoichiometric imbalances regulate microbial respiration following afforestation in the loess plateau, China. Soil Biol. Biochem. 2020, 151, 108048. [Google Scholar] [CrossRef]
  32. Verchot, L.; Borelli, T. Application of -nitrophenol (NP) enzyme assays in degraded tropical soils. Soil Biol. Biochem. 2005, 37, 625–633. [Google Scholar] [CrossRef]
  33. Zhong, Z.; Zhang, X.; Wang, X.; Fu, S.; Wu, S.; Lu, X.; Ren, C.; Han, X.; Yang, G. Soil bacteria and fungi respond differently to plant diversity and plant family composition during the secondary succession of abandoned farmland on the loess plateau, China. Plant Soil 2020, 448, 183–200. [Google Scholar] [CrossRef]
  34. Xiao, R.H.; Man, X.L.; Duan, B.X.; Cai, T.J.; Ge, Z.X.; Li, X.F.; Vesala, T. Changes in soil bacterial communities and nitrogen mineralization with understory vegetation in boreal larch forests. Soil Biol. Biochem. 2022, 166, 108572. [Google Scholar] [CrossRef]
  35. Ye, Z.; Wang, J.; Li, J.; Zhang, C.; Liu, G.; Dong, Q. Ecoenzymatic stoichiometry reflects the regulation of microbial carbon and nitrogen limitation on soil nitrogen cycling potential in arid agriculture ecosystems. J. Soils Sediments 2022, 22, 1228–1241. [Google Scholar] [CrossRef]
  36. Chen, H.; Li, D.; Xiao, K.; Wang, K.; Treseder, K. Soil microbial processes and resource limitation in karst and non-karst forests. Funct. Ecol. 2018, 32, 1400–1409. [Google Scholar] [CrossRef]
  37. Xie, X.; Pu, L.; Wang, Q.; Zhu, M.; Xu, Y.; Zhang, M. Response of soil physicochemical properties and enzyme activities to long-term reclamation of coastal saline soil, eastern China. Sci. Total Environ. 2017, 607–608, 1419–1427. [Google Scholar] [CrossRef]
  38. Sun, L.; Kominami, Y.; Yoshimura, K.; Kitayama, K. Root-exudate flux variations among four co-existing canopy species in a temperate forest, Japan. Ecol. Res. 2017, 32, 331–339. [Google Scholar] [CrossRef]
  39. Yang, L.; Gu, J.; Yang, Y.; Yang, Y.; Shan, C.; Shen, F. The effects of postfire regeneration patterns on soil microbial metabolic limitation based on eco-enzyme stoichiometry in the boreal forest of China. For. Ecol. Manag. 2024, 568, 122129. [Google Scholar] [CrossRef]
  40. Bradley, J.A.; Singarayer, J.S.; Anesio, A.M. Microbial community dynamics in the forefield of glaciers. Proc. R. Soc. B Biol. Sci. 2014, 281, 20140882. [Google Scholar] [CrossRef]
  41. Wang, X.; Zhang, Z.; Yu, Z.; Shen, G.; Cheng, H.; Tao, S. Composition and diversity of soil microbial communities in the alpine wetland and alpine forest ecosystems on the Tibetan Plateau. Sci. Total Environ. 2020, 747, 141358. [Google Scholar] [CrossRef]
  42. Liu, T.; Wu, X.; Li, H.; Alharbi, H.; Wang, J.; Dang, P.; Chen, X.; Kuzyakov, Y.; Yan, W. Soil organic matter, nitrogen and pH driven change in bacterial community following forest conversion. For. Ecol. Manag. 2020, 477, 118473. [Google Scholar] [CrossRef]
  43. Zhang, P.; Guan, P.; Hao, C.; Yang, J.; Xie, Z.; Wu, D. Changes in assembly processes of soil microbial communities in forest-to-cropland conversion in changbai mountains, northeastern China. Sci. Total Environ. 2022, 818, 151738. [Google Scholar] [CrossRef]
  44. Wang, J.; Liu, G.; Zhang, C.; Wang, G.; Fang, L.; Cui, Y. Higher temporal turnover of soil fungi than bacteria during long-term secondary succession in a semiarid abandoned farmland. Soil Tillage Res. 2019, 194, 104305. [Google Scholar] [CrossRef]
  45. Ranjan, K.; Paula, F.S.; Mueller, R.C.; Jesus, E.d.C.; Cenciani, K.; Bohannan, B.J.M.; Nüsslein, K.; Rodrigues, J.L.M. Forest-to-pasture conversion increases the diversity of the phylum verrucomicrobia in amazon rainforest soils. Front. Microbiol. 2015, 6, 779. [Google Scholar] [CrossRef]
  46. Zhang, Z.; Luo, R.; Liu, Q.; Qiang, W.; Liang, J.; Hou, E.; Zhao, C.; Pang, X. Linking soil phosphorus fractions to abiotic factors and the microbial community during subalpine secondary succession: Implications for soil phosphorus availability. Catena 2023, 233, 107501. [Google Scholar] [CrossRef]
  47. Mason, L.M.; Eagar, A.; Patel, P.; Blackwood, C.B.; DeForest, J.L. Potential microbial bioindicators of phosphorus mining in a temperate deciduous forest. J. Appl. Microbiol. 2020, 130, 109–122. [Google Scholar] [CrossRef]
  48. Yang, B.; Qi, K.; Bhusal, D.R.; Huang, J.; Chen, W.; Wu, Q.; Hussain, A.; Pang, X. Soil microbial community and enzymatic activity in soil particle-size fractions of spruce plantation and secondary birch forest. Eur. J. Soil Biol. 2020, 99, 103196. [Google Scholar] [CrossRef]
  49. Duan, C.; Fang, L.; Yang, C.; Chen, W.; Cui, Y.; Li, S. Reveal the response of enzyme activities to heavy metals through in situ zymography. Ecotoxicol. Environ. Saf. 2018, 156, 106–115. [Google Scholar]
  50. Liu, C.; Zhou, Y.; Qin, H.; Liang, C.; Shao, S.; Fuhrmann, J.J.; Chen, J.; Xu, Q. Moso bamboo invasion has contrasting effects on soil bacterial and fungal abundances, co-occurrence networks and their associations with enzyme activities in three broadleaved forests across subtropical china. For. Ecol. Manag. 2021, 498, 119549. [Google Scholar]
  51. Fu, Z.; Chen, Q.; Lei, P.; Xiang, W.; Ouyang, S.; Chen, L. Soil fungal communities and enzyme activities along local tree species diversity gradient in subtropical evergreen forest. Forests 2021, 12, 1321. [Google Scholar] [CrossRef]
  52. Li, H.; Tian, H.; Wang, Z.; Liu, C.; Nurzhan, A.; Megharaj, M.; He, W. Potential effect of warming on soil microbial nutrient limitations as determined by enzymatic stoichiometry in the farmland from different climate zones. Sci. Total Environ. 2022, 802, 149657. [Google Scholar] [CrossRef]
  53. Cui, Y.; Zhang, Y.; Duan, C.; Wang, X.; Zhang, X.; Ju, W.; Chen, H.; Yue, S.; Wang, Y.; Li, S.; et al. Ecoenzymatic stoichiometry reveals microbial phosphorus limitation decreases the nitrogen cycling potential of soils in semi-arid agricultural ecosystems. Soil Tillage Res. 2020, 197, 104463. [Google Scholar] [CrossRef]
  54. Cui, J.; Zhang, S.; Wang, X.; Xu, X.; Ai, C.; Liang, G.; Zhu, P.; Zhou, W. Enzymatic stoichiometry reveals phosphorus limitation-induced changes in the soil bacterial communities and element cycling: Evidence from a long-term field experiment. Geoderma 2022, 426, 116124. [Google Scholar] [CrossRef]
  55. Wu, L.; Zou, B.; Wang, S.; Zhou, L.; Zheng, Y.; Huang, Z.; He, J.-Z. Effects of multispecies restoration on soil extracellular enzyme activity stoichiometry in pinus massoniana plantations of subtropical china. Soil Biol. Biochem. 2023, 178, 108967. [Google Scholar] [CrossRef]
  56. Feyissa, A.; Gurmesa, G.A.; Yang, F.; Long, C.; Zhang, Q.; Cheng, X. Soil enzyme activity and stoichiometry in secondary grasslands along a climatic gradient of subtropical China. Sci. Total Environ. 2022, 825, 154019. [Google Scholar] [CrossRef]
Figure 1. Representation of the study site.
Forests 15 01815 g001
Figure 2. Soil enzyme activity (a) and stoichiometry (b) in soil profile under different five forest types. Distinct lowercase letters indicate statistically significant differences among forest types (p < 0.05).
Forests 15 01815 g002
Figure 3. The variation in vector angle (a) and length (b) with the forest types; Enzymatic stoichiometry of the relative proportions of C-to-N acquisition versus C-to-P acquisition (c); Linear regression analysis of vector angle and length (d).
Forests 15 01815 g003
Figure 4. Non-metric multi-dimensional scaling analysis (NMDS) of soil bacterial (a) and fungal (b) beta diversities, based on the Bray–Curtis distances among different forest types.
Forests 15 01815 g004
Figure 5. Relative abundances of soil bacterial (a) and fungal (b) communities at the phylum level. The groups with relative abundances higher than 1% are shown, while those with less than 1% relative abundance are integrated into “other”.
Forests 15 01815 g005
Figure 6. RDA of the abundant bacterial (a) and fungal (b) communities at the phylum level and soil properties for the samples from five forest types.
Forests 15 01815 g006
Figure 7. Correlation of the soil enzymatic parameters, soil properties, soil microbial alpha diversity (Shannon diversity index), and fungi-to-bacteria ratio in temperate forest ecosystem. Only significant correlations (p < 0.05) are shown in red (negatively correlated) or blue (positively correlated) circles in the graph. SWC, TC, TN, and TP represent the abbreviations of soil water content, total carbon, total nitrogen, and total phosphorus. Bshannon, Fshannon, and F:B ratio represent the abbreviations of the soil bacterial Shannon index, fungal Shannon index, and fungi-to-bacteria ratio, respectively.
Forests 15 01815 g007
Table 1. Site basic characteristics of the five forest types.
Forest TypesElevation (m)Stand AgeDBH (cm)Tree Height (m)Canopy Density
B. platyphylla305 ± 55315.30 ± 5.4110.58 ± 0.530.75
P. davidiana307 ± 35512.78 ± 4.039.60 ± 1.040.85
F. mandschurica305 ± 44712.34 ± 3.29.97 ± 0.840.80
L. gmelinii314 ± 45014.48 ± 4.4011.42 ± 1.050.85
P. koraiensis307 ± 25826.66 ± 4.7510.80 ± 1.120.80
Table 2. Understory vegetation composition of the five forest types.
Forest TypesUnderstory Vegetation Composition
B. platyphyllaRhododendron simsii Planch
Corylus mandshurica Maxim
Spiraea salicifolia L.
Euonymus verrucosus var. pauciflorus(Maxim.) Rege
P. davidianaRhododendron simsii Planch
Adenophora capillaris subsp. Paniculate
Rubus crataegifolius Bunge
Eriophorum scheuchzeri Hoppe
F. mandschuricaRhododendron simsii Planch
Acer leptophyllum Fang
Rhamnus davurica Pall.
Eriophorum scheuchzeri Hoppe
L. gmeliniiRhododendron simsii Planch
Sorbaria sorbifolia (L.) A. Braun
Rubus crataegifolius Bunge
Chelidonium majus L.
P. koraiensisRhododendron simsii Planch
Sorbaria sorbifolia (L.) A. Braun
Phryma leptostachya subsp. asiatica (Hara) Kitamura
Chelidonium majus L.
Table 3. The substrates of enzymes.
EnzymeSubstrate
β-1,4-glucosidase (BG)ρNP-β-d-glucopyranoside
β-1,4-N-acetylglucosaminidase (NAG)ρNP-N-acetyl-β-D-glucosaminide
leucine arylamidase (LAP)Leucine ρ-nitroanilide
acid phosphatase (ACP)ρNP-phosphate
ρNP: ρ-nitrophenol.
Table 4. Soil properties in the different five forest ecosystems.
Forest TypesSWC (%)pHTC (g·kg−1)TN (g·kg−1)TP (g·kg−1)
B. platyphylla28.94 ± 2.35 ab6.06 ± 0.10 b40.73 ± 3.58 b2.86 ± 0.15 b0.45 ± 0.02 c
P. davidiana24.94 ± 4.21 b6.10 ± 0.05 b23.77 ± 2.18 c1.97 ± 0.09 c0.33 ± 0.01 e
F. mandschurica26.32 ± 3.23 b6.35 ± 0.11 a29.15 ± 1.85 c2.21 ± 0.12 c0.40 ± 0.02 d
L. gmelinii24.44 ± 2.24 b6.00 ± 0.04 b24.28 ± 3.54 c2.16 ± 0.05 c0.60 ± 0.03 b
P. koraiensis34.84 ± 3.58 a6.20 ± 0.20 b68.35 ± 5.78 a5.29 ± 0.21 a0.80 ± 0.04 a
The data are presented as the mean ± standard deviation, with significant differences among forest types denoted by distinct lowercase letters (p < 0.05). SWC, TC, TN, and TP represent the abbreviations of soil water content, total carbon, total nitrogen, and total phosphorus.
Table 5. Variations in soil microbial alpha diversity (Shannon diversity index) and fungi-to-bacteria ratio along the different five forest types.
Forest TypesBacterial Shannon IndexFungal Shannon IndexF:B Ratio
B. platyphylla6.88 ± 0.04 b4.26 ± 0.07 a1.05 ± 0.08 b
P. davidiana6.79 ± 0.07 c3.28 ± 0.04 d0.99 ± 0.04 b
F. mandschurica6.63 ± 0.02 c3.89 ± 0.13 c1.14 ± 0.02 a
L. gmelinii7.05 ± 0.03 a4.37 ± 0.04 a1.19 ± 0.03 a
P. koraiensis6.86 ± 0.05 b4.12 ± 0.03 b0.99 ± 0.01 b
The data are presented as the mean ± standard deviation, with significant differences among forest types denoted by distinct lowercase letters (p < 0.05). F:B ratio represents the abbreviations of the fungi-to-bacteria ratio.
Table 6. RDA and soil properties correlated with the abundant microbial communities at the phylum level.
Soil Properties Bacteria Fungi
RDA1RDA2r2pRDA1RDA2r2p
SWC−0.984 0.176 0.503 0.017 *0.382 0.924 0.575 0.006 *
pH−0.578 0.816 0.055 0.694 0.639 0.769 0.271 0.155
TC−0.996 0.089 0.792 0.003 **0.443 0.897 0.738 0.001 **
TN−1.000 0.028 0.880 0.002 **0.490 0.872 0.749 0.001 **
TP−0.978 −0.209 0.841 0.001 **0.870 0.494 0.571 0.008 **
TC/TN−0.246 0.969 0.072 0.669 −0.188 0.982 0.124 0.446
TC/AP−0.615 0.788 0.211 0.239 −0.285 0.959 0.574 0.005 **
TN/TP−0.695 0.719 0.244 0.167 −0.315 0.949 0.753 0.003 **
BG−0.934 0.356 0.244 0.183 0.208 0.978 0.222 0.204
NAG + LAP−0.634 0.774 0.051 0.760 −0.550 0.835 0.043 0.777
ACP−0.997 0.076 0.572 0.007 ** 0.008 1.000 0.472 0.020 *
lnBG:ln(NAG + LAP)−0.999 −0.033 0.076 0.619 0.680 0.734 0.259 0.184
lnBG:lnACP−0.180 0.984 0.009 0.946 1.000 0.018 0.086 0.558
ln(NAG + LAP):lnACP0.765 0.644 0.019 0.903 0.453 −0.892 0.026 0.841
Notes: ** significant at the 0.01 level; * significant at the 0.05 level.
Table 7. Pearson correlation analyses of the soil properties and the abundance of microbial communities.
Microbial CommunitiesBGNAG + LAPACPlnBG:ln(NAG + LAP)lnBG:lnACPln(NAG + LAP):lnACPVector AngleVector Length
Bacterial communitiesProteobacteria−0.1120.053−0.249−0.156−0.0460.0400.477−0.116
Acidobacteriota−0.280−0.005−0.599 *−0.3680.0790.2200.005−0.120
Actinobacteriota0.4400.1190.807 **0.287−0.055−0.167−0.1080.096
Verrucomicrobiota−0.620 *−0.527 *−0.2160.189−0.522 *−0.5010.343−0.407
Chloroflexi−0.0220.017−0.175−0.1910.1690.205−0.596 *0.047
Myxococcota0.190−0.0190.0520.4540.2860.034−0.2810.526 *
Methylomirabilota0.620 *0.5020.190−0.1590.577 *0.528 *−0.529 *0.472
Gemmatimonadota−0.371−0.157−0.429−0.366−0.1000.064−0.334−0.309
Bacteroidota0.2820.509−0.659 **−0.4560.739 **0.792 **−0.2110.484
Latescibacterota0.4270.414−0.163−0.2140.640 *0.601 *−0.601 *0.504
Fungal communitiesAscomycota0.161−0.0890.1010.3940.2910.052−0.808 **0.483
Basidiomycota−0.0780.1220.025−0.331−0.294−0.0800.872 **−0.450
Mucoromycota−0.140−0.185−0.3270.1180.2500.133−0.898 **0.290
Notes: ** significant at the 0.01 level; * significant at the 0.05 level.
Disclaimer/Publisher’s Note: The statements, opinions and data contained in all publications are solely those of the individual author(s) and contributor(s) and not of MDPI and/or the editor(s). MDPI and/or the editor(s) disclaim responsibility for any injury to people or property resulting from any ideas, methods, instructions or products referred to in the content.

