Article

Influence of Terrain on MODIS and GLASS Leaf Area Index (LAI) Products in Qinling Mountains Forests

1
College of Natural Resources and Environment, Northwest A & F University, Yangling, Xianyang 712100, China
2
GeoInformatic Unit, Geography Section, School of Humanities, Universiti Sains Malaysia, Gelugor 11800, Penang, Malaysia
*
Author to whom correspondence should be addressed.
Forests 2024, 15(11), 1871; https://doi.org/10.3390/f15111871
Submission received: 24 September 2024 / Revised: 10 October 2024 / Accepted: 18 October 2024 / Published: 25 October 2024

Abstract

:
Leaf Area Index (LAI), as a pivotal parameter in characterizing the structural properties of vegetation ecosystems, holds significant importance in assessing the carbon sink function. Given the availability of multiple long-term LAI products, validating these LAI products with consideration of topographic factors is a prerequisite for enhancing the quality of LAI products in mountainous areas. Therefore, this study aims to evaluate the performance of MODIS LAI and GLASS LAI products from 2001 to 2021 by comparing and validating them with ground-measured LAI data, focusing on the spatio-temporal and topographic aspects in the Qinling Mountains. The results show that the GLASS LAI product is a better choice for estimating LAI in the Qinling Mountains. The GLASS LAI product has better completeness and generally higher values compared to the MODIS LAI product. The time-series curve of the GLASS LAI product is more continuous and smoother than the MODIS LAI product. Both products, however, face challenges in quantifying LAI values of evergreen vegetation during winter. The MODIS and GLASS LAI products exhibit differences between sunny and shady slopes, with mean LAI values peaking on sunny slopes and reaching their lowest on shady slopes. When the slope ranges from 0 to 10°, the mean values of GLASS LAI product show a higher increasing trend compared to the MODIS LAI product. At elevations between 1450 and 2450 m, the mean LAI values of the GLASS LAI product are higher than the MODIS LAI product, primarily in the southern Qinling Mountains. Compared to ground-measured LAI data, the GLASS LAI product (R² = 0.33, RMSE = 1.62, MAE = 0.61) shows a stronger correlation and higher accuracy than the MODIS LAI product (R² = 0.24, RMSE = 1.61, MAE = 0.68).

1. Introduction

Leaf Area Index (LAI) is defined as half of the plant’s total green leaf area for a given unit of horizontal ground surface area [1]. As an important parameter reflecting the growth status of plant communities and the carbon sequestration capacity, LAI expresses various information such as the number of plant leaves [2] and changes in canopy structure [3,4]. Therefore, it is crucial to efficiently obtain large-scale and long-term surface LAI. Traditional ground-based LAI measurement methods are time-consuming and labor-intensive, making it difficult to conduct continuous observations of LAI over large areas [5]. The rapid development of satellite remote sensing technology has provided a reliable means for obtaining continuously spatial and temporal changes of LAI at regional or global scales [6]. Currently, various standard LAI products have been produced through the collaborative use of multiple sensors, such as the MOD15A2 LAI product based on the Terra and Aqua sensor, as well as the GLASS LAI and GIMMS3g LAI products produced based on MODIS and AVHRR.
Differences in the spectral characteristics of the sensor, spatio-temporal resolutions, and time range of data coverage lead to varying performances of the different LAI products in reflecting vegetation characteristics, spatial distribution, and temporal changes [7]. Direct and cross-validation of multiple LAI products serve as the foundation for their extensive applications and provide feedback for further improvement of the inversion algorithms [8].
Li et al. [9] evaluated the spatio-temporal consistency of the MCD15A2H LAI, GLASS LAI, and GEOV2 LAI products globally from 2002 to 2018 using high-resolution reference maps from 38 sites of the Validation of Land European Remote Sensing Instrument (VALERI). Yu et al. [10] conducted comparative analyses of multiple LAI products derived from Sentinel-2, MODIS, PROBA-V, and AVHRR sensors. Liu et al. [11] employed long short-term memory (LSTM) of deep-learning for the sequential LAI estimations and performed comparative validation with GLASS, MCD15A2H, and VIIRS LAI products. Luo et al. [7] used the Simulated Annealing–Back Propagation Neural Network (SA-BPNN) model to estimate LAI from Landsat8 OLI and conducted comparative analyses with the GLASS LAI product. Previous studies have shown varied performance of LAI products due to different geographical locations and climatic conditions. The validation of most LAI products is often carried out on flat terrain, overlooking the impact of topographic effects in mountainous areas [12]. The complexity of mountain terrains and the high degree of landscape fragmentation significantly constrain the quality of LAI products [13]. Moreover, the inversion accuracy of LAI products in mountainous regions is difficult to guarantee as most algorithms do not consider topographic factors [14]. Therefore, further research is needed to deepen the comparative analysis and validation of LAI products, considering the complex topographic characteristics of mountainous regions, based on long-term MODIS and GLASS LAI products.
The Qinling Mountains serve as a natural dividing zone between China’s northern and southern environmental regimes [15], characterized by multi-dimensional zonality, highly complex environmental conditions [16], and sensitive climatic attributes [17]. The distribution of light, water, and soil required for vegetation growth varies widely, and the influence of topographic factors is particularly prominent [18]. The research into the spatio-temporal variations, terrain effects, and consistency verification among long-term LAI products in the Qinling Mountains region necessitates further refinement.
Therefore, this study aims to investigate the consistency of MODIS LAI and GLASS LAI products in the Qinling Mountains using comparative analysis and direct validation methods. The objectives of this study are as follows: (1) to evaluate the spatio-temporal consistency of MODIS and GLASS LAI products; (2) to explore the consistency of the two LAI products under the influence of topographic factors; (3) to conduct accuracy validation of the two LAI products by integrating ground-measured LAI data. This study seeks to provide a reference for the application of LAI products in the Qinling Mountains and the improvement of inversion algorithms.

2. Materials and Data

2.1. Study Area

The study area is the Qinling Mountains within Shaanxi Province (32°28′53″ N~34°32′23″ N, 105°29′18″ E~111°01′54″ E), the scope of which is referenced to the “Comprehensive Planning for Qinling Ecological Environment Protection in Shaanxi Province”. It extends from the Weihe River in the north to the main stream of the Han River in the south, and from east to west to the boundary of Shaanxi Province (Figure 1). The total land area is about 57,700 km2, with an elevation of 163–3753 m, featuring a variety of terrains including mountains, plateaus, river valleys, and basins, characterized by undulating topography and significant elevation differences. The northern slope is predominantly composed of mountainous hills, while the southern slope is mainly characterized by high mountain and gorge regions [19]. Influenced by the terrain, the climate of the northern and southern slopes of the Qinling Mountains varies greatly, with the southern slope having a subtropical humid climate, with an average annual temperature of 13.1 °C and precipitation of 820 mm for the past 45 years, and the northern slope having a warm temperate semi-humid climate, with an average annual temperature of 10.8 °C and precipitation of 520 mm for the past 45 years [20]. In the Qinling Mountains area, the vegetation types are diverse, forest cover is high, and the vertical zones of the vegetation spectrum is complete [21]. The vegetation type of the southern slope is dominated by subtropical deciduous broad-leaved and evergreen broad-leaved mixed forests, and the northern slope is dominated by warm-temperate deciduous broad-leaved forests [21,22]. The Qinling Mountains encompass a total forested area of 51,584,000 hectares, corresponding to a forest cover rate of 72.95%. Soil types on the southern slopes are dominated by paddy soil and yellow-brown soil, while brown soil, mountainous brown soil, and mountainous dark brown loam dominate on the northern slopes [23].

2.2. Data

2.2.1. MODIS LAI Product

This study employs the MOD15A2H Version 6 Level 4 land product from the MODIS/Terra satellite, provided by the National Aeronautics and Space Administration (NASA; https://ladsweb.modaps.eosdis.nasa.gov/ (accessed on 6 May 2024)). The spatial resolution of 500 m is derived from the inversion of MODIS sensor data on red and near-infrared band reflectance, employing the Integerized Sinusoidal (ISIN) projection method. The temporal resolution is set at 8 days, covering a time span from 2001 to 2021. The LAI values range effectively from 0 to 100, with a scaling factor of 0.1. The MODIS LAI retrieval algorithm consists of a primary and a backup method [24]. The primary algorithm is preferred for inversion, employing a three-dimensional radiative transfer model that accounts for canopy-scale clumping effects and yields LAI. In instances where the primary algorithm fails, the backup algorithm is employed, which inversely estimates LAI based on empirical relationships between LAI and NDVI for different vegetation types [25].
We used the Google Earth Engine platform (https://earthengine.google.com/ (accessed on 6 May 2024)) to perform online dataset loading, determine the temporal range, clip images, set the resolution, and complete visualization tasks, thereby achieving the acquisition of LAI data within the study area. Owing to factors such as sensor viewing angle, water vapor content, clouds, and atmospheric aerosols, the temporal characteristics of the raw data exhibit pronounced non-periodic variations [26]. To address this, the study applied the Savitzky–Golay filtering to smooth and denoise the MODIS LAI product. Subsequently, the 8-day data were aggregated into monthly tiff-format images using the Maximum Value Composite (MVC) method.

2.2.2. GLASS LAI Product

The GLASS LAI product, published by the Beijing Normal University Global Change Data Processing and Analysis Center (https://www.geodata.cn (accessed on 6 May 2024)), features an 8-day temporal resolution spanning from 2001 to 2021. It achieves a spatial resolution of 500 m through the inversion and fusion of AVHRR and MODIS reflectance data, utilizing the Integerized Sinusoidal (ISIN) projection method. The GLASS LAI retrieval algorithm employs a multi-input, multi-output Generalized Regression Neural Network (GRNN) to invert LAI [27,28]. According to the algorithm prototype of GLASS LAI, the CYCLOPES LAI [29], after being converted to actual values, is fused with MODIS LAI through a weighted linear combination. The time-series data of MOD09A1 are reprocessed to address missing values and eliminate cloud-contaminated data using the algorithm proposed by [30]. The GRNN algorithm is subsequently trained with the fused LAI and MOD09A1 data for each biome type derived from the MODIS land cover product (MCD12Q1 type 3) at the BELMANIP sites [31] over the period of 2001–2003. This trained algorithm is then utilized to retrieve LAI from the annual MOD09A1 surface reflectance product.
Preprocessing of GLASS data primarily involves the utilization of NASA’s MRT (MODIS Reprojection Tool) for reprojecting, mosaicking, and tiling hdf-formatted files, ultimately storing them in the tiff format. This was followed by employing the ArcGIS 10.6 geographic information system platform for spatially cropping the data within the study area boundaries. Finally, the Maximum Value Composite (MVC) method was applied to synthesize the 8-day data into monthly image datasets.

2.2.3. LAI Measurement Data

The field experiment of LAI was conducted at the Huoditang National Field Scientific Observation and Research Station in the Qinling Mountains, with the latitude of the experimental plot located at 33°26′ N, 108°26′ E, and an altitude ranging from 1630 to 1680 m. The plot is rich in vegetation, with natural secondary forests as the main component. The experiment began in June 2010 and ended in November. The LAI-2200 Plant Canopy Analyzer was used to measure LAI of the forestland on the 2nd, 12th, and 22nd of each month. The measurements were taken between 6:30 and 9:00 or 16:30 and 19:00 to avoid test errors caused by direct sunlight. First, the sky background above the canopy was measured once, followed by five target values below the canopy. Six sets of data were measured each time, and the average of five LAI measurements was taken as the final result [32]. Finally, the time-series data of LAI were obtained and used for verification work.

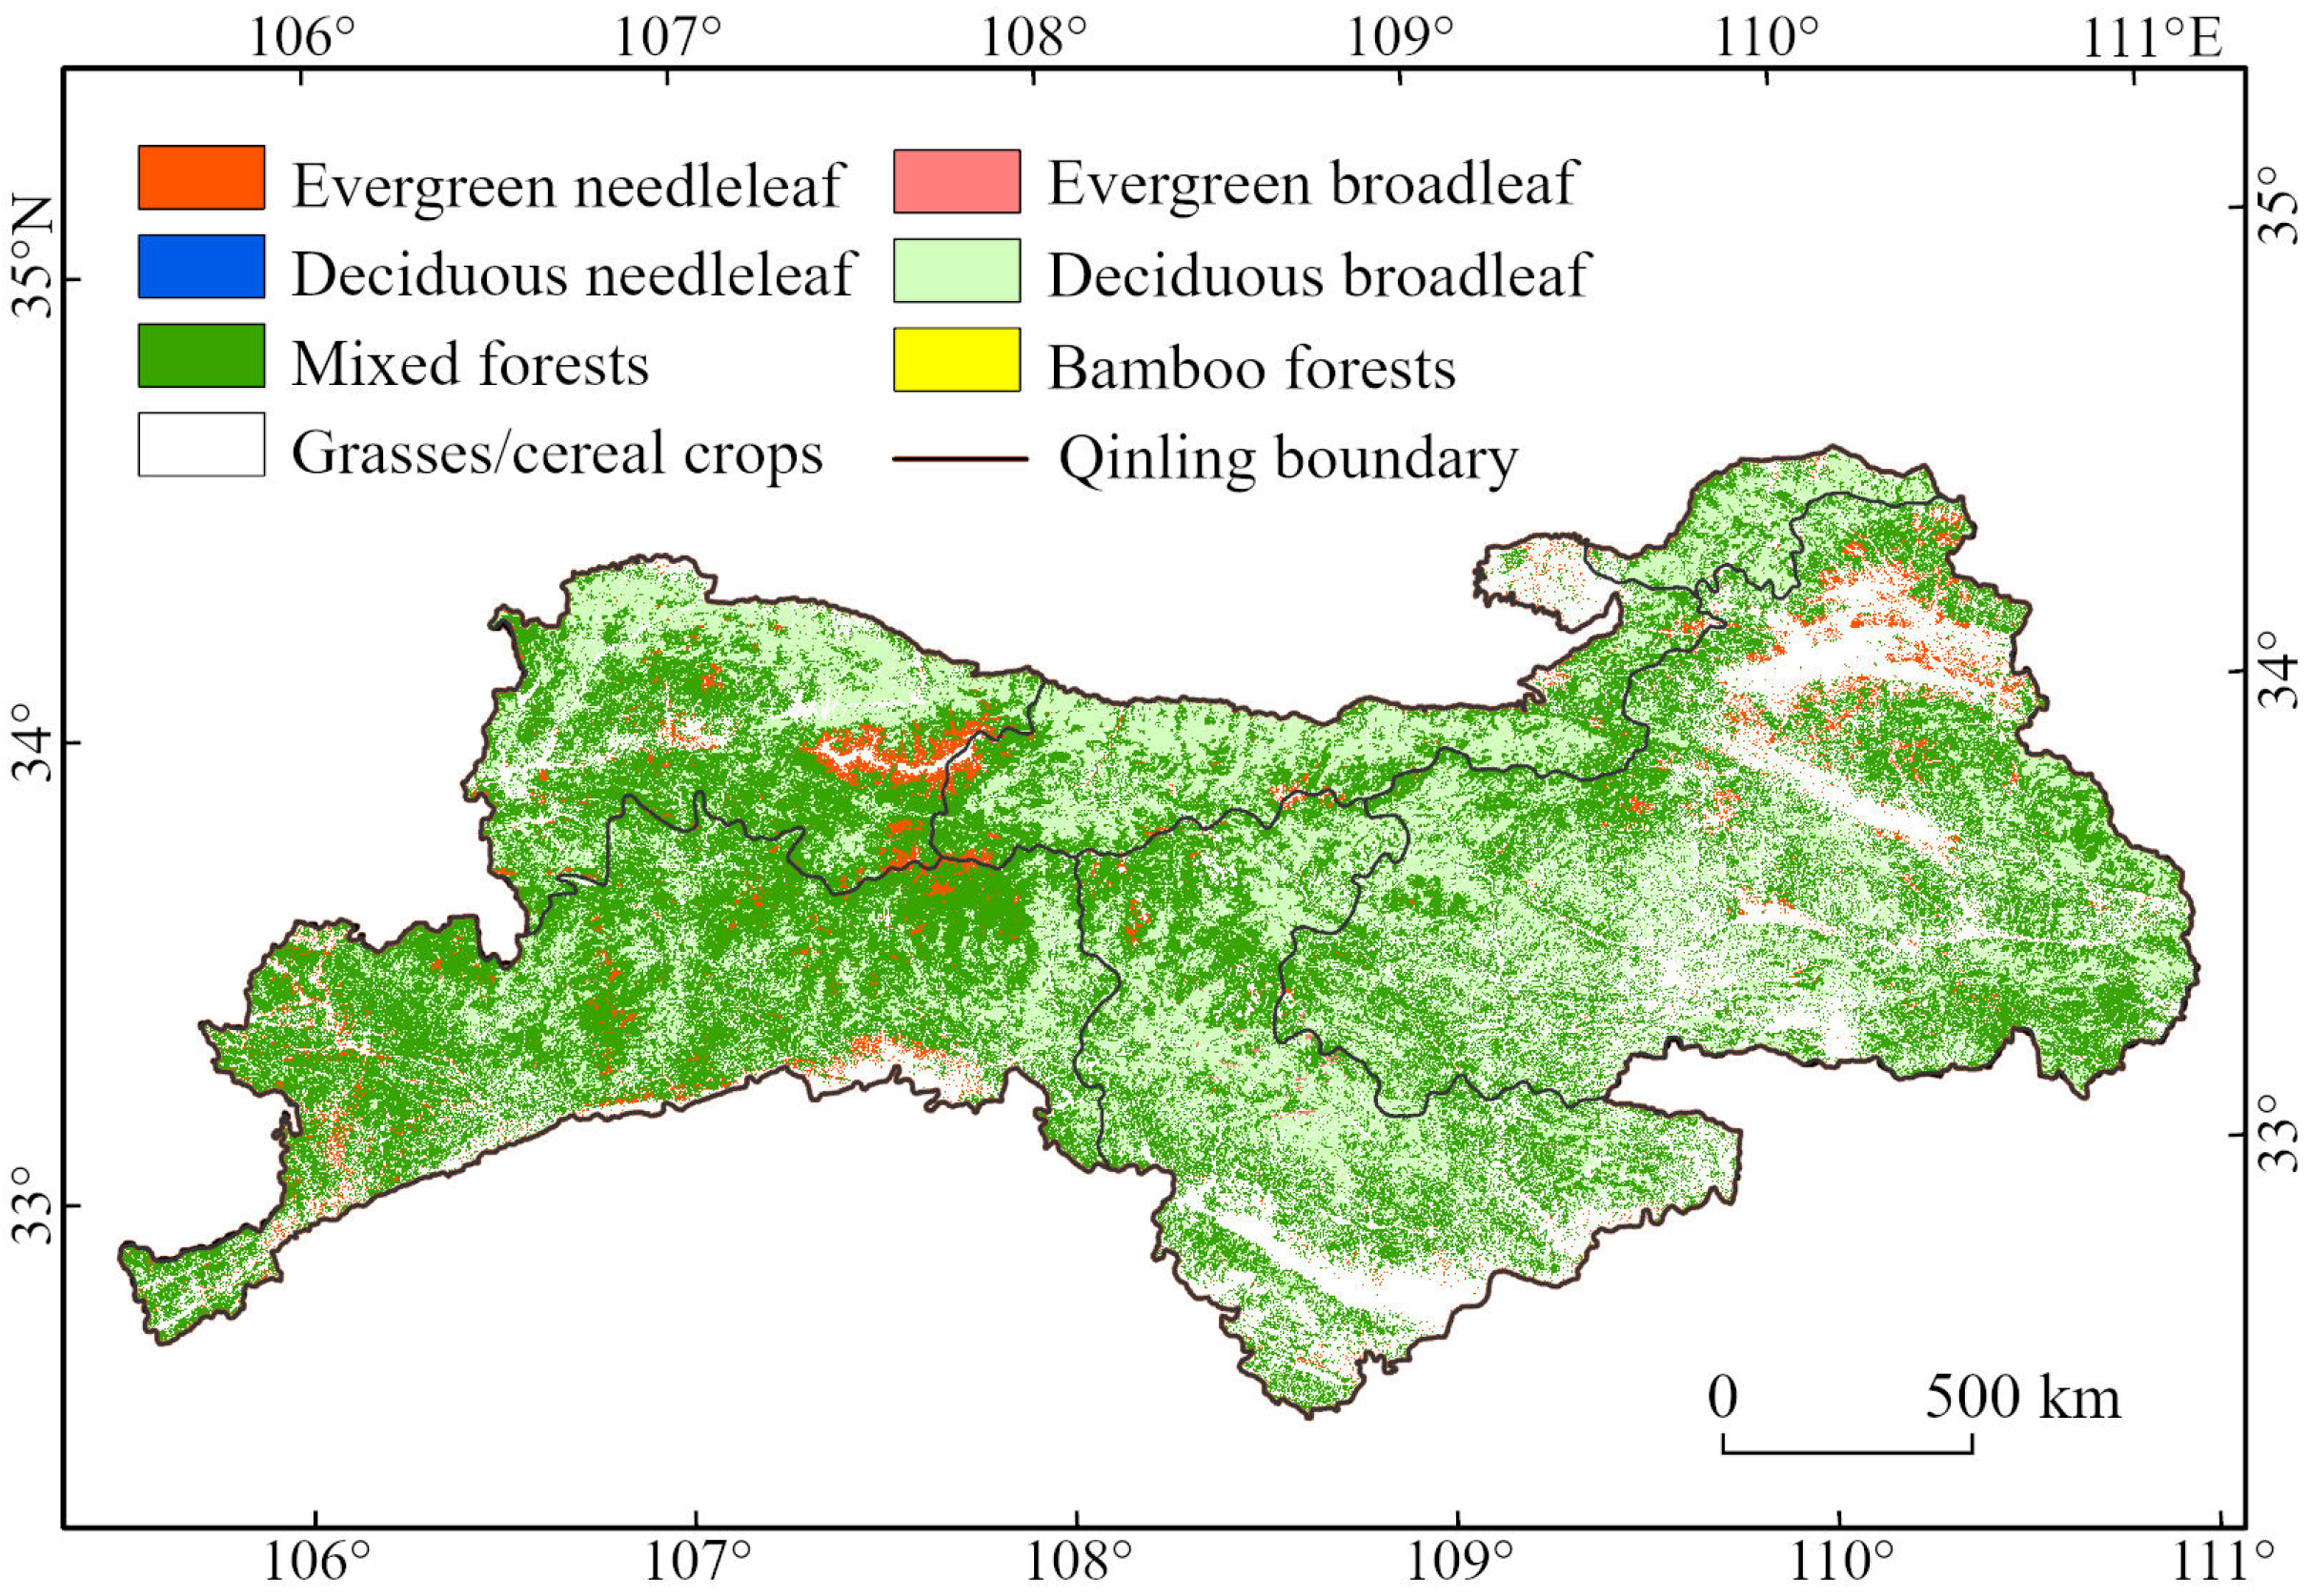
2.2.4. Vegetation Type Data

We acquired the 30 m resolution vegetation type map of China generated by Li et al. [33] in 2010. Li et al. [33], in combination with multi-source remotely sensed data (i.e., Landsat TM/ETM+, MODIS, SRTM) and additional features from ancillary sources (i.e., spectral, topographical features), recognized forest characteristics, collected training samples, and completed mapping using the random forest algorithm. The overall accuracy of vegetation types is 72.%. Li et al. [33] used the International Global Biosphere Programme (IGBP) classification system [34], considering the spatial resolution, spectral information limitations of the data and the characteristics of China’s vegetation types, and further classified the vegetation cover into seven types: evergreen broadleaf forests, deciduous broadleaf forests, evergreen needleleaf forests, deciduous needleleaf forests, mixed forests, bamboo forests, and grasses/cereal crops (Figure 2). The dominant species corresponding to different vegetation types in the Qinling Mountains are shown in Table 1 [35,36].

2.2.5. Digital Elevation Model (DEM) Data

DEM data used in this study were obtained from SRTM DEM (Shuttle Radar Topography Mission Digital Elevation Model) with a spatial resolution of 30 m. (https://search.earthdata.nasa.gov/search (accessed on 8 May 2023)). With the assistance of ArcGIS 10.6, tools such as mosaic, projection conversion, and mask processing were employed to generate the elevation map of the study area.

3. Methods

3.1. Spatial Consistency Validation

The metric approach of spatial consistency was employed to evaluate whether there were differences in LAI values of products across different spatial regions, and analyzed the regions with significant differences to trace the relevant causes [37]. Utilizing GIS, the study calculated the multi-year averages of LAI values for MODIS and GLASS LAI products in January and July from 2001 to 2021, obtaining the mean LAI values for each product in January and July. Subsequently, the differences between the mean LAI values in January and July were calculated for both MODIS and GLASS LAI products to compare and analyze the seasonal spatial variations among products [38]. Additionally, using the mean LAI values for July, we conducted regional statistics to determine the frequency distributions of MODIS and GLASS LAI products for different vegetation types. Furthermore, we studied the monthly mean differences in MODIS and GLASS LAI products across various vegetation types, thereby assessing the consistency and validity between the products.

3.2. Temporal Consistency Validation

The method of temporal consistency validation was employed to assess the temporal differences between LAI products, encompassing the seasonal variations and trends of LAI values over multiple years for both products. This study examined the temporal series variations of LAI across different vegetation types from 2001 to 2021, evaluating the primary differences in seasonal variations and the existence of outliers between MODIS and GLASS LAI products. Subsequently, the stability of LAI products over the temporal series was determined.
Using the Slope trend analysis [39], we simulated the changing trends of LAI values for each pixel in the study area from 2001 to 2021, thereby reflecting the characteristics of different LAI products over time. The formula is as follows:
S l o p e = n i = 1 n ( i L A I i ) ( i = 1 n i ) ( i = 1 n L A I i ) n i = 1 n i 2 i = 1 n i 2
where i is the serial year number (1 to n ); L A I i is the annual mean LAI value in year i; n is the time series. Slope represents the rate of change in the regression equation, with its value and sign indicating the direction and magnitude of the trend in the LAI time series. When Slope > 0, an increasing dynamic trend is referred, and when Slope < 0, a decreasing dynamic trend is implied. The larger the absolute value of Slope, the more pronounced the downward or upward trend in LAI values becomes.
The Mann–Kendall (MK) test [40] was employed to explore the significance of the LAI time-series trends. This method is a non-parametric statistical test, which does not require the measured values to follow a normal distribution or assume a linear trend. It is widely used in testing the significance of trends in long time-series data. In this study, the MK test is used to conduct a significance test on the Slope trend. The algorithms are as follows:
Q = i = 1 n 1 j = i + 1 n s i g n ( x j x i )
s i g n x j x i = 1           x j x i > 0 0           x j x i = 0 1           x j x i < 0
Z = Q 1 V a r Q           Q > 0 0           Q = 0 Q + 1 V a r Q           Q < 0
where   x i and x j are the biophysical data; n is the time series; Q   is the test statistic; Z is the standardized test statistic; V a r Q   is the variance. At a given significance level of α, when Z < Z(α/2), the significance test has passed with the corresponding confidence level. In this study, when |Z| > 1.96 it suggests that the time series has passed the significance test. By combining the Slope value with the Z value, the LAI trends can be categorized into significant decreasing, non-significant decreasing, unchanging, not significant increasing, and significant increasing.
Based on the aforementioned trend analysis results, the average LAI trends of MODIS and GLASS LAI products under different vegetation types were obtained. This allowed for a further analysis and discussion of the differences in trends between the two products.

3.3. Consistency Validation Under Topographic Factors

Utilizing GIS, terrain factors, including aspect, slope, and elevation extracted from DEM, were employed to validate the consistency of MODIS and GLASS LAI product retrievals in the Qinling Mountains. This study reclassified the terrain factor data and conducted regional statistics on the proportion of vegetation types across different slope and altitudes. The study compared mean values in January from 2001 to 2021 between MODIS and GLASS LAI products, examining their variation with aspect and slope. Further, the data of the mean values in July from 2001 to 2021 were used to analyze elevation-induced changes in MODIS LAI and GLASS LAI, and the vertical distribution characteristics were explored using July monthly LAI difference data from both products over the same period.

3.4. Quality Evaluation of LAI Products

Comparisons between MODIS LAI, GLASS LAI, and ground-measured values were conducted to quantitatively assess the accuracy of both products. Given potential temporal discrepancies between the synthesis dates of LAI products and the times of ground measurements, the study selected LAI data closest to the ground observation times for validation purposes. The accuracy of the two LAI products was gauged using the coefficient of determination ( R 2 ), root mean square error ( R M S E ), and mean absolute error ( M A E ). The formulas are as follows:
R 2 = i = 1 n y ^ i y ¯ i 2 i = 1 n y i y ¯ i 2
R M S E = i = 1 n y ^ i y i 2 n
M A E = 1 n i = 1 n y ^ i y i
where y ^ i   is MODIS or GLASS LAI values; y i   is ground-measured values; y ¯ i   is ground-measured mean values; n is the number of measured time series.

4. Results

4.1. Spatio-Temporal Consistency of LAI Products

4.1.1. Spatial Consistency of MODIS and GLASS LAI Products

Figure 3 shows the spatial distribution of the mean values of the MODIS and GLASS LAI products in January and July during 2001–2021. The GLASS LAI product exhibits better spatial integrity, while the MODIS LAI product has a higher proportion of missing values compared to the GLASS LAI product. The phenomenon of missing values is particularly noticeable in the spatial distribution of annual mean values in January from 2001 to 2021, mainly concentrated in the eastern and southern parts of the Qinling Mountains.
Although the annual mean values of both LAI products in January and July over a 21-year period exhibit similar spatial distribution patterns, consistent with the seasonal changes in vegetation growth, the overall GLASS LAI values are higher than MODIS LAI values. The low-value regions of both LAI products in January and July are primarily distributed in the eastern part of the Qinling Mountains. The high-value areas in January are concentrated in the central Qinling Mountains. There are some differences in the distribution characteristics of high-value areas in July between the two LAI products. The GLASS LAI product exhibits higher LAI values in both the eastern and northern mountainous areas of the Qinling Mountains, while the MODIS LAI product has higher values concentrated in the central and western Qinling Mountains.
Figure 4a shows the spatial distribution of the differences between the GLASS LAI and MODIS LAI products in January during 2001–2021. The proportion of pixels where MODIS LAI values are higher than GLASS LAI values is extremely low, accounting for only 0.11%. The proportion of pixels with a difference range of −0.1 to 0.1 between the GLASS and MODIS LAI product is 2.39%, and their distribution is rather sporadic. The differences between the GLASS and MODIS LAI products are concentrated in the range of 0.1 to 0.5, with a pixel proportion of 97.52%. This is mainly distributed in the central and eastern parts of the Qinling Mountains. The land cover types in this region are deciduous broadleaf forests and mixed forests. In parts of the central and western Qinling Mountains, the difference between GLASS and MODIS LAI products has exceeded 0.5, and the maximum difference can reach 1. Figure 4b expresses the spatial distribution of the differences between GLASS LAI and MODIS LAI products in July during 2001–2021. The regions where GLASS LAI values are higher than MODIS LAI values occupy a larger area, accounting for 97.14% of the total. The proportion of areas with differences in the range of 0.1–2.5 amounted to 96.29%, and the land cover types are mainly deciduous broadleaf forests, mixed forests, and grasses/cereal crops. The areas with a difference exceeding 2.5 are concentrated in the southern part of the Qinling Mountains., with a maximum difference reaching 4. The primary vegetation types in these regions are mixed forests and grasses/cereal crops. The regions where MODIS LAI values are higher than GLASS LAI values account for only 1.62%, primarily located in the forested areas of the southern Qinling Mountains, especially in regions with deciduous broadleaf forests and evergreen needleleaf forests. The minimum difference in these regions is −3.8. The proportion of areas where GLASS and MODIS LAI products are more compatible is 1.3%, and the difference is between −0.1 and 0.1, with its distribution showing significant dispersion characteristics.
Figure 5 presents histograms of the MODIS and GLASS LAI values during 2001–2021 for different vegetation types. For evergreen needleleaf forests, the two products exhibit minimal differences in LAI frequency distribution. MODIS LAI values are predominantly distributed between 2.5 and 3.5. The GLASS LAI product exhibits multiple peaks with relatively consistent peak values. When the frequency is high, the LAI values fall within the range of 2.5 to 4.5.
Distinct differences in LAI frequency distributions are observed for deciduous needleleaf forest, mixed forest, deciduous broadleaf forests, and evergreen broadleaf forests among the two LAI products. For mixed forests, deciduous broadleaf forests, and evergreen broadleaf forests, the frequency distribution of the MODIS LAI product exhibits increased evenness, with peaks consistently between 3 and 4 and a maximum LAI value of 5. The GLASS LAI product, conversely, shows lower frequencies at lower LAI values, peaking between 5 and 5.5, and reaching a maximum LAI value of 6. For deciduous needleleaf forests, the frequency distribution of the MODIS LAI product is concentrated between 3 and 4, with prominent peaks at LAI values of 3 and 4, with a maximum LAI value of 4.2. GLASS LAI peaks lie between LAI values of 4 and 5, exceeding a maximum LAI value of 5.
Differences in LAI frequency distributions intensify for bamboo forests and grasses/cereal crops. The frequency distribution of the MODIS LAI product in bamboo forests is concentrated between LAI values of 3 and 4, peaking at 3.7, while the GLASS LAI product exhibits peaks at LAI values of 3.4, 4, 4.3, and 5.5, with the highest frequency at 5.5. For grasses/cereal crops, the MODIS LAI product presents two peaks at LAI values of 1.5 and 3.2, with a maximum LAI value of 5. The frequency distribution of the GLASS LAI product was concentrated between LAI values of 2 and 5, reaching a maximum LAI value of 5.7, potentially due to overestimation of the GLASS LAI values for low vegetations, resulting in a concentration of LAI product frequencies at higher values and a shifted maximum LAI value [41].
The mean values of the differences between the MODIS and GLASS LAI products for different vegetation types in each month during 2001–2021 are shown in Figure 6. All vegetation types exhibit positive monthly differences, indicating consistently higher monthly mean LAI values from the GLASS compared to the MODIS LAI product. For evergreen needleleaf forests, mixed forests, deciduous broadleaf forests, and grasses/cereal crops, the magnitude of monthly differences follows a similar pattern of rise-decline-rise-decline. High agreement is observed during January–March and November–December, with monthly differences below 0.4. From April to June and August to October, discrepancies widen, with differences ranging from 0.4 to 0.8. In July, the maximum mean values of the differences occur across these four vegetation types, reaching 0.95, 1.2, 1.27, and 0.89, respectively. Excessive and concentrated precipitation in summer in the Qinling Mountains, coupled with pronounced cloud cover, likely contributes to significantly lower MODIS LAI mean values compared to GLASS across multiple vegetation types in July.
For bamboo forests, deciduous needleleaf forests, and evergreen broadleaf forests, both products exhibit substantial monthly variations in mean values of the differences. Bamboo forests display a pattern of decline-slow rise-marked decline-marked rise-decline, with LAI values from the two LAI products being relatively close (0.29) in June compared to other vegetation types, followed by an increased difference (1.14) in July. Deciduous needleleaf forests show an oscillatory trend of rising and falling, with LAI values closely aligned (0.15) among the two LAI products in March relative to other vegetation types. Mean values of the differences among the two LAI products reach a maximum (0.9), deviating 0.25 LAI units from the mean differences across all vegetation types in May, and with a difference of 1.14 in July. Evergreen broadleaf forests exhibit anomalous differences relative to other vegetation types during July to September, deviating by 0.49, 0.42, and 0.25 LAI units.

4.1.2. Temporal Consistency of MODIS and GLASS LAI Products

Figure 7 shows temporal profiles of the mean values of the MODIS and GLASS LAI products for different vegetation types during 2001–2021. Both products exhibit continuous, complete time-series curves with discernible seasonal fluctuations in each vegetation type. Good consistency is observed for deciduous broadleaf forests and grasses/cereal crops, while coherence is relatively weaker in evergreen broadleaf forests. Overall, GLASS LAI values consistently exceed those of MODIS LAI, with smoother time-series curves and more pronounced seasonal patterns. In contrast, the time series of the MODIS LAI product are more chaotic, featuring abrupt peak-to-valley shifts and low-value occurrences.
Time-series variations in LAI exhibit substantial differences among different vegetation types. Generally, the highest LAI values are observed for evergreen broadleaf forests, with respective annual mean LAI values of 2.30 and 3.00 for MODIS and GLASS LAI products. For grasses/cereal crops, lower LAI values are exhibited, with annual mean LAI values of 1.42 and 1.94 for MODIS and GLASS LAI products. For evergreen broadleaf forests, the time-series curves align well in 2001 and 2002. During the summers of 2003, 2016, and 2018, the values of the MODIS LAI product was significantly higher than the values of the GLASS LAI product, particularly in 2016 and 2018 where the time-series curves of the MODIS LAI product exhibit more pronounced fluctuations. During other growing seasons, the time-series curves of the GLASS LAI product demonstrate smoother profiles with higher LAI values compared to the MODIS LAI values. It is noteworthy that, on the whole, the two LAI time-series curves exhibit a characteristic of being high in summer and low in winter, which is relatively inconsistent with the growth pattern of evergreen vegetation. For grasses/cereal crops, LAI values are low from 2001 to 2009. From 2010 onwards, both product time-series curves gradually rise.
For evergreen needleleaf forests and mixed forests, the time series of the MODIS and GLASS LAI products exhibit consistent trends with overall lower LAI values from 2001 to 2009 compared to post-2009 levels. Both time series of the two LAI products exhibit seasonal variations. Furthermore, the time series of the MODIS LAI product in both vegetation types display abrupt peak and trough fluctuations during the summers of multiple years, particularly in 2016 and 2018, which deviate from typical vegetation growth patterns. During the period from 2019 to 2021, significant differences are observed between the two products in evergreen needleleaf forests and mixed forests. Specifically, the GLASS LAI values are notably higher than the MODIS LAI values in summer, while the MODIS LAI time-series is slightly lower than the GLASS LAI product in winter. Similar temporal profile changes are exhibited for deciduous needleleaf and deciduous broadleaf forests. As both vegetation types are deciduous, with significant seasonal variations and low vegetation cover in winter, the MODIS and GLASS LAI products usually have lower LAI values than evergreen vegetation in winter. Bamboo forest regions demonstrate good temporal consistency between MODIS and GLASS LAI, both exhibiting low interannual variability with annual mean LAI values ranging from 1.97 to 3.10.
Figure 8 presents trends of the annual mean LAI changes for the MODIS and GLASS LAI products during 2001–2021. The interannual slope values for the MODIS and GLASS LAI products lie within the ranges −0.8 to 1 and −0.8 to 1.2, respectively, with the study area predominantly exhibiting an increasing change trend of LAI. Positive trends are observed for 96.09% and 98.71% of the regions covered by the MODIS and GLASS LAI products, respectively. The regions with significant increasing annual mean LAI values for the MODIS LAI products are mainly concentrated in the eastern, southern, and northern fringes of the Qinling Mountains. The primary vegetation types in these areas are mixed forests and grasses/cereal crops. In contrast, the regions with the largest increases in annual mean LAI values for the GLASS LAI product differ slightly from those for the MODIS LAI product, concentrating predominantly in the central and southwestern regions of the Qinling Mountains. The vegetation types in this region are primarily deciduous broadleaf forests and mixed forests. Ongoing, robust conservation efforts in the Qinling Mountains, coupled with agricultural development in the study area, have significantly improved vegetation conditions and are likely associated with the increases of the annual mean LAI values [42]. Negative trends are present in 3.91% and 1.29% of the MODIS and GLASS LAI pixels, respectively, with the MODIS LAI product showing declines mainly in the northern, southern, and eastern parts of the Qinling Mountains. GLASS LAI, influenced by inversion algorithms, shows negative trends in a limited number of areas, which are dispersed sporadically.
Spatial distribution of the annual mean LAI significance of the MODIS and GLASS LAI products during 2001–2021 are provided in Figure 9. The proportion of areas with a significant increase in the time series of both the LAI products far exceed those with significant decreasing. Specifically, the proportions of areas with a significant decrease in the MODIS and GLASS LAI products are 0.35% and 0.37%, respectively, mainly concentrated in the eastern, southern, and northwest regions of the Qinling Mountains, with the main vegetation types being grasses/cereal crops. The proportions of areas with insignificant decreases in annual mean LAI are relatively small, accounting for 0.26% and 0.91% for the MODIS and GLASS LAI products, respectively, and are scattered spatially among various vegetation types. For the MODIS LAI product, the area with unchanging trends is relatively small, mainly distributed in the central region of the Qinling Mountains, with mixed forests and deciduous broadleaf forests as the main vegetation types, accounting for 3.32% of the total area. In contrast, the number of unchanging pixels in the GLASS LAI product are negligible, with only one pixel exhibiting stability. The distribution of pixels with insignificant increasing trends in the MODIS LAI product are more prominent compared to the GLASS LAI product, concentrated in the central and western regions of the Qinling Mountains, with an area proportion higher than that of the GLASS LAI product by 14.80%.
Figure 10 shows the means of the MODIS and GLASS annual mean LAI trends for different vegetation types for 2001–2021. The annual mean LAI trends of both LAI products are positive, consistently showing increases over the period. Moreover, for the same vegetation type, the GLASS LAI product displays higher mean LAI change trend values than the MODIS LAI product. The mean LAI trend values for deciduous needleleaf and deciduous broadleaf forests are closest between the two LAI products, with differences of 0.06 and 0.09, respectively. The most pronounced difference is observed for bamboo forests, with a difference of 0.18. For the MODIS LAI product, the mean LAI trend values in evergreen needleleaf forests, mixed forests, deciduous broadleaf forests, bamboo forests, and grasses/cereal crops are relatively similar, with the maximum LAI value for grasses/cereal crops at 0.35; the annual mean LAI for deciduous needleleaf forests exhibit the smallest increase, with a mean LAI trend value of 0.08. The overall annual mean LAI trends value across all vegetation types is 0.28 for the MODIS LAI product. For the GLASS LAI product, bamboo forests show the greatest increase in annual mean LAI trend, with a value of 0.51, followed by grasses/cereal crops at 0.50; deciduous needleleaf forests again exhibit the smallest increase, with an annual mean trend value of 0.14.

4.2. Consistency of LAI Products Under the Influence of Topographic Factors

4.2.1. Consistency in the Distribution of LAI Products with Aspect and Slope

The area ratio of different vegetation types varies with slope. Grasses/cereal crops are shown in Figure 11; we found that mixed forests and deciduous broadleaf forests all occupy significant proportions across different slopes. Within the slope range of 0–10°, grasses/cereal crops constitute the largest proportion, accounting for 64% of the area. As the slope increases, the area ratio of mixed forests becomes the largest among the vegetation types.
Figure 12a shows variations of the mean values of the MODIS and GLASS LAI products with aspect. Both LAI products exhibit a certain degree of difference between sunny and shady slopes. The mean values of MODIS and GLASS LAI products are maximized on sunny slopes and minimized on shady slopes. The order of the mean values for the MODIS and GLASS LAI products under different aspects is sunny slope > semi-sunny slope > semi-shady slope > shady slope. The maximum mean LAI values are 0.43 and 0.71, respectively, while the minimum mean LAI values are 0.32 and 0.62, respectively. The LAI differences between sunny and shady slopes are 0.11 and 0.09, respectively. Figure 12b illustrates variations of the mean values of the MODIS and GLASS LAI products with slope. The mean values of both LAI products show a trend of increasing, then stabilizing and then fluctuating with increasing slope. When the slope is between 0 and 10°, the increase of the mean values of the GLASS LAI product compared to MODIS LAI is large for slopes of 0–10°. When the slope is 10–40° level, the mean values of the MODIS and GLASS LAI product exhibit a relatively stable trend, with mean values of 0.38 and 0.67, respectively. When the slope exceeds 40°, the mean values of both LAI products fluctuate significantly, especially for the mean values of the MODIS LAI product, which sharply decreases from the maximum value (0.43) to the minimum value (0.26) in the 60–70° range.

4.2.2. Consistency in the Distribution of LAI Products with Elevation

Figure 13 shows the area ratio of different vegetation types varying with elevation. At elevations below 1000 m, grasses/cereal crops constitute the largest proportion, accounting for 80% of the area. Between 1000 and 2500 m in elevation, mixed forests and deciduous broadleaf forests occupy a significant proportion. At elevations ranging from 2500 to 3000 m, evergreen needleleaf forests have the largest proportion, followed by mixed forests. Above 3000 m in elevation, the diversity of vegetation types decreases, with grasses/cereal crops once again occupying a larger proportion.
Variations characteristics of the mean values of the MODIS and GLASS LAI products with elevation are shown in Figure 14. Overall, the mean values of the MODIS and GLASS LAI products initially increase and then decrease. The MODIS LAI product reaches its maximum mean of 3.71 at 1700 m and decreases thereafter, bottoming out at 0.42 at 3700 m. GLASS LAI peaks at 5.14 at 1850 m and minimizes at 0.86 at 3675 m. Poor consistency between the MODIS and GLASS LAI product is observed within the 1450–2450 m range. Figure 15 reveals that in part of the Qinling Mountains, a mid-elevation zone, the mean value of the GLASS LAI product consistently exceeds the MODIS LAI product with notable differences over extensive areas. In contrast, the complex and high-altitude terrain of the northwestern Qinling Mountains sees better agreement between two LAI products. In the relatively flat central and eastern parts of the Qinling Mountains, areas where the mean value of the MODIS LAI product exceeds the GLASS LAI product are more prevalent.

4.3. Direct Validation

Direct validation of the MODIS and GLASS LAI products was conducted using ground-measured LAI data. Figure 16 presents a scatterplot of the MODIS and GLASS LAI values versus the values of LAI measurement. An evaluation of the quality of the two LAI products was performed by comparing 18 sets of ground-measured LAI data with their respective MODIS and GLASS LAI values, employing regression analysis, correlation coefficients, root mean square errors (RMSEs), and mean absolute error (MAE). Compared to ground-measured LAI data, the GLASS LAI product exhibits superior correlation (R2 = 0.33) and accuracy (RMSE = 1.62, MAE = 0.61) compared to MODIS LAI (R2 = 0.24, RMSE = 1.61, MAE = 0.68).
In the Qinling Mountains, both LAI products exhibit noticeable biases, with sample point results generally more dispersed relative to a 1:1 line distribution. Ground-measured LAI values cluster between 3 and 5, with maximum and minimum values occurring on November 22nd and August 2nd, respectively, at 3.42 and 4.31. In contrast, the MODIS LAI and GLASS LAI ranges are 0–5.5 and 1–6, respectively, with their respective maximum and minimum values aligning temporally with those of the ground-based records. For the MODIS LAI product, there are some overestimation and underestimation of LAI values in June-August and September-November, respectively, while the LAI values in June-September and October-November in the GLASS LAI product are overestimated and underestimated, respectively. Overall, LAI values from both LAI products deviate from ground-measured LAI values within three LAI units, which may be attributed to the inherent reliability of remote sensing products warranting further investigation or to the complex topography of the Qinling Mountains.

5. Discussion

5.1. Analysis of Spatio-Temporal Consistency of LAI Products

This study reveals that the MODIS LAI product exhibits a larger proportion of missing values compared to the GLASS LAI product, consistent with Xiao et al.’s [28] conclusion that the GLASS LAI product exhibited better spatio-temporal integrity at the global scale, while the MODIS LAI product experiences 100% missing values in various vegetation types. The presumed reason is that missing values are related to the topographic characteristics of the region, and the mountainous areas have a complex topography and relatively large cloud cover, and the GLASS LAI product’s inversion algorithm incorporates filtering preprocessing of reflectance data, effectively reducing the adverse impact of factors like clouds and snow on reflectance, in contrast to the MODIS LAI product [43]. Both the MODIS LAI and GLASS LAI products exhibit distinct seasonal variations, with the annual mean LAI values ranging from 0 to 1 in January and 3 to 6 in July over a 21-year period, similar to the findings of Liu et al. [10] and Li et al. [32]. Studies have indicated that the credibility of the MODIS LAI and GLASS LAI products differs in various regions: Jin et al. [44] found that the reliability of the GLASS LAI product in mountainous areas of southwest China is slightly inferior to that of the MODIS LAI product; Liu et al. [45] suggested that the quality of the GLASS LAI product in forest areas is higher than the MODIS LAI product; Shen et al. [46] observed significant overestimation of the GLASS LAI values in Inner Mongolia. Our study also demonstrates that the GLASS LAI product outperforms the MODIS LAI product in the Qinling Mountains. For the two vegetation types of deciduous broadleaf forests and evergreen broadleaf forests, the frequency distributions of LAI values differ significantly between the MODIS and GLASS LAI products, aligning with Xiao et al.’s [41] findings. In the region of evergreen needleleaf forests, the LAI frequency distributions of the two LAI products exhibit minimal differences, differing from the results of Jin et al. [44] and Yu et al. [10], who found relatively consistent LAI distributions between the two LAI products in grasses/cereal crops. This may be attributed to the selected land cover classification and frequency distribution information obtained from specific years. Among the three vegetation types of bamboo forests, deciduous needleleaf forests, and evergreen broadleaf forests, the monthly variations in the difference between the two LAI products are most pronounced. There are relatively few relevant articles on the monthly differences between the GLASS and MODIS LAI products under different vegetation types in the study area, and no further comparative analysis is conducted here. The underlying reason is speculated to be the differences in inversion algorithms and parameters related to land cover inputs during inversion, resulting in significant and irregular fluctuations in the monthly mean values of some vegetation types [47].
This study reveals that among various vegetation types, the GLASS LAI product exhibits the most continuous and smooth temporal profile characteristics. The algorithm of the GLASS LAI product eliminates sudden spikes and troughs, yielding a smoothed LAI time series, albeit potentially at the expense of omitting adjacent minor peaks [48]. The time series of the MODIS LAI product consistently demonstrate a bimodal distribution across vegetation types. Li et al. [32] have shown that in grasses/cereal crops areas, the unique growth pattern of winter wheat, which matures and is harvested in June causing a trough of LAI values, contributes to this phenomenon. Li et al. [49] further asserted that a bimodal trend in forest regions is anomalous, potentially attributable to the complex and diverse topography of the study area leading to mixed pixels of farmland and forest, along with pixel interactions, which distort LAI temporal profiles from the expected growth pattern of vegetation. We find that during non-growing seasons, both the MODIS and GLASS LAI products struggle to accurately depict LAI values of evergreen vegetation in the Qinling Mountains, a limitation potentially linked to underlying surface complexity and mixed pixels [50]. The LAI changes mainly show an increasing trend, and the proportion of areas with significant increase in the time series of the MODIS and GLASS LAI product are 80.65% and 98.08%, respectively, which coincided with Bai’s conclusion that the proportion of areas with significant improvement in the vegetation cover condition in the Qinba Mountains was 87.8%. Implementation of measures such as the Conversion of Cropland to Forest program, the Yangtze River Shelterbelt project, and the Natural Forest Protection program has visibly ameliorated the ecological environment of most forested areas in the Qinling Mountains [42].

5.2. Uncertainty Analysis of LAI Products in Mountainous Areas

The MODIS and GLASS LAI products exhibit contrasting patterns between sunny and shady slopes, with both LAI products consistently reporting the highest mean LAI values on sunny slopes and the lowest on shady slopes, contradicting the finding by [15] that vegetation growth was more vigorous on shady slopes than sunny slopes in the Qinling Mountains. The northern slopes of the Qinling Mountains, being shaded, receive weaker sunlight, exhibit lower evaporation rates and ground temperatures compared to sunny slopes, resulting in relatively moister soil conditions. Consequently, they respond more rapidly to drought conditions than the southern slopes, rendering shady slopes more conducive to vegetation growth [51]. Relevant research indicated that terrain fluctuations induce differences in reflectance captured by remote sensing data between sunny and shady slopes, which subsequently impacts the inversion of LAI, leading to lower estimated LAI values on shady slopes compared to sunny slopes [14].
As the slope increases, the mean values of both LAI products initially rise, stabilize, and then exhibit fluctuating changes. In relatively flat terrains, frequent human activities contribute to suboptimal vegetation growth conditions [52]. With steeper slopes, reduced human intervention coupled with policies promoting afforestation, returning farmland to forests and grasslands, leads to a transition from increasing to stabilizing LAI trends. As slopes further intensify, intensified soil erosion, thinner soil layers, and reduced water retention capacity limit vegetation growth, resulting in decreased LAI values [53]. The mean values of the GLASS LAI product exhibit a more pronounced increase than the MODIS LAI product within slopes of 0–10°. MODIS LAI exhibits more substantial fluctuations beyond slopes of 40°. This is hypothesized to stem from the high surface heterogeneity and prevalent cloud cover in the Qinling Mountains, where the differing sensitivity of the inversion algorithms relied upon by the two LAI remote sensing products to noise results in disparate performance [54].
As altitude increases, the mean values of the MODIS and GLASS LAI product generally exhibit a trend of initially rising and then declining. In lower-altitude regions, vegetation growth is poor and LAI values are low due to external factors such as human activities and river erosion [55]. With rising altitude, external disturbances diminish, leading to optimal vegetation growth in the Qinling Mountains between 1450 and 2450 m above sea level. Beyond 2450 m, vegetation growth deteriorates progressively due to limitations in rainfall and heat conditions, resulting in decreasing LAI values [56]. Within the altitude range of 1450–2450 m, the mean values of the GLASS LAI product are significantly higher than those of the MODIS LAI product, primarily distributed in the southern Qinling Mountains. [6] noted that when LAI values exceeded 3 or 4, values of the MODIS LAI product might be underestimated due to optical reflectance saturation and terrain shading. Topographic factors impact variations of LAI values in mountainous areas, necessitating further clarification in future research to support the production of high-precision remote sensing LAI products in mountainous areas.

5.3. Accuracy Validation of LAI Products

We evaluated the MODIS and GLASS LAI products using ground-measured LAI data, concluding that the GLASS LAI product exhibits higher correlation and accuracy. This finding aligns with the global comparison and validation of LAI products conducted by Xiao et al. [41] and the assessment of LAI product accuracy in the Heilongjiang province by Liu et al. [11]. However, it is noteworthy that the sample point distributions of both LAI products are relatively dispersed compared to the 1:1 line. The quantity and representativeness of ground-measured data are the primary factors influencing the validation results. Continuous ground-based LAI observations can facilitate a more reliable exploration of the validation outcomes [57]. Furthermore, the inversion algorithms of both LAI products utilize land cover data as crucial input parameters, and incorrect land cover classification can affect the inversion results of LAI products [58]. High-quality and consistent land surface reflectance, vegetation type data, and superior inversion algorithms will significantly enhance the accuracy of LAI products.

6. Conclusions

LAI is an important parameter to describe vegetation growth, and exploring the topographic characteristics and spatio-temporal variations of LAI products holds significant importance in assessing the carbon sink function. This study conducted a comparative analysis of the spatio-temporal variations and topographic effects of the MODIS LAI and GLASS LAI products in the Qinling Mountains from 2001 to 2021. The precision and accuracy of the two LAI products by ground-measured LAI data were quantitatively evaluated. The main conclusions are as follows:
(1)
For spatial consistency, GLASS LAI values are generally higher than MODIS LAI values. The proportions of pixels with higher GLASS LAI values compared to MODIS LAI values in January and July are 99.89% and 97.14%, respectively. For different vegetation types, the difference in LAI frequency distribution between the two LAI products is small for evergreen needleleaf forests. The MODIS LAI values exhibit a higher frequency within the range of 2.5 to 3.5, while the GLASS LAI product displays peak frequencies within the LAI range of 2.5 to 4.5. For temporal consistency, the temporal series curve of the GLASS LAI product is smoother, while the temporal series of the MODIS LAI product is more erratic, particularly with sudden peaks, troughs, and low values during the growing season. The LAI changes in the Qinling Mountains mainly show an increasing trend, with 96.09% and 98.71% of the regions demonstrating a positive change for the two LAI products, respectively, while 0.35% and 0.37% of the regions exhibit a significant decrease.
(2)
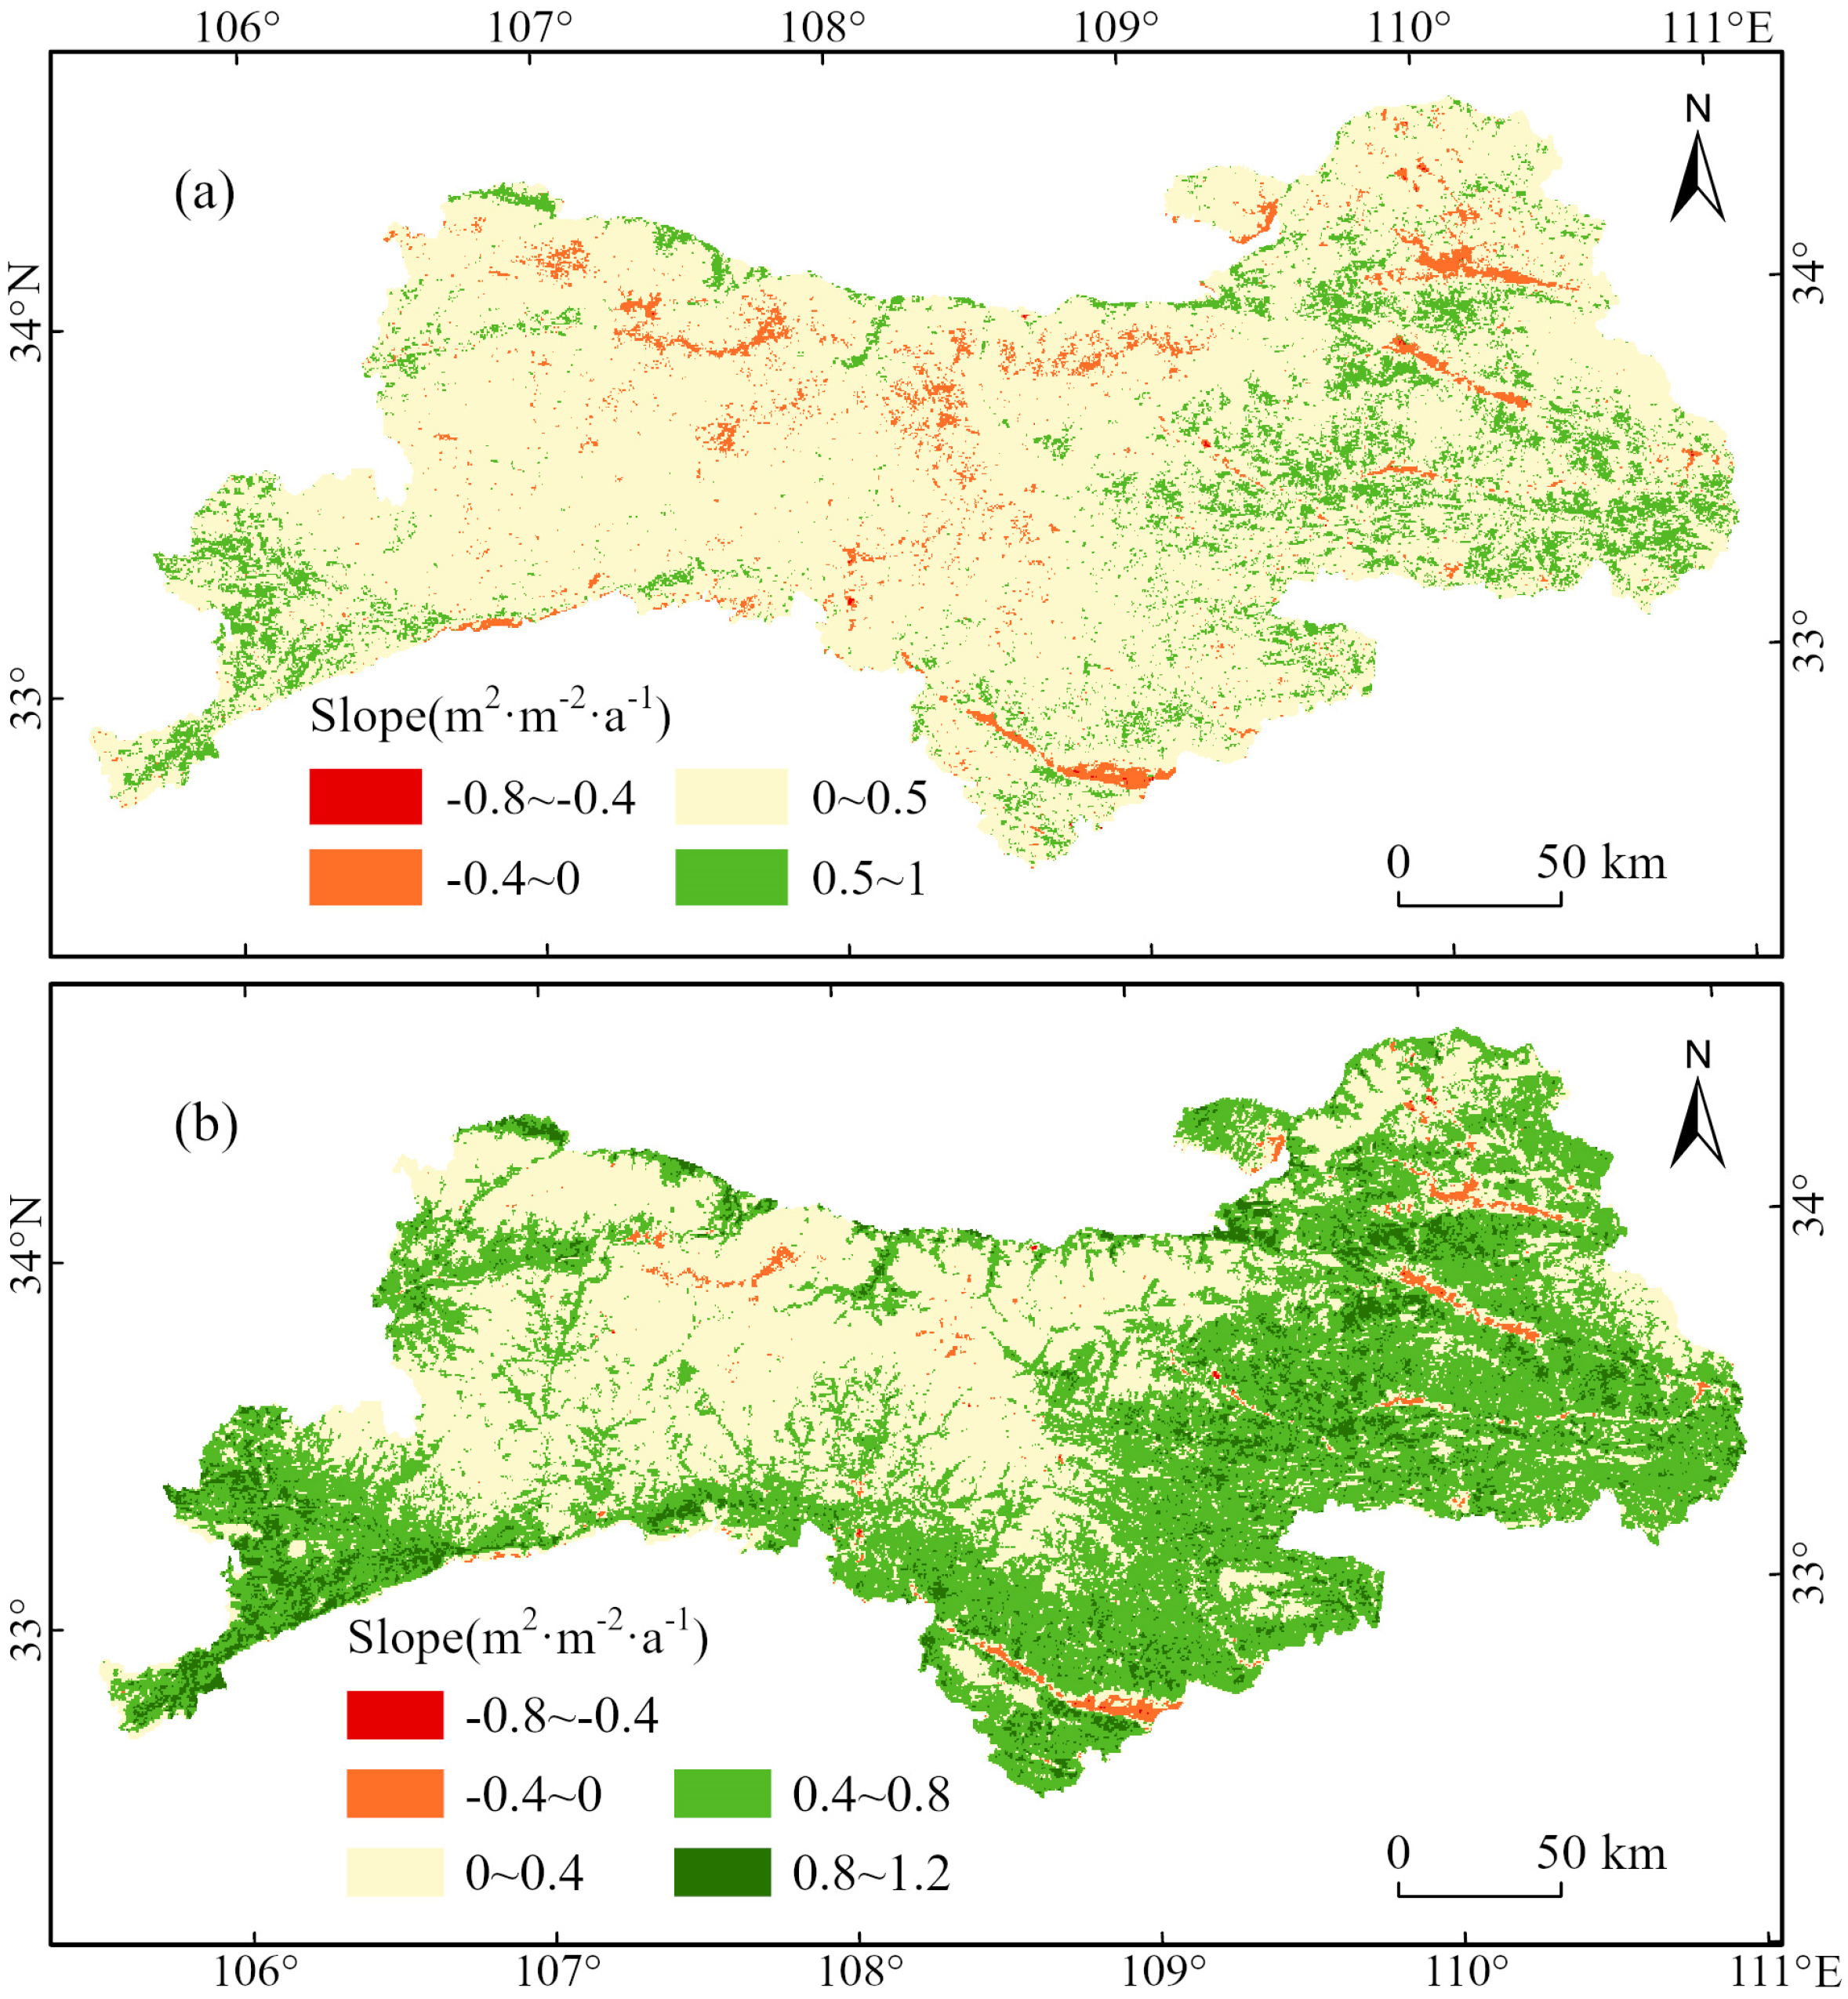
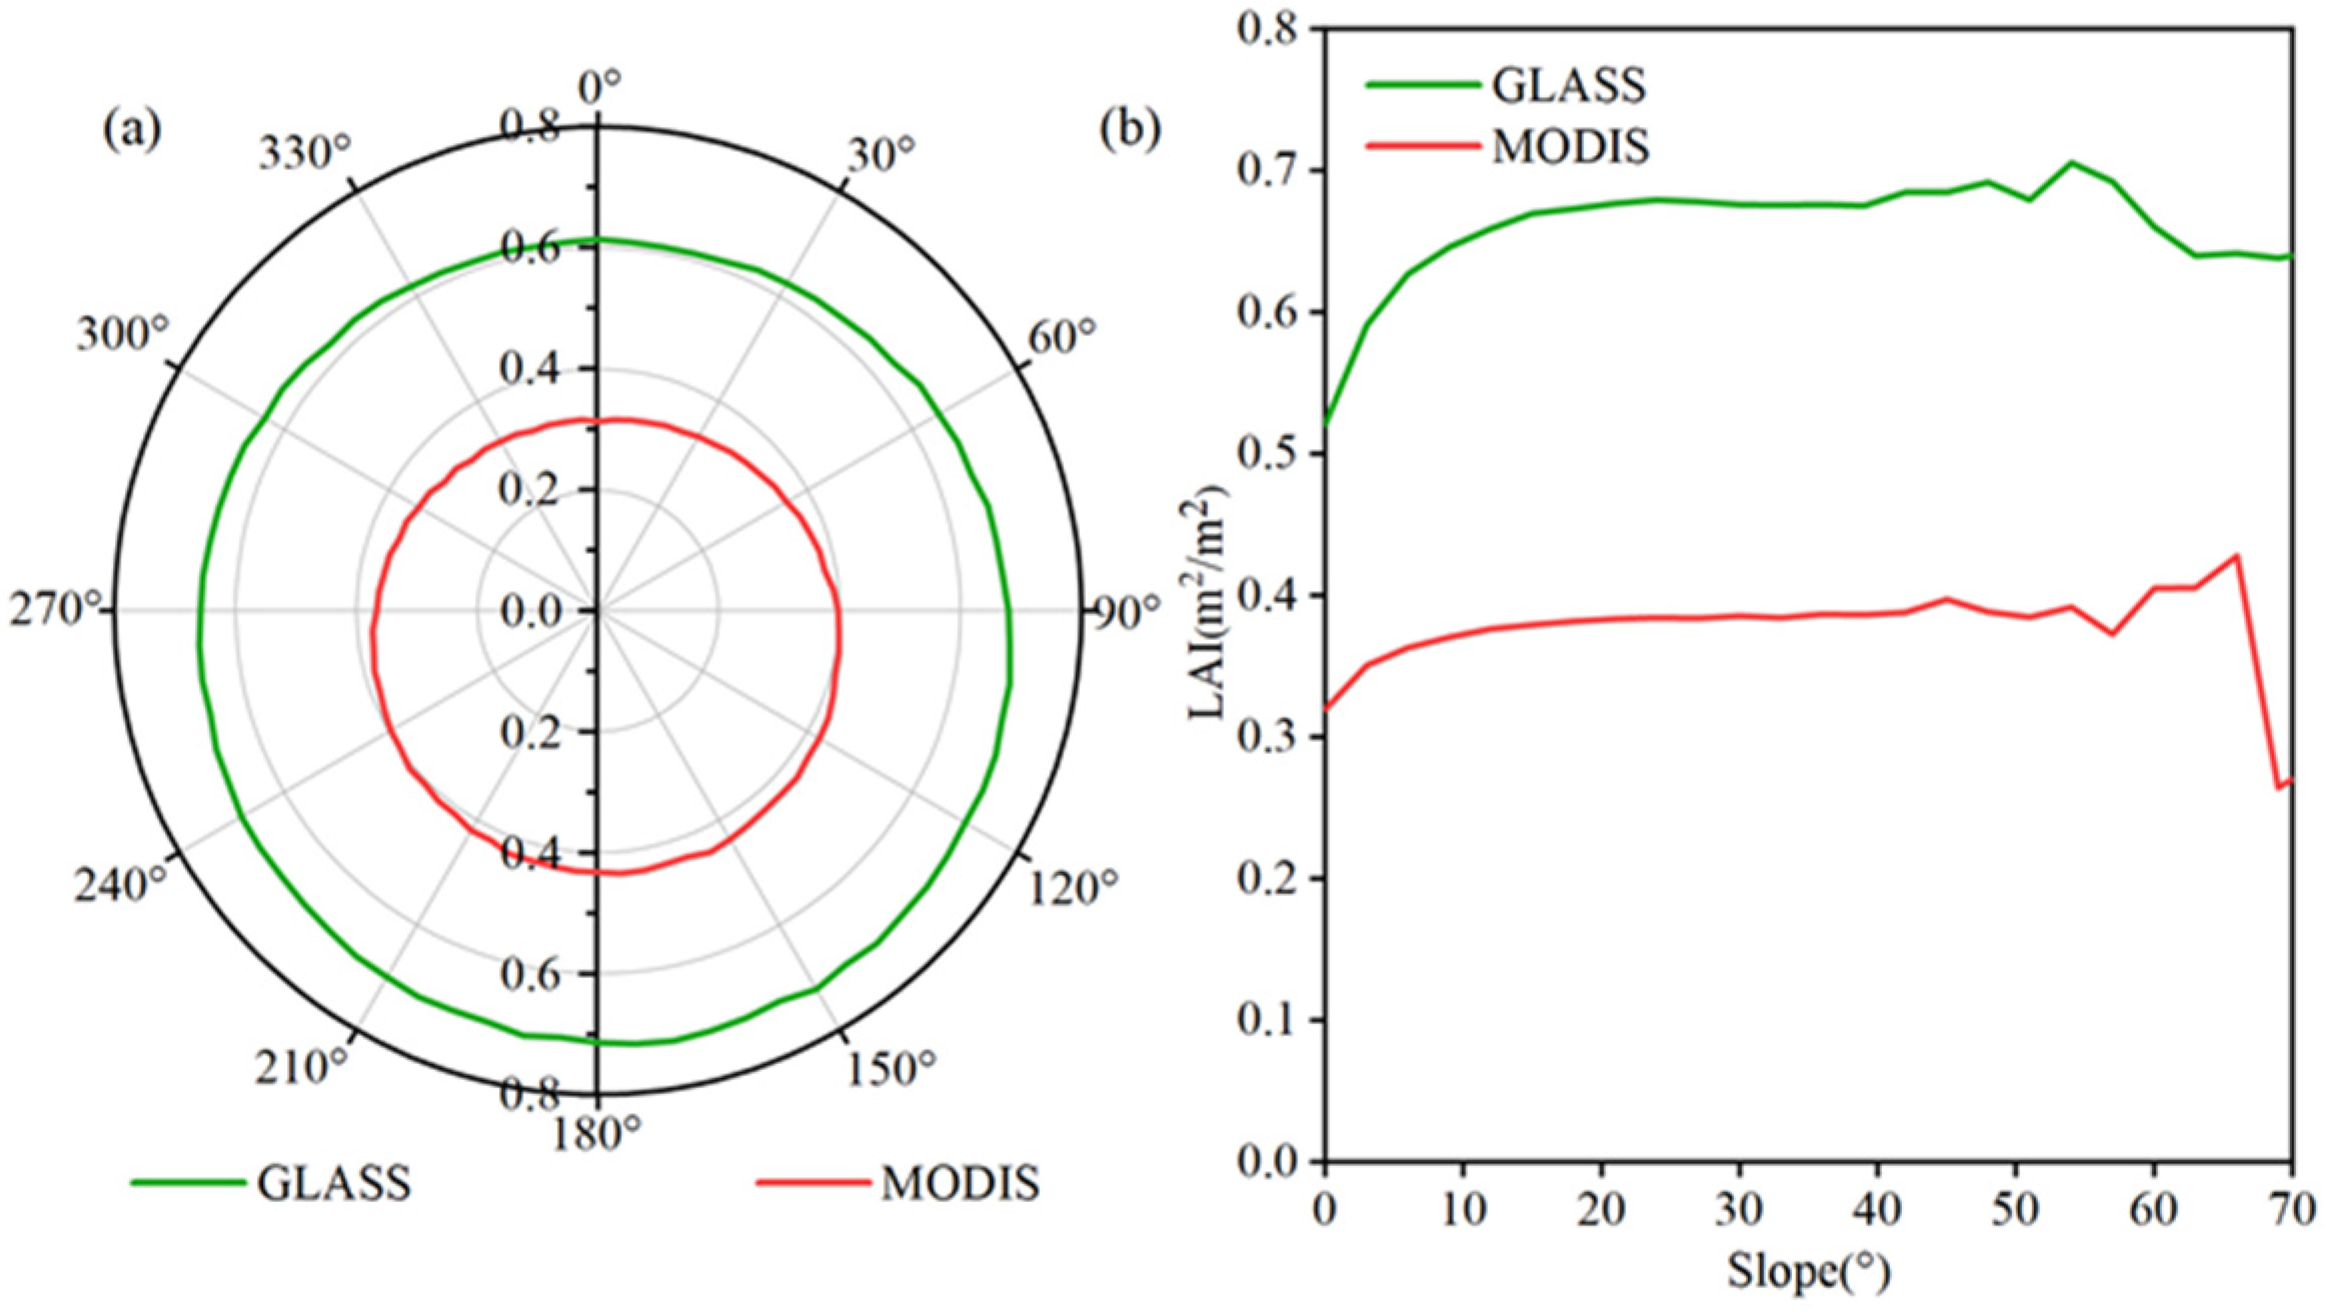
The MODIS and GLASS LAI products exhibit disparities between sunny and shady slopes, with the mean LAI peaking on sunny slopes and minimizing on shady slopes for both. Within various slope ranges, the mean values of both LAI products primarily maintain stability or increase. Notably, at slopes of 0–10°, the mean values of the GLASS LAI product demonstrate a marked increasing trend compared to the MODIS LAI product. Conversely, at slopes exceeding 40°, the mean values of the MODIS LAI product exhibit pronounced fluctuations. As altitude increases, the mean values of both the MODIS and GLASS LAI product generally follow an initial increase and subsequent decrease trend. Specifically, at an elevation of 1450–2450 m, the mean values of the GLASS LAI product significantly surpass the MODIS LAI product, predominantly distributed in the southern Qinling Mountains.
(3)
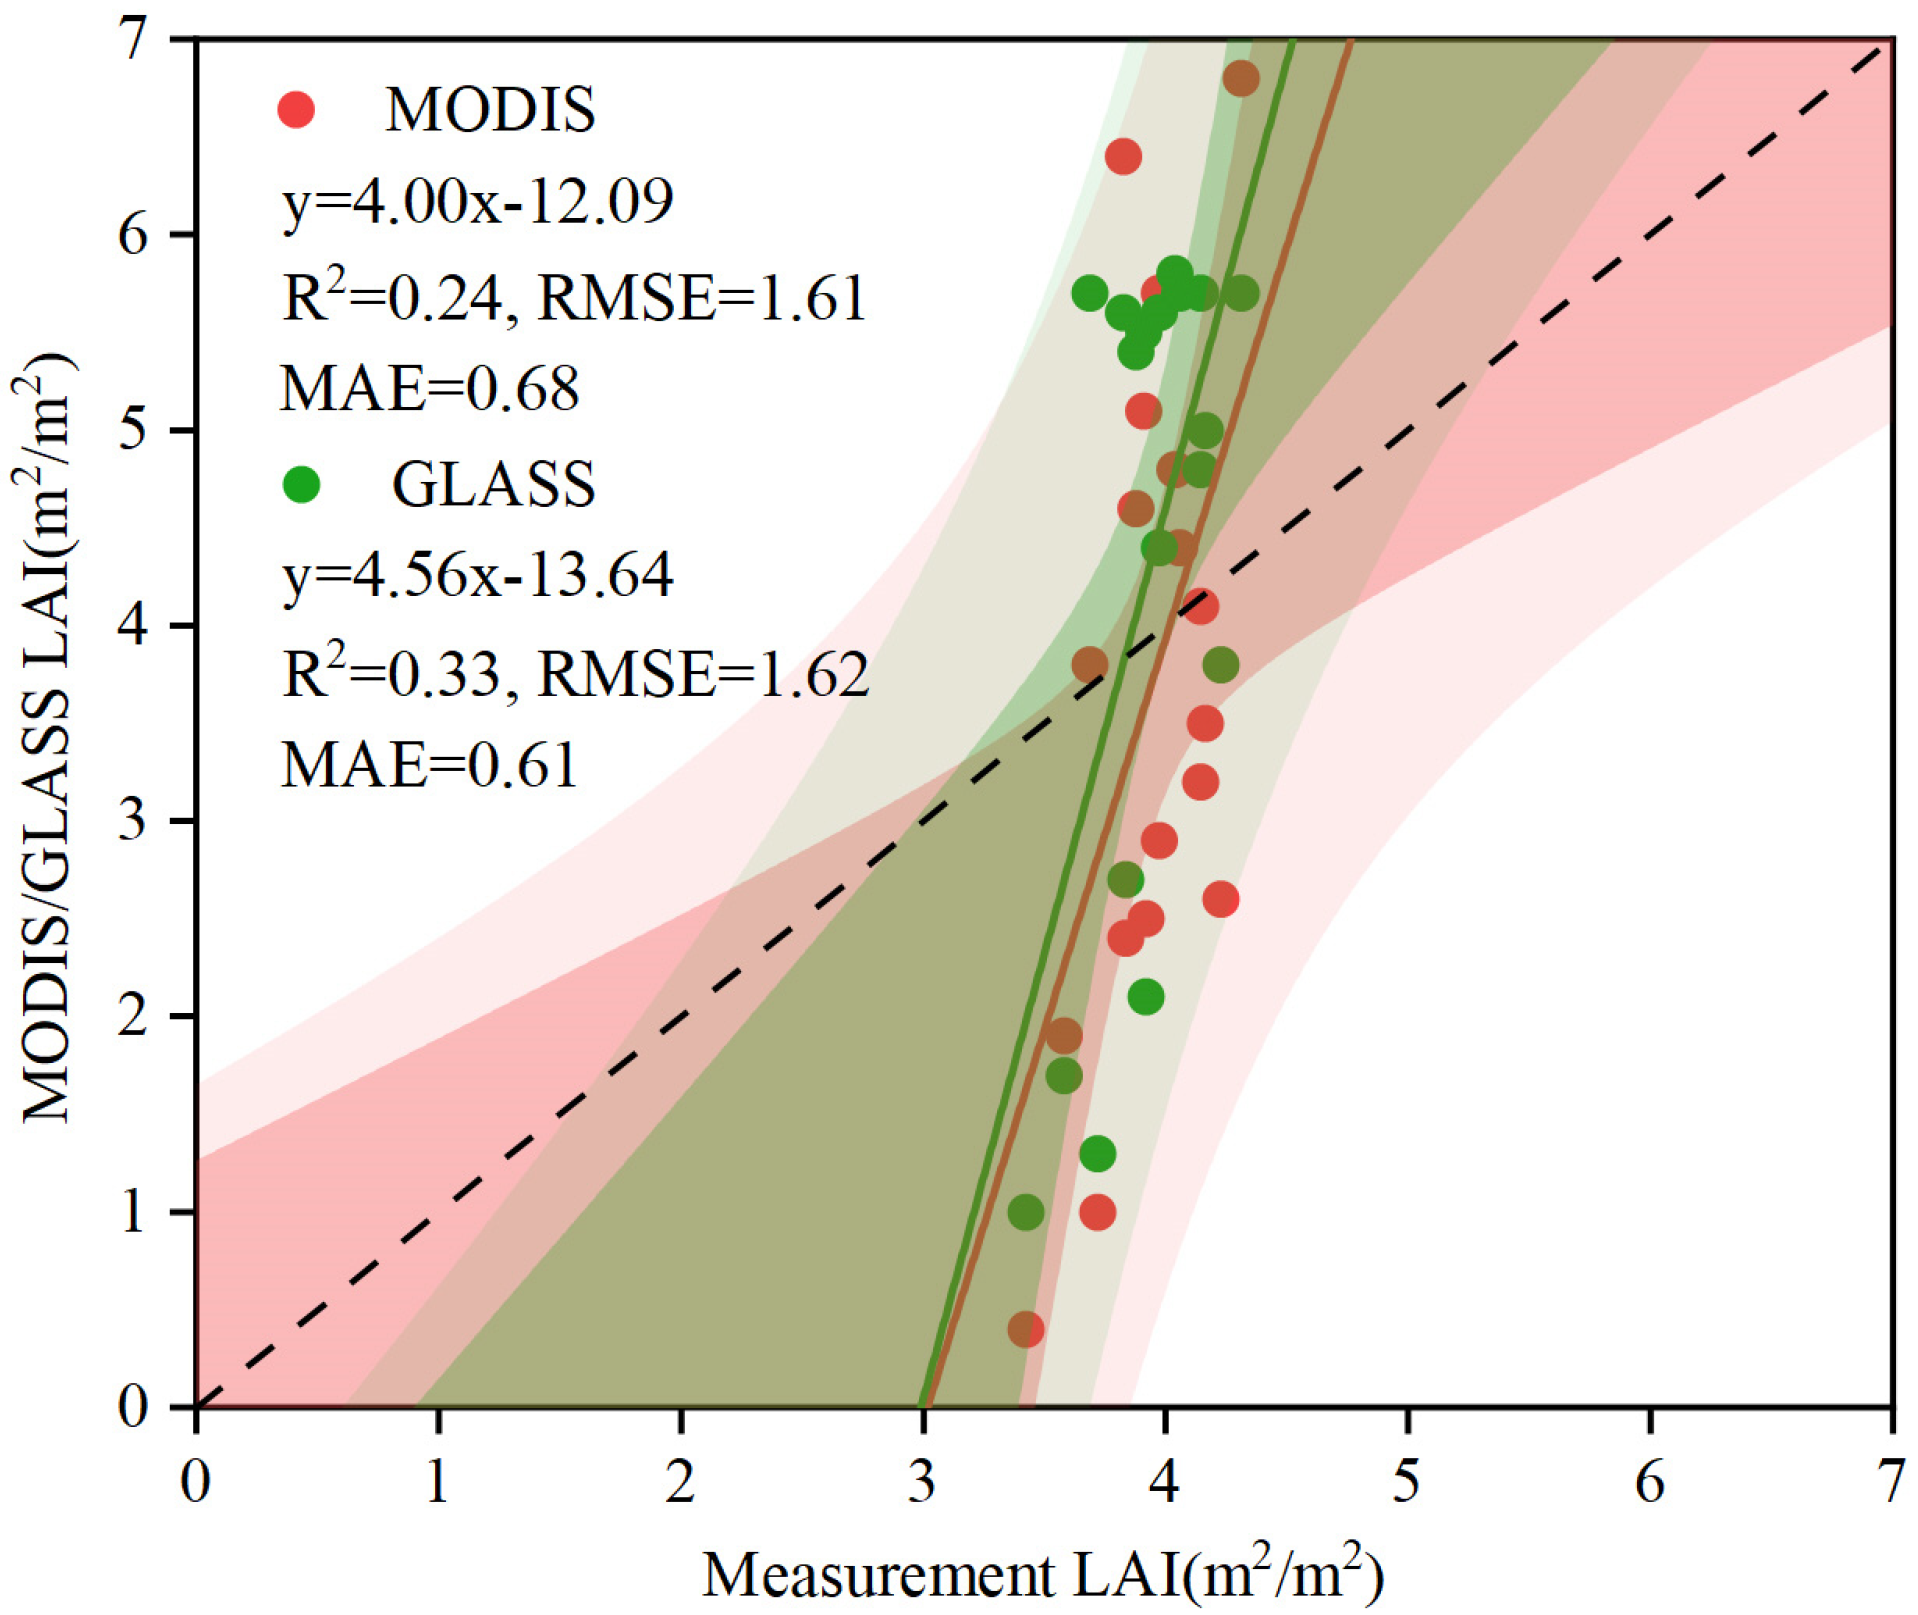
Compared with ground-measured LAI data, the GLASS LAI product (R2 = 0.33, RMSE = 1.62) exhibits higher accuracy and correlation, while the MODIS LAI product (R2 = 0.24, RMSE = 1.61) performs relatively poorly. In the Qinling Mountains, both LAI products exhibit certain deviations, and the overall distribution of the sample results exhibits considerable dispersion relative to the 1:1 line distribution.

Author Contributions

Conceptualization, J.Z., M.W. and X.W.; data curation, J.Z., M.W. and X.W.; formal analysis, J.Z.; funding acquisition, M.L. (Mengyun Liu) and X.W.; investigation, J.Z., M.L. (Mingyue Liang) and Y.G.; methodology, J.Z., M.W., M.L. (Mingyue Liang), Y.G. and M.L.T.; project administration, M.L. (Mengyun Liu) and X.W.; resources, M.L. (Mengyun Liu) and X.W.; software, J.Z., M.W. and M.L. (Mingyue Liang); supervision, M.L. (Mengyun Liu) and X.W.; validation, J.Z.; visualization, J.Z. and M.W.; writing—original draft, J.Z.; writing—review and editing, X.W. All authors have read and agreed to the published version of the manuscript.

Funding

This study was funded by the National Key R&D Program of China (2022YFE0115300), the Young Scientist Award of Shaanxi Province (2024JC-YBQN-0263).

Data Availability Statement

The MOD15A2H Version 6 Level 4 land product is available on https://ladsweb.modaps.eosdis.nasa.gov/ (accessed on 6 May 2024). The GLASS LAI product is available on https://www.geodata.cn (accessed on 6 May 2024). The LAI measurement data are available on request from the authors. The vegetation type data are provided by Li et al. (https://doi.org/10.3390/rs6065325, accessed on 8 May 2024). The SRTM DEM is available on https://search.earthdata.nasa.gov/search (accessed on 8 May 2023).

Conflicts of Interest

The authors declare no conflicts of interest.

References

  1. Chen, J.; Black, T. Defining Leaf Area Index for non-flat leaves. Plant Cell Environ. 1992, 15, 421–429. [Google Scholar] [CrossRef]
  2. Jin, H.; Li, A.; Wang, J.; Bo, Y. Improvement of spatially and temporally continuous crop leaf area index by integration of CERES-Maize model and MODIS data. Eur. J. Agron. 2016, 78, 1–12. [Google Scholar] [CrossRef]
  3. Wulder, M.A.; Hall, R.J.; Coops, N.C.; Franklin, S.E. High spatial resolution remotely sensed data for ecosystem characterization. Bioscience 2004, 54, 511–521. [Google Scholar] [CrossRef]
  4. Luo, S.; Wang, C.; Zhang, G.; Xi, X.; Li, G. Forest leaf area index (LAI) inversion using airborne LiDAR data. Chin. J. Geophys. 2013, 56, 1467–1475. [Google Scholar] [CrossRef]
  5. Mthembu, N.; Lottering, R.; Kotze, H. Forest, Crop and Grassland Leaf Area Index Estimation Using Remote Sensing: A Review of Current Research Methods, Sensors, Estimation Models and Accomplishments. Appl. Sci. 2023, 13, 4005. [Google Scholar] [CrossRef]
  6. Fang, H.; Baret, F.; Plummer, S.; Schaepman-Strub, G. An Overview of Global Leaf Area Index (LAI): Methods, Products, Validation, and Applications. Rev. Geophys. 2019, 57, 739–799. [Google Scholar] [CrossRef]
  7. Luo, X.; Jin, L.; Tian, X.; Chen, S.; Wang, H. A High Spatiotemporal Enhancement Method of Forest Vegetation Leaf Area Index Based on Landsat8 OLI and GF-1 WFV Data. Remote Sens. 2023, 15, 2812. [Google Scholar] [CrossRef]
  8. Kobayashi, T.; Kobayashi, H.; Yang, W.; Murakami, H.; Honda, Y.; Nasahara, K.N. The development of a global LAI and FAPAR product using GCOM-C / SGLI data. Isprs J. Photogramm. 2023, 202, 479–498. [Google Scholar] [CrossRef]
  9. Li, J.; Xiao, Z. Evaluation of the version 5.0 global land surface satellite (GLASS) leaf area index product derived from MODIS data. Int. J. Remote Sens. 2020, 41, 9140–9160. [Google Scholar] [CrossRef]
  10. Yu, H.; Yin, G.; Liu, G.; Ye, Y.; Qu, Y.; Xu, B.; Verger, A. Validation of Sentinel-2, MODIS, CGLS, SAF, GLASS and C3S Leaf Area Index Products in Maize Crops. Remote Sens. 2021, 13, 4529. [Google Scholar] [CrossRef]
  11. Liu, T.; Jin, H.; Li, A.; Fang, H.; Wei, D.; Xie, X.; Nan, X. Estimation of Vegetation Leaf-Area-Index Dynamics from Multiple Satellite Products through Deep-Learning Method. Remote Sens. 2022, 14, 4733. [Google Scholar] [CrossRef]
  12. Zhang, W.; Jin, H.; Shao, H.; Li, A.; Li, S.; Fan, W. Temporal and Spatial Variations in the Leaf Area Index and Its Response to Topography in the Three-River Source Region, China from 2000 to 2017. Isprs Int. J. Geo-Inf. 2021, 10, 33. [Google Scholar] [CrossRef]
  13. Pasolli, L.; Asam, S.; Castelli, M.; Bruzzone, L.; Wohlfahrt, G.; Zebisch, M.; Notarnicola, C. Retrieval of Leaf Area Index in mountain grasslands in the Alps from MODIS satellite imagery. Remote Sens. Environ. 2015, 165, 159–174. [Google Scholar] [CrossRef]
  14. Yu, W.; Li, J.; Liu, Q.; Yin, G.; Zeng, Y.; Lin, S.; Zhao, J. A Simulation-Based Analysis of Topographic Effects on LAI Inversion Over Sloped Terrain. IEEE J. Sel. Top. Appl. Earth Obs. Remote Sens. 2020, 13, 794–806. [Google Scholar] [CrossRef]
  15. Qi, G.; Song, J.; Li, Q.; Bai, H.; Sun, H.; Zhang, S.; Cheng, D. Response of vegetation to multi-timescales drought in the Qinling Mountains of China. Ecol. Indic. 2022, 135, 108539. [Google Scholar] [CrossRef]
  16. Shi, X.; Yang, Z.; Dong, Y.; Zhou, B. Tectonic uplift of the northern Qinling Mountains (Central China) during the late Cenozoic: Evidence from DEM-based geomorphological analysis. J. Asian Earth Sci. 2019, 184, 104005. [Google Scholar] [CrossRef]
  17. Shao, Y.; Mu, X.; He, Y.; Sun, W.; Zhao, G.; Gao, P. Spatiotemporal variations of extreme precipitation events at multi-time scales in the Qinling-Daba mountains region, China. Quatern Int. 2019, 525, 89–102. [Google Scholar] [CrossRef]
  18. Yu, F.; Li, C.; Yuan, Z.; Luo, Y.; Yin, Q.; Wang, Q.; Hao, Z. How do mountain ecosystem services respond to changes in vegetation and climate? An evidence from the Qinling Mountains, China. Ecol. Indic. 2023, 154, 110922. [Google Scholar] [CrossRef]
  19. Lan, X.; Li, W.; Tang, J.; Shakoor, A.; Zhao, F.; Fan, J. Spatiotemporal variation of climate of different flanks and elevations of the Qinling–Daba mountains in China during 1969–2018. Sci. Rep. 2022, 12, 6952. [Google Scholar] [CrossRef]
  20. Wang, B.; Xu, G.; Li, P.; Li, Z.; Zhang, Y.; Cheng, Y.; Jia, L.; Zhang, J. Vegetation dynamics and their relationships with climatic factors in the Qinling Mountains of China. Ecol. Indic. 2020, 108, 105719. [Google Scholar] [CrossRef]
  21. Cui, L.; Zhao, Y.; Liu, J.; Wang, H.; Han, L.; Li, J.; Sun, Z. Vegetation Coverage Prediction for the Qinling Mountains Using the CA–Markov Model. Isprs Int. J. Geo-Inf. 2021, 10, 679. [Google Scholar] [CrossRef]
  22. Zhang, Y.; Cui, Q.; Huang, Y.; Wu, D.; Zhou, A. Vegetation Response to Holocene Climate Change in the Qinling Mountains in the Temperate-Subtropical Transition Zone of Central-East China. Front. Ecol. Evol. 2021, 9, 734011. [Google Scholar] [CrossRef]
  23. You, Y.; Li, W.; Chen, Y.; Zhang, Q.; Zhang, K. Soil carbon and nitrogen accumulation during long-term natural vegetation restoration following agricultural abandonment in Qingling Mountains. Ecol. Eng. 2024, 201, 107212. [Google Scholar] [CrossRef]
  24. Myneni, R.B.; Hoffman, S.; Knyazikhin, Y.; Privette, J.L.; Glassy, J.; Tian, Y.; Wang, Y.; Song, X.; Zhang, Y.; Smith, G.R.; et al. Global products of vegetation leaf area and fraction absorbed PAR from year one of MODIS data. Remote Sens. Environ. 2002, 83, 214–231. [Google Scholar] [CrossRef]
  25. Knyazikhin, Y.; Martonchik, J.V.; Myneni, R.B.; Diner, D.J.; Running, S.W. Synergistic algorithm for estimating vegetation canopy leaf area index and fraction of absorbed photosynthetically active radiation from MODIS and MISR data. J. Geophys. Res. Atmos. 1998, 103, 32257–32275. [Google Scholar] [CrossRef]
  26. Jin, W.; Zhang, Z.; Wu, T.; Meng, K.; Wang, Q.; Tong, W.; Wang, C.; Yin, G.; Xu, B. Retrieval of Leaf Area Index from MODIS Surface Reflectance by Incorporating the Subpixel Information from Decametric-Resolution Data. IEEE T. Geosci. Remote 2024, 62, 1–17. [Google Scholar] [CrossRef]
  27. Xiao, Z.; Wang, T.; Liang, S.; Sun, R. Estimating the Fractional Vegetation Cover from GLASS Leaf Area Index Product. Remote Sens. 2016, 8, 337. [Google Scholar] [CrossRef]
  28. Xiao, Z.; Liang, S.; Wang, J.; Chen, P.; Yin, X.; Zhang, L.; Song, J. Use of general regression neural networks for generating the GLASS Leaf Area Index Product from Time Series MODIS Surface Reflectance. Geosci. Remote Sens. IEEE Trans. On. 2014, 52, 209–223. [Google Scholar] [CrossRef]
  29. Baret, F.; Hagolle, O.; Geiger, B.; Bicheron, P.; Miras, B.; Huc, M.; Berthelot, B.; Niño, F.; Weiss, M.; Samain, O.; et al. LAI, fAPAR and fCover CYCLOPES global products derived from VEGETATION: Part 1: Principles of the algorithm. Remote Sens. Environ. 2007, 110, 275–286. [Google Scholar] [CrossRef]
  30. Tang, H.; Yu, K.; Hagolle, O.; Jiang, K.; Geng, X.; Zhao, Y. A cloud detection method based on a time series of MODIS surface reflectance images. Int. J. Digit. Earth 2013, 6, 157–171. [Google Scholar] [CrossRef]
  31. Frederic, B.; Morisette, J.; Fernandes, R.; Champeaux, J.; Myneni, R.; Chen, J.; Plummer, S.; Weiss, M.; Bacour, C.; Garrigues, S.; et al. Evaluation of the representativeness of networks of sites for the global validation and intercomparison of land biophysical products: Proposition of the CEOS-BELMANIP. IEEE T. Geosci. Remote Sens. 2006, 44, 1794–1803. [Google Scholar] [CrossRef]
  32. Li, S.; Zhang, M. Improving the MODIS leaf area index product for a cropland with the nonlinear autoregressive neural network with eXogenous input model. Front. Earth Sci. 2023, 10, 962498. [Google Scholar] [CrossRef]
  33. Li, C.; Wang, J.; Hu, L.; Yu, L.; Clinton, N.; Huang, H.; Yang, J.; Gong, P. A Circa 2010 Thirty Meter Resolution Forest Map for China. Remote Sens. 2014, 6, 5325–5343. [Google Scholar] [CrossRef]
  34. Loveland, T.R.; Belward, A.S. The IGBP-DIS global 1km land cover data set, DISCover: First results. Int. J. Remote Sens. 1997, 18, 3289–3295. [Google Scholar] [CrossRef]
  35. Zhang, Y.; Wang, Y.; Phillips, N.; Ma, K.; Li, J.; Wang, W. Integrated maps of biodiversity in the Qinling Mountains of China for expanding protected areas. Biol. Conserv. 2017, 210, 64–71. [Google Scholar] [CrossRef]
  36. Zhao, Y.; Zhou, Y.; Jia, X.; Han, L.; Liu, L.; Ren, K.; Ye, X.; Qu, Z.; Pei, Y. Soil characteristics and microbial community structure on along elevation gradient in a Pinus armandii forest of the Qinling Mountains, China. Forest Ecol. Manag. 2022, 503, 119793. [Google Scholar] [CrossRef]
  37. Lin, W.; Yuan, H.; Dong, W.; Zhang, S.; Liu, S.; Wei, N.; Lu, X.; Wei, Z.; Hu, Y.; Dai, Y. Reprocessed MODIS Version 6.1 Leaf Area Index Dataset and Its Evaluation for Land Surface and Climate Modeling. Remote Sens. 2023, 15, 1780. [Google Scholar] [CrossRef]
  38. Aleksandar, V.; Tatjana, D.; Vladica, S.; Radomir, I.; Bojana, J. GIS numerical and remote sensing analyses of forest changes in the Toplica region for the period of 1953–2013. Appl. Geogr. 2018, 92, 131–139. [Google Scholar] [CrossRef]
  39. Peng, J.; Liu, Z.; Liu, Y.; Wu, J.; Han, Y. Trend analysis of vegetation dynamics in Qinghai–Tibet Plateau using Hurst Exponent. Ecol. Indic. 2012, 14, 28–39. [Google Scholar] [CrossRef]
  40. Cai, B.; Yu, R. Advance and evaluation in the long time series vegetation trends research based on remote sensing. Natl. Remote Sens. Bull. 2009, 13, 1170–1186. [Google Scholar] [CrossRef]
  41. Xiao, Z.; Liang, S.; Jiang, B. Evaluation of four long time-series global leaf area index products. Agric. Forest Meteorol. 2017, 246, 218–230. [Google Scholar] [CrossRef]
  42. Huang, C.; Yang, Q.; Zhang, H. Temporal and Spatial Variation of NDVI and Its Driving Factors in Qinling Mountain. Water 2021, 13, 3154. [Google Scholar] [CrossRef]
  43. Wen, J.; Lin, X.; Wu, X.; Bao, Y.; You, D.; Gong, B.; Tang, Y.; Wu, S.; Xiao, Q.; Liu, Q. Validation of the MCD43A3 Collection 6 and GLASS V04 snow-free albedo products over rugged terrain. IEEE T. Geosci. Remote 2022, 60, 5632311. [Google Scholar] [CrossRef]
  44. Jin, H.; Li, A.; Bian, J.; Nan, X.; Zhao, W.; Zhang, Z.; Yin, G. Intercomparison and validation of MODIS and GLASS leaf area index (LAI) products over mountain areas: A case study in southwestern China. Int. J. Appl. Earth Obs. 2017, 55, 52–67. [Google Scholar] [CrossRef]
  45. Liu, C.; Li, J.; Liu, Q.; Xu, B.; Dong, Y.; Zhao, J.; Mumtaz, F.; Gu, C.; Zhang, H. Global Comparison of Leaf Area Index Products over Water-Vegetation Mixed Heterogeneous Surface Network (HESNet-WV). Remote Sens. 2023, 15, 1337. [Google Scholar] [CrossRef]
  46. Shen, B.; Guo, J.; Li, Z.; Chen, J.; Fang, W.; Kussainova, M.; Amartuvshin, A.; Pulatov, A.; Yan, R.; Anenkhonov, O.; et al. Comparative Verification of Leaf Area Index Products for Different Grassland Types in Inner Mongolia, China. Remote Sens. 2023, 15, 4736. [Google Scholar] [CrossRef]
  47. Yan, K.; Pu, J.; Park, T.; Xu, B.; Zeng, Y.; Yan, G.; Weiss, M.; Knyazikhin, Y.; Myneni, R.B. Performance stability of the MODIS and VIIRS LAI algorithms inferred from analysis of long time series of products. Remote Sens. Environ. 2021, 260, 112438. [Google Scholar] [CrossRef]
  48. Xiao, Z.; Liang, S.; Wang, J.; Xiang, Y.; Zhao, X.; Song, J. Long-Time-Series Global Land Surface Satellite Leaf Area Index Product Derived from MODIS and AVHRR Surface Reflectance. IEEE T. Geosci. Remote 2016, 54, 5301–5318. [Google Scholar] [CrossRef]
  49. Li, X.; Du, H.; Zhou, G.; Mao, F.; Zheng, J.; Liu, H.; Huang, Z.; He, S. Spatiotemporal dynamics in assimilated-LAI phenology and its impact on subtropical bamboo forest productivity. Int. J. Appl. Earth Obs. 2021, 96, 102267. [Google Scholar] [CrossRef]
  50. Heiskanen, J.; Rautiainen, M.; Stenberg, P.; Mõttus, M.; Vesanto, V.; Korhonen, L.; Majasalmi, T. Seasonal variation in MODIS LAI for a boreal forest area in Finland. Remote Sens. Environ. 2012, 126, 104–115. [Google Scholar] [CrossRef]
  51. Qi, G.; Bai, H.; Zhao, T.; Meng, Q.; Zhang, S. Sensitivity and areal differentiation of vegetation responses to hydrothermal dynamics on the northern and southern slopes of the Qinling Mountains in Shaanxi province. J. Geogr. Sci. 2021, 31, 785–801. [Google Scholar] [CrossRef]
  52. Zhang, T.; Zhou, J.; Yu, P.; Li, J.; Kang, Y.; Zhang, B. Response of ecosystem gross primary productivity to drought in northern China based on multi-source remote sensing data. J. Hydrol. 2023, 616, 128808. [Google Scholar] [CrossRef]
  53. Liu, J.; Xie, T.; Lyu, D.; Cui, L.; Liu, Q. Analyzing the Spatiotemporal Dynamics and Driving Forces of Ecological Environment Quality in the Qinling Mountains, China. Sustainability 2024, 16, 3251. [Google Scholar] [CrossRef]
  54. Liang, X.; Liu, Q.; Wang, J.; Chen, S.; Gong, P. Global 500 m seamless dataset (2000–2022) of land surface reflectance generated from MODIS products. Earth Syst. Sci. Data. 2023, 16, 177–200. [Google Scholar] [CrossRef]
  55. Kou, Z.; Yao, Y.; Hu, Y.; Zhang, B. Discussion on position of China’s north-south transitional zone by comparative analysis of mountain altitudinal belts. J. Mt. Sci. 2020, 17, 1901–1915. [Google Scholar] [CrossRef]
  56. Li, Y.; Zeng, H.; Xiong, J.; Miao, G. Influence of Topography on UAV LiDAR-Based LAI Estimation in Subtropical Mountainous Secondary Broadleaf Forests. Forests 2023, 15, 17. [Google Scholar] [CrossRef]
  57. Liu, Y.; Xiao, J.; Ju, W.; Zhu, G.; Wu, X.; Fan, W.; Li, D.; Zhou, Y. Satellite-derived LAI products exhibit large discrepancies and can lead to substantial uncertainty in simulated carbon and water fluxes. Remote Sens. Environ. 2018, 206, 174–188. [Google Scholar] [CrossRef]
  58. Fang, H.; Li, W.; Myneni, R.B. The Impact of Potential Land Cover Misclassification on MODIS Leaf Area Index (LAI) Estimation: A Statistical Perspective. Remote Sens. 2013, 5, 830–844. [Google Scholar] [CrossRef]
Figure 1. The geographic location of the Qinling Mountains.
Forests 15 01871 g001
Figure 2. Spatial distribution of vegetation types across the Qinling Mountains.
Forests 15 01871 g002
Figure 3. Spatial distribution of the mean values of the MODIS and GLASS LAI products in January and July during 2001−2021. (a) MODIS LAI, January; (b) MODIS LAI, July; (c) GLASS LAI, January; (d) GLASS LAI, July.
Forests 15 01871 g003
Figure 4. Spatial distribution of the mean values of the LAI differences between the MODIS and GLASS LAI products in January and July during 2001–2021. (a) MODIS LAI minus GLASS LAI in January; (b) MODIS LAI minus GLASS LAI in July.
Forests 15 01871 g004
Figure 5. Histograms of the MODIS and GLASS LAI values during 2001–2021 for different vegetation types.
Forests 15 01871 g005
Figure 6. Mean values of the differences between the MODIS and GLASS LAI products for different vegetation types in each month during 2001–2021.
Forests 15 01871 g006
Figure 7. Temporal profiles of the mean values of the MODIS and GLASS LAI products for different vegetation types during 2001–2021.
Forests 15 01871 g007
Figure 8. Trends of the annual mean LAI changes for the (a) MODIS and (b) GLASS LAI products during 2001–2021.
Forests 15 01871 g008
Figure 9. Spatial distribution of the annual mean LAI significance for the (a) MODIS and (b) GLASS LAI products during 2001–2021.
Forests 15 01871 g009
Figure 10. Means of the MODIS and GLASS annual mean LAI trends for different vegetation types for 2001–2021. ENF = Evergreen needleleaf forests. DNF = deciduous needleleaf forests; MF = mixed forests; DBF = deciduous broadleaf forests; EBF = evergreen broadleaf forests; BF = bamboo forests; GCC = grasses/cereal crops.
Forests 15 01871 g010
Figure 11. The area ratio of different vegetation types varying with slope.
Forests 15 01871 g011
Figure 12. Variations of the mean values of the MODIS and GLASS LAI products with aspect and slope. (a) aspect; (b) slope.
Forests 15 01871 g012
Figure 13. The area ratio of different vegetation types varying with elevation.
Forests 15 01871 g013
Figure 14. Variations of the mean values of the MODIS and GLASS LAI products with elevation.
Forests 15 01871 g014
Figure 15. Vertical distribution of the mean LAI values of the MODIS and GLASS LAI products in July during 2001–2021.
Forests 15 01871 g015
Figure 16. Scatterplot of the MODIS and GLASS LAI values versus the values of LAI measurement.
Forests 15 01871 g016
Table 1. Vegetation types and dominant species in the Qinling Mountains.
Vegetation TypeDominant Species
Evergreen broadleafCinnamomum camphora, Schima superba, Theaceae
Deciduous broadleafQuercus aliena, Corylus heterophylla
Evergreen needleleafPinus armandii, Picea asperata, Abies fargesii
Deciduous needleleafPinus tabuliformis, Larix principis-rupprechtii
Mixed forestsPinus armandii, Quercus variabilis
Bamboo forestsPhyllostachys edulis
Grasses/cereal cropsMedicago sativa, Triticum aestivum, Zea mays
Disclaimer/Publisher’s Note: The statements, opinions and data contained in all publications are solely those of the individual author(s) and contributor(s) and not of MDPI and/or the editor(s). MDPI and/or the editor(s) disclaim responsibility for any injury to people or property resulting from any ideas, methods, instructions or products referred to in the content.

