Article

Bamboo Forests: Unleashing the Potential for Carbon Abatement and Local Income Improvements

1
East China Academy of Inventory and Planning, National Forestry and Grassland Administration, Hangzhou 310019, China
2
State Key Laboratory of Efficient Production of Forest Resources, Beijing Forestry University, Beijing 100083, China
3
Department of Earth System Science, Ministry of Education Key Laboratory for Earth System Modeling, Institute for Global Change Studies, Tsinghua University, Beijing 100084, China
4
Department of Computing and Mathematics, Manchester Metropolitan University, Manchester M1 5GD, UK
*
Author to whom correspondence should be addressed.
These authors contributed equally to this work.
Forests 2024, 15(11), 1907; https://doi.org/10.3390/f15111907
Submission received: 24 September 2024 / Revised: 25 October 2024 / Accepted: 26 October 2024 / Published: 29 October 2024
(This article belongs to the Special Issue Ecological Research in Bamboo Forests)

Abstract

:
Bamboo forests exhibit a unique efficient growth pattern that makes them invaluable in reducing atmospheric CO2 levels. Additionally, bamboo forests offer a diverse range of products, thus holding the potential to bolster local income. Despite these benefits, the comprehensive assessment of bamboo forests’ potential in both carbon abatement and improving local income enhancement has been hindered by the absence of a detailed bamboo biomass map. In this study, we address this gap by amalgamating a bamboo aboveground biomass (AGB) map covering three prominent producing provinces in southern China, utilizing multi-source remote sensing datasets. The results not only demonstrate a satisfactory consistency with China’s Ninth National Forest Inventory but also provide a more detailed spatial distribution. Based on this AGB estimation, we project an approximately threefold potential increase in annual bamboo culm harvest from existing bamboo forests. This represents a significant opportunity for expanding carbon abatement efforts, elevating local income levels, and facilitating the production of bamboo-derived biofuels. Furthermore, the adoption of an optimized management strategy has the potential to further enhance bamboo production. This study generates the first high-resolution bamboo AGB map and underscores the substantial potential of China’s bamboo forests in contributing to carbon sequestration and improving local income. The favorable income generated for local residents can serve as a compelling incentive for the implementation of sustainable forest management practices, offering a promising pathway toward achieving carbon-related objectives within the forestry sector and providing necessary support for forestry designation projects.

1. Introduction

The bamboo forest stands out as a distinctive ecological setting dominated by herbal species (Poaceae) [1]. Renowned for its exceptional growth efficiency, the bamboo forest surpasses other forest types, with its culms reaching towering heights of tens of meters within a mere few months [2]. Notably, approximately 30% of bamboo forests can be found in the southern part of China, where favorable conditions of ample radiative energy and moisture support their flourishing [3,4]. The rapid growth rate and ideal growth environment enable its crucial role in carbon sequestration and in increasing terrestrial carbon storage [5]. Apart from providing vital habitats for specific endangered species [6], local residents can manage these forests, yielding profitable products such as bamboo shoots [7] and bamboo culms [8], as well as providing fodder for local aquacultures [9]. It is worth emphasizing that such ventures into bamboo cultivation offer considerable income and hold substantial potential for society development [8,10], thus significantly contributing to the livelihoods of local residents.
As the largest carbon emitter since the 2000s [11], China has committed to reaching its carbon emission peak by 2030 and achieving carbon neutrality by 2060 in a bid to mitigate climate risks [12]. In tandem with efforts to curb carbon emissions from power generation and manufacturing sectors, there is a growing emphasis on exploring actively removing atmospheric CO2. Vegetation, in particular, assumes a pivotal role in this endeavor, given its capacity to efficiently absorb atmospheric CO2 through photosynthesis and sequester carbon [13]. This promising avenue underscores bamboo forests as a potentially effective solution for accelerating carbon reduction initiatives. Bamboo forests are distinguished by their rapid growth rate and their potential to sustainably mitigate carbon through effective forest management [14]. Furthermore, beyond its capacity to absorb atmospheric CO2, bamboo emerges as an ideal biofuel alternative poised to replace fossil fuels in the residential sector. Its substantial heat value, high volatile content, and minimal ash and moisture content render bamboo highly advantageous [15]. This not only contributes to carbon abatement but also offers the added benefit of enhancing air quality [16].
Beyond its substantial environmental advantages, bamboo forests constitute an economically lucrative forest-agricultural ecosystem. Two primary bamboo products, culms and shoots, underpin its economic significance. The utility of bamboo culms varies depending on their diameter and age. Young, slender bamboos are well-suited for paper production [17]. As bamboo matures and the culm diameter increases, a range of associated products such as bamboo structures and flooring can be crafted. Bamboo shoots hold cultural importance, with a significant portion of the population adhering to the tradition of consumption [7]. Leveraging these two principal products, managed bamboo forests can yield substantial profits [18,19]. Furthermore, the annual management of bamboo forests necessitates an average of considerable human interventions, thus offering significant local employment opportunities and contributing to improved local income. This attractive economic incentive, in turn, can motivate local residents to expand bamboo forests and enhance the managing level of existing bamboo forests, resulting in an augmented carbon sink.
In order to accurately assess and delve deeper into the potential benefits of bamboo in carbon sequestration and local income, it is imperative to have a spatial distribution of bamboo aboveground biomass (AGB) rather than relying on current publicly available regional statistics. However, existing studies face a critical data gap for two primary reasons. The first challenge stems from the absence of an accurate bamboo map. Remote sensing (RS) technology has proven its worth in detecting forests across various spatial scales [20,21]. By analyzing time-series variations of reflectance and RS indexes from different spectral bands, it is possible to distinguish distinct forest categories [1]. Regrettably, conventional land cover classification projects often overlook the designation of bamboo forests as an independent category [21], leading to a scarcity of reliable ground truth samples for bamboo mapping [1]. Li et al. proposed a method to detect the unique on-and-off-year phenological pattern of moso-bamboo, accounting for approximately 70% of China’s bamboo area, using high-resolution RS images [22]. Leveraging this phenological feature, Feng et al. achieved improved accuracy in bamboo mapping, even in data-sparse conditions [1]. A nationwide bamboo map has been developed with the assistance of cloud computational platforms [4]. Additionally, there is a lack of an AGB map for bamboo covering large regions, also due to limited field samples. Existing wall-to-wall forest AGB products based on RS observations may result in overestimation if the same numerical relationships calibrated for woody forests are directly applied to bamboo forests, because of the unique hollow structure of bamboo culms [23,24].
In this study, our primary objective is to assess the potential to enhance carbon abatement and local income within prominent bamboo-producing regions in China. The initial step involves generating a bamboo AGB map covering the study area, drawing upon multiple sources of RS data. This bamboo AGB map, to our knowledge, represents the first dedicated AGB product specifically for bamboo forests. Subsequently, leveraging this bamboo AGB map and investigation results from local bamboo industries, we quantify the potential for additional CO2 abatement and improving achievable income under diverse management scenarios. The outcomes of this study serve as essential reference points for the forestry sector, aiding in the formulation of carbon sequestration projects and initiatives aimed at enhancing local livelihoods.

2. Materials and Methods

This study incorporates two types of data: spatial data with precise geo references, such as RS products and field samples, and statistical data sourced from bamboo-related reports and investigations. The spatial data are used for estimating the total bamboo AGB across the study area. In this step, a machine learning model is trained using field bamboo samples and related input features. This trained model is then applied to infer and generate a gridded bamboo AGB product covering the study area. Based on the AGB estimation and additional datasets, we proceed to evaluate the potential of bamboo in absorbing additional CO2 and improving local income under two management scenarios (Figure 1). The typical management scenario describes the outcomes of bamboo forests under current management and harvesting intensity, based on forestry statistics and field investigation experience. An optimized management scenario describes the bamboo potential while the ecosystem is under ideal artificial management. We refer to the productivity of this scenario from the existing literature.

2.1. Study Area

This study is conducted in the southeast part of China, encompassing three provinces: Zhejiang, Fujian, and Jiangxi (Figure 1). The region is characterized by a hilly landscape, with a limited area of flat croplands. The subtropical monsoon climate prevailing in this area provides favorable conditions for the growth of bamboo and other evergreen woody forests. As a result, over half of the bamboo forests in China are located in this region [4,25]. Given the abundance of bamboo forests, a significant proportion of the local population depends on bamboo-related industries for their livelihood [26]. The presence of such industries underscores the socioeconomic importance of bamboo in this region.

2.2. Data

2.2.1. Spatial Data

A total of 250 bamboo samples were collected from two sources to train the AGB estimation model within or near the study area (Figure 2 and Table 1). Among these samples, 126 were obtained through field investigations conducted from 2009 to 2012. During the field investigations, 30 × 30 m quadrats were chosen to represent the average conditions of nearby bamboo forests. Various bamboo structural traits, such as breast diameter, age, culm height, density, and crown coverage, were also recorded. To estimate the AGB for individual bamboo plants, the following function, recommended by local forest sections, was applied:
AGB ( D ,   A ) = 747.79 D 2.771 ( 0.15 A 0.28 + A ) 5.56 + 3.77 ,
where D represents the breast diameter in centimeters and A represents the bamboo age in du (approximately 2 years). Based on this function, the AGB of each quadrat can be estimated by considering the bamboo density.
Secondly, 124 samples were collected from the existing literature [18,27,28,29,30,31,32,33,34,35,36]. Most of these samples were not provided with accurate coordination. We digitalized these samples using a geographical information system (GIS) platform (ArcGIS, version 10.3). To guarantee the representativeness of these samples, visual checks were conducted to ensure homogeneity within relatively large regions (~1 km2) of bamboo forests.
Grid-wise bamboo AGB is estimated at a high spatial resolution (all bands are resampled into 10 × 10 m grids, see Table 2). To achieve this, we collected the reflectance of red, green, blue, near-infra-red, and red-edge bands from the Sentinel-2 satellites (MultiSpectral Instruments of European Space Agency’s Sentinel missions, data can be collected via https://earth.esa.int/web/sentinel/user-guides/sentinel-2-msi/product-types/level-2a, accessed on 24 January 2024). Subsequently, four conventional vegetation-related indices, namely the normalized difference vegetation index (NDVI), enhanced vegetation index (EVI), land surface water index (LSWI), and MERIS terrestrial chlorophyll index (MTCI), are calculated using the reflectance data to enhance the vegetation signal [37]. Within each month, there are typically 2 to 3 satellite observations, and pixels with cloud contamination or shadow are detected and masked using the quality control band [38]. Pixel-wise median values are then computed for each band, and the three-year average (2019 to 2021) is calculated based on these monthly medians. In addition to optical remote sensing imagery, we incorporate a wall-to-wall tree height product that covers the entire study area, which was generated using Light Detection And Ranging (LiDAR) tree height samples obtained from a spaceborne sensor, employing a state-of-the-art neural network-guided interpolation method [39].
To mask the non-bamboo grids, we employ a bamboo map with a 30 × 30 m resolution obtained from Qi et al. [4]. This bamboo map was generated using a combination of multi-source RS images. It achieves an overall accuracy ranging from 85% to 96% at three target provinces, with a coefficient of determination (R2) of 0.84, signifying its satisfactory accuracy within the current study region.
Lastly, we collected the map of roads from OpenStreetMap (www.openstreetmap.org, accessed on 24 January 2024), encompassing motorways, trunk roads, primary and secondary roads, residential roads, and track roads. This dataset aids in delineating the distance between bamboo forests and the nearest road. This information is vital because bamboo forests located at a certain distance from roads are impractical for management with sufficient efficiency.

2.2.2. Non-Spatial Data

To assess the current status of harnessing bamboo resources, we collected bamboo production data sourced from the Ninth National Forest Inventory [3,44]. This dataset, which was finalized in 2022, provides information for the three provinces, encompassing province-wide bamboo forest area, total bamboo AGB, total bamboo plant count, and the annual bamboo plant harvest. It is noteworthy that the spatial distribution for bamboo forests and AGB from this forest inventory is not available.
For current price and status information on bamboo-related industries, we refer to an investigative report on the bamboo industry in Zhejiang and Anji, conducted by the National Forestry and Grassland Administration (see Appendix A). Anji represents a pivotal region where bamboo-related industries constitute a primary source of income (for the position of Anji, refer to Figure 2). The investigative team gathered data concerning income generated by local farmers and factories. Additionally, bamboo productivity can be further improved by optimizing management strategies, leading to an additional carbon abatement and income increase potential. The description of an optimized management strategy has been reported by relevant studies [18,19] and reports (Appendix B).

2.3. Method

2.3.1. Bamboo AGB Estimation

The estimation of bamboo AGB is conducted using the LGBM, a machine learning algorithm. This algorithm is an ensemble learning technique that optimizes predictions through the gradient boosting algorithm, progressively refining the performance of each decision tree for regression tasks [45]. Given its favorable performance in non-linear fitting tasks, the LGBM has found widespread application in various earth system science endeavors [46]. In this study, we employ the grid search method to optimize the hyperparameters of the LGBM. This technique involves defining a set of discrete values or ranges for the possible hyperparameter values and forming a parameter grid by combining these options. Subsequently, models are trained for each parameter combination, and the best parameter set is selected based on the results of cross-validation. The LGBM model is trained using 70% of the field samples and validated using the other 30% of the samples. The trained model is then inferred to cover the entire study area. To delineate bamboo areas, non-bamboo pixels are effectively masked using the bamboo map from Qi et al. [4].

2.3.2. Potential in Reducing CO2

The absorbed CO2 from photosynthesis is mainly stored in the bamboo culm, due to it having a longer lifespan than leaves and branches if it is converted into products such as floors and panels. Additional culms can be harvested from unexplored bamboo forests, leading to an extra carbon abatement. To evaluate this, we first use statistical data sourced from the province-scale report of the Ninth National Forest Inventory to ascertain the current harvesting proportion in the three provinces. In pursuit of promoting sustainable bamboo forest management, we take into account a harvesting rate of 15% of the total bamboo plants. This rate is suggested to meet the criterion that the new biomass accumulation within each year can compensate for the harvested biomass (Appendix B). Furthermore, we have factored in that forests located within a maximum distance of 3 km from the nearest road can be effectively managed (Appendix A). The annual harvesting potential of bamboo culms ( C u l m p o t ) within each city can be represented by:
C u l m p o t = C u l m < 3 k m × 15 % C u l m p r o u d c t i o n ,
where C u l m < 3 k m represents the culms from the bamboo stands that are no further than 3 km to the nearest road and C u l m p r o u d c t i o n represents the current culm production, which is calculated from the production proportion from the Forest Inventory. The C u l m p o t can then be converted into the weight of CO2 based on a suggested carbon density of 470 g/kg, as recommended by Zhang et al. [31], and an average of 6.84 kg for each bamboo culm, as suggested by Wang et al. [32].
Additionally, bamboo is recognized as a significant bioenergy plant, making it essential for providing bio-fuels, thus avoiding emitting extra CO2 into the atmosphere [47]. During the bamboo harvesting process, all leaves and branches are removed, forming forest residues that can be utilized directly as an energy source or converted into bamboo charcoal. It is suggested that this portion constitutes approximately 38.07% of the total bamboo weight [47,48]. This weight proportion underlies the estimation of potential bamboo AGB ( B a m b o o p o t ) from C u l m p o t . The remaining 61.93% of the bamboo weight is processed into construction materials or other productions. The residual material generated during processing, which amounts to approximately 62% of the culm weight according to investigations covering various factories [48], can also be converted into fuel. We can calculate the potential in providing biofuels ( F u e l p o t ) from unexplored bamboo by:
F u e l p o t = B a m b o o p o t × 38.07 % + B a m b o o p o t × 100 % 38.07 % × 62 % ,

2.3.3. Potential for Improving Local Income

We evaluated income potential by using investigation data from Anji county. The profit for local bamboo farmers ( P r o f i t p o t ) can be calculated using the profit from culms and two kinds of shoots:
P r o f i t c u r r e n t = C u l m p o t × C u l m p r o f i t + S p r i n g S h o o t s p o t × S p r i n g S h o o t s p r o f i t + W i n t e r S h o o t s p r o u d c t i o n × W i n t e r S h o o t s p r o f i t
Spring shoots are slender and usually harvested between February and May in the current study area, while winter shoots are shorter and harvested from October to early February. The net profit for diverse bamboo products agrees with the investigation results in Anji (Table 3 and Appendix A). The potential production for two types of shoots is calculated based on an empirical proportion to the weight of culms: 19.0% ± 1.4% and 1.0% ± 0.3%.

2.3.4. Management Scenarios

We explore two bamboo forest management scenarios in this study. The first scenario focuses on maximizing the utilization of existing bamboo resources and thus adopts a typical management strategy. Plant density and plant weight adhere to the average conditions observed in the study area. In this scenario, we aim to fully utilize the suggested 15% annual harvesting proportion of bamboo forests within a 3 km radius of the road. The second scenario involves an optimized management strategy recommended by Bamboo Forest Management Carbon Sequestration Project Methodology [18,19]. This strategy involves optimizing the spatial structure and age distribution of bamboo stands to enhance the utilization of radiation and water resources. Additionally, implementing an appropriate fertilizing and harvesting schedule promotes bamboo growth, resulting in increased plant density and individual plant weight compared to the current conditions. However, it should be noted that this optimized approach incurs additional costs for labor and materials (see Appendix B).

3. Results

3.1. Bamboo AGB

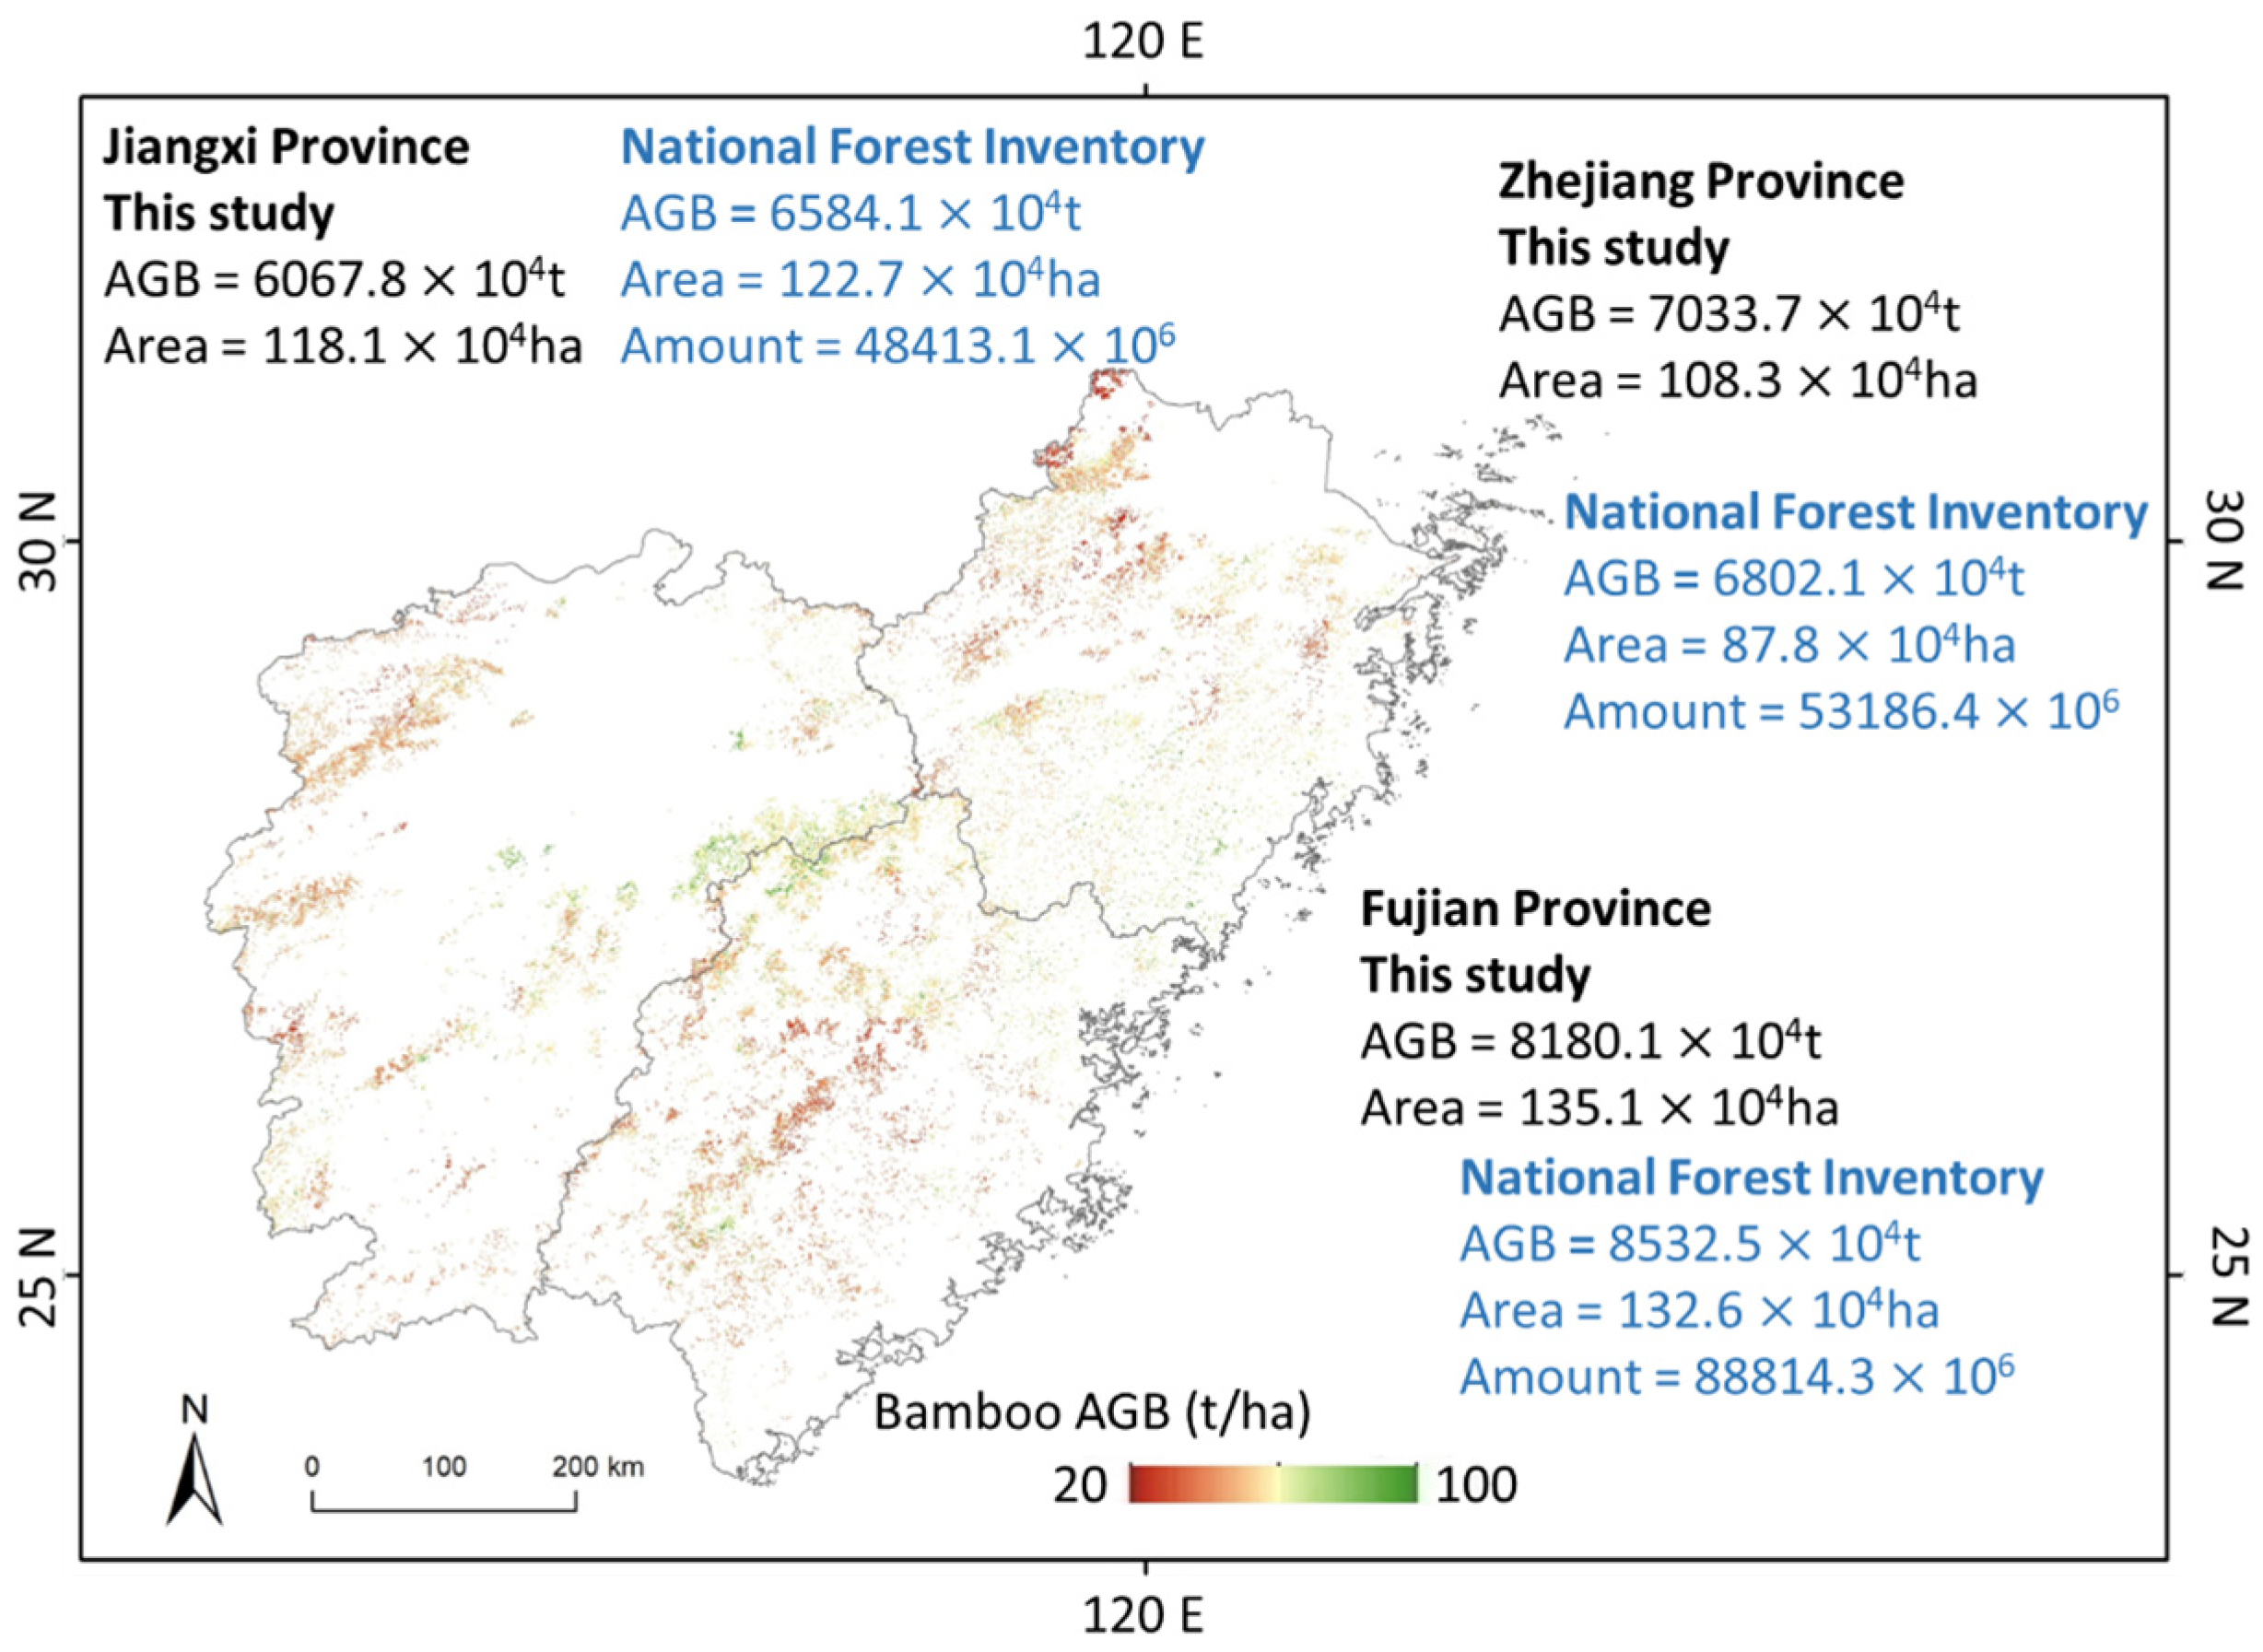
The LGBM method exhibits a satisfactory performance in bamboo AGB estimation, with a resulting mean absolute error (MAE) of 12.81, a root mean square error (RMSE) of 16.34 t/ha, and a coefficient of determination (R2) of 0.87, even though there is one record of overestimation (Figure 3). This signifies that the input feature scheme employed in this study effectively captures the spatial variability of bamboo AGB. Subsequently, based on this well-trained model, an AGB map with a 10 m grid resolution covering the entire study area is generated (Figure 4).
According to the AGB map, Fujian province, characterized by a warmer, wetter climate and more hill regions without human activities, exhibits a larger area of bamboo forests (135.1 × 10⁴ ha) and a higher bamboo AGB storage (8180.2 × 104 t). In Zhejiang province, except for the northern agricultural regions, 108.3 × 10⁴ ha of bamboo forests with 7033.6 × 104 t AGB storage are mainly concentrated in the southern part of the province. Within the current study region, the most abundant bamboo AGB is found in Wuyi Mountain, situated on the border of Fujian and Jiangxi provinces.
While there are acceptable differences between the AGB estimations in this study and the data reported by the Ninth National Forest Inventory, such as 516.5 × 10⁴ t of AGB difference and 4.6 × 10⁴ ha of bamboo forest area difference in Jiangxi, 231.5 × 10⁴ t AGB and 20.5 × 10⁴ ha in Zhejiang, and 352.3 × 10⁴ t AGB and 2.5 × 10⁴ ha in Fujian, it is important to note that the AGB estimation in this study offers more specific and detailed information regarding the spatial distribution of bamboo biomass, instead of relying on province-scale statistics, thus enhancing the insights of our results and facilitating a more in-depth understanding of the distribution patterns of bamboo resources. Therefore, the subsequent analysis will be based on these outcomes.

3.2. Bamboo Potential Under the Typical Management Scenario

Currently, the harvesting of bamboo resources is relatively limited, with percentages of 5.58% in Fujian, 4.25% in Jiangxi, and 4.01% in Zhejiang. These values significantly differ from the recommended harvesting rate of 15%, highlighting the substantial untapped potential of bamboo resources available for harvesting (Figure 5a). Notably, Fujian province demonstrates the strongest harvesting potential, with the capacity to harvest an additional 10.49 × 10⁹ bamboos annually. Specifically, the three cities situated in the western part of Fujian province—Nanping, Sanming, and Longyan—show the most promising potential for bamboo exploitation. Conversely, cities with more farmland, such as Jiaxing in Zhejiang province, coastal regions in Fujian province, and cities along the Yangtze River in Jiangxi province, exhibit relatively lower bamboo harvesting potential, as flat land in the study area is usually converted into farmland. Based on these unexplored bamboos, we estimate that an additional 1236.4 × 104 t, 677.7 × 10⁴ t, and 878.11 × 10⁴ t of CO2 can be absorbed in the bamboo culms in Fujian, Jiangxi, and Zhejiang, respectively, with sufficient harvesting.
Additionally, harnessing the biofuel potential from bamboo also plays a crucial role in achieving net-zero emissions. The residues generated during bamboo harvesting (branches and leaves) and during bamboo processing can both be effectively converted into bamboo charcoal. According to our results, there is considerable residue potential that can be explored in the study area: 462.9 × 10⁴ t in Fujian, 530.74 × 10⁴ t in Zhejiang, and 388.1 × 10⁴ t in Jiangxi (Figure 5b). Based on an average carbon emission efficiency suggested by Wang et al. [47], the adoption of bamboo-converted biofuels under ideal conditions could result in the reduction of 102.5 × 10⁴ t, 85.9 × 10⁴ t, and 117.5 × 10⁴ t of coal emissions in Fujian, Jiangxi, and Zhejiang provinces, respectively. This reduction would account for 1.1%, 1.1%, and 0.9% of the total coal emissions in the respective provinces.
The potential for profit from bamboo forests, stemming primarily from three sources—culms, spring shoots, and winter shoots, can be quite substantial under the typical harvesting scenario (8260.4 ± 909.7 CNY/ha for bamboo culms, 8056.7 ± 910.8 CNY/ha for spring shoots, and 4460.9 ± 886.5 CNY/ha for winter shoots). In aggregate, this translates to an estimated annual profit of approximately 20,778 CNY/ha. Among these streams, bamboo culms contribute to approximately 40% of the net profit. Given the heightened production of bamboo shoots, particularly spring shoots, during the spring season, notably in April, their contribution to production and profitability exceeds that of winter shoots. Expanding the managed bamboo forests has the potential to substantially improve income for local residents (CNY 8648.5 million for Fujian, CNY 6019.3 million for Zhejiang, and CNY 4737.9 million for Jiangxi, taking up 26%, 33%, and 12.1% of the provincial forestry gross domestic product (GDP), as shown in Figure 5c).

3.3. Bamboo Potential Under an Optimized Management Scenario

The implementation of an optimized management strategy promises to further augment the potential of bamboo forests. During the adjustment phase of natural bamboo forests, typically spanning 6–8 years, there is a notable increase of 32.3% ± 5.0% in the weight of each individual bamboo plant and a 17.6% ± 3.0% increase in bamboo density. Upon completion of this adjustment period and the attainment of mature forest stands, the weight of each plant and plant density experience more significant growth, with increases of 64.6% ± 10.0% and 35.2% ± 5.9%, respectively. Over a 30-year management project, the average annual production of culms is projected to surge by 63.66%, while shoot production will increase by 18.10% [19]. Consequently, the potential for CO2 removal could be further enhanced, with estimated increases of 2027.7 × 104 t, 1111.4 × 104 t, and 1440.1 × 104 t in the three provinces, respectively, if this management strategy gains widespread adoption. Furthermore, following the cost of necessary resources for labor and fertilizer, the annual net income derived from bamboo forests would see a substantial uptick from 20,778 CNY/ha to 23,782 CNY/ha, reflecting a notable 14.4% increase.

4. Discussion

The Chinese government has set a goal to achieve carbon neutrality by 2060, which necessitates contributions from all sectors. Bamboo forests, being the fastest-growing forest ecosystem capable of reaching maturity within a few years, hold unique potential in removing CO2 from the atmosphere. Moreover, these forests can yield various profitable products, thereby motivating local residents to cultivate and manage them, leading to positive socioeconomic effects. However, despite their significant ecological and economic importance, bamboo forests have not received enough attention in existing RS applications. Consequently, there is currently no bamboo AGB product available covering a large area, making the potential impact of bamboo forests on carbon abatement and local income unclear. In this study, we employ high-resolution RS products and a machine learning algorithm, the LGBM, to map the bamboo AGB in a typical bamboo distribution region in southern China. The results in Section 3.1 demonstrate satisfactory accuracy when compared to field observations and comparable statistics with the Ninth National Forest Inventory, which were conducted through intensive distributed field investigations. Building upon this bamboo AGB map, we proceed with a city-scale evaluation to further explore the potential of bamboo forests in the current study area. Future bamboo industry planning and resource exploration can also benefit from this AGB map.
Bamboo forests contribute to carbon abatement through two main pathways. Firstly, to offset CO2 emissions, it is essential to increase forest carbon sinks [12]. Bamboo forests have the capacity to sustainably absorb a larger amount of CO2, especially when managed with adequate logging schemes, as highlighted in Section 3.2. The study region possesses a substantial amount of bamboo potential that can be harvested and utilized every year. Under a typical management scenario, the bamboo culm yield in the area can potentially be nearly tripled, leading to the absorption of an additional amount of CO2 from the atmosphere. This quantity can even be enhanced by adopting an optimized management strategy, as suggested by Section 3.3. Furthermore, under natural conditions without artificial management or logging activities, bamboo forests, as well as other woody forests, tend to reach a pseudo-equilibrium in terms of carbon storage, where the net carbon absorption becomes limited [49]. In this regard, the harvesting of old bamboo from mature forests can create space for young bamboo crowns. This, in turn, allows the carbon sink capacity to be sustained through the growth of young bamboos. Moreover, applying bamboo residues during processing as a bioenergy resource also benefits the decrease in atmospheric CO2. Compared to directly burning these residues, converting bamboo residues into charcoal granules or combustible gases significantly improves the heat value and reduces harmful emissions, making it a viable and environmentally friendly alternative to the use of fossil fuels [15]. The replacement of certain fossil fuels with this renewable energy source can result in the reduction of additional CO2, SOx, and NOx emissions into the atmosphere [16].
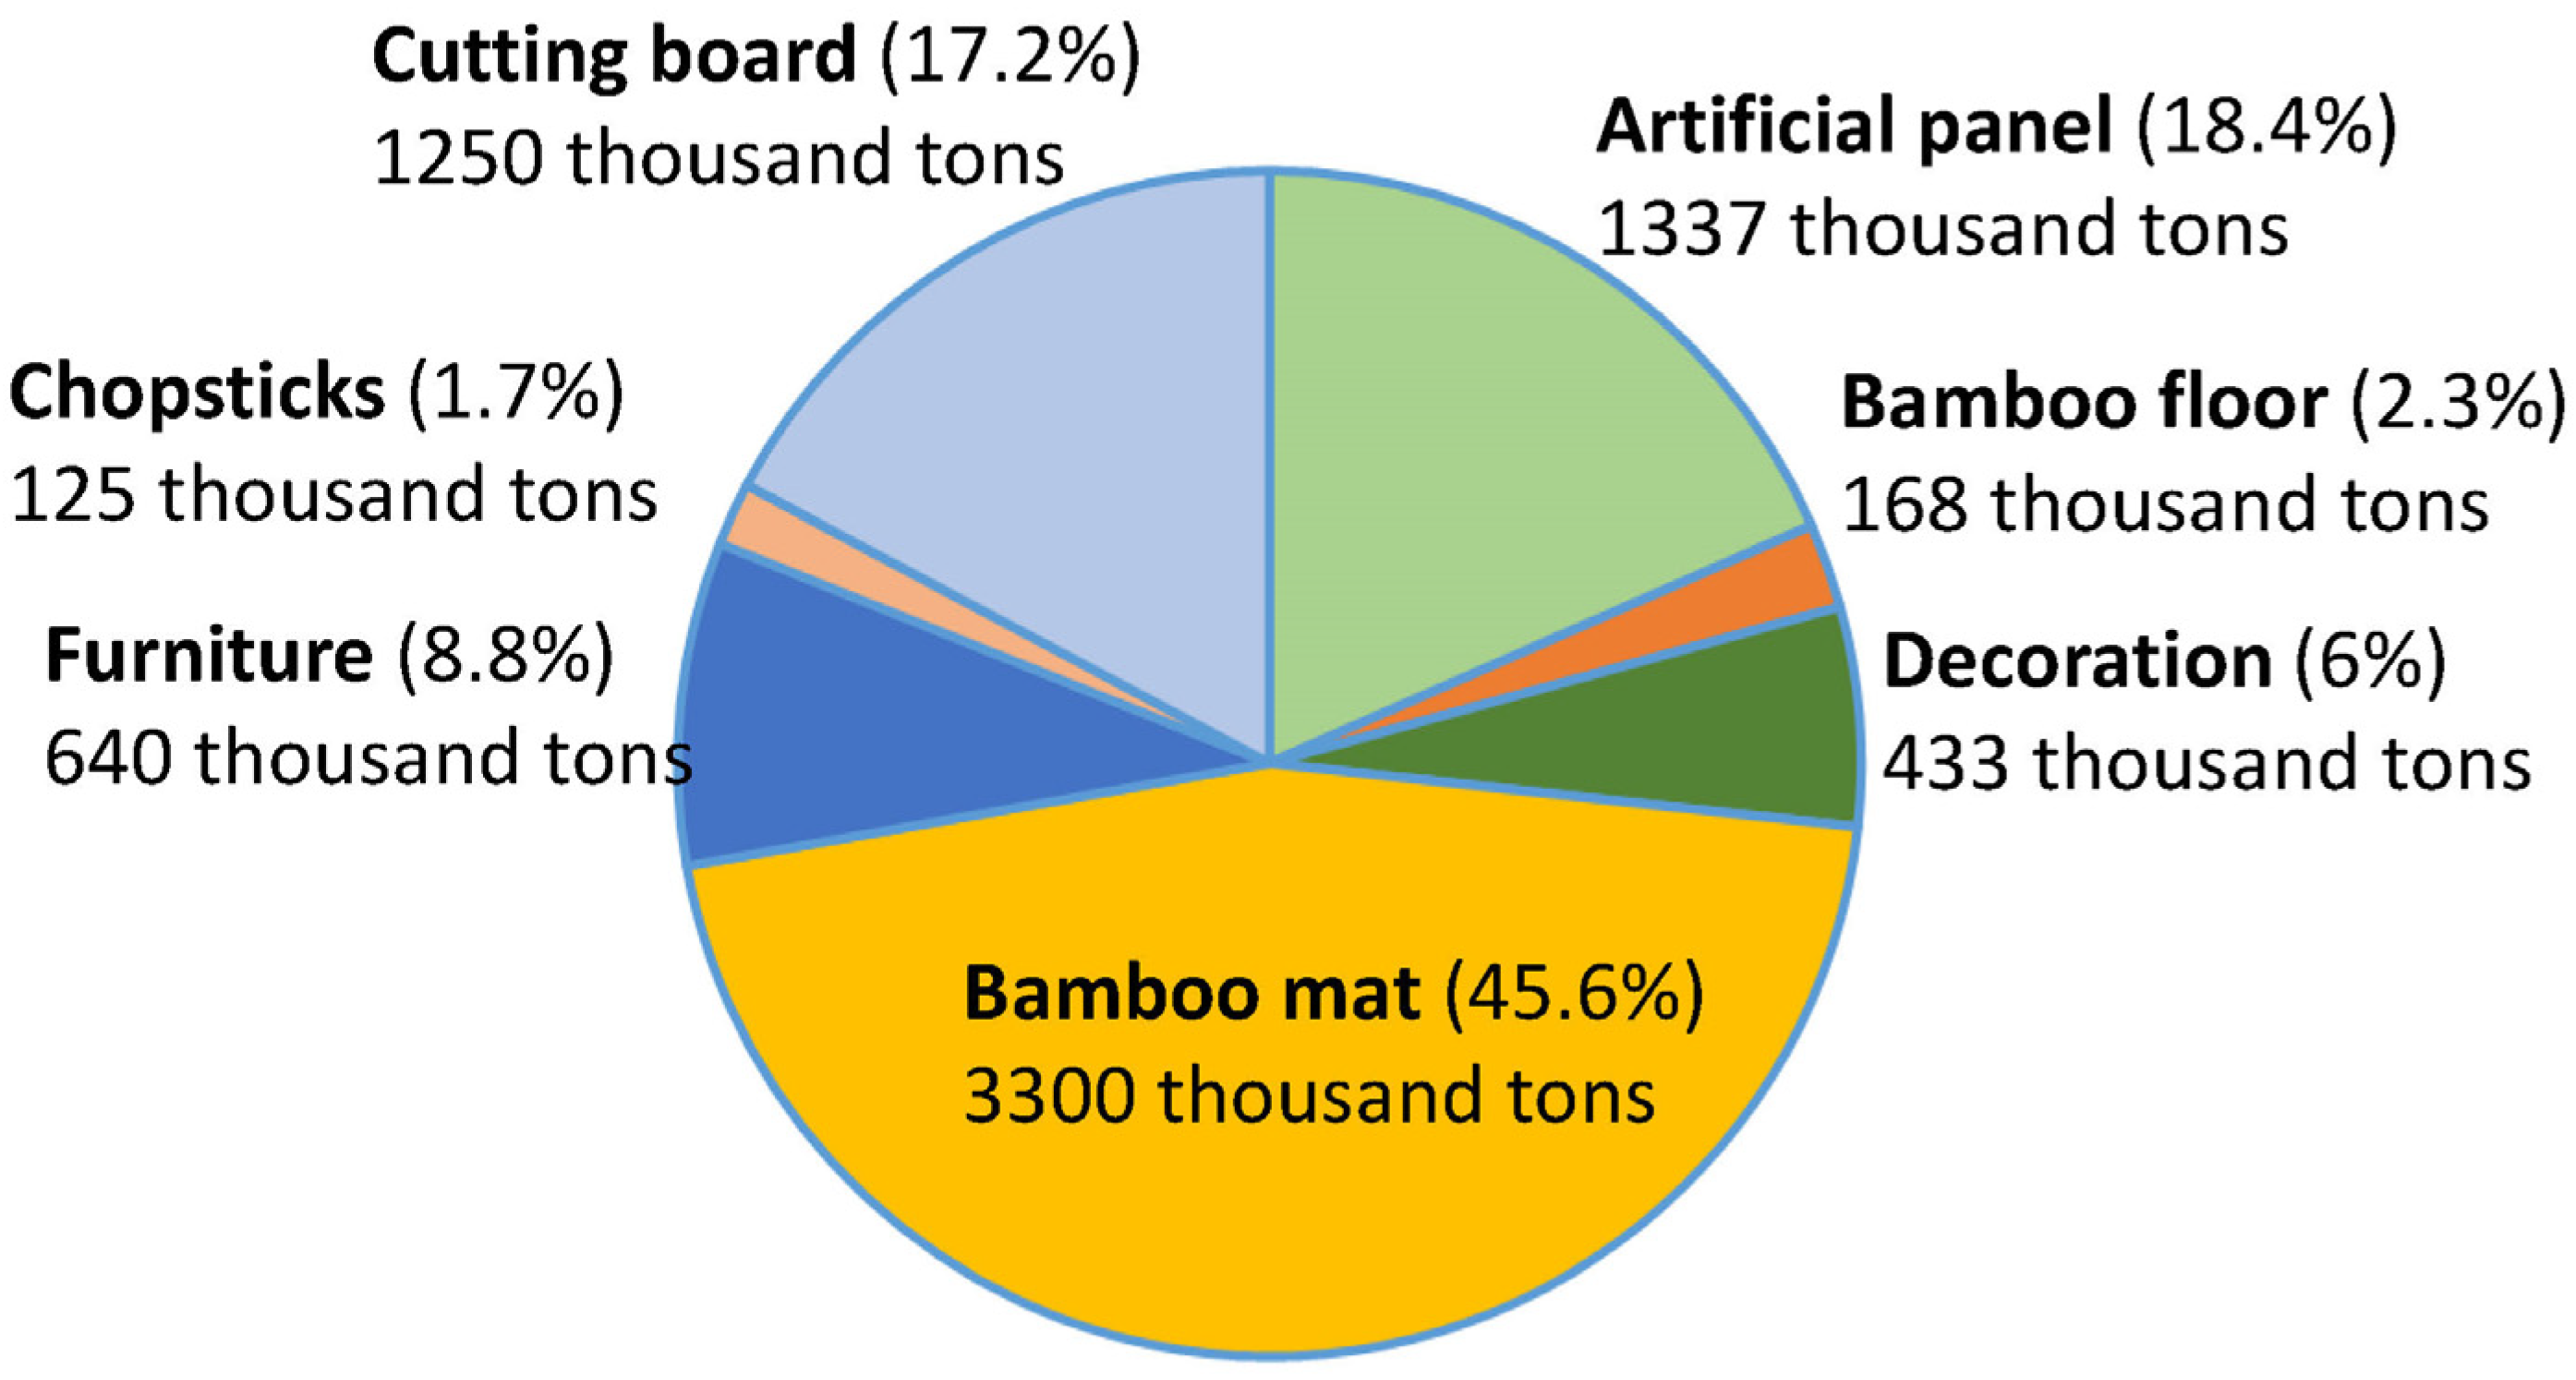
Despite the significant potential of bamboo in sequestering carbon, it is essential to consider the lifespan of bamboo products, as only part of the absorbed CO2 can be permanently removed from the atmosphere. Bamboo culms serve two primary purposes: as constructive materials, such as floors, and for disposable products, such as paper and chopsticks [50]. The former usage typically offers a longer lifespan, lasting up to several decades, whereas paper products tend to break down, releasing the stored CO2 back into the atmosphere over several months to years [51]. Currently, the utilization of bamboo materials for construction-related purposes remains relatively limited (see Figure A1). There are two potential pathways to increase the average lifespan of bamboo products. First, there is the option to replace conventional construction materials with bamboo-derived materials. Bamboo culm, with its superior modulus of elasticity, compressive strength, and shear strength compared to common woody timber, is an ideal material for constructing environmentally friendly buildings [50]. Substituting conventional mineral-based engineering materials with bamboo-based alternatives not only enhances the carbon sink capacity in buildings [52] but also offers a safer method of carbon storage compared to techniques such as underground carbon capture [53]. For instance, replacing a portion of concrete materials, such as panels supporting bricks, with bamboo-based materials can result in a reduction of 11.7 thousand CO2 emissions per cubic meter. Considering the expected growth in urban populations in the coming decades and the subsequent demand for housing and infrastructure, untapped bamboo resources present an ideal alternative to traditional woody materials [54]. This transition to bamboo-based materials not only enhances carbon sequestration potential but also promotes sustainable urban development. Secondly, a recent proposal suggests substituting plastic products with bamboo, offering new insights for extending the lifespan of bamboo products. Apart from the currently widespread disposable items and daily necessities, bamboo-based materials can be used to produce more durable and functional products, significantly prolonging their lifespan [55].
As a crucial agricultural forest ecosystem, bamboo forests yield bamboo culms and several types of shoots, generating profitable outcomes. As detailed in Section 3, the cumulative profit from bamboo forests can amount to approximately 20,778 CNY/ha annually under a typical managed condition and 23,782 CNY/ha under an optimized managed condition, encompassing well-designed harvesting, logging, and fertilization strategies. This noteworthy profit not only positions bamboo forests as a vital local revenue source but also generates a considerable number of local job opportunities, thereby enhancing the region’s livelihood [56]. This economic incentive subsequently encourages local residents to engage in bamboo cultivation and forest management, thus fostering a constructive cycle that bolsters the sustainability of carbon abatement efforts.
However, despite the evident contributions of bamboo forests in carbon abatement and improving local income, several important issues require attention if we aim to expand the area of bamboo forests. There is a lack of a universal scheme for optimizing the management of bamboo forests. The satisfactory net profit in this study is achieved in Anji, where there is vital bamboo production and the management system is sufficient to support local plantation owners to optimize the management scheme of bamboo forests. Currently, a significant proportion of bamboo forests in China are owned by stallholders, rather than forest companies, leading to limited biomass storage and carbon abatement capacity [14]. Propagating scientific management practices, such as adequate fertilization and logging schemes, could potentially increase management and carbon abatement efficiency [57]. The designation of a comprehensive bamboo management scheme covering diverse climate and topography conditions requires intensive field experiments. A numeric simulation strategy may reduce the experimental cost by simulating the light utilization efficiency under diverse bamboo forest scenarios [58].
Challenges persist in fully optimizing the utilization of existing bamboo resources. As elucidated in Section 3.1, unlike the bamboo application barrier in Africa and India, which requires investigation in terms of the infrastructure for bamboo processing, a substantial portion of bamboo forests in south China are situated in regions with limited inhabitants or inadequate road infrastructure for the deployment of logging machinery and transportation vehicles [59,60]. This spatial incongruity between bamboo production and processing areas is evident and poses a noteworthy challenge [61]. Consequently, the efficiency of exploiting these bamboo forests is hindered. Despite the fact that the current annual bamboo harvest and utilization rates remain relatively low, industries reliant on bamboo products require roughly twice the number of culms and shoots as raw materials, as highlighted by local investigations. This discrepancy is particularly pronounced in Anji, given the concentration of bamboo processing industries within this county (Appendix A). The cost associated with transporting raw bamboo materials accounts for a significant portion of the total profit generated by the bamboo industry, and the transportation of bamboo from neighboring regions often incurs additional expenses (Table A2). Enhancing the efficiency of bamboo processing within bamboo-producing regions entails reducing the expenses associated with harvesting local bamboo materials and enhancing the local processing industries.
An alternative approach to enhancing bamboo utilization efficiency involves minimizing waste and residues during processing. Merely 20% to 50% of the bamboo biomass is ultimately transformed into corresponding products [48]. Enhancing processing technology is pivotal to elevating processing efficiency and diminishing residual outputs. The majority of existing culm and shoot processing facilities operate on a small scale, suggesting the potential for scaling up these operations to augment efficiency (see Table A1).
Bamboo forests often lack other main woody species and have limited shrub species since bamboos are highly efficient in growth and resource utilization. Blindly transforming a woody forest into a bamboo forest could disrupt local biodiversity and adversely threaten other forest species [62,63]. Moreover, as bamboo is a grass species with relatively shallow roots compared to woody species, it has a restricted capacity to access water from deep soil, making it more vulnerable to increasing drought events. Our field investigation from September to December 2022 revealed that during a severe drought event, a significant number of bamboo forests died, while woody species managed to survive.
There are still uncertainties to be addressed before fully predicting the dynamics of the bamboo industry. The first major uncertainty lies in bamboo AGB mapping. Our results indicate a slight underestimation (~4%) in the AGB fitting. Since we minimized the mean absolute error during model training, this slightly lower slope primarily results from input feature noise and the nature of AGB prediction tasks. Nevertheless, an artificial correction could disrupt the intrinsic relationship between input features and AGB that the trained model has learned. Given that this limited “underestimation” does not significantly affect subsequent analysis and conclusions, we have chosen to retain the original predictions. Secondly, we employed two bamboo management scenarios to predict the profits of bamboo cultivation. The productivity estimates for these scenarios are based on our field investigation, statistical data, and the existing literature. Future field experiments under typical bamboo conditions are urgently needed to improve prediction reliability. Moreover, there remains a gap between our ideal prediction—where all bamboo resources are adequately managed and utilized—and the reality of current practices. However, this does not diminish the significance of this study, which highlights the often-overlooked carbon and economic potential of bamboo forests. Finally, we adopted a linear relationship between income and bamboo product yields. Market responses, such as product saturation and transport services, influence this relationship but were not considered in our predictions. Developing a more complex economic model supported by additional investigation data would help constrain and enhance prediction accuracy.

5. Conclusions

In this study, we generate the first high-resolution aboveground biomass map for bamboo forests across a vast region, utilizing a combination of multi-source remote sensing data and a machine learning algorithm. The results demonstrate a satisfactory consistency with field samples and forest inventory statistics. Subsequently, we assess the potential for carbon sequestration and income enhancement within bamboo forests based on this biomass map and investigation results from local forestry institutes. Our findings reveal that by harnessing the existing bamboo forests, it is possible to increase annual bamboo culm production by approximately threefold. This increase represents a significant opportunity for expanding carbon abatement efforts, boosting local income, and facilitating the production of bamboo-related biofuels. Furthermore, the adoption of an optimized management scheme can lead to a substantial 63.66% increase in culm production under ideal conditions and a 14.4% increase in income. This study underscores the substantial potential of southern China’s bamboo forests in mitigating greenhouse gases. The favorable income generated for local residents can serve as a strong incentive for sustainable forest management practices, offering a promising avenue toward achieving carbon-related objectives within the forestry sector.

Author Contributions

Conceptualization, J.X. and S.T.; methodology, J.X. and S.T.; software, X.Z.; validation, H.W.; formal analysis, H.W.; investigation, X.Z.; resources, H.W.; data curation, X.Z.; writing—original draft preparation, J.X.; writing—review and editing, S.T.; visualization, X.Z.; supervision, Y.H.; project administration, Y.H. All authors have read and agreed to the published version of the manuscript.

Funding

This study was sponsored by The National Key Research and Development Program of China (2023YFD2201700); the National Natural Science Foundation of China (72140005); the Key Research and Development Plan of Shaanxi Province (2024NC-YBXM-220); and in part by the National Natural Science Foundation of China (42001356).

Data Availability Statement

The data that support the findings of this study are available from the corresponding author upon reasonable request.

Conflicts of Interest

The authors declare no conflicts of interest.

Appendix A. An Excerpt from the Investigation Report on the Zhejiang and Anji Bamboo Industry

Zhejiang Province has a rich history of bamboo cultivation and a well-established bamboo processing infrastructure. By the year 2020, the province’s bamboo industry had yielded a total output value of CNY 53.2 billion, constituting approximately 10% of the overall output value of the province’s forestry industry. The scope of Zhejiang’s bamboo industry extends across primary, secondary, and tertiary sectors, encompassing an extensive industrial chain and providing substantial employment opportunities. The province’s bamboo products are widely exported to numerous countries, including the United States, Europe, Japan, and South Korea. This industry significantly contributes to the local economy, employing around 3 million individuals in bamboo cultivation and harvesting endeavors, with over 100,000 people actively participating in bamboo shoot processing. In the study area that represents the primary bamboo production region in China, Zhejiang boasts the highest number of bamboo processing facilities (Refer to Table A1).
As reported by the Zhejiang Bamboo Industry Association and focal enterprises, the bamboo culms undergo processing to yield several principal product categories, a significant majority of which command a substantial share of China’s market (Figure A1). In the year 2020, Zhejiang Province successfully produced 211 million bamboo culms and 0.64 million tons of bamboo shoots. However, an additional demand for 229 million bamboo culms and 1.73 million tons of bamboo shoots necessitated imports from neighboring provinces. Due to lagging infrastructure for bamboo harvesting, the value of bamboo harvesting and transportation was reduced from CNY 5.3 billion in 2015 to CNY 4.0 billion in 2020, constituting 35.0% and 21.3%, respectively, of the total forestry industry value.
Anji county is widely acknowledged as a prototypical production hub in Zhejiang and holds the distinction of being one of the most prominent bamboo production centers in China. As of 2020, the bamboo industry in Anji county recorded an impressive total output value of CNY 15.42 billion, with the industry providing employment to nearly 50,000 individuals. With invaluable assistance from the local forestry administration, we collected comprehensive data encompassing the total production of the three principal products spanning the years 2017 to 2021—namely, bamboo culms, spring shoots, and winter shoots. Pertinent price and production information were methodically acquired from local factories and farmers, while the bamboo forest area was accurately estimated through the utilization of ultra-high spatial resolution remote sensing images supplemented by meticulous human interpretation. The investigation culminated in the identification of an annual harvest potential of 0.51 to 0.57 million tons of bamboo culms and 35.8 thousand tons of spring shoots. However, it was evident that an additional demand of 2.56 million tons of culms and 31.5 thousand tons of shoots necessitated imports annually, thereby incurring supplementary costs (Table A2). Two key factors were identified as contributing to this divergence between material supply and demand. Firstly, the prevailing state of infrastructure, particularly forest roads, proved inadequate, coupled with the prohibitive labor costs associated with local residents undertaking logging activities in deep mountain regions. Secondly, an insufficient number of preprocessing factories and workshops was noted, thus impeding the immediate capacity for preprocessing.
Furthermore, the collection of harvested bamboo products, particularly the culms, necessitates the presence of vehicles, emphasizing the importance of bamboo forests not being located too far from roads. According to the Budget Quota of Afforestation Project in Zhejiang Province, as provided by the Zhejiang Provincial Forestry Bureau, it is noted that the efficiency of harvesting and other forest management activities diminishes as the distance between target stands increases. Management activities in the forest stands that are located more than 5 km away from the nearest road are assessed as low operational efficiency and are therefore not recommended. According to the investigation, local farmers lack the incentive to harvest and manage bamboo stands located more than 3 km away from the nearest road. Consequently, we adopt this criterion, focusing on bamboo forests within a 3 km proximity to the nearest road for utilization.
Table A1. Information on bamboo factories in the three provinces within this study. The proportions denote the amount of these enterprises to the total amount of China’s bamboo industry. The classification of enterprises is based on their annual income: small and micro enterprises exhibit annual incomes below CNY 5 million, medium enterprises boast annual incomes exceeding CNY 5 million but not surpassing CNY 20 million, and large enterprises command annual incomes surpassing CNY 20 million.
All EnterprisesSmall and Micro EnterprisesMedium EnterprisesLarge Enterprises
AmountProportionAmountProportionAmountProportionAmountProportion
Zhejiang401120.30%370020.18%30022.73%911.39%
Fujian215110.89%15758.59%55942.35%1316.46%
Jiangxi5242.65%4932.69%241.82%11.27%
Table A2. Prices of bamboo culms in Anji from different sources (CNY/ton). The price in the row of other provinces represents the average value of bamboo prices in Hunan, Anhui, and Hubei province, China.
Region201920202021
Anji (Local)450440410
Other regions of Zhejiang440440460
Fujian500550580
Jiangxi470480490
Other provinces450446453
Figure A1. Proportion of major bamboo products in Zhejiang province for 2020.
Forests 15 01907 g0a1

Appendix B. Investigation Report for the Bamboo Management Strategies

In practice, an approximate removal of 30% of the bamboo AGB through a selective cutting strategy conducted in alternating years, equivalent to approximately 15% of the annual AGB, has been observed while maintaining the sustainable production of the ecosystem [14]. However, this specific harvesting proportion lacks systematic explanation and evaluation. Notably, Mao et al. [64] employed a numerical simulation approach utilizing a dynamic global vegetation model, BIOME-BGC, to explore the carbon sequestration potential of moso-bamboo stands. In this context, a meticulous parameter calibration for bamboo (~40 parameters) based on localized experiments was undertaken to enhance model accuracy. The simulation outcomes revealed that selective cutting prominently diminishes autotrophic respiration, while concurrently eliciting only a marginal reduction in photosynthesis rates. This combination of effects yields an amplified potential for net carbon accumulation. Furthermore, The Bamboo Forest Management Carbon Sequestration Project Methodology (AR-CM-005-V01) recommends a harvest proportion of around 14.6% ± 1.7% per year based on the age distribution within bamboo forests. In this study, we employ a 15% harvesting proportion under a typical managed scenario.
Further insights into optimizing bamboo forest carbon management strategies have been suggested by the Bamboo Forest Management Carbon Sequestration Project Methodology (AR-CM-005-V01). Studies by Li et al. [18] and Gu et al. [19] advocated that the AGB for a single bamboo plant and the bamboo density can be further improved under an optimized management scenario: weeding and fertilization every four years, costing 15 workdays/ha; harvesting culms and shoots every two years, costing 15 and 7 workdays/ha, respectively; and clearing the bamboo rhizome every 15 years, costing 22.5 workdays/ha. Therefore, the computed average cost for artificial labor stands at 16.25 workdays per year. This translates to an annual labor cost of 2734.06 CNY/ha [19], considering an average compensation rate of CNY 168.25 per workday, as documented in the 2018 Statistical Yearbook for Anji. Moreover, the annual cost associated with the application of chemical fertilizers is calculated at CNY 1800 per hectare (derived from 600 kg/ha of fertilizer applied at 3 CNY/kg). The bamboo forests under this management scenario exhibit substantial enhancements in both economic returns and carbon abatement efficacy in comparison to typical bamboo forest management strategies. After 6–8 years of adjustment stages, the AGB and density of this forest will both be enhanced, leading to a 76.2% increase in bamboo culm production and a 26.2% increase in shoot production.

References

  1. Feng, X.; Tan, S.; Dong, Y.; Zhang, X.; Xu, J.; Zhong, L.; Yu, L. Mapping large-scale bamboo forest based on phenology and morphology features. Remote Sens. 2023, 15, 515. [Google Scholar] [CrossRef]
  2. Liese, W.; Kohl, M. Bamboo. The Plant and Its Uses; Springer: Cham, Switzerland, 2015. [Google Scholar]
  3. Li, Y.; Feng, P. Bamboo resources in China based on the ninth national forest inventory data. World Bamboo Ratt. 2019, 17, 45–48. [Google Scholar]
  4. Qi, S.; Song, B.; Liu, C.; Gong, P.; Luo, J.; Zhang, M.; Xiong, T. Bamboo forest mapping in China using the dense Landsat 8 image archive and Google Earth Engine. Remote Sens. 2022, 14, 762. [Google Scholar] [CrossRef]
  5. Dwivedi, A.K.; Kumar, A.; Baredar, P.; Prakash, O. Bamboo as a complementary crop to address climate change and livelihoods–Insights from India. For. Policy Econ. 2019, 102, 66–74. [Google Scholar] [CrossRef]
  6. Jian, J.; Jiang, H.; Zhou, G.; Jiang, Z.; Yu, S.; Peng, S.; Liu, S.; Wang, J. Mapping the vegetation changes in giant panda habitat using Landsat remotely sensed data. Int. J. Remote Sens. 2011, 32, 1339–1356. [Google Scholar] [CrossRef]
  7. Bal, L.M.; Singhal, P.; Satya, S.; Naik, S.; Kar, A. Bamboo shoot preservation for enhancing its business potential and local economy: A review. Crit. Rev. Food Sci. Nutr. 2012, 52, 804–814. [Google Scholar] [CrossRef]
  8. Manandhar, R.; Kim, J.-H.; Kim, J.-T. Environmental, social and economic sustainability of bamboo and bamboo-based construction materials in buildings. J. Asian Archit. Build. Eng. 2019, 18, 49–59. [Google Scholar] [CrossRef]
  9. Singhal, P.; Satya, S.; Sudhakar, P. Antioxidant and pharmaceutical potential of bamboo leaves. Bamboo Sci. Cult. 2011, 24, 19–28. [Google Scholar]
  10. Phimmachanh, S.; Ying, Z.; Beckline, M. Bamboo resources utilization: A potential source of income to support rural livelihoods. Appl. Ecol. Environ. Sci. 2015, 3, 176–183. [Google Scholar]
  11. Friedlingstein, P.; O’sullivan, M.; Jones, M.W.; Andrew, R.M.; Hauck, J.; Olsen, A.; Peters, G.P.; Peters, W.; Pongratz, J.; Sitch, S. Global carbon budget 2020. Earth Syst. Sci. Data Discuss. 2020, 12, 3269–3340. [Google Scholar] [CrossRef]
  12. Liu, Z.; Deng, Z.; He, G.; Wang, H.; Zhang, X.; Lin, J.; Qi, Y.; Liang, X. Challenges and opportunities for carbon neutrality in China. Nat. Rev. Earth Environ. 2022, 3, 141–155. [Google Scholar] [CrossRef]
  13. Weng, Y.; Cai, W.; Wang, C. Evaluating the use of BECCS and afforestation under China’s carbon-neutral target for 2060. Appl. Energy 2021, 299, 117263. [Google Scholar] [CrossRef]
  14. Zhou, G.; Meng, C.; Jiang, P.; Xu, Q. Review of carbon fixation in bamboo forests in China. Bot. Rev. 2011, 77, 262–270. [Google Scholar] [CrossRef]
  15. Sharma, R.; Wahono, J.; Baral, H. Bamboo as an alternative bioenergy crop and powerful ally for land restoration in Indonesia. Sustainability 2018, 10, 4367. [Google Scholar] [CrossRef]
  16. Shi, Q.; Zheng, B.; Zheng, Y.; Tong, D.; Liu, Y.; Ma, H.; Hong, C.; Geng, G.; Guan, D.; He, K. Co-benefits of CO2 emission reduction from China’s clean air actions between 2013–2020. Nat. Commun. 2022, 13, 5061. [Google Scholar] [CrossRef]
  17. Gupta, A.; Kumar, A. Potential of bamboo in sustainable development. Asia Pac. Bus. Rev. 2008, 4, 100–107. [Google Scholar] [CrossRef]
  18. Li, J.; Gu, L.; Zhu, W.; Shi, Y.; Ji, W.; Zheng, Y. Economic benefit of carbon sequestration project of CCER bamboo forest management in Anji County, Zhejiang Province. J. Zhejiang AF Univ. 2018, 35, 581–588. [Google Scholar]
  19. Gu, L.; Wu, W.; Ji, W.; Zhou, M.; Xu, L.; Zhu, W. Evaluating the performance of bamboo forests managed for carbon sequestration and other co-benefits in Suichang and Anji, China. For. Policy Econ. 2019, 106, 101947. [Google Scholar] [CrossRef]
  20. Hansen, M.C.; Potapov, P.V.; Moore, R.; Hancher, M.; Turubanova, S.A.; Tyukavina, A.; Thau, D.; Stehman, S.V.; Goetz, S.J.; Loveland, T.R. High-resolution global maps of 21st-century forest cover change. Science 2013, 342, 850–853. [Google Scholar] [CrossRef]
  21. Sulla-Menashe, D.; Friedl, M.A. User Guide to Collection 6 MODIS Land Cover (MCD12Q1 and MCD12C1) Product; USGS: Reston, VA, USA, 2018; pp. 1–18. [Google Scholar]
  22. Li, L.; Li, N.; Lu, D.; Chen, Y. Mapping Moso bamboo forest and its on-year and off-year distribution in a subtropical region using time-series Sentinel-2 and Landsat 8 data. Remote Sens. Environ. 2019, 231, 111265. [Google Scholar] [CrossRef]
  23. Fan, L.; Wigneron, J.-P.; Ciais, P.; Chave, J.; Brandt, M.; Fensholt, R.; Saatchi, S.S.; Bastos, A.; Al-Yaari, A.; Hufkens, K. Satellite-observed pantropical carbon dynamics. Nat. Plants 2019, 5, 944–951. [Google Scholar] [CrossRef] [PubMed]
  24. Su, Y.; Guo, Q.; Xue, B.; Hu, T.; Alvarez, O.; Tao, S.; Fang, J. Spatial distribution of forest aboveground biomass in China: Estimation through combination of spaceborne lidar, optical imagery, and forest inventory data. Remote Sens. Environ. 2016, 173, 187–199. [Google Scholar] [CrossRef]
  25. Wang, R.; Cai, W.; Yu, L.; Li, W.; Zhu, L.; Cao, B.; Li, J.; Shen, J.; Zhang, S.; Nie, Y. A high spatial resolution dataset of China’s biomass resource potential. Sci. Data 2023, 10, 384. [Google Scholar] [CrossRef]
  26. Perez, M.R.; Maogong, Z.; Belcher, B.; Chen, X.; Maoyi, F.; Jinzhong, X. The role of bamboo plantations in rural development: The case of Anji County, Zhejiang, China. World Dev. 1999, 27, 101–114. [Google Scholar] [CrossRef]
  27. Chen, X.; Zhang, X.; Zhang, Y.; Booth, T.; He, X. Changes of carbon stocks in bamboo stands in China during 100 years. For. Ecol. Manag. 2009, 258, 1489–1496. [Google Scholar] [CrossRef]
  28. Du, H.; Mao, F.; Zhou, G.; Li, X.; Xu, X.; Ge, H.; Cui, L.; Liu, Y.; Li, Y. Estimating and analyzing the spatiotemporal pattern of aboveground carbon in bamboo forest by combining remote sensing data and improved biome-bgc model. IEEE J. Sel. Top. Appl. Earth Obs. Remote Sens. 2018, 11, 2282–2295. [Google Scholar] [CrossRef]
  29. Fu, W.; Jiang, P.; Zhao, K.; Zhou, G.; Li, Y.; Wu, J.; Du, H. The carbon storage in moso bamboo plantation and its spatial variation in Anji County of southeastern China. J. Soils Sediments 2014, 14, 320–329. [Google Scholar] [CrossRef]
  30. Song, C.; Chi, X.-c.; Wang, X.-y.; Wang, Y.-x.; Ye, J.-w.; Zhu, X.-t.; Bai, S.-b. Effects of moso bamboo invasion on carbon storage in evergreen broad-leaved forest. J. Fujian Agric. For. Univ. (Nat. Sci. Ed.) 2020, 49, 809–815. [Google Scholar]
  31. Zhang, R.; Shen, G.; Zhang, X.; Zhang, L.; Gao, S. Carbon stock and sequestration of a Phyllostachys edulis forest in Changning, Sichuan Province. Acta Ecol. Sin. 2014, 34, 3592–3601. [Google Scholar]
  32. Wang, C.; Jiang, Z.-h.; Guo, Q.-r.; Liu, G.-l.; Li, Z.-d.; Shi, L. Biomass allocation of aboveground components of Phyllostachys edulis and its variation with body size. Chin. J. Ecol. 2014, 33, 2019. [Google Scholar]
  33. Wang, B.; Yang, Q.; Guo, Q.; Zhao, G.; Fang, K. Carbon storage and allocation of Phyllostachys edulis forest and evergreen broad-leaved forest in Dagangshan Mountain, Jiangxi. Guihaia 2011, 31, 342–348. [Google Scholar]
  34. Zheng, Y.; Chen, L.; Hong, W. Study on productivity and soil properties of mixed forests of Chinese fir and Phyllostachys heterocycla cv. pubescens. Sci. Silvae Sin. 1998, 34, 16–25. [Google Scholar]
  35. Yu, R.; Xiang, W.; Ning, C.; Luo, Z. Carbon storage and sequestration in four urban forest ecosystems in Changsha, Hunan. Acta Ecol. Sin 2016, 36, 3499–3509. [Google Scholar]
  36. Zhao, G.; Zhao, H.; Feng, S. Carbon storage characteristics of forest vegetation in Anji county of Zhejiang province. J. Northwest For. Univ 2017, 32, 82–85. [Google Scholar]
  37. Sibanda, M.; Mutanga, O.; Rouget, M. Examining the potential of Sentinel-2 MSI spectral resolution in quantifying above ground biomass across different fertilizer treatments. ISPRS J. Photogramm. Remote Sens. 2015, 110, 55–65. [Google Scholar] [CrossRef]
  38. Frantz, D.; Haß, E.; Uhl, A.; Stoffels, J.; Hill, J. Improvement of the Fmask algorithm for Sentinel-2 images: Separating clouds from bright surfaces based on parallax effects. Remote Sens. Environ. 2018, 215, 471–481. [Google Scholar] [CrossRef]
  39. Liu, X.; Su, Y.; Hu, T.; Yang, Q.; Liu, B.; Deng, Y.; Tang, H.; Tang, Z.; Fang, J.; Guo, Q. Neural network guided interpolation for mapping canopy height of China’s forests by integrating GEDI and ICESat-2 data. Remote Sens. Environ. 2022, 269, 112844. [Google Scholar] [CrossRef]
  40. Carlson, T.N.; Ripley, D.A. On the relation between NDVI, fractional vegetation cover, and leaf area index. Remote Sens. Environ. 1997, 62, 241–252. [Google Scholar] [CrossRef]
  41. Huete, A.; Didan, K.; Miura, T.; Rodriguez, E.P.; Gao, X.; Ferreira, L.G. Overview of the radiometric and biophysical performance of the MODIS vegetation indices. Remote Sens. Environ. 2002, 83, 195–213. [Google Scholar] [CrossRef]
  42. Xiao, X.; Boles, S.; Liu, J.; Zhuang, D.; Liu, M. Characterization of forest types in Northeastern China, using multi-temporal SPOT-4 VEGETATION sensor data. Remote Sens. Environ. 2002, 82, 335–348. [Google Scholar] [CrossRef]
  43. Dash, J.; Curran, P. Evaluation of the MERIS terrestrial chlorophyll index (MTCI). Adv. Space Res. 2007, 39, 100–104. [Google Scholar] [CrossRef]
  44. Feng, P.; Li, Y. China’s Bamboo Resources in 2021. World Bamboo Ratt. 2023, 21, 100–103. [Google Scholar]
  45. Ke, G.; Meng, Q.; Finley, T.; Wang, T.; Chen, W.; Ma, W.; Ye, Q.; Liu, T.-Y. Lightgbm: A highly efficient gradient boosting decision tree. Adv. Neural Inf. Process. Syst. 2017, 30, 3146–3154. [Google Scholar]
  46. Zhang, Y.; Zhou, S.; Gentine, P.; Xiao, X. Can vegetation optical depth reflect changes in leaf water potential during soil moisture dry-down events? Remote Sens. Environ. 2019, 234, 111451. [Google Scholar] [CrossRef]
  47. Wang, S.; Tan, S.; Xu, J. Evaluation and Implication of the Policies towards China’s Carbon Neutrality. Sustainability 2023, 15, 6762. [Google Scholar] [CrossRef]
  48. Wang, H.; Zuo, X.; Wang, D.; Bi, Y. The estimation of forest residue resources in China. J. Cent. South Univ. For. Technol. 2017, 37, 29–38. [Google Scholar]
  49. Pregitzer, K.S.; Euskirchen, E.S. Carbon cycling and storage in world forests: Biome patterns related to forest age. Glob. Chang. Biol. 2004, 10, 2052–2077. [Google Scholar] [CrossRef]
  50. Wang, R.; Guo, Z.; Cai, C.; Zhang, J.; Bian, F.; Sun, S.; Wang, Q. Practices and roles of bamboo industry development for alleviating poverty in China. Clean Technol. Environ. Policy 2021, 23, 1687–1699. [Google Scholar] [CrossRef]
  51. Karjalainen, T.; Kellomäki, S.; Pussinen, A. Role of wood-based products in absorbing atmospheric carbon. Silva Fenn. 1994, 28, 67–80. [Google Scholar] [CrossRef]
  52. Churkina, G.; Organschi, A.; Reyer, C.P.; Ruff, A.; Vinke, K.; Liu, Z.; Reck, B.K.; Graedel, T.; Schellnhuber, H.J. Buildings as a global carbon sink. Nat. Sustain. 2020, 3, 269–276. [Google Scholar] [CrossRef]
  53. He, M.; Luis, S.; Rita, S.; Ana, G.; Euripedes, V., Jr.; Zhang, N. Risk assessment of CO2 injection processes and storage in carboniferous formations: A review. J. Rock Mech. Geotech. Eng. 2011, 3, 39–56. [Google Scholar] [CrossRef]
  54. Sharma, B.; van der Vegte, A. Engineered bamboo for structural applications. In Nonconventional and Vernacular Construction Materials; Elsevier: Amsterdam, The Netherlands, 2020; pp. 597–623. [Google Scholar]
  55. Ye, H.; Wang, G.; Cheng, H.; Chen, F.; Jiang, Z. Unlocking the Potential of Bamboo as a Substitute for Plastic to Lead Global Sustainable Development. World Bamboo Ratt. 2023, 21, 1–8. [Google Scholar]
  56. Wang, L.; Cheng, J.; Wang, J.; Yang, J. Practices and Discussions on Targeted Poverty Alleviation with Bamboo Industry: A Case Study of Lingxi Village in Wuyuan County, Jiangxi Province. World Bamboo Ratt. 2018, 16, 55–59. [Google Scholar]
  57. Xu, L.; Shi, Y.; Zhou, G.; Xu, X.; Liu, E.; Zhou, Y.; Zhang, F.; Li, C.; Fang, H.; Chen, L. Structural development and carbon dynamics of Moso bamboo forests in Zhejiang Province, China. For. Ecol. Manag. 2018, 409, 479–488. [Google Scholar] [CrossRef]
  58. Qi, J.; Xie, D.; Jiang, J.; Huang, H. 3D radiative transfer modeling of structurally complex forest canopies through a lightweight boundary-based description of leaf clusters. Remote Sens. Environ. 2022, 283, 113301. [Google Scholar] [CrossRef]
  59. Desalegn, G.; Tadesse, W. Resource potential of bamboo, challenges and future directions towards sustainable management and utilization in Ethiopia. For. Syst. 2014, 23, 294–299. [Google Scholar] [CrossRef]
  60. Sawarkar, A.D.; Shrimankar, D.D.; Kumar, M.; Kumar, P.; Singh, L. Bamboos as a cultivated medicinal grass for industries: A systematic review. Ind. Crops Prod. 2023, 203, 117210. [Google Scholar] [CrossRef]
  61. Xie, A.; Shi, X.; Zhong, Y.; Bi, Y.; Fan, W. Predicament and Countermeasures of Bamboo Industry Development in Suichang County, Zhejiang Province. World Bamboo Ratt. 2022, 20, 70–74. [Google Scholar]
  62. Xu, Q.-F.; Liang, C.-F.; Chen, J.-H.; Li, Y.-C.; Qin, H.; Fuhrmann, J.J. Rapid bamboo invasion (expansion) and its effects on biodiversity and soil processes+. Glob. Ecol. Conserv. 2020, 21, e00787. [Google Scholar] [CrossRef]
  63. Rathour, R.; Kumar, H.; Prasad, K.; Anerao, P.; Kumar, M.; Kapley, A.; Pandey, A.; Kumar Awasthi, M.; Singh, L. Multifunctional applications of bamboo crop beyond environmental management: An Indian prospective. Bioengineered 2022, 13, 8893–8914. [Google Scholar] [CrossRef] [PubMed]
  64. Mao, F.; Zhou, G.; Li, P.; Du, H.; Xu, X.; Shi, Y.; Mo, L.; Zhou, Y.; Tu, G. Optimizing selective cutting strategies for maximum carbon stocks and yield of Moso bamboo forest using BIOME-BGC model. J. Environ. Manag. 2017, 191, 126–135. [Google Scholar] [CrossRef] [PubMed]
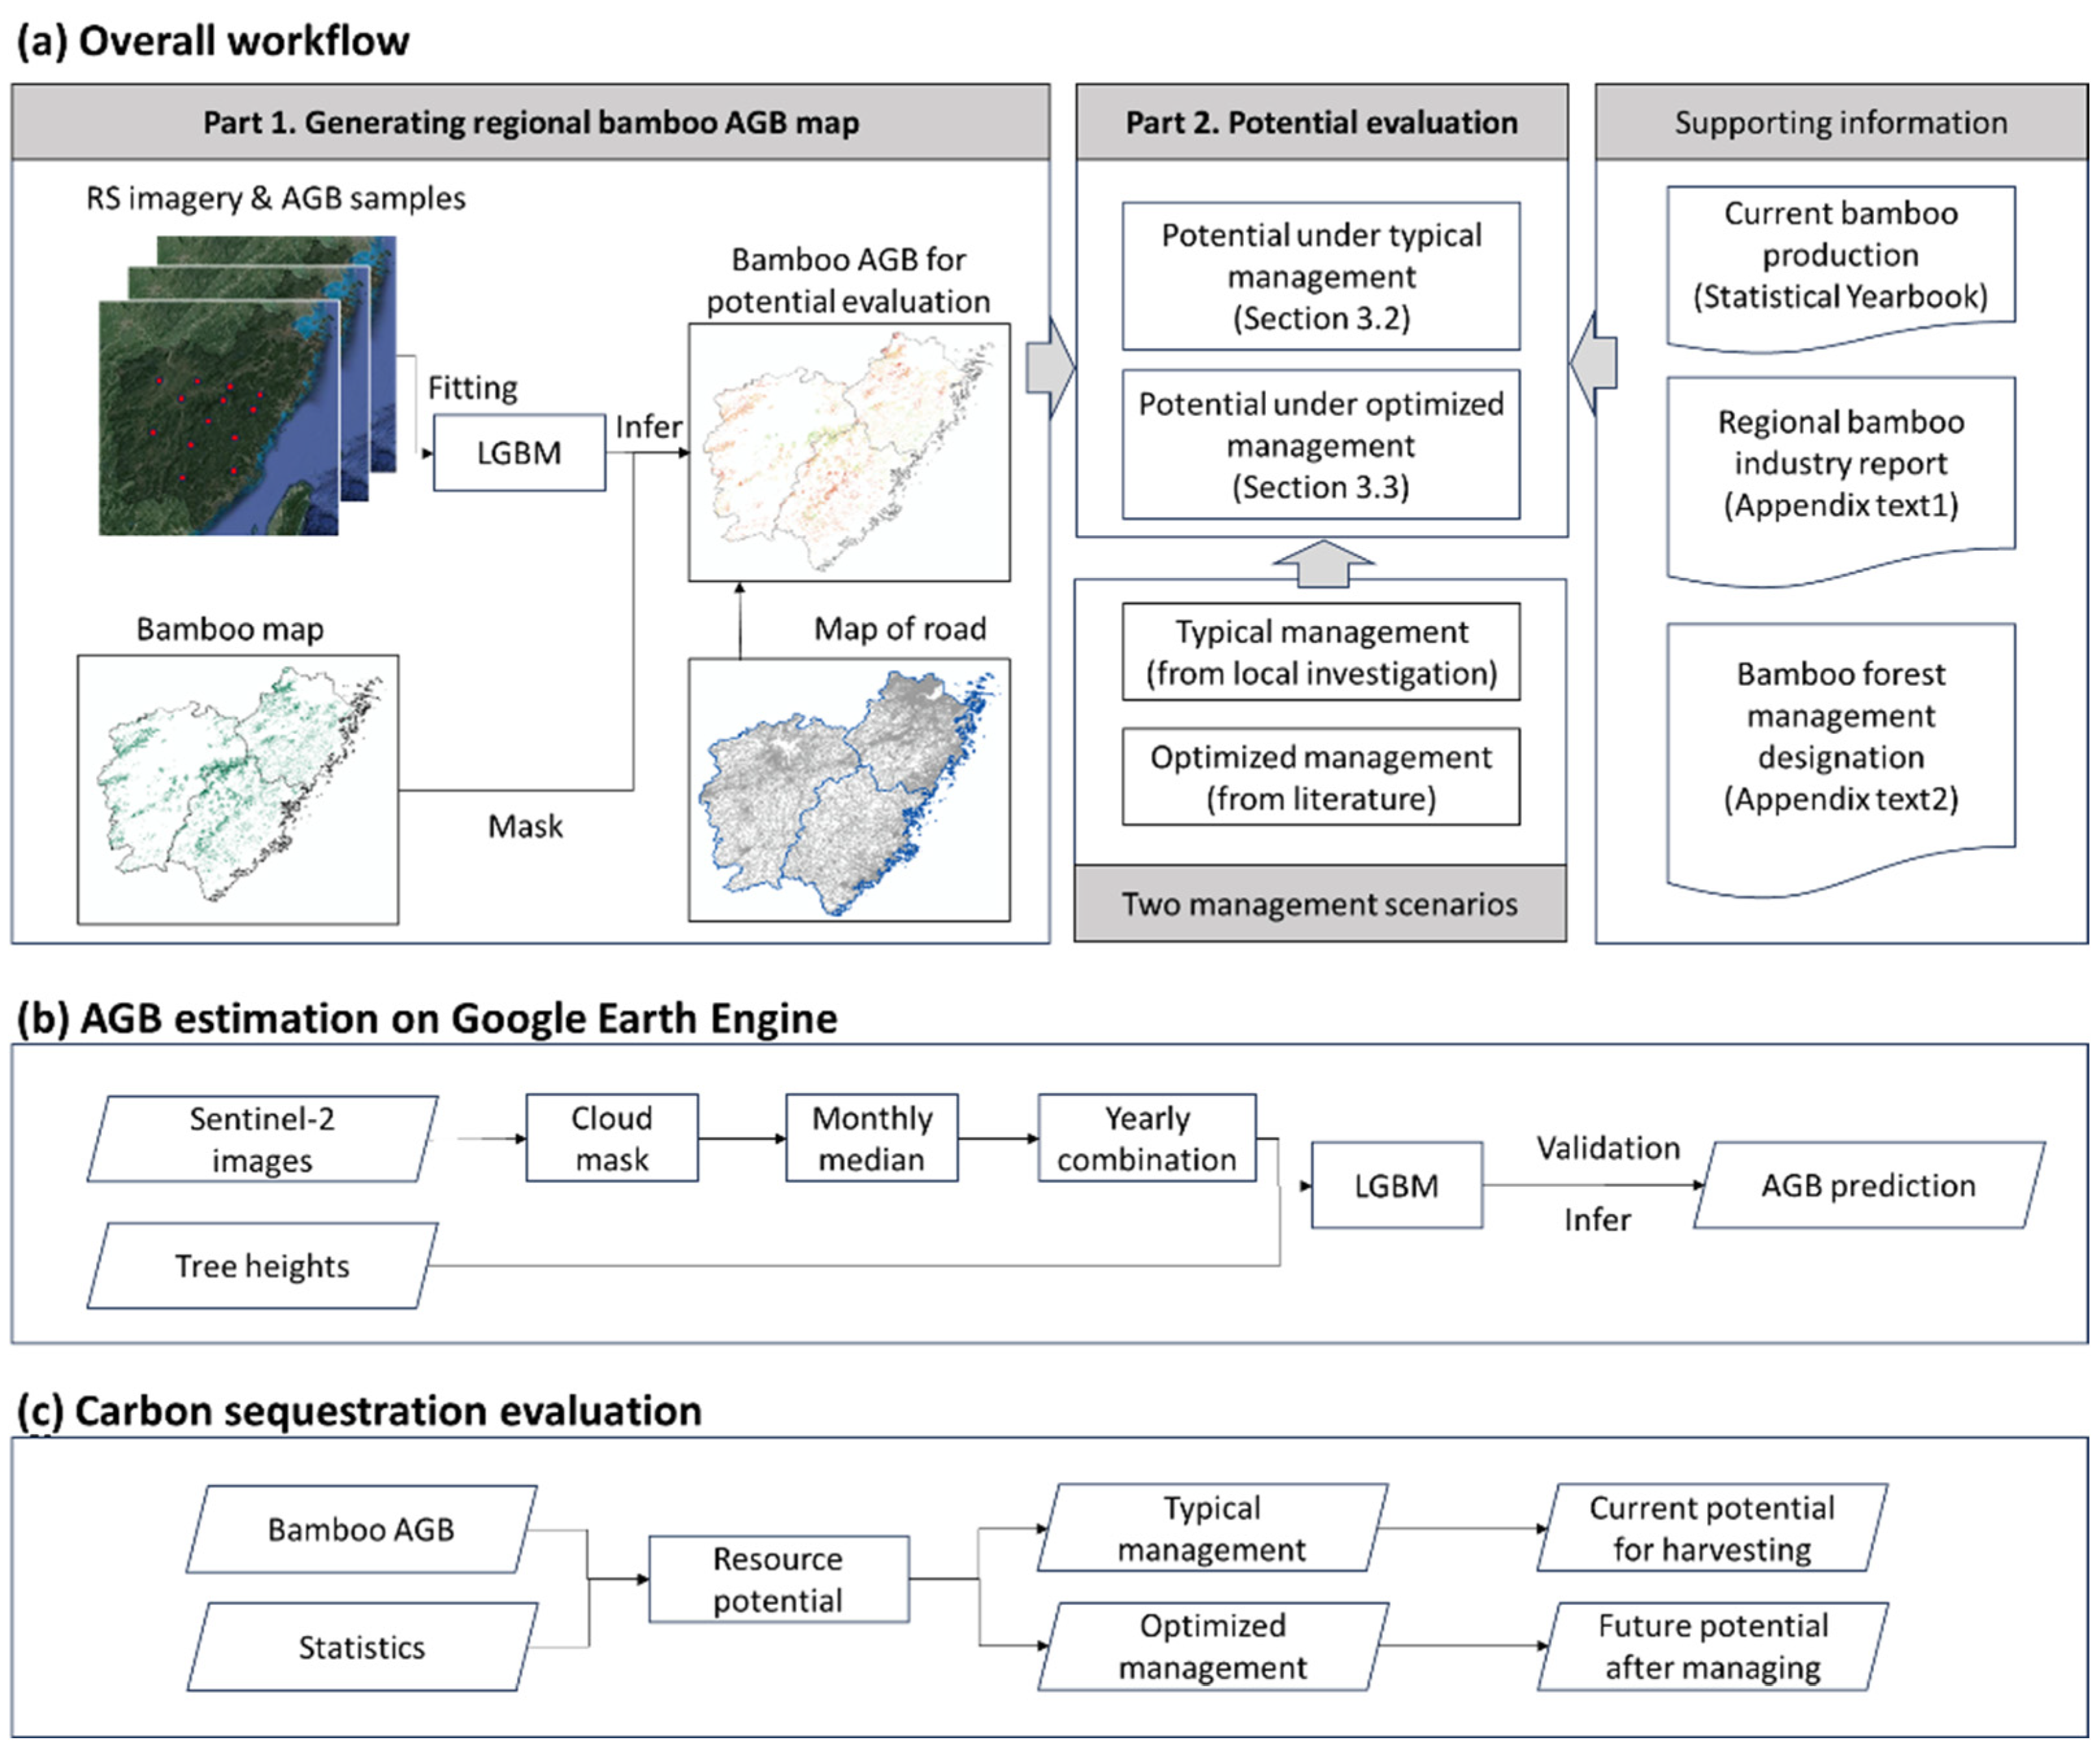
Figure 1. Workflow of (a) this study, (b) AGB estimation, and (c) potential evaluation. The LGBM (light gradient boosting machine) algorithm is employed for AGB fitting. The details of the optimized management scenario refer to Gu et al. [19].
Forests 15 01907 g001
Figure 2. Position of the study area and spatial distribution of the field samples. The bamboo map in the background is from Qi et al. [4] with 30 m resolution. The position of Anji county and AGB samples are labeled in the figure.
Forests 15 01907 g002
Figure 3. Comparison of estimated bamboo AGB by the LGBM against field observation. The fitting function and statistical metrics are labeled in the figure. MAE represents the mean absolute error; RMSE represents the root mean square error.
Forests 15 01907 g003
Figure 4. Spatial distribution of bamboo AGB in three provinces. The bamboo AGB and area for each province in this study are labeled in black, while the data suggested by the Ninth National Forest Inventory are labeled in blue.
Forests 15 01907 g004
Figure 5. Spatial distribution of annual bamboo potential in (a) producing culms, (b) producing biofuels, and (c) providing local income. The province-scale potential is labeled in this figure. The border of cities is represented by a grey line and the border of provinces is labeled by a black line.
Forests 15 01907 g005
Table 1. Overview of field-observed bamboo samples.
TypeNumberDiameter/cmAge/duCoverage/%Height/mBamboo Density/haAGB/t/ha
11268.34 ± 1.643 ± 174.37 ± 10.755.48 ± 2.11984.57 ± 776.9821.33 ± 11.12
212410.57 ± 1.063.43 ± 0.2375.24 ± 10.4914.19 ± 1.913447.92 ± 576.7849.85 ± 18.43
Table 2. Introduction of optical remote sensing indexes. NIR, RED, BLUE, SWIR, and RedEdge-x represent the near-infra-red band, red band, blue band, and the xth red-edge band, respectively.
NameIndexFormulaReference
Normalized Difference Vegetation IndexNDVI(NIR − RED)/(NIR + RED)[40]
Enhanced Vegetation IndexEVI2.5 × ((NIR-RED)/(NIR + 6 × RED − 7.5 × BLUE + 1))[41]
Land Surface Water IndexLSWI(NIR − SWIR1)/(NIR + SWIR1)[42]
MERIS Terrestrial Chlorophyll IndexMTCI(RedEdge2 − RedEdge1)/(RedEdge1 − RED)[43]
Table 3. Net profit of three major bamboo forest products from 2017 to 2021 in Anji, Zhejiang province.
PricesYear
20172018201920202021
Price of bamboo culms (CNY/kg)0.50.50.50.40.4
Price of spring shoots (CNY/kg)1.92.12.32.63.1
Price of winter shoots (CNY/kg)24.026.024.024.030.0
Disclaimer/Publisher’s Note: The statements, opinions and data contained in all publications are solely those of the individual author(s) and contributor(s) and not of MDPI and/or the editor(s). MDPI and/or the editor(s) disclaim responsibility for any injury to people or property resulting from any ideas, methods, instructions or products referred to in the content.