Article

Yield and Survival of 19 Cultivars of Willow (Salix spp.) Biomass Crops over Eight Rotations

Department of Sustainable Resources Management, SUNY College of Environmental Science and Forestry, Syracuse, NY 13210, USA
*
Authors to whom correspondence should be addressed.
Forests 2024, 15(11), 2041; https://doi.org/10.3390/f15112041
Submission received: 23 September 2024 / Revised: 2 November 2024 / Accepted: 14 November 2024 / Published: 19 November 2024

Abstract

:
This study reveals patterns of yield and survival of short-rotation coppice (SRC) willow cultivars over eight rotations (1993–2019). Cultivars fell into four broad categories: commercial, released, stable, and decline. SV1, the singular cultivar that advanced to commercial deployments, had first-rotation yields of 8.9 Mg ha−1 a−1, peaking at 15.2 Mg ha−1 a−1 by the fourth. Mean yields from rotations 2–8 were still 36% above first-rotation yields, confirming the commercial potential for this cultivar over 26 years. The released group (four cultivars) had stable yields over six rotations (approximately 3 to 7 Mg ha−1 a−1), rising to match commercial yields (10 Mg ha−1 a−1) between the sixth and eighth rotation. Most of the cultivars were in the stable group that had relatively consistent yields over time. First-rotation yields in this group were approximately 5 Mg ha−1 a−1, and average yield increased by 23% for rotations 2–8. The two cultivars in the decline group were impacted by disease and browsing that lowered survival and growth. These findings are crucial for understanding willow systems’ potential over their full lifespan as a bioenergy crop, which is a crucial input into yield, economic, and environmental models.

1. Introduction

Shrub willow (Salix spp.) is a fast-growing perennial woody plant native to North America, Asia, and Europe. While the benefits and attributes of shrub willow have been known for centuries, there has been growing interest in recent decades for potential uses for bioenergy and biofuels because of its perennial nature, fast growth rate, and the range of environmental and socioeconomic benefits it can provide [1].
Shrub willow’s high yield potential, rapid growth rate, and carbon neutrality make it an attractive option as a feedstock for the generation of renewable energy. The crop can be used directly as a source of heat and electricity production through combustion or harvested and processed into biofuels such as ethanol, renewable diesel, or sustainable aviation fuels [2,3]. The United States has set an ambitious goal of producing 3 billion gallons of sustainable aviation fuel (SAF) by 2030 and 35 billion gallons by 2050 [4], which will require over one billion dry tons of biomass per year, including an estimated 110 million tons per year from perennial woody crops like willow [5]. For shrub willow to play a role in this transition, it is imperative to comprehend how willow production evolves throughout its projected lifespan of 20–25 years and the potential implications of these changes on the economic and environmental viability of shrub willow.
Understanding the dynamics of long-term yield is of paramount importance in the effective cultivation and utilization of shrub willow and other short-rotation woody crops. Many variables, including site conditions, genetics, weather, land management practices, and harvesting techniques, can influence the growth, biomass production, and productivity of shrub willow [6]. Consequently, conducting and monitoring long-term research becomes indispensable in evaluating the sustainability, economic viability, and environmental impacts of shrub willow. Obtaining data on the long-term dynamics of shrub willow will enable informed management and economic decision-making and foster the development of a robust market.
The expected service life for a willow field is 7 or 8 three-year harvest rotations before the crop needs to be removed and replaced. Currently, economic and life cycle assessments of the willow biomass crops in the United States (US) have been based on models where there are seven harvests based on three-year rotations (e.g., [2,5,7,8,9,10,11]. Yield is consistently one of the most important factors influencing both the economic and the environmental attributes of this system. However, data that captures the full lifespan of any willow plantings is limited, particularly in North America.
Currently, cultivar selection, management decisions, and economic projections predominantly rely on data from one to three harvest rotations. For example, data from a network of 17 trials in the United States only included four sites with data from two rotations, and only one site had data from three rotations [12]. As a result, the yield model developed from this network relied heavily on data from the first rotation, with yield projections for later rotations based on expert knowledge and estimation. Yield projections from this model were used in the 2016 and 2024 Billion Ton Reports [5,7].
Recent studies have reported yields of different willow genotypes over two to three rotations. Sleight et al. [13,14] summarized yield data from a set of 25 willow cultivars grown on five different sites, finding that second-rotation yields only increased when the first-rotation yield was less than 9.7 Mg ha−1 a−1. When only the top three genotypes were included in the analysis (a narrow deployment strategy), 11.4 Mg ha−1 a−1 was the first-rotation yield cut-off where no increase in second-rotation yield is expected. Sleight and Volk [13] found that there were no significant changes in yield for 18 willow cultivars planted at two sites over three rotations. When just the top three cultivars were included in the analysis, there was no significant change in yield (13.1 Mg ha−1 a−1 to 12.6 Mg ha−1 a−1) at one site and a slight increase in yield at the second site (10.6 Mg ha−1 a−1 to 11.4 Mg ha−1 a−1). Another study reporting yield data over three rotations for sites in New York (NY) and Minnesota (MN) found that for the top three cultivars, first-rotation yield was lower at the NY site and increased over the three rotations (9.6 Mg ha−1 a−1 to 12.2 Mg ha−1 a−1). At the MN site, first-rotation yields for the top three cultivars were higher, and there was still a small increase in yield (10.0 Mg ha−1 a−1 to 11.1 Mg ha−1 a−1). These reported changes over three rotations follow a pattern similar to those reported over two rotations by Sleight et al. in 2015 [14]. As a result of these studies, technoeconomic analysis (TEA) and life cycle assessments (LCA) assessments over seven rotations have used a small increase in yield from the first to second rotation and then held yields stable for rotations three through seven, but data from yields in the later rotations are lacking.
Two trials in southern Quebec, Canada, planted in 1995 and 1999, showed that over four rotations, willow biomass yield exhibited changes that were not statistically different beyond the first rotation, with minor variation between individual cultivars [15]. Similarly, a 16-year yield trial planted in 1996 in Sweden had consistent yield patterns over six rotations and highlighted the impact of establishment methods such as rods and cuttings on long-term productivity. It was found that willow established through planting 1.8 m rods exhibited a 21% higher first-rotation yield compared to those that were established through 0.20 m cuttings, although the rods demonstrated an 11% lower yield by the third rotation. For the fifth and sixth rotations, the differences between these two establishment methods were no longer significant [16]. A limitation of the Larsen et al. [16] trial was incomplete yield data for the fourth and fifth harvest rotations that were encountered in this trial due to a bacterial disease affecting one of the research blocks in the fourth rotation.
Another study conducted in Sweden based on commercial-scale willow crops over five rotations initiated in 1986 suggested that yield increased after the first rotation, remained stable for several rotations, and then declined in the fifth rotation [17]. In contrast to other research mentioned, a study over four rotations in Poland, initiated in 2003, revealed the highest yield to be from the first rotation, with yields in subsequent rotations remaining stagnant or exhibiting a decline depending on the planting density. The researchers emphasized the influential role of soil conditions, rainfall levels, and pest infestation in determining the survival rates and yield of willow. Furthermore, they identified a correlation between planting density and yield over time, with a planting density of 24,000 cuttings ha−1 demonstrating the least significant decline in yield over time compared to densities of 12, 48, or 96 thousand cuttings per hectare [18].
A substantial knowledge gap persists regarding the long-term yield performance of shrub willow despite previous work. There remains a need for this kind of information, especially data for rotations 4–7 of willow, to improve confidence in the outputs of economic and environmental models. Findings from various long-term yield trials emphasize the critical role of environmental factors, including climate, soil quality, and pest management, in determining the long-term yield performance and viability of shrub willow plantations [6,19,20]. Additionally, the establishment method, such as planting density and methodology (e.g., willow cuttings vs. rods), and genotype have been identified as significant factors influencing yield over multiple rotations [21,22,23]. This work underscores the importance of considering these factors when evaluating the sustainability and productivity of shrub willow plantations over an extended period [24].
The objective of this study is to measure and report yield and survival data for 19 willow cultivars across eight rotations at a location in central NY state and to assess if weather patterns had a discernable impact on yield over time.

2. Materials and Methods

2.1. Trial Description

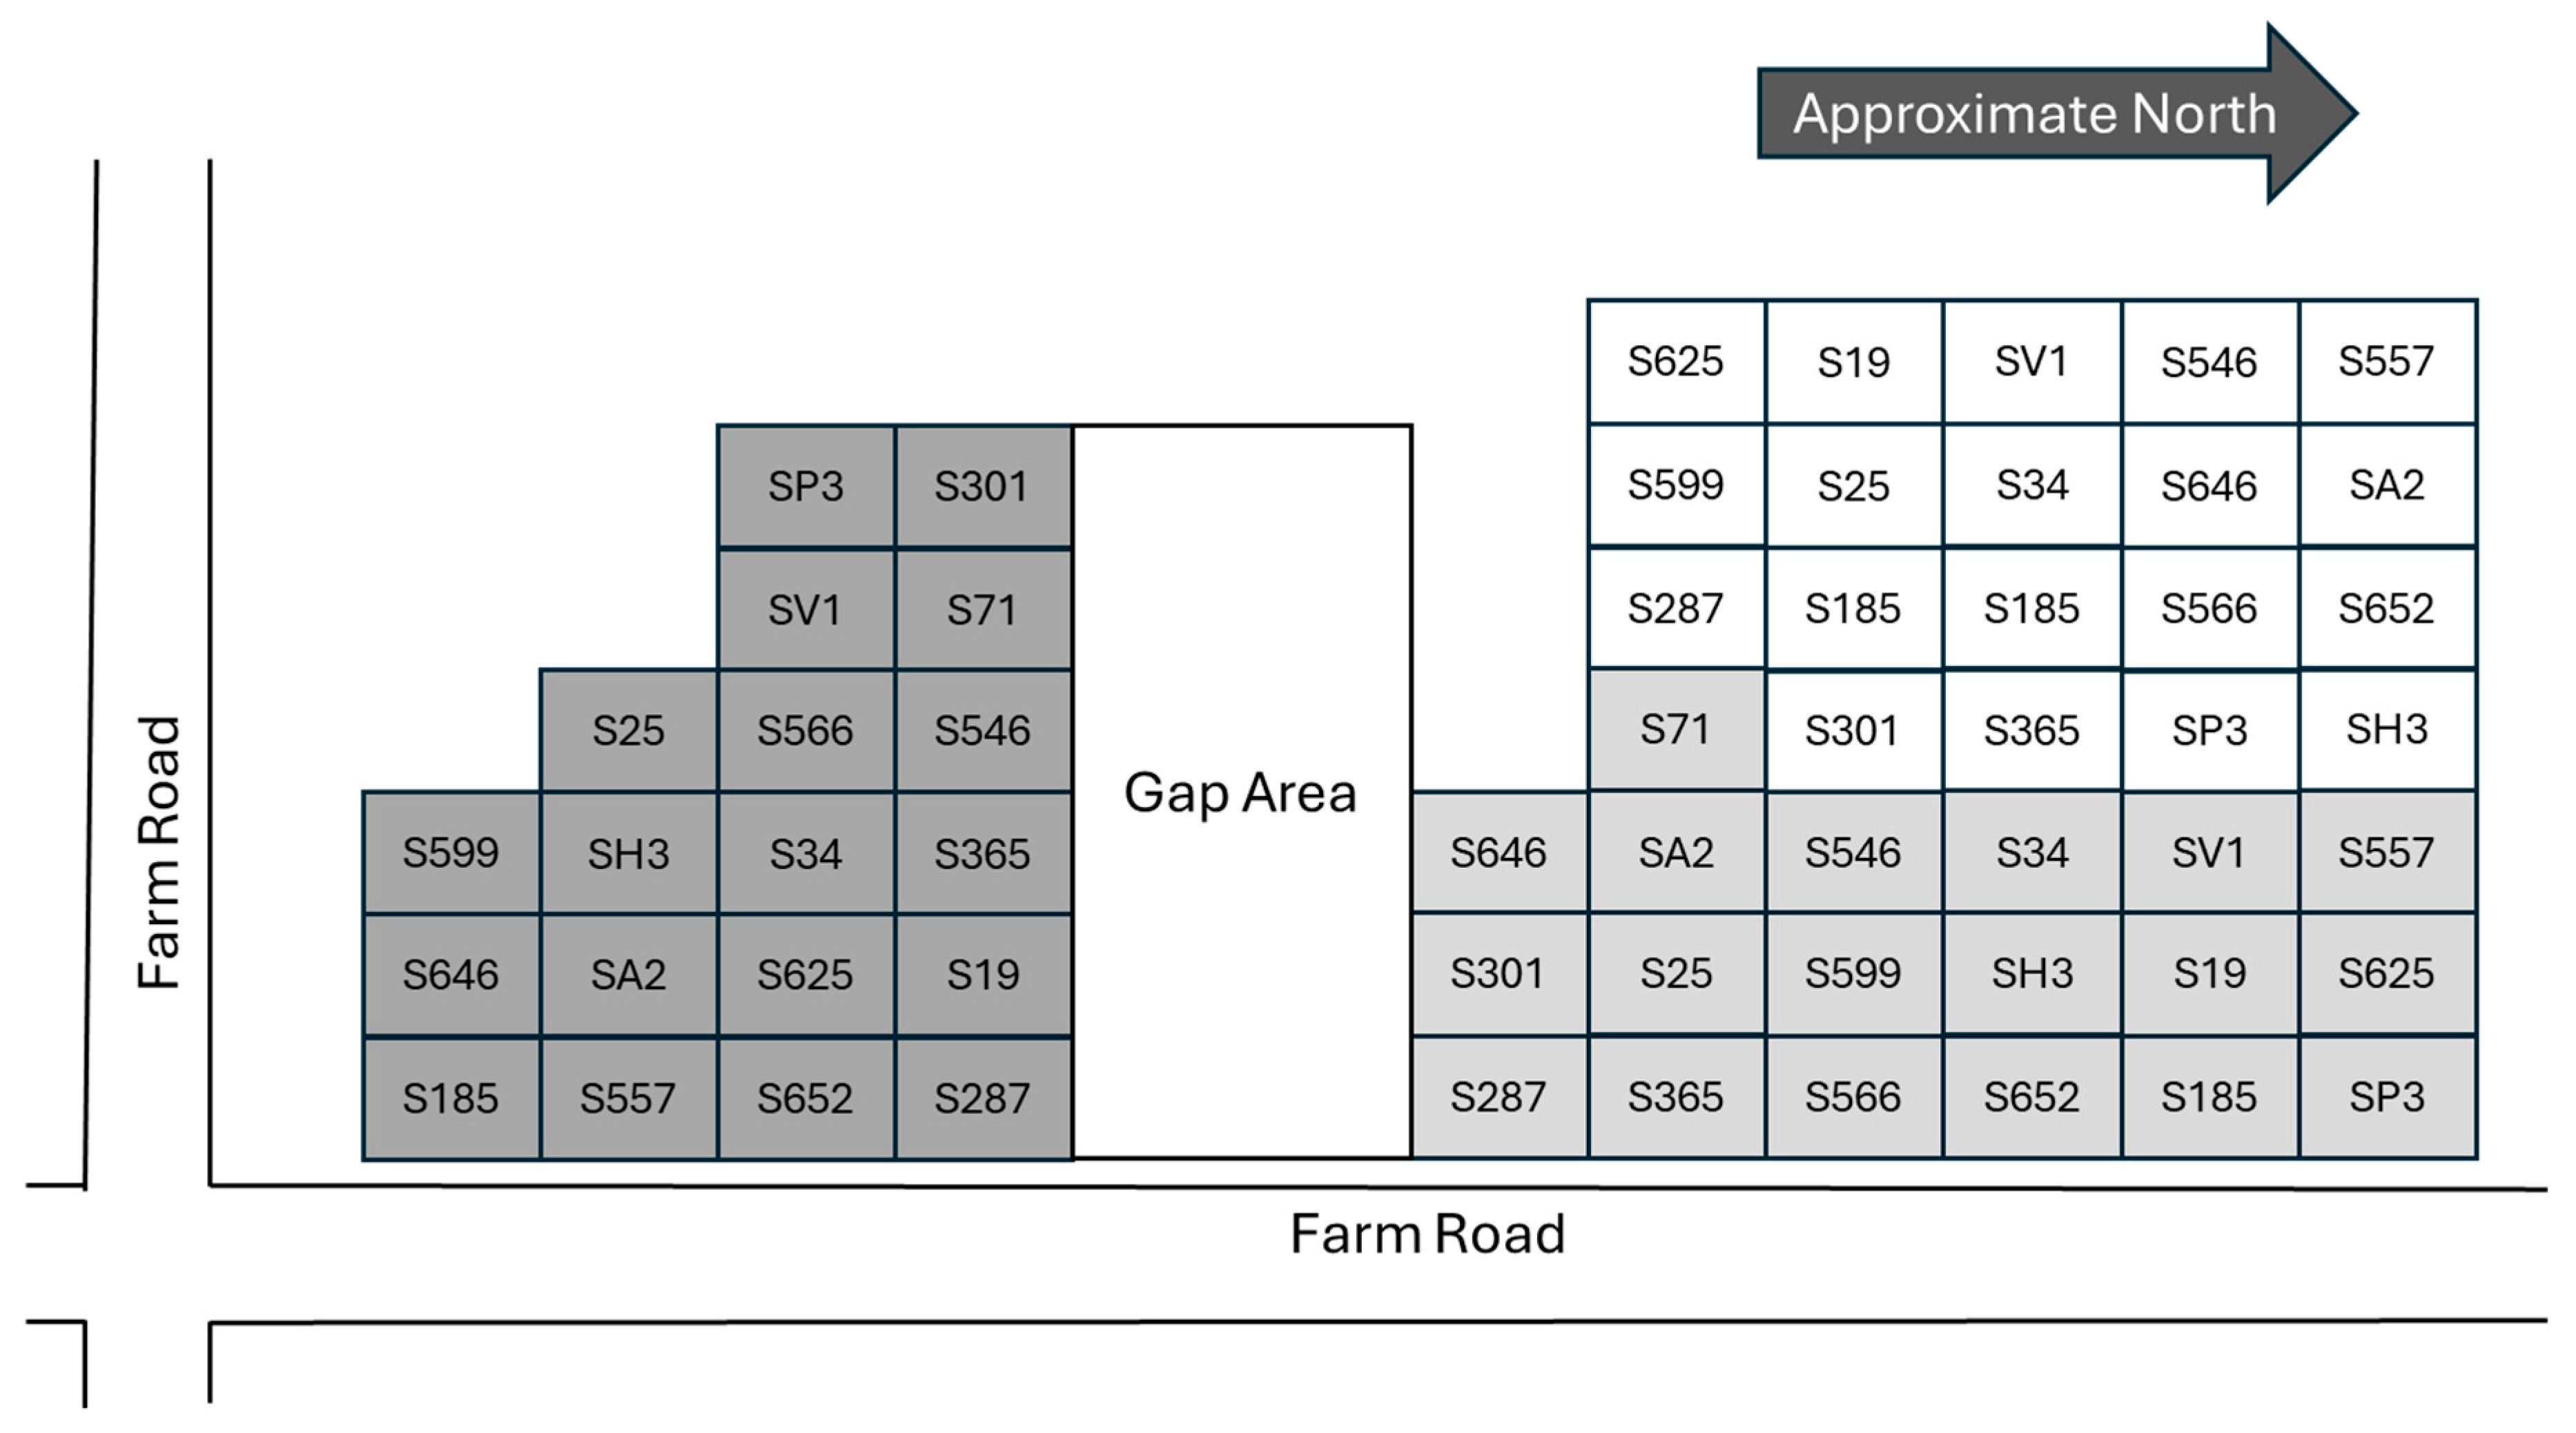
The trial is located in Tully, NY (42.796058° N, 076.119252° W), on a Palmyra gravelly loam soil with less than 5% slope [14]. The trial is a completely randomized block design with each of the 19 cultivars (Table 1; Figure A1) being included in each of the three blocks. The crop is grown in situ and without irrigation, as they are grown in commercial stands. Before establishment, vegetation at the site was sprayed with glyphosate and the site was plowed and disked [25]. Three double rows of willow were planted in each plot in May 1993 using 25 cm long cuttings at a density of 15,346 plants ha−1. Cuttings were planted in double rows with 1.52 m between the double rows, 0.76 m between the two rows in double rows, and 0.61 m between plants along the row. Following planting, the site was sprayed with oxyfluorfen (2.24 kg a.i. ha−1) and the plants were coppiced at a height of 2–5 cm after the first growing season. In the spring, following coppicing, and after each rotation, the plots were fertilized with 100 kg N ha−1.
Plot size varied by width to allow room for an additional buffer row on the outer double row for plots on the edge trial that were not boarded by other willow plots. As a result, the plot size varied, and the number of cuttings planted per plot ranged from 56 to 72. Measurements were taken on the space occupied by the original inner 30 plants in each plot.

2.2. Data Collection

Plots were harvested by hand on a three-year rotation, except for the third and eighth rotations, which were four years. All stems attached within the plot were harvested during the dormant season after the leaves had dropped using a brush saw at a height of 5–10 cm. All biomass within the plot was cut, laid on straps, and suspended from hanging scales on a tractor bucket to the nearest 0.1 kg. The cutting height promotes vigorous production of new stems for the next harvest. A subsample of 1–2 kg of chipped willow was weighed in the field and dried at 60 degrees C to a constant weight to determine moisture content. All yield data are reported on a dry weight basis, scaled, and annualized to Mg ha−1 a−1. In addition, a relative yield was determined for each plot using its first-rotation yield as a baseline (annualized yield of a given rotation (2 through 8) divided by first rotation annualized yield). Survival reflects the number of living plants in the original 30 plants in each plot.
To examine the potential influence of climate on willow yield and survival, historical weather data was compiled for both Syracuse and Tully, New York, from 1993 to 2020 from the NOAA Climate Data Online [26]. The information in this dataset includes daily temperature, precipitation, and snowfall readings. Tully’s data was fragmented while the Syracuse data was complete. A simple linear regression model was developed to coarsely predict the number of days of rainfall greater than 25 mm for 3 months before the growing season (90 days) and the early growing season (43 days) at the study site using data from Syracuse Hancock Airport (unpublished model). The impact of drought on the study site and relevant historical drought data were also procured from the US Drought Monitor [27].
Growing degree days (GDD) is the accumulated number of degrees of the average daily temperature over a reference temperature (10 degrees C) over a given period; it is a quantitative measurement of heat accumulation that is well correlated to plant growth [28,29]. For instance, the 30-year annual precipitation at the study site is 1039 mm with 967 GGD [14]. Climate Smart Farming’s growing degree day calculator [30] uses a network of regional and farm-deployed weather stations to interpolate degree days for locations in the Northeastern United States. For the purposes of this study, the growing season spans from 18 May to 30 September, while the early growing season ranges from 18 May to 30 June [31].

2.3. Statistical Analysis

Annualized yield and survival were available for each 3- or 4-year rotation for each plot. Mean annualized yield, survival, and relative yield were determined for each cultivar using the MEANS procedure in SAS (9.4). Next, cultivars were placed into one of four groups based on survival and yield and survival patterns (Table A1): “commercial”, the only cultivar with an average yield greater than 10 Mg ha−1 a−1, which was later used in wide-scale planting; “released”, cultivars with yields that increased in at least 6 of 8 rotations and approach the commercial yields by the eighth rotation; “stable”, cultivars without distinct trends in yield or survival; and “decline”, cultivars that had distinct reductions in yield in 6 of 8 rotations, drops of at greater than 20% after the first rotation, and survival under 20% by the eighth rotation.
Summary statistics for these groups were determined by rotation using the UNIVARIATE and MEANS procedures (SAS 9.4). The 95% confidence interval for the combined relative yields for rotations 2 through 8 were used to estimate the range of expected improvement and whether there were significant improvements over the first rotation. Significant differences in certain groups were evaluated using the LSMEANS statement in the GLIMMIX procedure (SAS 9.4). Significant differences between yields and survival from one rotation to the next for individual cultivars were obtained using LSMESTIMATE statements in the GLIMMIX procedure. Significant differences for groups of rotations (e.g., drought vs. normal) were determined using contrasts and the LSMESTIMATE statement.

3. Results and Discussion

3.1. Biomass Yield and Climate Data over Eight Rotations

Across eight rotations, the average yield of all cultivars ranged between 5.2 and 6.7 Mg ha−1 a−1 (Figure 1). Rotations one, three and six had the numerically lowest yields. Rotation 2 had the highest yield, but it was only significantly greater than the three least productive rotations (1, 3, and 6). A study that included 20 willow cultivars in monoculture and random mixtures of 5 to 20 cultivars found that the yield in monoculture plots (similar to this current study) was fairly stable over four rotations, unlike the patterns yield patterns in this study [32,33]. The 20-way random mixture had the highest yields in the first three rotations and there was a 67% increase in yield from the first to second rotation. The yields of the 20-way mixture in the third and fourth rotation were lower than the second rotation but still among the highest yields in the trial. The third and fourth rotation yield in the 20-way plots were greater than the first-rotation yields, like the pattern in this trial, where the first-rotation yield was the lowest over multiple rotations.
The growing season during the sixth rotation was 13% warmer than the 30-year average, with 1173 growing degree days (10 degrees C), and the early growing season was 21% warmer than the 30-year average (Table 1). The fifth rotation was the coolest overall rotation (5% cooler), and the third rotation had the coolest early growing season (12% cooler).
The rotations where annual production decreased were characterized either by a warm overall growing season (rotations 6 and 8) or a cool early growing season (rotation 3). Rotations 3 and 6 also had early-season GDD that were substantially different than the 30-year average. Early season GDD for rotation three was 88.2% of the 30-year average, and the first growing season after harvest when the willow was resprouting was exceptionally cool, at 80.34% of the 30-year average. The early growing season of rotation 6 was warmer, with GDD being 121.3% of the 30-year average.
Six of the eight rotations had some period of drought during one of the years. The exceptions were rotations four and seven, where no periods of drought were reported. The first (7 months) and sixth rotation (10 months) have the longest periods of drought among all the rotations. Other studies have noted that water availability is often a key factor limiting willow yields, [34,35], so the lower yields in rotations with more drought were anticipated. These rotations were also among the lowest average yields across all the cultivars. The sixth rotation also had above-average GDD early in the growing season (121.3% of the 30-year average) and over the entire growing season (113.1%), suggesting that it was both hot and dry.
Thus, the three rotations with the lowest yields showed some deviation from long-term averages for GDD and/or drought. One of the challenges in making more precise assessments of the impact of drought or GDD with this system is that the yield data for each rotation covers three or four growing seasons; annual data were not collected. Kopp et al. [36] reported data from an irrigated willow trial over 10 annual harvests and found that the seasons with the lowest GDD had lower production and that the year with the highest production was also the year with the greatest GDD. Because this trial was irrigated, the interactions between rainfall and GDD were not assessed. A study in Japan that harvested willow plots annually noted that weather factors such as hours of sunshine over the growing season, early season temperatures, and amounts of mid-season rainfall all had significant positive effects on the yield of the willow in the trial [20].
A potential pattern between atypical early growing season GDD values and subpar cultivar production performances is suggested by weather patterns. Specifically, the harvests with the highest and lowest average early growing season GDDs exhibited the most unfavorable changes in yield and overall productivity when compared to all other harvests. Additionally, the most unfavorable changes in yield corresponded to the third and eighth harvests, which were 4-year rotations. However, this may have as much to do with canopy closure as weather conditions as this typically occurs in year three for willow grown in New York [37,38]. Notably, the overall average GDDs for growing seasons did not correspond as well to willow performance as early season GDDs. Rotation three exhibited a decline and had the coolest GDDs of any rotation. The first regrowth year during rotation three was also the coldest of the growing seasons as well as the coldest of all the early growing seasons. Rotation six, which also showed a decline, was unusually high in GDD and dry, which could be a factor in the poor yield performance. It is possible that the first year of a rotation’s weather has a disproportionate impact on the rotational yield since it is important for the willow to be able to grow above the weeds as quickly as possible. However, GDD data did not have a uniform effect on all cultivars, with several distinct groupings of cultivars reacting differently to different rotations. For example, several cultivars (S287, SP3, SA2) showed rapid increases in yields following rotation 6 while many others showed minimal variation following said rotation.
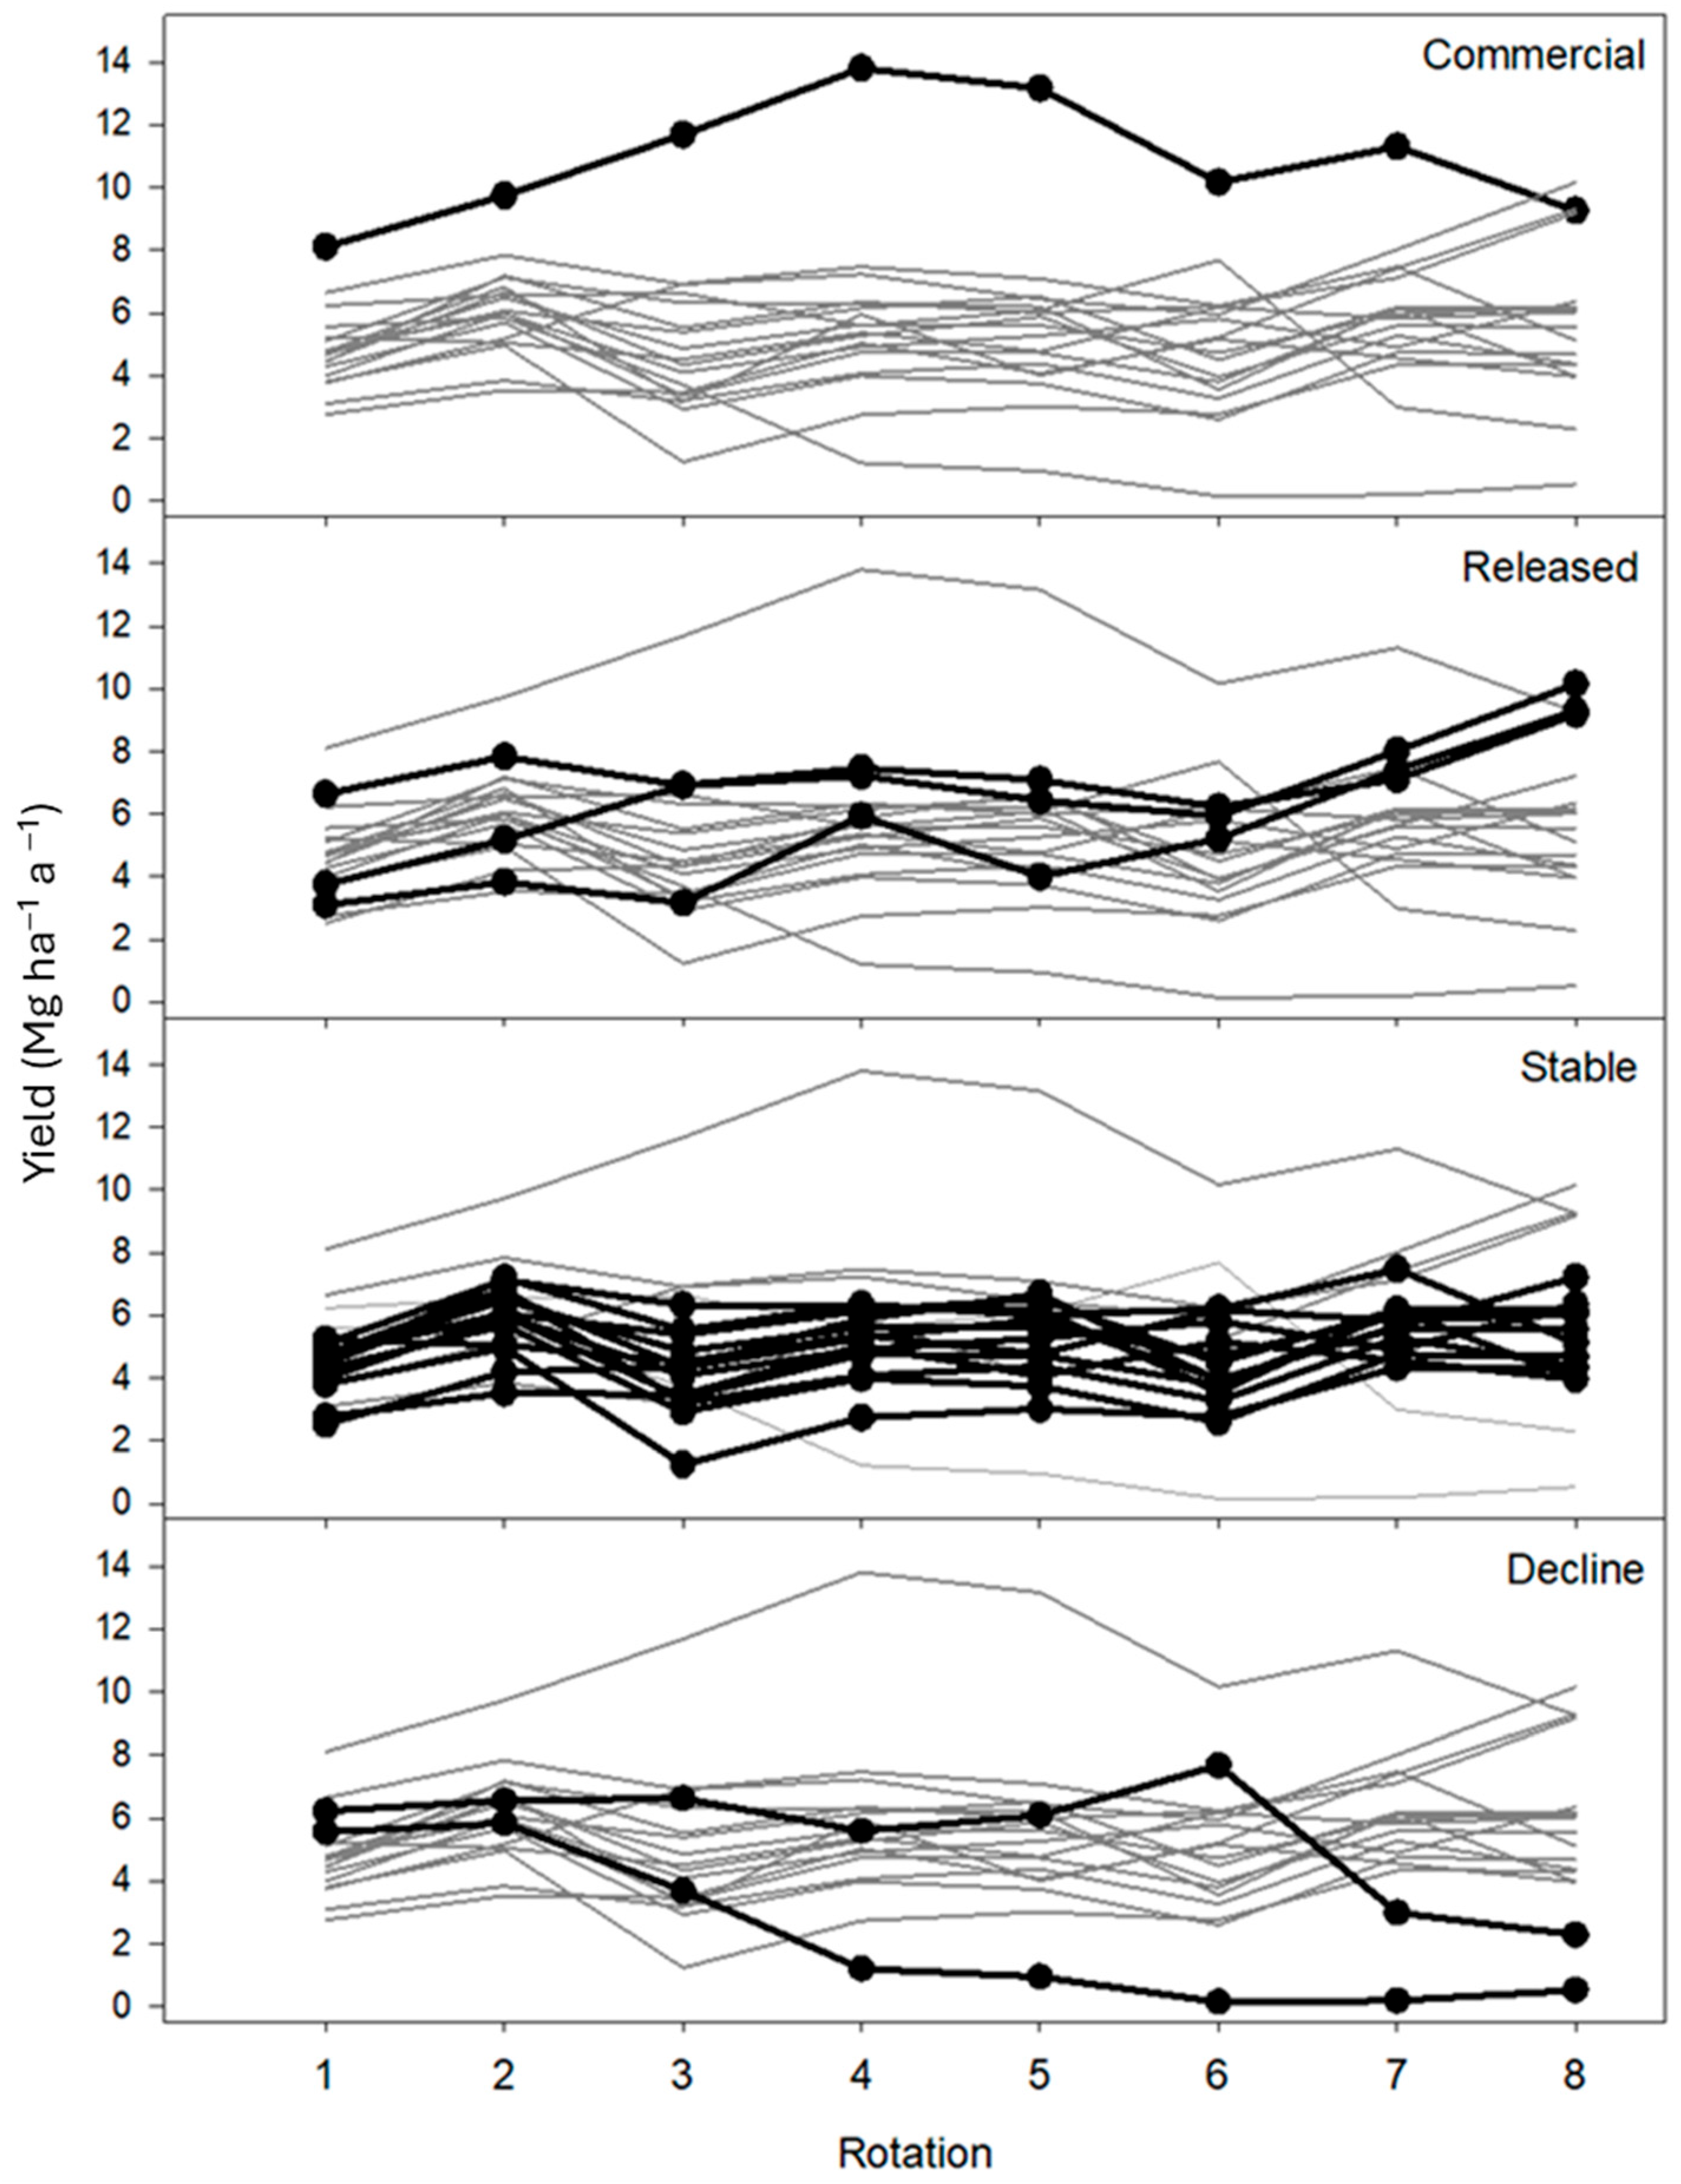
Yield patterns of individual cultivars over the eight rotations were categorized into four distinct groups (Figure 2). The only cultivar that is still available and has been used in commercial-scale plantings is SV1. This cultivar was placed in its own group, designated “commercial”. Its mean yield was 11.8 Mg ha−1 a−1, significantly (p < 0.0001) higher than the mean of other cultivars and 3.8 Mg ha−1 a−1 greater than the next most productive cultivar S287. The average yield of SV1 remains above that of the first rotation for all eight rotations despite its gradual decline in yield following the fourth rotation.
The “released” group had increases in yield for at least six of eight rotations and final yields that approached the commercial performance (Figure 2). In this case, these cultivars maintained stable yields until the sixth rotation, and then mean annualized yield began to climb. Even with this increase in yield in the later rotations, the overall yield of this group over eight rotations was still only 6.42 Mg ha−1 a−1. The sixth rotation was distinguished by being warmer than normal, with GDD being 132% of normal and six months of drought over the rotation. However, the reasons for the increases after so many stable rotations are not entirely clear. Cultivars in this trial were exposed to increasingly drier and hotter conditions as they aged, which may have resulted in their release with the observed deviations from the normal long-term climate patterns. Identifying these cultivars and understanding their resilience would be beneficial as climate patterns change. This could indicate that these cultivars are now approaching their potential at the site.
The “Stable” group consisted of 12 of the 19 cultivars, which are characterized by relatively stable yield across all rotations. The average yield for this group across all eight rotations was 4.98 Mg ha−1 a−1. Yields of the cultivars were between 2.56 Mg ha−1 a−1 and 7.47 Mg ha−1 a−1 across all rotations, except for S566, which had a drop in yield in the third rotation to 1.24 Mg ha−1 a−1 but then recovered and fell within the range of all the other cultivars in this group. These cultivars did not appear to be strongly impacted by changes in weather patterns over the 8 rotations by either increasing or decreasing their yield substantially. It may be that these cultivars are more plastic in nature and able to tolerate a wider range of conditions.
Finally, two cultivars comprise the “Decline” group. These two cultivars (S301 and S365) had distinct reduction in yield in 6 of 8 rotations, drops of at greater than 20% after the first rotation, and survival under 20% by the eighth rotation. S301’s decline began by the third rotation and was due to leaf rust disease. S265 suffered girdling by rabbits in the sixth rotation, possibly succumbing to the difficult environmental conditions that year. Both cultivars were among the highest performers for the first two rotations. The yield across all eight rotations was 6.05 Mg ha−1 a−1, which was consistent with the stable group.
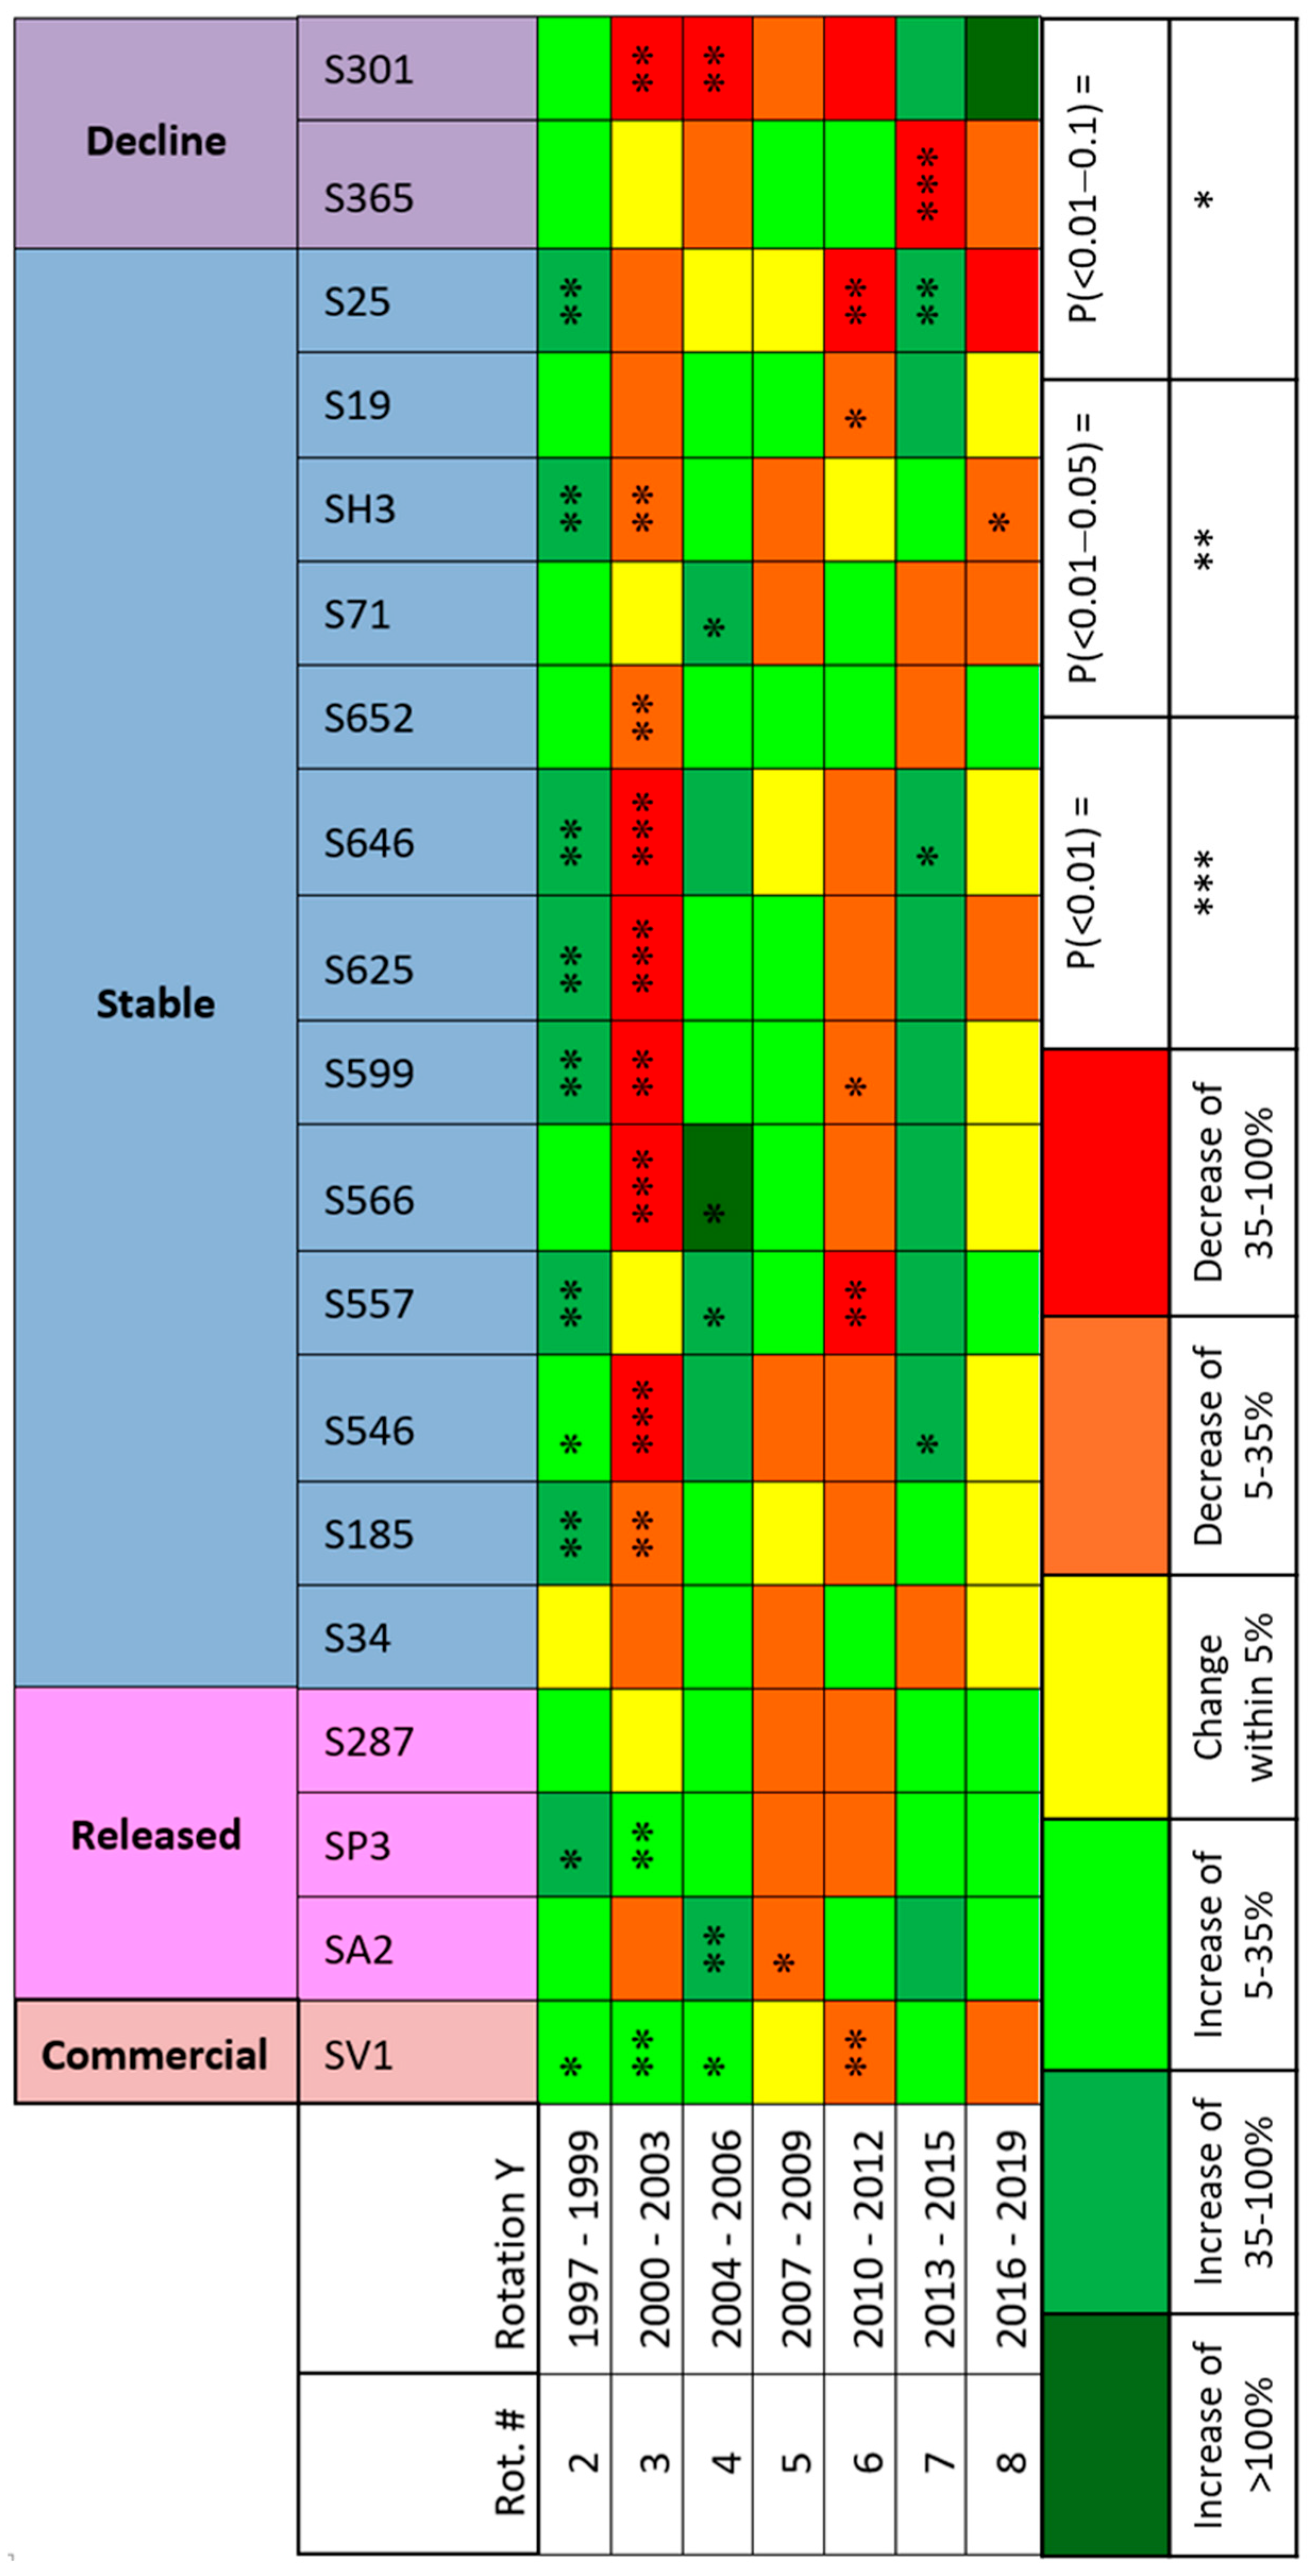
All the cultivars except S34 (3.4% decline) increased in yield from the first to the second rotation, with the increase being statistically significant for 10 of them (Figure 3). The increase from the first to the second rotation ranged from 5.0 to 65.6%. There were no rotations where all the cultivars either increased or decreased in yield.
Negative changes in yield occurred in rotations with notable drought events (rotations three and six). In rotation three, nine of the cultivars had a significant decrease in yield, but there were also two cultivars (SP3 and SV1) that had significant increases in yield, which highlights that potential in the genetic pool represented by this trial. Understanding what contributes to this resilience to stressors among cultivars will be important to creating resilient willow systems to meet future biomass feedstock needs. The second-longest period of drought occurred in the sixth rotation, and the response was different. Thirteen cultivars had a decrease in yield, but it was only statistically significant for five cultivars. SV1 yield decreased significantly, which was the opposite of what was observed for rotation three. Rotation six was also the warmest rotation based on GDD, and it may be the combination of multiple weather factors that impacted yield patterns rather than individual factors. This has been noted in other studies where annualized yield has been measured. For example, Harayama et al. [20] found three weather conditions (hours of sunshine, early season temperatures, and early and mid-season rainfall) that were positively associated with yield. More detailed tracking of yield and weather patterns on an annual, or maybe even a finer time scale, would likely be needed to understand how and why willow cultivars respond to changes in weather.
Excluding the first growing season, the mean yield for drought years was 0.65 Mg ha−1 a−1 less than rotations 2, 4, 5, 7, and 8 (p < 0.0001) (Figure 1 and Table 2). Comparing Figure 2 and Figure 3, patterns following the establishment rotation showed yields below 5 Mg ha−1 a−1 for those rotations that experienced drought. The influence of local weather and environmental conditions on yield over time does not impact most cultivars, which are resilient and continue to produce consistently. However, it is important to note that these yield trends are not representative of all cultivars, particularly those among the “released” group who exhibited increased yields on the seventh rotation rather than the stagnation observed in the overall mean yield. Nevertheless, the lack of a consistent trend in the data suggests that shrub willow yield generally remains stable for 7 rotations after the initial harvest. The presence of different trends within groupings of shrub willows may indicate that these groupings consist of willows with varying traits such as drought tolerance or vulnerability, and their performance may be correlated to local conditions. This has implications for selecting appropriate willow cultivars for different growing locations rather than focusing on developing a single high-yielding cultivar. Concerning the released group, three of its members are among the top four yielding cultivars, and it includes the best performer in the most recent harvest rotation.
It was also observed that rotations with notable increases in yield were immediately preceded by years with significant declines in yield (Figure 3). Examples of this include both the fourth and the seventh rotations. This indicates that willow species can recover their yields following rotations with less favorable growing conditions. This resilience is a positive characteristic for the economic and environmental modeling of shrub willow cultivation, as it indicates the potential for yield recovery over time.

3.2. Relative Biomass

The productivity of a system is governed by two limits: site carrying capacity and environmental resistance [39,40]. Carrying capacity is the maximum amount of biomass that a given piece of land will support, which can apply to the individual crop or the entire system. The ability to exploit a site fully may vary between and within species [41,42]. Environmental resistance is the interaction between phenotype and environment that controls the rate at which the crop biomass approaches the site’s carrying capacity. Previous research has shown that short-rotation coppice like willow experienced a bump in production following the first rotation [13,14]. Once willow develops a root system in the first rotation, plants can devote more photosynthate to producing aboveground biomass in subsequent rotations. Across all cultivars, the mean first rotation biomass was 5.16 Mg ha−1 a−1 and the mean for the subsequent eight rotations was 5.91 Mg ha−1 a−1 (Table 3). Relative yield is the ratio of the age 2–8 yield to the first rotation, which for all cultivars was 1.233. This 23% increase was significantly different from 1 (which would indicate no change over the first rotation).
Among the growth patterns described in the previous section, the lone commercial cultivar (SV1) had a significantly higher initial yield and nearly double the cumulative yield of the other groups (p < 0.0001) (Table 3, Figure 2). The mean yield for SVI increased from the first to the next seven rotations (rotations 2–8) by 36%. Meanwhile, the released group yield increased by 64%, which was significantly higher, but its cumulative yield was only 1.22 Mg ha−1 a−1 higher than the overall mean because the largest increases in yield only occurred in the last two rotations. The stable group was broken into two parts, those with less than and greater than 80% initial survival. They differed from each other in all metrics except relative yield and the eighth rotation survival. Finally, the decline group had an initial yield that was significantly higher than all groups except SV1, but S301 crashed due to disease. S365 did comparatively well throughout the study on the merit of its high production through the first 6 rotations (Figure 3) but was impacted by rabbit browsing and/or drought in the 7th and 8th rotations. Its cumulative yield and eight-rotation survival, although handicapped by decline, were no different than the average for the entire study.
In breeding or deployment programs, cultivars are often judged by the first or second rotation in local yield trials for their suitability for deployment or advancement [43]. Although this study only includes one commercially successful cultivar, it is unique in that the performance of groups may be evaluated in both a priori and a posteriori contexts over the full seven or eight rotations. Examples of three a priori groupings include the selection of the top-three cultivars based on yield or survival after the first rotation, which would be a conventional management approach. The third approach is to deploy a wider array of cultivars if not much is known about the suitability of cultivars deployed on a site to dilute the risk as described by Sleight and Volk [13]; in this case, any cultivar with an initial survival greater than 80 percent was included. A posteriori cases are those where the yield and survival of all eight rotations are known. Examples of three a posteriori groups include a selection of the top three cultivars based on yield, average survival, or ending survival in rotations 2–8. In any of the a priori and a posteriori cases, a given cultivar may be a member of more than one group.
In the case of the three a priori examples, the top three initial yields were the most productive (8.68 Mg ha−1 a−1), followed by the group with greater than 80% survival (6.58 Mg ha−1 a−1), and last by the group with the top three initial survival (5.12 Mg ha−1 a−1). Relative yield increases for the a priori examples ranged between 5.6 and 23.7 percent. The first two include SV1 (the only commercial cultivar), and the high yields of these top three groups are largely on the merit of SV1’s inclusion. However, it is important to note that all three of the a priori groups include at least one of the two cultivars from the decline group. Both S301 and S365 were ranked as the top five performers on both yield and survival in the first rotations, and the ranking of the top cultivars was no different after the second rotation (Figure 2 and Figure 4, and Table A1). S301 was ranked fourth for initial production and third for initial survival. Therefore, selection strategies that included it would be severely handicapped over eight rotations. Because S365 managed to have decent production for the first six rotations, its inclusion was less impactful overall. A top three initial yield that had excluded both S301 and S365 would have had a yield for rotations 2–8 of 8.75 Mg ha−1 a−1, which is only a few hundredths more than the actual a priori top three initial yield group.
A posteriori examples have exceptional increases in relative production. For instance, the top three relative producers increased 50.2% in rotations 2–8 over the first rotation and had mean yields of 9.22 Mg ha−1 a−1 for ages 2–8 (Table 3). For obvious reasons, a posteriori selection strategies would not be feasible outside perhaps of expansion at existing long-term sites; however, it is important that the top three initial yield cadre was numerically similar to this overall yield, even if it did not have as great of an increase in relative yield. Sleight et al. [14] highlighted that cultivars that have low initial yields tend to have larger jumps in following rotations, while cultivars that produce over approximately 10 Mg ha−1 a−1 are less likely to see substantial increases in subsequent rotations. SP3, which was featured in all three a posteriori groups, increased by 97.8% over the first rotation but started fourth from the bottom in initial yield. What was implied by Sleight et al. [13] and supported by this work is that high-performing, second-generation cultivars seem to overcome environmental resistance rapidly and reach their maximum potential more quickly by developing root systems. In contrast, the cultivars in this study are largely native and unimproved, and thus either show potential later (as in the release group) or are already near their full potential in terms of carrying capacity (as in the stable group).
These results suggest that the expected improvement following the first rotation can be highly variable. In general, the lower the initial yield, the greater the percent increase in subsequent rotations. The only commercial cultivar in this group saw an increase of 36% but started below the 10 Mg ha−1 a−1 threshold suggested by Sleight et al. [14]. Selection strategies for cultivars may be narrow (only a few cultivars; higher production) or wide (many cultivars; theoretically lower risk). Either may be more appropriate depending on the degree of confidence a manager has in the match between cultivar and a given deployment location.
This study highlights some important areas of research for future studies. First, selection strategies in the future may need to improve screening for potentially poor performers if they can. This could be accomplished by additional metrics, increasing the number of rotations on unfamiliar cultivar/site matches, identifying genetic makers, or staggering rollout or a combination of these ideas. Second, what are the management strategies and implications when an individual cultivar crashes if it crashes early, as it did with S301? If fields are planted in blocks of individual cultivars, should those rows be replanted with a better cultivar? If the crash happens after multiple rotations, should the commercial planting cycle be abridged by 2 or 3 rotations and the entire field replanted or just the individual cultivar? Another approach to managing the decline of individual cultivars is planting random mixtures. Research in the United Kingdom has suggested that planting random mixtures of willow cultivars will allow a stand to maintain yields if one or more of the cultivars in the mixture crashes [32,33]. While this has worked in research studies, a challenge faced with random mixtures using North America cultivars in larger scale plantings is that the differences in plant form among cultivars requires changes in approaches to harvesting every few meters down the row. These kinds of changes increase stress on both the harvester operator and the equipment, although discernable differences in harvester throughput were not measurable in random mixtures [44,45]. The impacts of this approach need to be assessed with the tradeoffs between more resilient stands of willow over time assessed along with potential impacts on harvesting operations. Finally, selection strategies in the past primarily focused on yield and survival, with less consideration of disease or pest susceptibility. As breeding of willow advances, it will be important to include other factors that will impact selection (e.g., composition, quality, carbon sequestration potential, stem form, water use efficiency, drought tolerance, heat tolerance, etc.).

3.3. Willow Survival

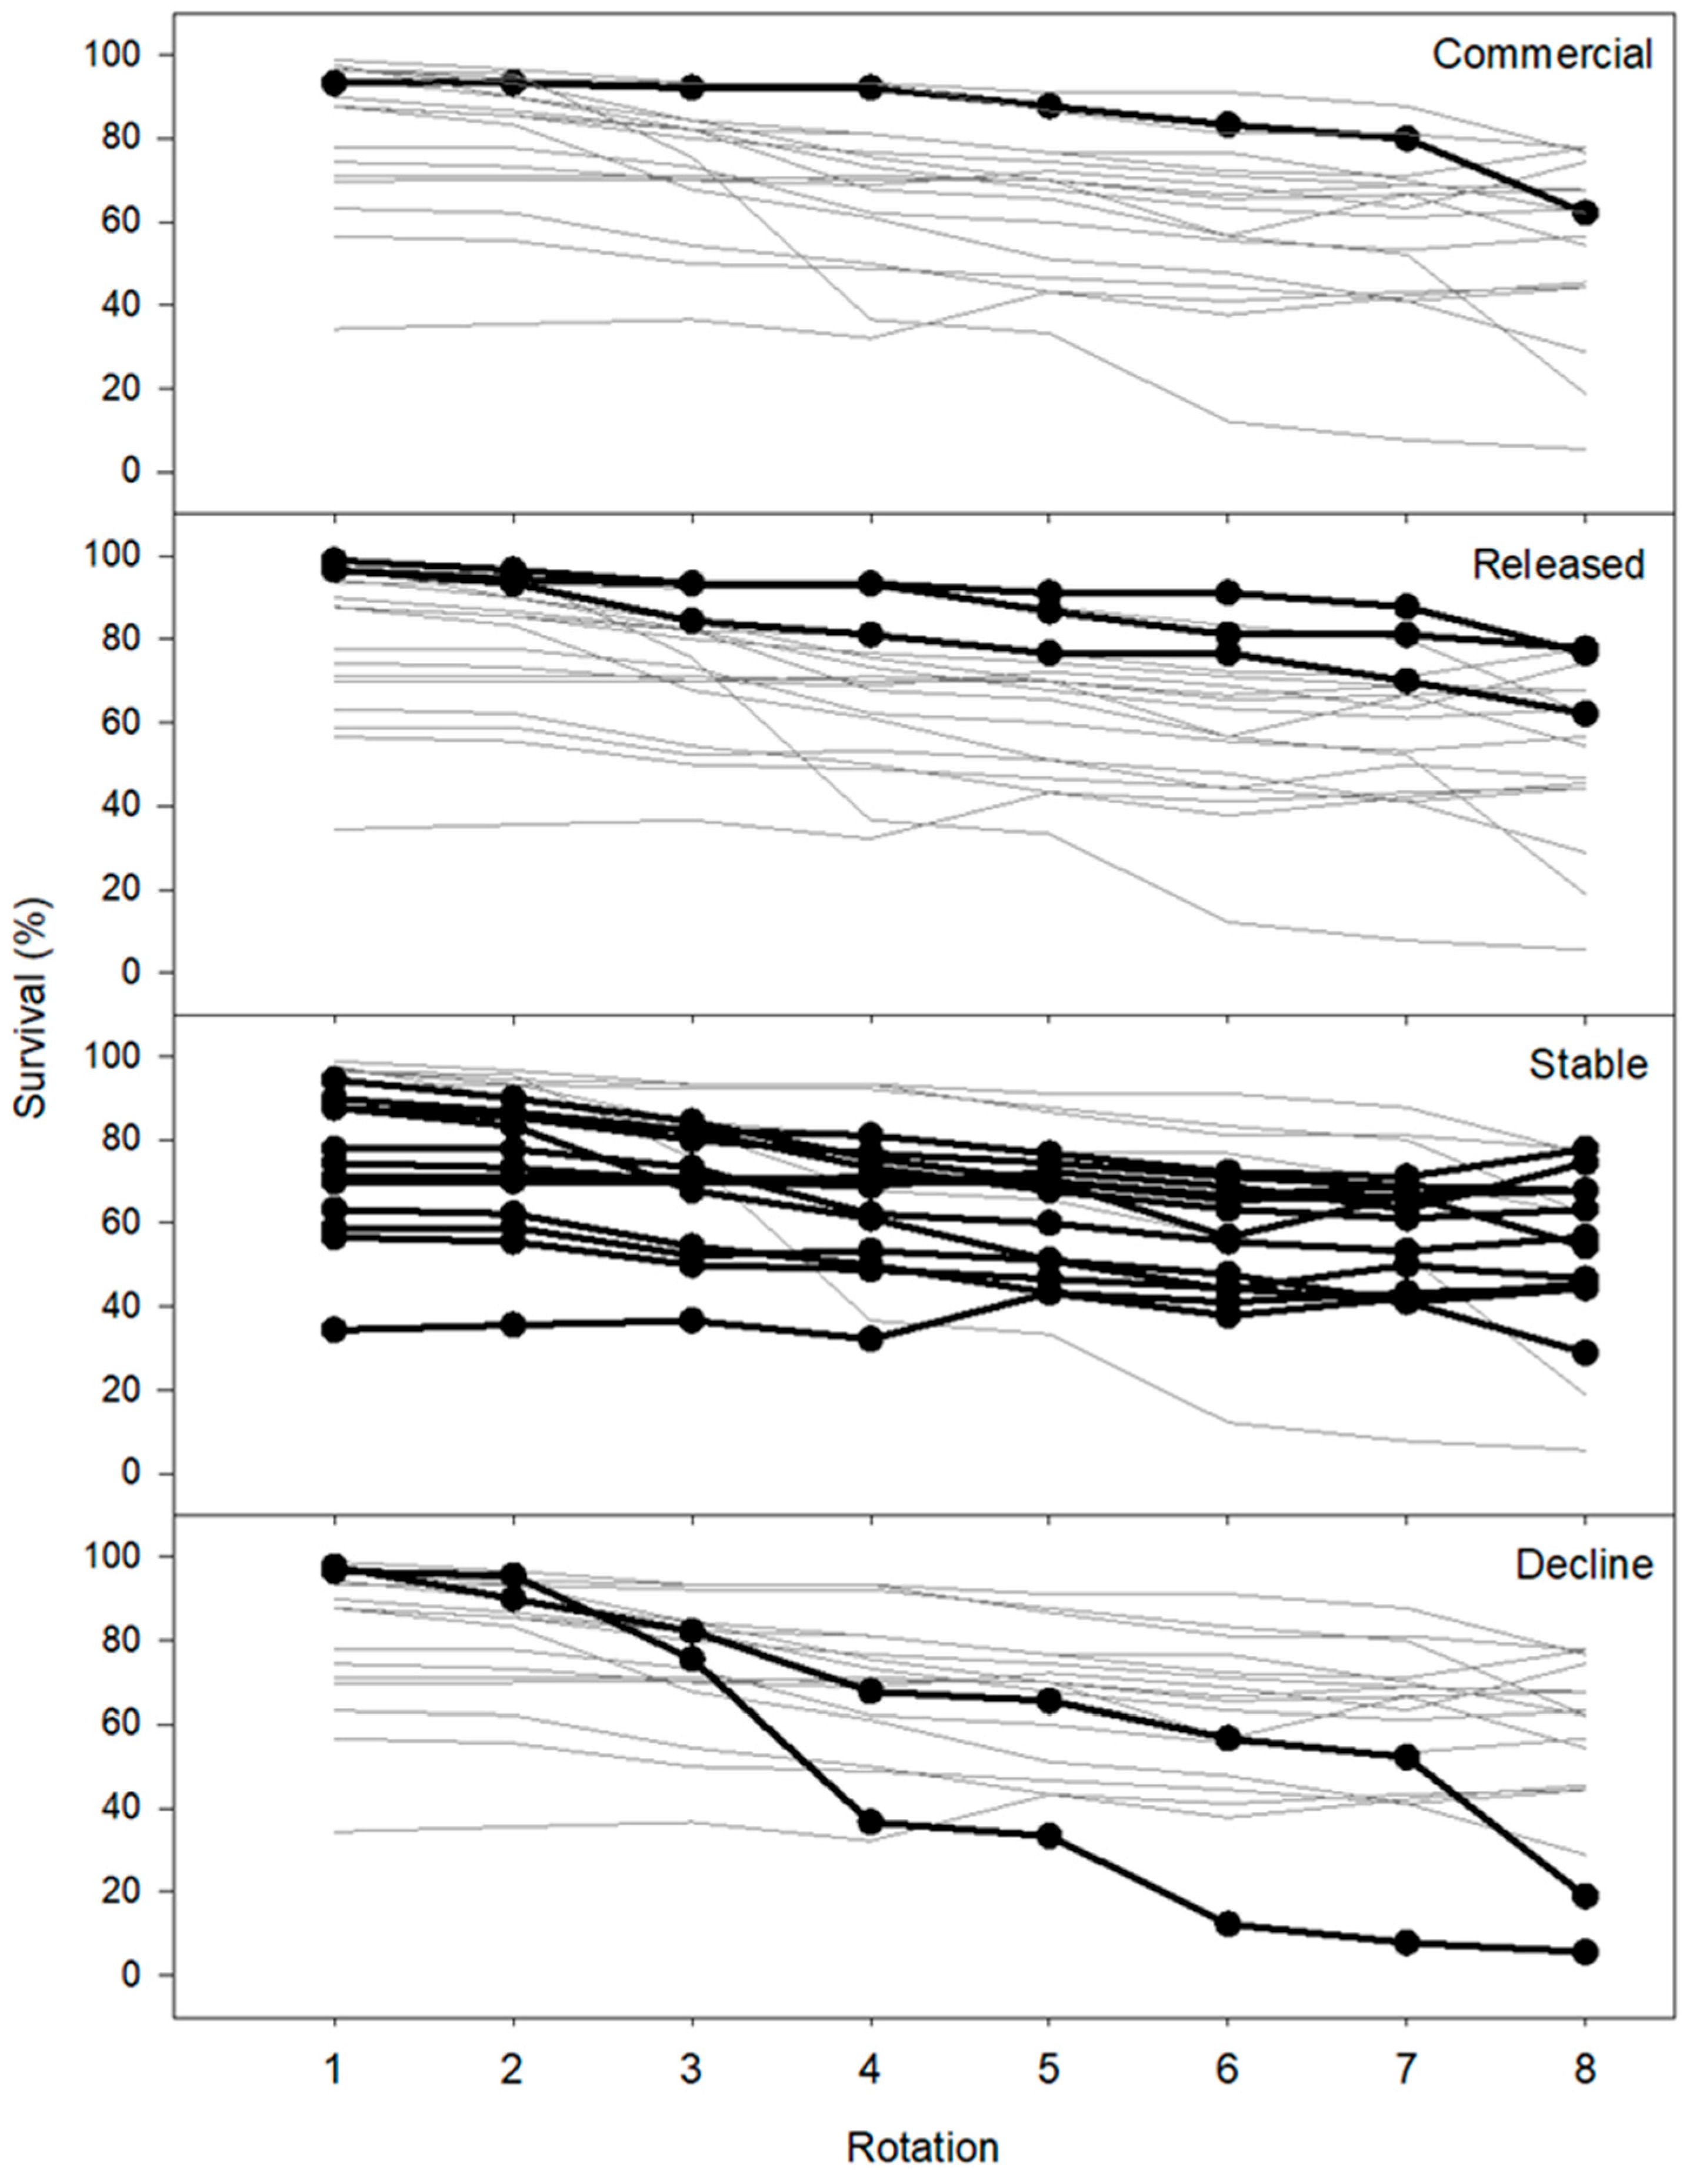
Survival at the end of the first rotation across all the cultivars was 80.9%, dropping to 54.9% by the eighth rotation, with a mean of 67.4% over all rotations (Table 3). The changes in survival over time exhibited a gradually declining slope on average from 1996 to 2012. However, changes in survival after each rotation were not consistent among cultivars or within groups. Survival among the top-performing cultivars in the commercial and release groups had a slow decline through all eight rotations but maintained very high survival (>85%) for the duration of the trial (Figure 4; Table 3). The stable group had the widest range of survival, with starting values generally ranging from 55% to 95% for all but one cultivar, S71. By the eighth rotation, survival in the group ranged from 29 to 80%. Despite the wide range in survival in this group, their yield remained consistent across rotations (Table 3). The decline group experienced significant declines >40% for at least one rotation and had survival below 20% by the eighth rotation.
A key result is that two of the four highest-yielding cultivars in the first two rotations were in the decline group, illustrating the risk of making cultivar selections strictly based on yield after only one or two trial rotations and failing to deploy a wide array of cultivars on sites where little is known about their performance and/or pests. A second issue, not addressed by this paper, is that willow systems are typically expected to be in place for 7 rotations (>20 years). If a cultivar failure occurs late in this cycle (S365; Table A1), it may not impact the overall economics. If a cultivar fails early (S301; Table A1), how should management address that and at what survival is a crop considered a failure?
There were a small number of cultivars that had apparent increases in survival in the last two rotations of the study (Figure 4 and Figure A2). Tracking survival over time becomes increasingly difficult over time in this high-density, perennial system. Shrub willow tends to resprout from buds on the outside of the stems, and this results in stools spreading over time. By the fifth or sixth rotation, stools can begin to merge into adjacent plants, making survival assessments more difficult.

3.4. Implications

Several areas appear to warrant further investigation to better understand the implications of long-term yield on the productivity and economic viability of willow biomass crops. (1) Since this trial was established, dozens of yield trials have followed [12]. This trial clearly indicates the limitations of short-term yield trials for effectively identifying the optimal cultivars for an area. There is a need to maintain long-term trials to fully understand climate and site factors to project growth and develop economic and conduct life-cycle assessments of these systems. (2) Additional research is needed to better understand the resilience and recovery of willow cultivars in the face of environmental stressors and changing climate. (3) Additionally, a finer study of the dynamics of seasonal water and temperature variation on willow productivity could provide valuable insights for developing selection criteria for cultivars in willow deployments or lead to the development of different strategies to mitigate the impact of atypical environmental conditions in the early growing season.

4. Conclusions

Economic and life cycle assessments of willow biomass crops often rely on expert judgment to project growth and yield past the first or second rotation. This study demonstrates that growers and modelers cannot rely on short-term data to predict long-term performance. Despite that, long-term predictions are often made with short-term data. Although this study utilizes cultivars that are no longer used in commercial deployments, it evaluates one of the longest continuous datasets for willow in North America. A key finding is that a relatively safe estimate for yield increase following the first rotation is 23%, which was found across all 19 cultivars in this trial. The case could be made that an increase of 36%, which was reported for the one commercial cultivar, could be used in models. However, the work also suggests that cultivars are subject to environmental and climatic stresses that can affect growth patterns and survival. Subsequent studies have suggested that the yield increase from first to subsequent rotations may be limited for newer, high-yielding cultivars, so caution should be used when applying results from this current study to the newest generation of commercial cultivars.
Another key finding is the importance of seasonal weather and environmental conditions on biomass yield at a local level. Rotations that contained prominent drought or that were atypically warm or cool in their early growing season were observed to have diminished yields for individual cultivars. Additionally, rotation length appeared to correspond to an attenuation of yield increases, which is in line with prior knowledge that 3-year rotations that generally align with stand closure are optimal. Finally, the resilience of willow cultivars in recovering their yields following rotations with less favorable growing conditions is a positive characteristic to isolate in breeding and identify during cultivar deployments.

Author Contributions

Individual contributions of the authors are as follows: conceptualization, S.S., M.E. and T.V.; methodology, S.S., M.E. and T.V.; formal analysis, S.S. and M.E.; investigation, S.S. and T.V.; resources, T.V.; data curation, S.S. and M.E.; writing—original draft preparation, S.S.; writing—review and editing, M.E. and T.V.; visualization, S.S., M.E. and T.V.; supervision, T.V.; project administration, T.V.; funding acquisition, T.V. All authors have read and agreed to the published version of the manuscript.

Funding

Multiple sources of funding from state and federal agencies have supported this research over the years. The design and establishment of this trial was supported by the New York State Energy and Research Development Authority (NYSERDA, Award 1737-ERER-ER-92). Over the years, multiple agencies provided support to maintain the trial, including the US Dept. of Energy Biomass Power for Rural Development (Award DE-FC36-96GO10132), USDA CSREES, USDA NIFA (Award #NYZ-2622-20-022) and US Department of Energy Bioenergy Technologies Office under award number DE-FC36-05GO85041, which was provided through the North Central Regional Sun Grant Center at South Dakota State University. Support for the data analysis and writing was provided by the MASBio (Mid-Atlantic Biomass Consortium for Value-Added Products) project, which is supported by the Agriculture and Food Research Initiative Competitive Grant no. 2020-68012-31881.

Data Availability Statement

The datasets presented in this article are not readily available because the data are being used as part of an ongoing study. Requests to access the datasets should be directed to the corresponding author.

Acknowledgments

The authors thank the individuals who originally designed and laid out this trial, including Lawrence Abrahamson, Richard Kopp, Daniel Robison, Edwin White, and Ken Burns. Their foresight in developing a willow biomass research program at SUNY ESF was essential to the decades of results and impact. Countless undergraduate and graduate students worked to harvest and maintain this trial over many years, often in challenging weather conditions. They also collected, processed, and stored samples and data over many years. The results of this research would not be possible without their efforts, and we are grateful. Over the last few rotations of this trial, Karl Hallen has been essential in maintaining and collecting data from this trial. His attention to detail and creative problem-solving allowed this trial to continue and for this long-term data to be available to analyze and share.

Conflicts of Interest

The authors declare no conflicts of interest. The funders had no role in the design of the study; in the collection, analyses, or interpretation of data; in the writing of the manuscript; or in the decision to publish the results.

Abbreviations

GDD, Growing Degree Days; LCA, Life Cycle Assessment; MN, Minnesota; NOAA, National Oceanic and Atmospheric Administration; NY, New York; SAF, Sustainable Aviation Fuel; TEA, Technoeconomic Analysis; US, United States.

Appendix A

Table A1. Yield, relative yield, and survival for the four growth patterns for individual cultivars in Table 3. First rotation and means for rotations 2 through 8 are also presented.
CohortCultivarsNYieldRelative Yield 2–8SurvivalFirst Rotation
with <80% Survival
1st2nd–8thAverage95% CI1stMean8th
Mg ha−1 a−1ProportionPercent
All cultivarsAll4565.165.911.233±0.04880.967.454.92
CommercialSV1248.9312.161.360±0.09693.385.562.08
ReleaseS287247.328.001.167±0.14296.780.162.35
SP3244.147.511.978±0.29799.088.577.78
SA2243.425.881.759±0.29296.790.576.38
StableSH3244.896.731.394±0.12287.758.529.03
S19245.256.271.241±0.16087.776.567.74
S185245.146.171.245±0.14190.073.563.34
S25245.636.091.120±0.13594.774.154.74
S652245.295.711.153±0.17388.079.378.05
S557242.785.782.079±0.22556.748.444.31
S34245.775.771.066±0.13474.369.667.71
S599244.915.701.224±0.13670.369.674.31
S646244.395.301.226±0.12863.750.444.71
S625245.264.810.939±0.11571.069.668.01
S71243.044.571.498±0.16036.73845.71
S546244.724.330.940±0.14577.764.656.71
S566244.203.560.843±0.12259.051.046.71
DeclineS365246.875.911.233±0.04998.066.519.02
S301246.121.970.327±0.14497.045.55.33
Figure A1. Schematic of field design and layout with random placement of cultivars in each of three blocks. White squares are block 1, medium gray are block 2, and dark gray are block 3.
Forests 15 02041 g0a1
Figure A2. Change in survival between harvest rotations for 19 willow cultivars. Cultivars are color-coded by grouping reported in Figure 2 (commercial, released, stable, decline).
Forests 15 02041 g0a2

References

  1. Volk, T.A.; Heavey, J.P.; Eisenbies, M.H. Advances in Shrub-Willow Crops for Bioenergy, Renewable Products, and Environmental Benefits. Food Energy Secur. 2016, 5, 97–106. [Google Scholar] [CrossRef]
  2. Therasme, O.; Volk, T.A.; Eisenbies, M.H.; Amidon, T.E.; Fortier, M.-O. Life Cycle Greenhouse Gas Emissions of Ethanol Produced via Fermentation of Sugars Derived from Shrub Willow (Salix ssp.) Hot Water Extraction in the Northeast United States. Biotechnol. Biofuels 2021, 14, 52. [Google Scholar] [CrossRef] [PubMed]
  3. Bullerdiek, N.; Neuling, U.; Kaltschmitt, M. A GHG Reduction Obligation for Sustainable Aviation Fuels (SAF) in the EU and in Germany. J. Air Transp. Manag. 2021, 92, 102020. [Google Scholar] [CrossRef]
  4. Krause, H. Sustainable Aviation Fuel: Agencies Should Track Progress toward Ambitious Federal Goals; Government Accounting Office: Washington, DC, USA, 2023. [Google Scholar]
  5. U.S. Department of Energy. 2023 Billion-Ton Report 2024: An Assessment of U.S. Renewable Carbon Resources; ORNL/SPR-2024/3103; Oak Ridge National Laboratory: Oak Ridge, TN, USA, 2024. [Google Scholar] [CrossRef]
  6. Fabio, E.S.; Volk, T.A.; Miller, R.O.; Serapiglia, M.J.; Kemanian, A.R.; Montes, F.; Kuzovkina, Y.A.; Kling, G.J.; Smart, L.B. Contributions of Environment and Genotype to Variation in Shrub Willow Biomass Composition. Ind. Crops Prod. 2017, 108, 149–161. [Google Scholar] [CrossRef]
  7. U.S. Department of Energy. 2016 Billion-Ton Report: Advancing Domestic Resources for a Thriving Bioeconomy, Volume 1: Economic Availability of Feedstocks; ORNL/TM-2016/160; Oak Ridge National Laboratory: Oak Ridge, TN, USA, 2016. [Google Scholar] [CrossRef]
  8. Frank, J.R.; Brown, T.R.; Volk, T.A.; Heavey, J.P.; Malmsheimer, R.W. A Stochastic Techno-Economic Analysis of Shrub Willow Production Using EcoWillow 3.0S. Biofuels Bioprod. Bioref. 2018, 12, 846–856. [Google Scholar] [CrossRef]
  9. Frank, J.; Therasme, O.; Volk, T.A.; Brown, T.; Malmsheimer, R.W.; Fortier, M.-O.; Eisenbies, M.H.; Ha, H.; Heavey, J. Integrated Stochastic Life Cycle Assessment and Techno-Economic Analysis for Shrub Willow Production in the Northeastern United States. Sustainability 2022, 14, 9007. [Google Scholar] [CrossRef]
  10. Yang, S.; Volk, T.; Fortier, M.-O. Willow Biomass Crops Are a Carbon Negative or Low-Carbon Feedstock Depending on Prior Land Use and Transportation Distances to End Users. Energies 2020, 13, 4251. [Google Scholar] [CrossRef]
  11. Caputo, J.; Balogh, S.B.; Volk, T.A.; Johnson, L.; Puettmann, M.; Lippke, B.; Oneil, E. Incorporating Uncertainty into a Life Cycle Assessment (LCA) Model of Short-Rotation Willow Biomass (Salix spp.) Crops. BioEnergy Res. 2013, 7, 48–59. [Google Scholar] [CrossRef]
  12. Volk, T.A.; Berguson, B.; Daly, C.; Halbleib, M.D.; Miller, R.; Rials, T.G.; Abrahamson, L.P.; Buchman, D.; Buford, M.; Cunningham, M.W.; et al. Poplar and Shrub Willow Energy Crops in the United States: Field Trial Results from the Multiyear Regional Feedstock Partnership and Yield Potential Maps Based on the PRISM-ELM Model. GCB Bioenergy 2018, 10, 735–751. [Google Scholar] [CrossRef]
  13. Sleight, N.J.; Volk, T.A. Recently Bred Willow (Salix spp.) Biomass Crops Show Stable Yield Trends Over Three Rotations at Two Sites. BioEnergy Res. 2016, 9, 782–797. [Google Scholar] [CrossRef]
  14. Sleight, N.J.; Volk, T.A.; Johnson, G.A.; Eisenbies, M.H.; Shi, S.; Fabio, E.S.; Pooler, P.S. Change in Yield Between First and Second Rotations in Willow (Salix spp.) Biomass Crops Is Strongly Related to the Level of First Rotation Yield. BioEnergy Res. 2016, 9, 270–287. [Google Scholar] [CrossRef]
  15. Guidi Nissim, W.; Pitre, F.E.; Teodorescu, T.I.; Labrecque, M. Long-Term Biomass Productivity of Willow Bioenergy Plantations Maintained in Southern Quebec, Canada. Biomass Bioenergy 2013, 56, 361–369. [Google Scholar] [CrossRef]
  16. Larsen, S.U.; Jørgensen, U.; Kjeldsen, J.B.; Lærke, P.E. Long-Term Yield Effects of Establishment Method and Weed Control in Willow for Short Rotation Coppice (SRC). Biomass Bioenergy 2014, 71, 266–274. [Google Scholar] [CrossRef]
  17. González-García, S.; Mola-Yudego, B.; Dimitriou, I.; Aronsson, P.; Murphy, R. Environmental Assessment of Energy Production Based on Long Term Commercial Willow Plantations in Sweden. Sci. Total Environ. 2012, 421–422, 210–219. [Google Scholar] [CrossRef]
  18. Stolarski, M.J.; Szczukowski, S.; Tworkowski, J.; Krzyżaniak, M.; Załuski, D. Willow Production during 12 Consecutive Years—The Effects of Harvest Rotation, Planting Density and Cultivar on Biomass Yield. GCB Bioenergy 2019, 11, 635–656. [Google Scholar] [CrossRef]
  19. Kuzovkina, Y.A.; Schulthess, C.P.; Zheng, D. Influence of Soil Chemical and Physical Characteristics on Willow Yield in Connecticut. Biomass Bioenergy 2018, 108, 297–306. [Google Scholar] [CrossRef]
  20. Harayama, H.; Uemura, A.; Utsugi, H.; Han, Q.; Kitao, M.; Maruyama, Y. The Effects of Weather, Harvest Frequency, and Rotation Number on Yield of Short Rotation Coppice Willow over 10 Years in Northern Japan. Biomass Bioenergy 2020, 142, 105797. [Google Scholar] [CrossRef]
  21. Njakou Djomo, S.; Ac, A.; Zenone, T.; De Groote, T.; Bergante, S.; Facciotto, G.; Sixto, H.; Ciria Ciria, P.; Weger, J.; Ceulemans, R. Energy Performances of Intensive and Extensive Short Rotation Cropping Systems for Woody Biomass Production in the EU. Renew. Sustain. Energy Rev. 2015, 41, 845–854. [Google Scholar] [CrossRef]
  22. Talagai, N.; Marcu, M.V.; Zimbalatti, G.; Proto, A.R.; Borz, S.A. Productivity in Partly Mechanized Planting Operations of Willow Short Rotation Coppice. Biomass Bioenergy 2020, 138, 105609. [Google Scholar] [CrossRef]
  23. Desrochers, V.; Frenette-Dussault, C.; Guidi Nissim, W.; Brisson, J.; Labrecque, M. Using Willow Microcuttings for Ecological Restoration: An Alternative Method for Establishing Dense Plantations. Ecol. Eng. 2020, 151, 105859. [Google Scholar] [CrossRef]
  24. Knight, D.R.; Goldsworthy, M.; Smith, P. Are Biomass Feedstocks Sustainable? A Systematic Review of Three Key Sustainability Metrics. GCB Bioenergy 2024, 16, e13187. [Google Scholar] [CrossRef]
  25. Kiernan, B.; Volk, T.; Tharakan, P.; Nowak, C.; Phillipon, S.; Abrahamson, L.; White, E. Clone Site Testing and Selections for Scale up Plantings: Final Report to US Department of Energy; SUNY-ESF: Syracuse, NY, USA, 2003. [Google Scholar]
  26. NOAA Climate Data Online. Available online: https://www.ncei.noaa.gov/cdo-web/ (accessed on 18 September 2024).
  27. NDMC; USDA; NOAA. US Drought Monitor. Available online: https://www.drought.gov/data-maps-tools/us-drought-monitor (accessed on 18 September 2024).
  28. Jochner, M.; Bugmann, H.; Nötzli, M.; Bigler, C. Tree Growth Responses to Changing Temperatures across Space and Time: A Fine-Scale Analysis at the Treeline in the Swiss Alps. Trees 2018, 32, 645–660. [Google Scholar] [CrossRef]
  29. Ryan, M.G. Temperature and Tree Growth. Tree Physiol. 2010, 30, 667–668. [Google Scholar] [CrossRef] [PubMed]
  30. Climate Smart Farming. CSF Growing Degree Day Calculator. Available online: http://climatesmartfarming.org/tools/csf-growing-degree-day-calculator/ (accessed on 18 September 2024).
  31. Yankee Publishing Company. Almanac. Available online: https://www.almanac.com/gardening/planting-calendar/NY/Tully (accessed on 18 September 2024).
  32. McCracken, A.R.; Walsh, L.; Moore, P.J.; Lynch, M.; Cowan, P.; Dawson, M.; Watson, S. Yield of Willow (Salix spp.) Grown in Short Rotation Coppice Mixtures in a Long-Term Trial. Ann. Appl. Biol. 2011, 159, 229–243. [Google Scholar] [CrossRef]
  33. McCracken, A.R.; Dawson, W.M.; Bowden, G. Yield Responses of Willow (Salix) Grown in Mixtures in Short Rotation Coppice (SRC). Biomass Bioenergy 2001, 21, 311–319. [Google Scholar] [CrossRef]
  34. Stolarski, M.J.; Szczukowski, S.; Tworkowski, J.; Krzyżaniak, M.; Załuski, D. Willow Biomass and Cuttings’ Production Potential over Ten Successive Annual Harvests. Biomass Bioenergy 2017, 105, 230–247. [Google Scholar] [CrossRef]
  35. Liberacki, D.; Kocięcka, J.; Stachowski, P.; Rolbiecki, R.; Rolbiecki, S.; Sadan, H.A.; Figas, A.; Jagosz, B.; Wichrowska, D.; Ptach, W.; et al. Water Needs of Willow (Salix L.) in Western Poland. Energies 2022, 15, 484. [Google Scholar] [CrossRef]
  36. Kopp, R.F.; Abrahamson, L.P.; White, E.H.; Volk, T.A.; Nowak, C.A.; Fillhart, R.C. Willow Biomass Production during Ten Successive Annual Harvests. Biomass Bioenergy 2001, 20, 1–7. [Google Scholar] [CrossRef]
  37. Willebrand, E.; Ledin, S.; Verwijst, T. Willow Coppice Systems in Short Rotation Forestry: Effects of Plant Spacing, Rotation Length and Clonal Composition on Biomass Production. Biomass Bioenergy 1993, 4, 323–331. [Google Scholar] [CrossRef]
  38. Jiang, Y.; Li, C.; Takeda, F.; Kramer, E.A.; Ashrafi, H.; Hunter, J. 3D Point Cloud Data to Quantitatively Characterize Size and Shape of Shrub Crops. Hortic. Res. 2019, 6, 43. [Google Scholar] [CrossRef]
  39. Switzer, G. Determinants of Forest Stand Productivity. In Proceedings—A Symposium on Principles of Maintaining Productivity on Prepared Sites; USDA Forest Service: Starkville, MS, USA, 1978. [Google Scholar]
  40. Burger, J. Cumulative Effects of Silvicultural Technology on Sustained Forest Productivity. In Assessing the Effects of Silvicultural Practices on Sustained Productivity, Proceedings of the e IEA/BE Workshop ‘93, Fredericton, NB, Canada, 16–22 May 1993; Canadian Forest Service—Maritimes Region, Natural Resources Canada: Fredericton, NB, Canada, 1994; pp. 59–70. [Google Scholar]
  41. Skovsgaard, J.P.; Vanclay, J.K. Forest Site Productivity: A Review of Spatial and Temporal Variability in Natural Site Conditions. Forestry 2013, 86, 305–315. [Google Scholar] [CrossRef]
  42. Skovsgaard, J.P.; Vanclay, J.K. Forest Site Productivity: A Review of the Evolution of Dendrometric Concepts for Even-Aged Stands. Forestry 2008, 81, 13–31. [Google Scholar] [CrossRef]
  43. Smart, L.; Volk, T.; Lin, J.; Kopp, R.; Phillips, I.; Cameron, K.; White, R.; Abrahamson, L. Genetic Improvement of Shrub Willow (Salix spp.) Crops for Bioenergy, Bioproducts, and Environmental Applications. Unasylva 2005, 56, 51–55. [Google Scholar]
  44. Eisenbies, M.H.; Volk, T.A.; Espinoza, J.; Gantz, C.; Himes, A.; Posselius, J.; Shuren, R.; Stanton, B.; Summers, B. Biomass, Spacing and Planting Design Influence Cut-and-Chip Harvesting in Hybrid Poplar. Biomass Bioenergy 2017, 106, 182–190. [Google Scholar] [CrossRef]
  45. Volk, T.A.; Spinelli, R.; Eisenbies, M.; Clark, R.; Emerson, R.; Frank, J.; Hallen, K.; Therasme, O.; Webb, E. Harvesting Systems for Short Rotation Coppice Crops Influence Cost, Performance, and Biomass Quality. In Handbook of Biorefinery Research and Technology; Bisaria, V., Ed.; Springer: Dordrecht, The Netherlands, 2024; pp. 1–31. ISBN 978-94-007-6724-9. [Google Scholar]
Figure 1. Arithmetic means of the annualized yield for 19 willow cultivars across eight rotations from 1993 to 2019 at Tully, NY. Error bars indicate the standard error. Letters indicate significant differences at p = 0.05 based on the least square means.
Forests 15 02041 g001
Figure 2. Annualized yield for 19 willow cultivars across eight rotations organized into four different groups (commercial, released, stable and decline) based on yield patterns. Dark lines for the group cultivars are overlayed over gray lines for the other groups to assist in visual scaling and comparison. Specific cultivars are described in Appendix A.
Forests 15 02041 g002
Figure 3. Changes in yield between rotations for each of the 19 cultivars in the trial over rotations 2 through 8. Cultivars are grouped in the left column by the four categories in Figure 2 (commercial, released, stable, decline). There were significant increases in yield for 10 cultivars in the second rotation. Yield decreased in the third (9 cultivars) and sixth rotations (5 cultivars) across many of the cultivars. Yield increases are dark or light green and yield decreases are orange or red. Significant changes in yield from one rotation to the next are marked as * for 0.10 < p > 0.05, ** for 0.05 < p > 0.01, and *** for p < 0.01.
Forests 15 02041 g003
Figure 4. Harvest-year percent survival spanning rotations 1 (1996) through 8 (2019) for four yield pattern groupings (Figure 2). Dark lines for the group cultivars are overlayed over gray lines for the other groups to assist in visual scaling and comparison. Specific cultivars are described in Appendix A.
Forests 15 02041 g004
Table 1. Willow cultivar genotypes, with species and origin information, included in the trials in Tully, NY, that were harvested for eight rotations.
CultivarSpeciesOrigin 1
SV1S. dasycladosOMNR
SA2S. albaOMNR
SP3S. pupureaOMNR
S287S. eriocephalaU of T
S34S. eriocephalaU of T
S185S. eriocephalaU of T
S546S. eriocephalaU of T
S557S. eriocephalaU of T
S566S. eriocephalaU of T
S599S. eriocephala x petiolarisU of T
S625S. eriocephala x interiorU of T
S646S. eriocephalaU of T
S652S. eriocephalaU of T
S71S. petiolaris x eriocephalaU of T
SH3S. pupureaOMNR
S19S. eriocephalaU of T
S25S. eriocephalaU of T
S365S. discolorU of T
S301S. interior x eriocephalaU of T
1 U of T is University of Toronto, OMNR is Ontario Ministry of Natural Resources (now the Ministry of Natural Resources and Forestry).
Table 2. Growing Degree Days (GDD, base 10 °C) and GDD relative to the 30-year average for each rotation. Number of recorded droughts, their length and when they occurred during the rotation, and the change in production across all cultivars to those environmental conditions.
Growing Degree Days (Base 10 °C) aRecorded Droughts b
Rotation NumberRotation Length (Years)Mean Seasonal GDD (18 May–30 September)Seasonal GDD Relative to the 30-Year
Average (%)
Mean Early Season GDD (18 May–30 June)Early Season GDD Relative to the 30-Year Average (%)Early Growing Season DroughtsEarly Season Drought LengthGrowing Season DroughtsDrought Length (Months)% Cultivar Increased Production
13101798.1306104.71 (1995)full early season1 (1995)April to October (7 months)N/A
231043100.5302103.51 (1999)full early season1 (1999)mid-May to September (4.5 months)95%
3499495.925788.21 (2001)mid-May to early June1 (2001)mid-May to early June (1.5 months)21%
431064102.728798.50N/A0N/A84%
5398795.228798.20N/A1 (2007)late August to mid-September (<1 month)84%
631173113.1354121.30N/A2 (2011, 2012)Late July to September (2011), Early July to October (2012) (6 months combined)32%
731059102.2304104.20N/A0N/A79%
841089105.028798.31 (2016)late June1 (2016)Late June to October (4 months)47%
a: GDD values are based on data obtained from Cornell University’s Climate Smart Farming GDD Calculator for Tully, New York [30]. b: Drought data is from the drought.gov historical drought data for Onondaga County [27].
Table 3. Yield, relative yield (rotation 2–8 vs. rotation 1), and survival for the four growth patterns (commercial, released, stable, and decline from Figure 2), a priori selection groups, a posteriori selection groups, and selected cultivars. First rotation and means for rotations 2 through 8 are presented. Letters within the growth pattern groups indicate significant differences in means. Asterisks in the confidence limits column indicate whether the relative yield is significantly different than 1, signifying no significant increase or decrease. ‘NS’ indicates not significant.
ScenariosCultivarsNYieldRelative Yield 2–8SurvivalFirst Rotation with <80% Survival
1st2nd–8thMean95% CI1stMean8th
Mg ha−1 a−1Proportion
AllAll cultivars combined19 cultivars4565.16 (0.23)5.91 (0.13)1.233 (0.030)±0.048 *80.9 (2.6)67.4 (1.0)54.9 (2.9)2
PatternsCommercialSV1248.93 A (0.11)12.16 A (0.51)1.360 B (0.056)±0.096 *93.3 A (3.8)85.5 A (2.5)62.0 AB (4.9)8
ReleasedS287, SA2, SP3724.96 CD (0.73)7.13 B (0.25)1.635 A (0.094)±0.157 *97.4 A (1.0)86.4 A (1.4)72.1 A (3.7)7
Stable > 80 sur5 cultivars1205.24 C (0.28)6.19 C (0.15)1.231 B (0.038)±0.064 *89.6 A (1.7)72.4 B (1.5)58.5 AB (5.1)3
Stable < 80 sur8 cultivars1924.38 D (0.29)4.98 D (0.13)1.227 B (0.042)±0.069 *63.5 B (3.9)57.6 C (1.3)56.0 B (3.3)1
DeclineS365, S301486.50 B (0.36)3.92 E (0.50)0.595 C (0.074)±0.124 *97.5 A (0.5)56.0 C (4.8)12.2 C (5.9)3
a prioriTop 3 Initial YieldSV1, S287, S365727.71 (0.50)8.68 (0.44)1.130 (0.051)±0.085 *96.0 (1.4)77.4 (2.4)47.8 (8.2)5
>80% Initial SurvivalSee below2645.73 (0.31)6.58 (0.19)1.237 (0.041)±0.068 *93.5 (1.1)74.4 (1.4)54.1 (4.5)6
Top 3 Initial SurvivalSP3, S365, S301725.71 (0.51)5.12 (0.41)1.056 (0.112)±0.186 NS98.0 (0.5)66.8 (3.7)34.0 (11.6)4
a posterioriTop 3 Mean YieldSV1, S287, SP3726.80 (0.82)9.22 (0.35)1.502 (0.079)±0.131 *96.3 (1.5)84.7 (1.6)67.3 (3.5)7
Top 3 Mean SurvivalSA2, SP3, SV1725.50 (0.90)8.52 (0.43)1.799 (0.088)±0.146 *96.3 (1.5)88.2 (1.1)72.0 (3.5)8
Top 3 Ending SurvivalS652, SP3, SA2724.28 (0.42)6.37 (0.24)1.630 (0.097)±0.161 *94.6 (2.5)86.1 (1.1)77.3 (2.1)8
Single CultivarsSP3SP3244.14 (0.76)7.51 (0.34)1.978 (0.172)±0.297 *99.0 (1.0)88.5 (1.7)77.7 (2.3)8
S365S365246.87 (0.53)5.91 (0.13)0.863 (0.090)±0.156 NS98.0 (1.0)66.5 (5.1)19.0 (10.7)2
S301S301246.12 (0.50)1.97 (0.50)0.327 (0.084)±0.144 *97.0 (0.0)45.5 (7.7)5.3 (3.9)3
Stable > 80S652, S185, S19, SH3, S25
Stable < 80S557, S646, S34, S599, S546, S625, S566, S71
Survival > 80SP3, S365, S301, SA2, S287, S25, SV1, S185, S652, SH3, S19
Disclaimer/Publisher’s Note: The statements, opinions and data contained in all publications are solely those of the individual author(s) and contributor(s) and not of MDPI and/or the editor(s). MDPI and/or the editor(s) disclaim responsibility for any injury to people or property resulting from any ideas, methods, instructions or products referred to in the content.