Article

Exploring Sustainable Innovation Level, Spatial Inequities, and Convergence Trends in China’s Wood Industry

School of Economics and Management, Beijing Forestry University, Qinghua East Road 35, Beijing 100083, China
*
Author to whom correspondence should be addressed.
Forests 2024, 15(12), 2168; https://doi.org/10.3390/f15122168
Submission received: 18 October 2024 / Revised: 1 December 2024 / Accepted: 4 December 2024 / Published: 9 December 2024
(This article belongs to the Section Forest Economics, Policy, and Social Science)

Abstract

:
The importance of sustainable innovation in the wood industry is growing, but there is a lack of comprehensive analysis of its evolution, regional differences, and patterns of convergence in China. Based on the panel data of 31 provinces in China from 2011 to 2021, the sustainable innovation index of the wood industry is measured by the projection pursuit method. On this basis, the kernel density estimation method and Dagum Gini coefficient are used to study the dynamic evolution trend, regional differences, and sources of the index, and the convergence characteristics are examined using the coefficient of variation method. The study shows that (1) China’s overall wood industry sustainable innovation index shows a decreasing trend from 2011 to 2021. (2) The differences in the four regions mainly come from inter-regional differences. (3) The index shows significant nonequilibrium characteristics and progressive evolution patterns, and the spatial agglomeration is significant. The magnitude of the index deviation from the average did not decrease over time for the northern and southwestern forest regions. (4) The wood industry sustainable innovation index of the four major forest regions has obviously converged to the same level; under the condition of considering multifactors differentiation, the growth rate of the index of the lower regions is significantly higher than that of the higher regions. The study concludes that current regional imbalances in sustainable innovation in China impede progress and equitable distribution of benefits in the wood industry, and that the impact of regional differences on the β-convergence of sustainable innovation varies according to specific regional characteristics and conditions. These findings provide important theoretical contributions and practical guidance for the development of targeted innovation strategies for the sustainable development of the wood industry, as well as for the promotion of balanced regional development.

1. Introduction

The new round of scientific and technological revolution and industrial change are reshaping the global innovation map and the global economic structure [1]. Innovation, as the primary driving force to lead development, has become the focus of attention of the international community [2]. With the acceleration of the globalization process, the competition among countries is gradually shifting from the traditional areas of resources and trade to science, technology, and innovation [3]. The National Development and Reform Commission issued the “new pattern of China’s manufacturing development ushered in a new mission” and stressed that in the new round of scientific and technological revolution and industrial change in the stall, China is facing the potential risk of being marginalized [4]. The traditional manufacturing industry should realize the breakthrough through innovation, which has become an irreplaceable choice [5]. Notably, the wood industry relies heavily on various types of timber, including pine, fir, and hardwood species, for production processes, each contributing unique properties to finished products [6]. Additionally, domestic wooden cellulose raw materials, such as bamboo and agricultural residues, play a pivotal role in sustaining the industry’s growth while promoting environmental sustainability [7]. The Chinese forestry sector, characterized by its vast resources, diverse ecosystems, and government policies aimed at sustainable forest management, provides a solid foundation for the wood industry’s development [8].
However, the costs and risks involved in innovation activities are relatively high, and any interruption or delay in the cycle will have a serious impact on the industry [9]. Against this background, it is particularly important to maintain the sustainability of innovation activities in traditional manufacturing industries and to ensure that the results of industrial innovation can be sustained [10]. Improving the sustainable innovation capacity of traditional manufacturing industries has become a common interest and strategic demand of China and the international community.
As a traditional manufacturing industry, the wood industry is an important pillar industry in China, contributing strongly to economic development [11], the revitalization of rural industries and the precise eradication of poverty [12]. “Turning green mountains into gold mountains” is the development direction of the forestry industry, which determines that the wood industry will be a sunrise industry for the development of the national economy in the future [13]. However, today’s wood industry still maintains the development mode of “large-scale import and export”, the production technology level is backward [14]. At the same time, China’s wood industry is shackled by regional imbalances in the process of innovative activities [15]. In order to improve the sustainable innovation level of the wood industry, it is worthwhile to further explore a series of questions about: How to measure the level of sustainable innovation in the wood industry? How to reveal the evolutionary trend and regional heterogeneity of sustainable innovation, and whether sustainable innovation is spatially convergent.
Based on the above issues, the marginal contributions of this study are mainly reflected in the following aspects: (1) From the perspective of research, this study builds a sustainable innovation framework, which comprehensively considers multiple factors such as industrial benefits, innovation research and development, factor support, application promotion, and domestic and international cooperation, and makes up for the limitations of the application of existing sustainable innovation theories. (2) In terms of theoretical innovation, this study extends the theoretical model of sustainable innovation and establishes an evaluation index system to measure the sustainable innovation index (SII) of the wood industry. By revealing the national and regional status, the study provides a new theoretical basis for effectively evaluating the innovation capacity of China’s wood industry. (3) In terms of research methodology, this study innovatively uses the projection pursuit (PP) method instead of the traditional linear weighting method, and portrays the dynamic evolution trend of the SII in the four forest regions with the help of the kernel density estimation method, and analyzes the spatiotemporal heterogeneity of the SII and its sources by using the Dagum Gini coefficient. Further, based on the spatial weight matrix and other methods, this study empirically examines the spatial and temporal convergence characteristics and spatial spillover effects of SII in each region. Therefore, this study helps developing countries formulate appropriate policies from different perspectives and provide new solutions for high-quality development and innovation-driven strategic goals.
The remaining structure of this article is arranged as follows: the second part provides a review of the existing literature. The third part explores the theoretical framework of sustainable innovation in the wood industry and the construction of foundational indicators. The fourth part contains the measurement results and regional comparisons. The fifth part contains the dynamic evolution and regional difference characteristics. The sixth part contains convergence characteristics. The last part contains research conclusions, recommendations, limitations, and directions for future research.

2. Literature Review

2.1. Sustainable Innovation Theory

This study explores how to deal with the problems and challenges of sustainable development from the perspective of innovation, and sorts out the characteristics and laws of innovation activities oriented towards sustainable development. Therefore, sustainable innovation is the most crucial and important concept in this study.
Sustainable innovation emerged with the concept of sustainable development and later gradually attracted the attention of governments, enterprises, and scholars [16]. However, in the existing literature on sustainable innovation research, the concept of sustainable innovation has multiple connotations and is not uniformly understood and recognized [17]. This is mainly due to the fact that the concepts of innovation and sustainable development are themselves rich in meaning and widely discussed and applied, thus creating difficulties in defining the connotations [18]. Scholars have interpreted the concept of sustainable innovation at several levels [19]. For example, scholars understand sustainable innovation as the sustainability of innovation, i.e., whether an enterprise’s innovation can consistently bring lasting competitive advantage to the enterprise [20]. Some scholars understand sustainable innovation as green/ecoinnovation, i.e., innovation activities of firms aimed at reducing negative impacts on the ecological environment [21,22]. In recent years, scholars have generally tended to view sustainable innovation as sustainability-oriented innovation, focusing on how to achieve the unity of economic, social, and environmental benefits [23].
Calik and Bardudeen (2016) classified sustainable innovation performance into two categories, namely sustainable product performance and process innovation performance, and developed a measurement model with 34 literature-based items, but no data-based analysis or validation [9]. Zhang and Li et al. (2022), in discussing the influencing factors of sustainable innovation, argued that innovation capacity, technological research, and development capacity is the main concern for improving sustainable innovation [24]. Apparently, this category of concepts does not involve the exploration of environmental or social latitude, but only discusses the capabilities that can support the firm to achieve commercial success and profit growth, and thus gain a sustained competitive advantage of the firm. Escobar and Luna et al. (2023) found that research on sustainability innovation should focus more on the environmental component [25,26]. Sustainable innovation requires firms’ innovation activities to be economically, socially, and environmentally sustainable at the same time [27].
As with these studies, empirical research in the sustainable innovation literature has mainly focused on the ecological aspects of sustainability, and few studies have examined sustainability more comprehensively, covering not only the environmental but also the social and economic perspectives. The reason behind this can be explained by the difficulty in identifying areas for measuring the social dimension of sustainable innovation due to the ambiguity of social sustainability [9]. In summary, current research lacks a comprehensive framework that can clearly define and assess the multiple dimensions of sustainable innovation. This limits a comprehensive and in-depth understanding of sustainable innovation in both academia and practice.

2.2. Research on Wood Industry Innovation

As an industry intertwined with tradition and modernity, the wood industry’s innovation ability is affected by a variety of factors in the pursuit of sustainable development. In order to understand the internal logic of sustainable innovation in the wood industry more clearly, it is necessary to sort out the relevant research on innovation in the wood industry.
First of all, technological innovation is the core driving force that promotes sustainable innovation in the wood industry [8]. Innovations in wood processing technology, product design concepts, and optimization of production processes can significantly enhance the competitiveness of the wood industry [12]. Johnsson and Andersson et al. (2019) pointed out that by introducing advanced processing technology and equipment, the wood industry can improve the utilization rate of raw materials, reduce wastage, and achieve efficient production [28]. Meanwhile, Zhan and Yang et al. (2024) emphasized that the wood industry should pay attention to emerging technologies, such as digitalization and intelligence, to promote industrial upgrading through technological innovation [29].
Secondly, economic factors also have an important impact on wood industry innovation [30]. The level of economic development, industrial structure, labor cost and other factors will affect the innovation ability and development power of the wood industry [31]. Scordato and Klitkou et al. (2018) studied the influence mechanism of socioeconomic factors on the innovation of the wood industry, and concluded that the wood industry should adjust its innovation strategy according to the trend of socioeconomic development [32].
Thirdly, market demand is one of the important factors affecting the innovation of the wood industry. As consumers’ requirements for environmental protection, aesthetics and practicality continue to improve, the wood industry needs to continuously launch new products that meet market demands [33]. Khoaele and Gbadeyan et al. (2023) analyzed the current market demand trend for environmentally friendly wood products, and argued that the wood industry should increase its investment in the research and development and production of environmentally friendly materials [34]. In addition, Zanchini and Blanc et al. (2022) also pointed out that the wood industry should pay attention to the personalized needs of consumers for product design, and satisfy the aesthetic and practical needs of consumers through innovative design [35].
Fourthly, as a renewable resource, the sustainable utilization of timber is crucial to the innovation and development of the wood industry [15]. Purkus and Hagemann et al. (2018) analyzed the relationship between the sustainable utilization of timber resources and the innovation of the wood industry, and concluded that a reasonable resource utilization strategy can promote the innovation and development of the wood industry [13]. At the same time, Vergarechea and Astrup et al. (2023) also emphasized that the wood industry should pay attention to environmental protection and ecological balance in the process of innovation to achieve a win-win situation of economic and ecological benefits [36].
Fifth, social benefit is an important index to measure the success of wood industry innovation [37]. While pursuing economic benefits, the wood industry must pay attention to its contribution and impact on society [38]. Khorshidi and Choukolaei et al. (2023) pointed out that wood industry innovation should be committed to increasing employment, improving people’s livelihoods and promoting local economic development [39]. In addition, the wood industry should also pay attention to the positive impacts of its innovation activities on social culture, education, and the environment in order to realize a win-win situation in terms of economic and social benefits [40].
Studies have shown that sustainable innovation in the wood industry is influenced by a variety of factors. However, previous studies tend to focus on one or several aspects of the wood industry, such as technological innovation, economic benefits, or environmental impacts, and have lacked comprehensive studies. Although some studies have begun to focus on the sustainability of the wood industry and the enhancement of its innovation capacity, they have neglected to analyze the spatial dimension. The distribution and development of the wood industry may vary significantly in different regions, and this spatial nonequilibrium is crucial for understanding the sustainability of innovation across the industry. In addition, relatively little convergence analysis has been applied in industry studies. It is often limited to simple linear convergence or β convergence tests and lacks a comprehensive examination of different convergence types (e.g., σ convergence, absolute β convergence, conditional β convergence, etc.). The above shortcomings have resulted in existing studies remaining in theoretical analysis and descriptive statistics and lacking country- and region-specific policy guidance.
Therefore, this study bridges the gap between existing studies on sustainability innovation in the wood industry. Through a comprehensive analytical framework, the introduction of spatial dimensions, the expansion of convergence studies, and the provision of policy guidance, the findings of the study provide a useful scientific basis and practical guidance for the sustainable development of the wood industry and the enhancement of its innovation capacity.

3. Materials and Methods

3.1. Construction of Sustainable Innovation Index for Wood Industry

3.1.1. Internal Logic of Sustainable Innovation

According to Schumpeter’s definition of innovation and the concept of sustainable development, on the basis of the existing conceptual expression of sustainable innovation [41,42], this paper defines sustainable innovation as the innovative activities, including technology, product, service, process, organization, and market, that are oriented towards achieving sustainable development of the economy, society, and environment and can generate sustainable financial, social, and environmental performance.
This definition has two meanings. On the one hand, this definition emphasizes the significance of innovation for the achievement of sustainable development goals. Enterprise-based innovation is not only the main driving force for global economic development, but also the key to solving the major challenging problems currently facing the world (e.g., extreme environmental pollution, widening gap between the rich and the poor, social injustice, etc.) [43]. Therefore, innovation is the way to achieve sustainable development. On the other hand, this definition also emphasizes the role of sustainable development in promoting innovation. Sustainable development has become one of the main drivers of corporate innovation. In the future, only companies that aim at and are oriented toward sustainable development will be able to gain a sustained competitive advantage [44]. Focusing on sustainable development means rethinking and repositioning a company’s existing business models, products, and processes, and thus provides companies with a wealth of opportunities for innovation [45].
Based on the above analysis, this study argues that the definition of sustainable innovation contains five important dimensions: factor support sustainability (FSS), industrial benefits sustainability (IBS), innovative research and development sustainability (IRDS), application promotion sustainability (APS), and international cooperation sustainability (ICS).
These five dimensions are interconnected and influence each other. As shown in Figure 1. Under the framework of sustainable innovation, the FSS is the basic support, the IBS is the core task, the IRDS is the intrinsic motivation, the APS is the necessary link for the transformation of innovation results, and the ICS is the important driving force and gas pedal.

3.1.2. Selection and Explanation of Basic Indicators

On the basis of fully considering the continuous validity and accessibility of data, referring to the existing relevant index system, this paper constructs the evaluation index system for the sustainable innovation level of China’s wood industry, as shown in Table 1. It is worth noting that the industrial benefits not only include economic benefits, but also social benefits and ecological benefits.

3.1.3. Construction of Index by Projection Pursuit Method

Projection Pursuit method is a statistical method for analyzing and processing non-normal high-dimensional data, which has significant advantages in dealing with non-normal high-dimensional data [46]. Sustainable innovation in China’s wood industry involves multiple dimensions and complex factors, and the data are often characterized by non-normal distribution. The PP method can effectively reveal the intrinsic structure and characteristics of the data by projecting the high-dimensional data onto a low-dimensional subspace. This method can not only deal with complex nonlinear relationships, but also avoid the problem of “dimensional catastrophe” that may be encountered when dealing with high-dimensional data in traditional methods [47]. Meanwhile, the PP method optimizes the projection function to find the projection vector that can reflect the structure or features of high-dimensional data. This means that the projection tracing method can automatically find the projection direction that has the most explanatory power for the data, thus more accurately reflecting the actual situation of sustainable innovation in China’s wood industry. In contrast, methods such as the entropy method are often based on fixed weights or calculation rules, which may not be able to fully adapt to the complexity and dynamics of the data [47]. The modeling process of the PP comprehensive evaluation model mainly has the following steps:
(1)
Standardization of sample index values
In order to circumvent the problem of the difference in scale and magnitude between the indicators, it is necessary to standardize all the indicators. Let the jth indicator of the ith sample in the sample indicators be x i j 0 (i = 1,2, …, n; n is the number of samples; j = 1,2, …, m; m is the number of indicators). In order to eliminate the scale of each indicator and unify the range of variation, the method of polar normalization is used. The processing formula is as follows:
For   forward   indicators :   X i j = x i j 0 x j max
For   inverse   indicators :   X i j = x j min x i j 0
where Xij is the normalized value; xjmin and xjmax are the minimum and maximum values of the ith sample indicator, respectively.
(2)
Construct the projected eigenvalue function Zi
The projected eigenvalue Zi is constructed as
Z i = j = 1 m X i j a j
where aj is the j-component of the projection direction vector a, aj ∈ [−1, 1]. The key to determining the projection eigenvalue Zi is to find the optimal projection direction aj that reflects the characteristic structure of high-dimensional data.
(3)
Construct the projection indicator function Q(a).
In order to construct the projection indicator function, two concepts of interclass distance and intraclass density are introduced. The interclass distance is calculated by the variance of the projected eigenvalue sequence, see Equation (4).
s ( a ) = i = 1 n ( Z i Z ¯ ) 2 / n 1 / 2
The intraclass density is defined as:
d ( a ) = i = 1 n k = 1 n ( R r i k ) f ( R r i k )
Construct the projection indicator function:
Q ( a ) = s ( a ) d ( a )
where Z ¯ is the mean value of n Zi, i.e., Z ¯ = i = 1 n Z i / n ; rik denotes the distance between the two integrated eigenvalues Zi and Zk, r i k = Z i Z k (i, k = 1~n); R denotes the window width of the density, which is related to the characteristics of the data, and is usually taken in the range of rmax + m/2 ≤ R ≤ 2m, where rmax is the maximum value of rik; f(Rrik) denotes the monotonous density function that decreases with the increase in rik, and when R > rik, f(Rrik) = 1; and vice versa is 0. The larger s(a) the more dispersed the sample is, and the larger d(a) the more significant the classification is. Therefore, a projection indicator function Q(a) is constructed as the basis for the preferred projection direction, and the optimal projection direction is obtained when the indicator function reaches the extreme value.
(4)
Solving the optimal projection direction
The simulated annealing algorithm is used to solve the optimal projection direction vector a. Firstly, the interclass distance s(a), intraclass density d(a) and projection index function Q(a) are calculated according to Equations (4)–(6), and the PP model is established for the data. Matlab 7.0 language programming is used to realize it. Parallel SA optimization PP model parameters are set as follows: population size is 200; annealing form: T ( t + 1 ) = γ T ( t ) , γ = 0.9, t is the number of iterations; the initial temperature T0 = 1 × 10¹⁰, the termination temperature Tf = 0; acceptance of the probability formula: exp Δ ( f / T ) > r a n d , where rand is a random number between (0,1). The projection index is calculated using Equation (6), which satisfies the objective function max Q(a) and the constraint a = 1 .
(5)
Solving the value of sustainable innovation index of the wood industry
The study used a linear weighted composite method to measure the index to reflect the overall trend of the sustainable innovation index of China’s wood industry from 2011 to 2021. The linear weighted integrated model is as follows:
S I I = ω 1 x 1 + ω 2 x 2 + + ω n x n
where SII represents the sustainable innovation index of the wood industry; ω refers to the weights measured by the PP method; x is the index value obtained after standardization; n is the number of indexes, i.e., n = 19.

3.2. Analysis Method of Dynamic Evolution and Regional Difference Characteristics

3.2.1. Kernel Density Estimation Method

Kernel density estimation is a nonparametric estimation method, which mainly fits the full sample data by smoothing the peak function. The method can visualize the dynamic evolution trend of random variables through continuous density curves, and is mostly used to portray spatial nonequilibrium characteristics. In order to explore the differentiated distribution and evolution of the SII of China’s wood industry in each region, the kernel density estimation method is introduced to carry out further tests. Assuming that f(x) is the density function of the SII of China’s wood industry, and introducing the kernel density estimation feature into it, this study constructs the measurement formula as follows:
f ( x ) = 1 N h i = 1 N K ( X i y h )
where N represents the number of observations; Xi represents independent identically distributed observations. h, y, and K refer to the bandwidth, observation mean, and kernel density function, respectively. Then, the kernel density function measure in the above density function f(x) is further supplemented by introducing the Gaussian kernel density function feature with the following formula:
K ( x ) = 1 2 π exp ( y 2 2 )

3.2.2. Dagum Gini Coefficient and Its Decomposition

In order to reveal the regional differences in the SII of China’s wood industry and its sources, the Dagum Gini coefficient is used for analysis. The specific formula is set as follows:
G = j = 1 k h = 1 k i = 1 n j r = 1 n h y i j y h r 2 n 2 μ
where G represents the overall Gini coefficient, k represents the number of regional boards after division, i.e., k = 4. n represents the number of provinces, i.e., n = 31. yij represents the wood industry SII of province i within region j. yhr represents the wood industry SII of province r within region h. nj represents the number of provinces included in region j. nh represents the number of provinces included in region h. μ represents the mean value of the national wood industry SII.
The decomposition of the Dagum Gini coefficient into Gw, Gnb, and Gt is shown below:
G j j = 1 2 μ j n j 2 i = 1 n j r = 1 n j y i j y j r
G w = j = 1 k G j j p j s j
G j h = i = 1 n j r = 1 n k y i j y h r n j n h ( μ j + μ h )
G n b = j = 2 k h = 1 j 1 G j h ( p j s h + p h s j ) D j h
G t = j = 2 k h = 1 j 1 G j h ( p j s h + p h s j ) ( 1 D j h )
where Gw represents the contribution of intraregional variation, Gnb represents the contribution of inter-regional net variation, Gt represents the contribution of hypervariable density, and the sum of Gnb and Gt is the total contribution of inter-regional variation, and G = G w + G n b + G t . The larger the value of G, i.e., the larger the value of the Gini coefficient, the larger the regional variation. Gjj and Gjh represent the intraregional and inter-regional Gini coefficients, respectively; μj represents the mean value of the SII of the wood industry in area j; μh represents the mean value of the SII of the wood industry in area h; p j = n j / n ; n j = n j μ j / n μ ; j represents a region, p j = s j = j = 1 k h = 1 k p j s h ; ph and sh are measured by the same formula as pj and sj. In addition, Djh represents the relative influence of SII between region j and region h, and the calculation formula is as follows:
D j h = ( d j h p j h ) / ( d j h + p j h )
d j h = 0 d F j ( y ) 0 y ( y x ) d F h ( x )
p j h = 0 d F h ( y ) 0 y ( y x ) d F j ( x )
where djh denotes the inter-regional wood industry SII difference, for the full sample sum mathematical expectation of yijyhr > 0 in region j and region h; pjh denotes the hypervariable first-order moment, for the sample sum mathematical expectation of yijyhr < 0 between region j and region h; Fj is the distribution function of cumulative density in region j; and Fh is the distribution function of cumulative density in region h.

3.3. Convergence Characteristic Analysis Method

3.3.1. σ Convergence

σ convergence means that the magnitude of deviation from the equilibrium level of the SII of wood industry in different regions shows a decreasing trend in the time series. Usually, the σ convergence measure contains the Gini coefficient, the Theil index and the coefficient of variation. In this paper, the Theil index is used to portray σ convergence, and the measurement formula is as follows:
T w r = r = 1 R A r A d = 1 D r A d A r ln A d A r / D r
T b r = r = 1 R A r A ln A r / D r A / D
T = T w r + T b r
where Ad is the level of SII of the wood industry in the dth city, Ar refers to the level of SII of the wood industry in the rth region, A is the sum of SII of the wood industry in 31 provinces, R is the number of regions, Dr is the number of provinces in the rth region, and D is the number of provinces. The value of the Theil index is distributed between 0 and 1. The closer its value is to 1, the greater the degree of economic disequilibrium between regions; the closer its value is to 0, the smaller the degree of disequilibrium between regions. If the value of the Theil index shows a narrowing trend over time, it indicates that the dispersion of the SII of the wood industry in each province in the region is decreasing, i.e., the gap of the SII among the regions is narrowing and showing a trend of convergence to the national average.

3.3.2. Spatial Correlation

According to the first law of geography, if the whole sample contains multiple spatial units, the spatial correlation between each spatial unit should be considered in an all-round way. The spatial data may have certain spatial dependence or spatial correlation [48]. As a result, it is worthwhile to further explore what kind of spatial correlation exists in the SII of the wood industry in each province. Generally speaking, Global Moran’s index (Global Moran’s I) and Local Moran’s index (Local Moran’s I) are the most common spatial correlation indexes in academia. Based on the construction of the spatial weight matrix, this paper measures Global Moran’s I and Local Moran’s I and analyzes the spatial relevance of SII in the wood industry.
(1)
Global Moran’s I
Global Moran’s I can measure whether there is global spatial correlation and aggregation among all samples, and the formula is as follows:
M o r a n s   I i t = n i = 1 n j = 1 n W i j ( ln S I I i ln S I I ¯ ) ( ln S I I j ln S I I ¯ ) S 2 i = 1 n j = 1 n W i j
where n represents the total number of regions; Wij denotes the spatial weight matrix; denotes the natural logarithmic value of the SII of the wood industry in province i; and S2 denotes the sample variance. The Global Moran’s I takes the value range of (−1, 1), and the larger the absolute value, the larger the spatial correlation. Moran’s I > 0 indicates the existence of a positive correlation; on the contrary, the existence of a negative correlation.
(2)
Local Moran’s I
The Global Moran’s I reflects the overall agglomeration pattern of the research sample at the spatial level, and it is difficult to depict the actual location of the agglomeration and the local linkage effect. In order to comprehensively understand the spatial agglomeration of SII, it is necessary to further analyze the characteristics of local agglomeration and dispersion through the Local Moran’s I. All spatial units are subdivided into several independent regions, and the construction formula is shown below:
L o c a l s   I i = ln S I I i ln S I I ¯ S 2 j = 1 n W i j ( ln S I I j ln S I I ¯ )

3.3.3. β Convergence

β convergence originated from the neoclassical economic growth theory, which can be understood as the convergence pattern shown in the process of underdeveloped regions with higher growth rates catching up with developed regions over time, and ultimately realizing the same frequency of growth rates as those of developed regions. Convergence includes two types: absolute β convergence and conditional β convergence. In this study, absolute β convergence indicates that, under the premise of controlling other factors unchanged, the SII of the wood industry in each region converges to the same level over time; conditional β convergence refers to the fact that under the condition of comprehensively considering multifactorial differentiation, the growth rate of the SII of the wood industry is faster in the lower region compared with that in the higher region, i.e., the SII of the wood industry in each region gradually converges to the respective steady state.
Before the test, the spatial autocorrelation test confirmed the existence of a significant positive spatial correlation of the SII, and then this study chooses the appropriate spatial econometric model to estimate the convergence of the whole country and the three major regions. Generally speaking, there are three common spatial measurement models in academia, i.e., the Spatial Dubin Model (SDM), the Spatial Lag Model (SLM), and the Spatial Error Model (SEM). In this study, these three spatial econometric models are set as follows on the basis of the traditional β convergence model:
ln S I I i , t + 1 S I I i , t = α + β ln S I I i , t + ρ j = 1 N W i j ln S I I i , t + 1 S I I i , t + θ j = 1 N W i j + γ ln X i , t φ j = 1 N W i j ln X i , t + 1 + μ i + η i + ε i , t
ln S I I i , t + 1 S I I i , t = α + β ln S I I i , t + ρ j = 1 N W i j ln S I I i , t + 1 S I I i , t + γ ln X i , t + μ i + η i + ε i , t
ln S I I i , t + 1 S I I i , t = α + β ln S I I i , t + γ ln X i , t + 1 + μ i + η i + ε i , t , ε i , t = λ j = 1 N W j , t + σ i , t
where SIIi,t and SIIi,t+1 denote the SII of the wood industry in region i in years t and t + 1, respectively; ρ , λ , and θ denote the spatial autoregressive coefficients, spatial error coefficients, and spatial spillover coefficients, respectively. The spatial weighting matrix is represented by W. X, γ denote the set of control variables and their corresponding regression coefficients, respectively. μ , η denote the spatial and temporal effects, respectively. ε , φ denote the spatial terms of the random perturbation term and the spatial term coefficients of the control variables. The model convergence coefficient is characterized by β. If β is significantly negative, it indicates that the regional wood industry SII has a β convergence pattern; otherwise, it indicates a divergence pattern.
The speed of convergence is measured by the β convergence coefficient, which is used to reflect the catching-up speed of the lower regions to the higher regions of the SII of the wood industry, and the formula is set as follows:
v = 1 T ln 1 β
where v represents the rate of convergence and T represents the year span.

3.4. Data Sources

The study is based on data from 31 provinces in China (except Hong Kong, Macao, and Taiwan) for the period 2011–2021, and the initial data are derived from China Statistical Yearbook, China Forestry and Grassland Statistical Yearbook, China Industrial Statistical Yearbook, China Energy Yearbook, China Carbon Accounting Database (CEADs), customs statistics, and provincial and municipal statistical yearbooks and EPS databases. According to China’s National Economic Industry Classification, the wood processing and wood, bamboo, rattan, palm, and grass products industry are selected for this study.
According to the distribution of forest areas in China [49], the 31 provinces in China were divided into four forest areas, as shown in Table 2 below.

4. Results

4.1. Measurement Results of Sustainable Innovation Index of Wood Industry

Based on the PP model, the SII of China’s wood industry from 2011 to 2021 can be calculated, and the results are shown in Table 2. Overall, the SII of China’s wood industry is in a decreasing trend from 2011 to 2021, and there are obvious differences among the four regions. The overall SII decreased from 1.414 in 2011 to 1.050 in 2021, with a decrease of approximately 25.72%. The wood industry SII in the northern forest region, northeastern forest region, southwestern forest region, and southern forest region decreased by 27.84%, 46.83%, 21.57%, and 18.88%, respectively.
By region, the index of the southern forestry region was much higher than that of the whole country and the other three regions. Within the overall downward trend of the index, the southern forest region had the lowest decline in the SII and experienced a rebound in 2015–2016. Before 2015, the northern forestry region and the southwestern forestry region were at a lower level, while the northeastern forestry region started to be lower than that of the southwestern forestry region after 2015. The gap between the indices for the northern and southwestern forest regions has remained essentially stable. During this period, the SII of the northeastern forest region declined extremely rapidly and was lower than that of other forest regions in 2018. This fully demonstrates that there are certain differentiated characteristics of the SII in various regions of the country.
In terms of the rate of change, the national SII shows a fluctuating downward trend, especially before 2014, when all regions showed a continuous decline. While the southern forest region, the southwestern forest region showed a certain fluctuating rebound trend after 2015. It can be found that despite the slight fluctuation in the rate of decline of the SII each year, all four forest regions show a downward trend in the SII.
Compared with the northeastern forest region, the counter-trend uptrend of the southern forest region and the southwestern forest region is gradually highlighted, especially the southwestern forest region has an obvious latecomer’s advantage.

4.2. Regional Distribution of Sustainable Innovation Index

The sustainable innovation index of the wood industry in China and the four regions was calculated, and the specific results are shown in Table 3. This paper divides the full sample based on the relationship between the mean € and the standard deviation (SD) of the SII into four levels: high level (>E + 0.5 SD), medium-high level (between E~E + 0.5 SD), medium-low level (E – 0.5 SD~E), and low level (<E – 0.5 SD), and the specific results are shown in Table 4.
Combining Table 3 and Table 4, it is not difficult to find that the regions of China’s wood industry SII in 2011–2021 are characterized by a stepwise pattern, which basically presents a relatively significant stepwise distribution pattern of southern forest region—northern forest region—northeastern forest region—southwestern forest region. Specifically, the average values of the SII in the southern forestry region, northern forestry region, northeastern forestry region, southwestern forestry region, and the whole country are 1.300, 0.9186, 0.8575, 0.9256, and 1.107, respectively, which indicates that the SII of the wood industry in China is not at a high level, and there are significant regional differences.
There are eight high-level provinces in the country, six of which are from the southern forest region. The high- and medium-high-level provinces account for 75% of the provinces in the southern forest region, which indicates that most of the provinces in the southern forest region have a high level of sustainability innovation in the wood industry. The northeast forest region includes one medium-high-level province, two medium-low-level provinces, and one low-level province. The northern forest region includes one high-level province, three medium-low-level and six low-level provinces, indicating that the development of sustainable innovation levels in its wood industry is more uneven. The northeast and southwest forest regions each include 1 medium-high level province and 3 medium-low level and below provinces, indicating that the sustainable innovation level of the wood industry in the northeast and southwest forest regions is low. In summary, it can be seen that 58% of the provinces in China are in the medium-low level and low level, indicating that the overall sustainable innovation level of the wood industry in China is not high.
Further, in the northern forest area, the SII of Henan Province is leading but with a negative growth rate, while Beijing and Tianjin are not high but with the fastest average growth rate. Gansu and Ningxia have an average growth rate of −0.053 and −0.052, ranking relatively low. Most of the provinces in the northeast forest region and southwest forest region have negative growth rates, and only two provinces in the southwest forest region, Chongqing and Tibet, have positive average growth rates, reflecting the fact that these regions are facing bottlenecks in technological + innovation, sustainable development, and industrial restructuring. The average value of the SII is the highest in the southern forestry region, but the average growth rate of most provinces is still negative, reflecting that the southern forestry region still faces the problem of balanced and coordinated development in the region, although it has a certain foundation.

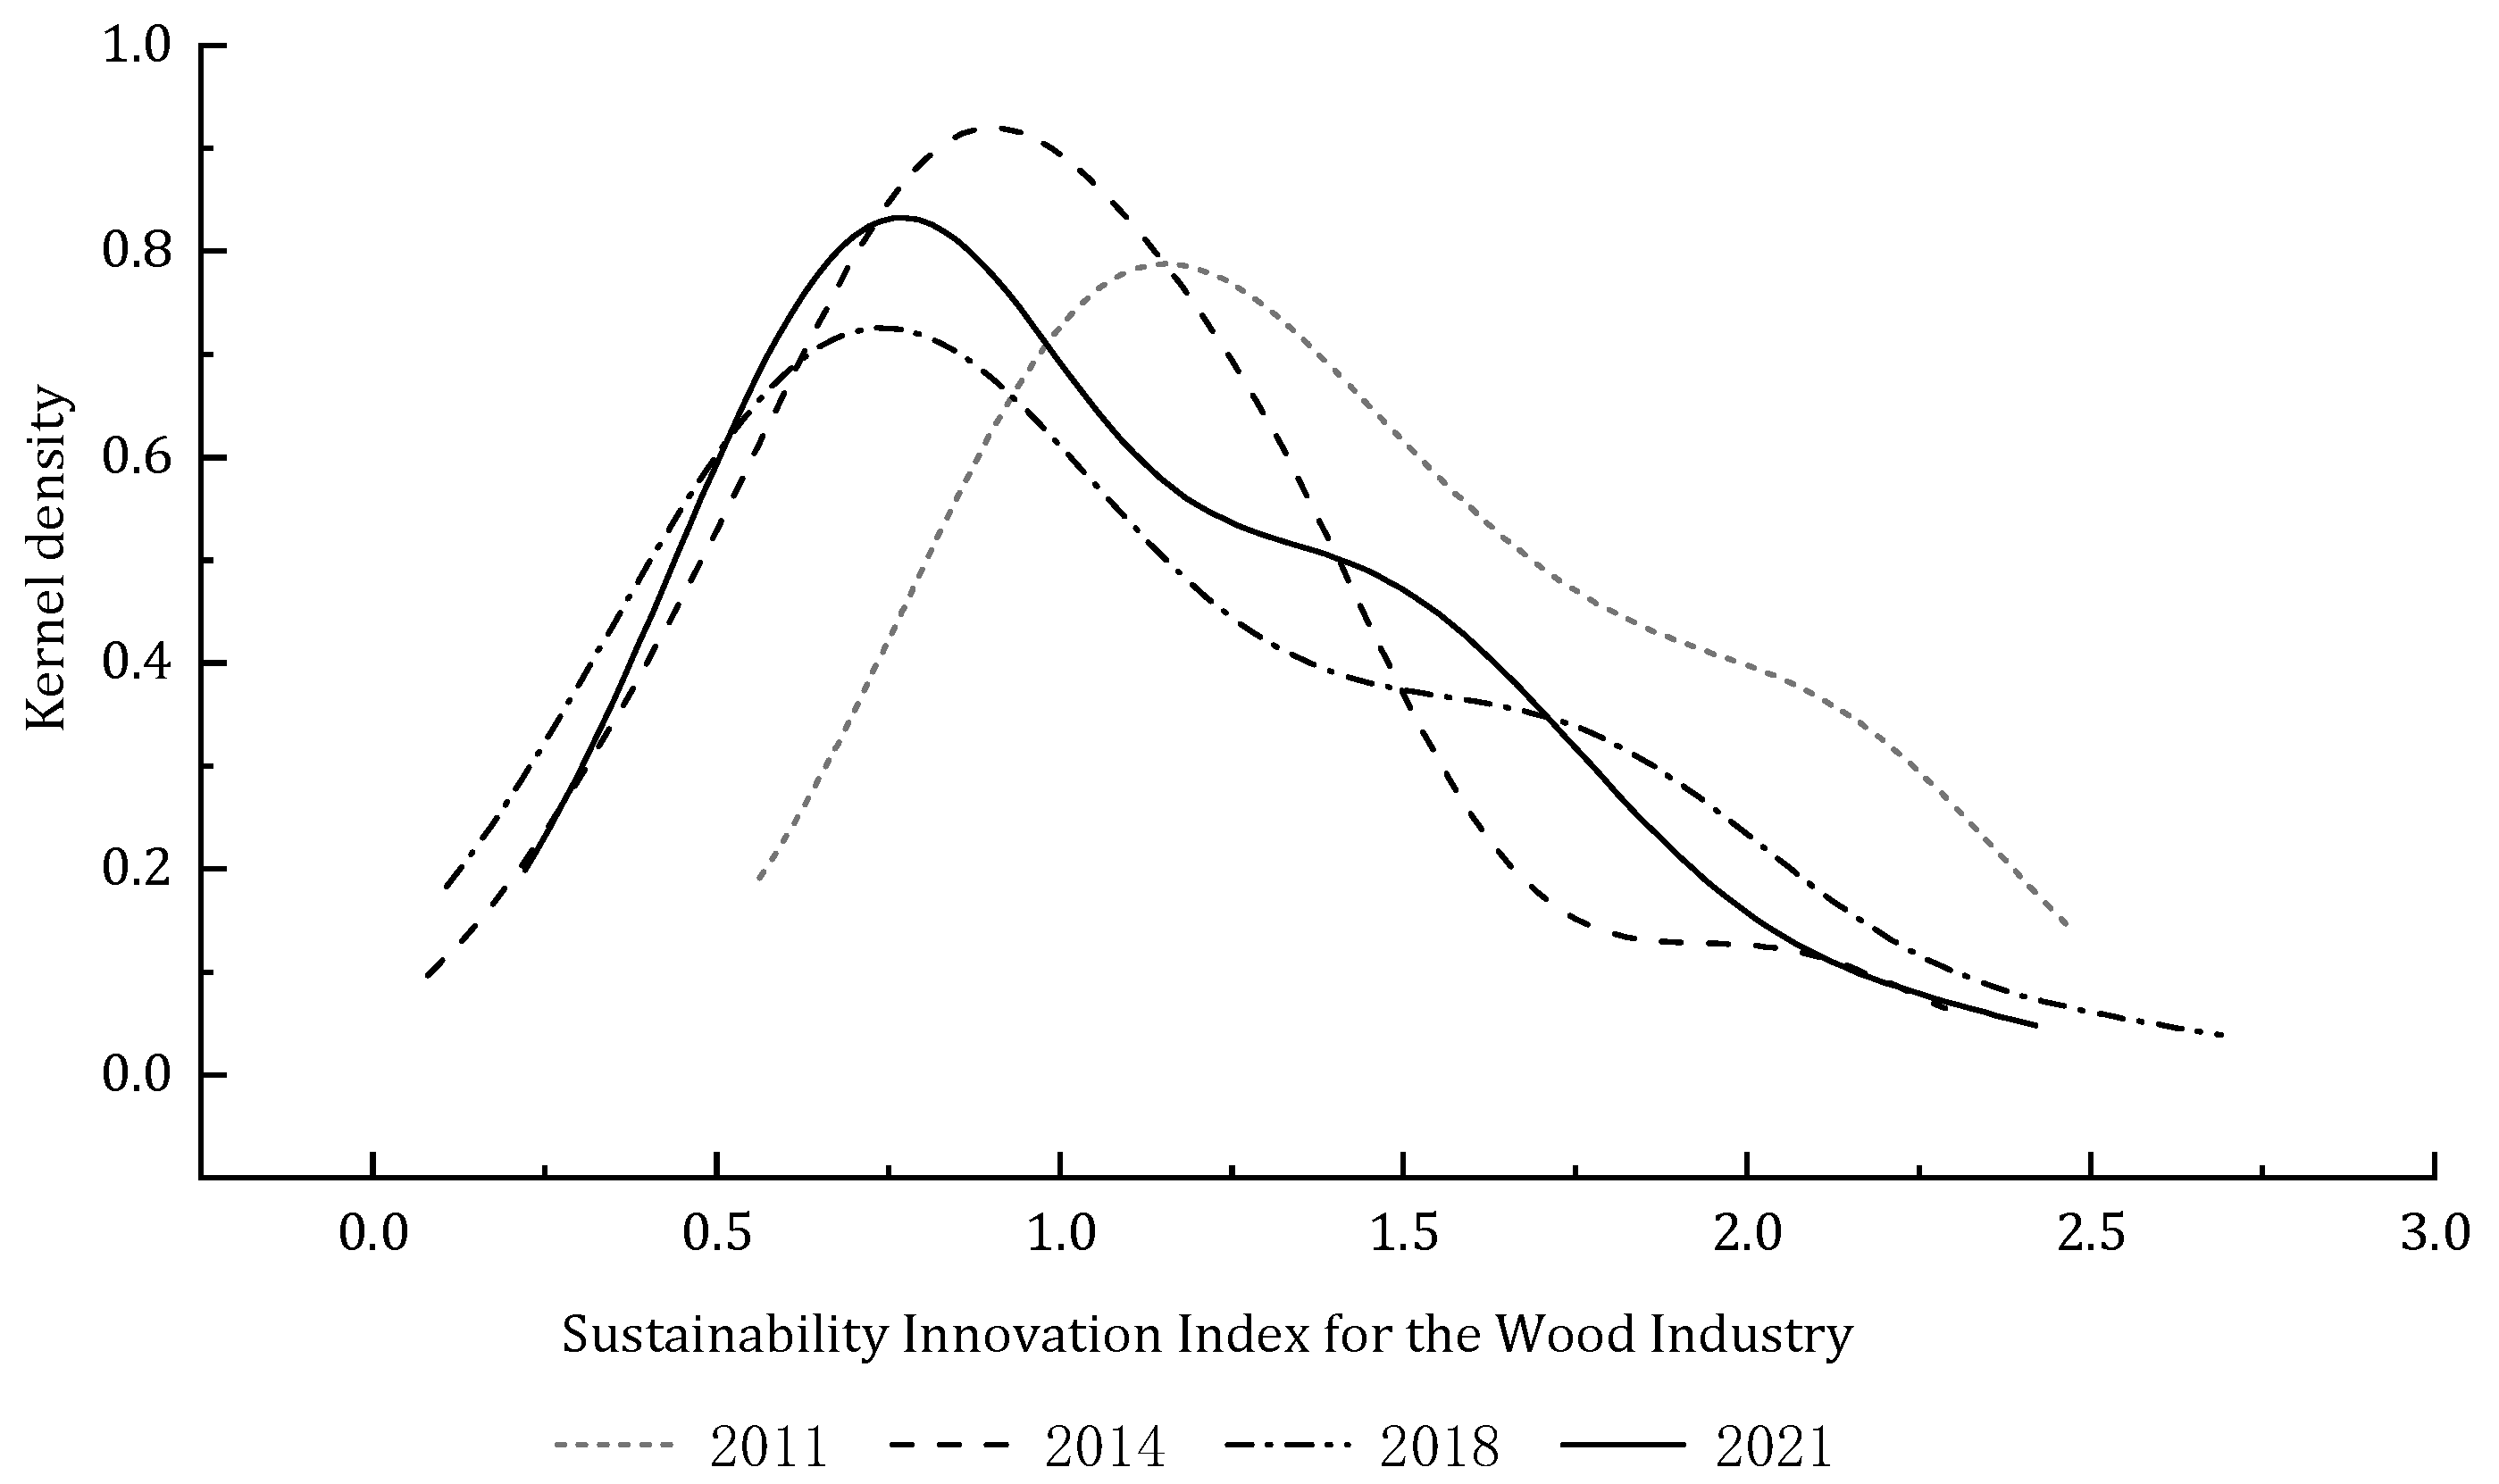
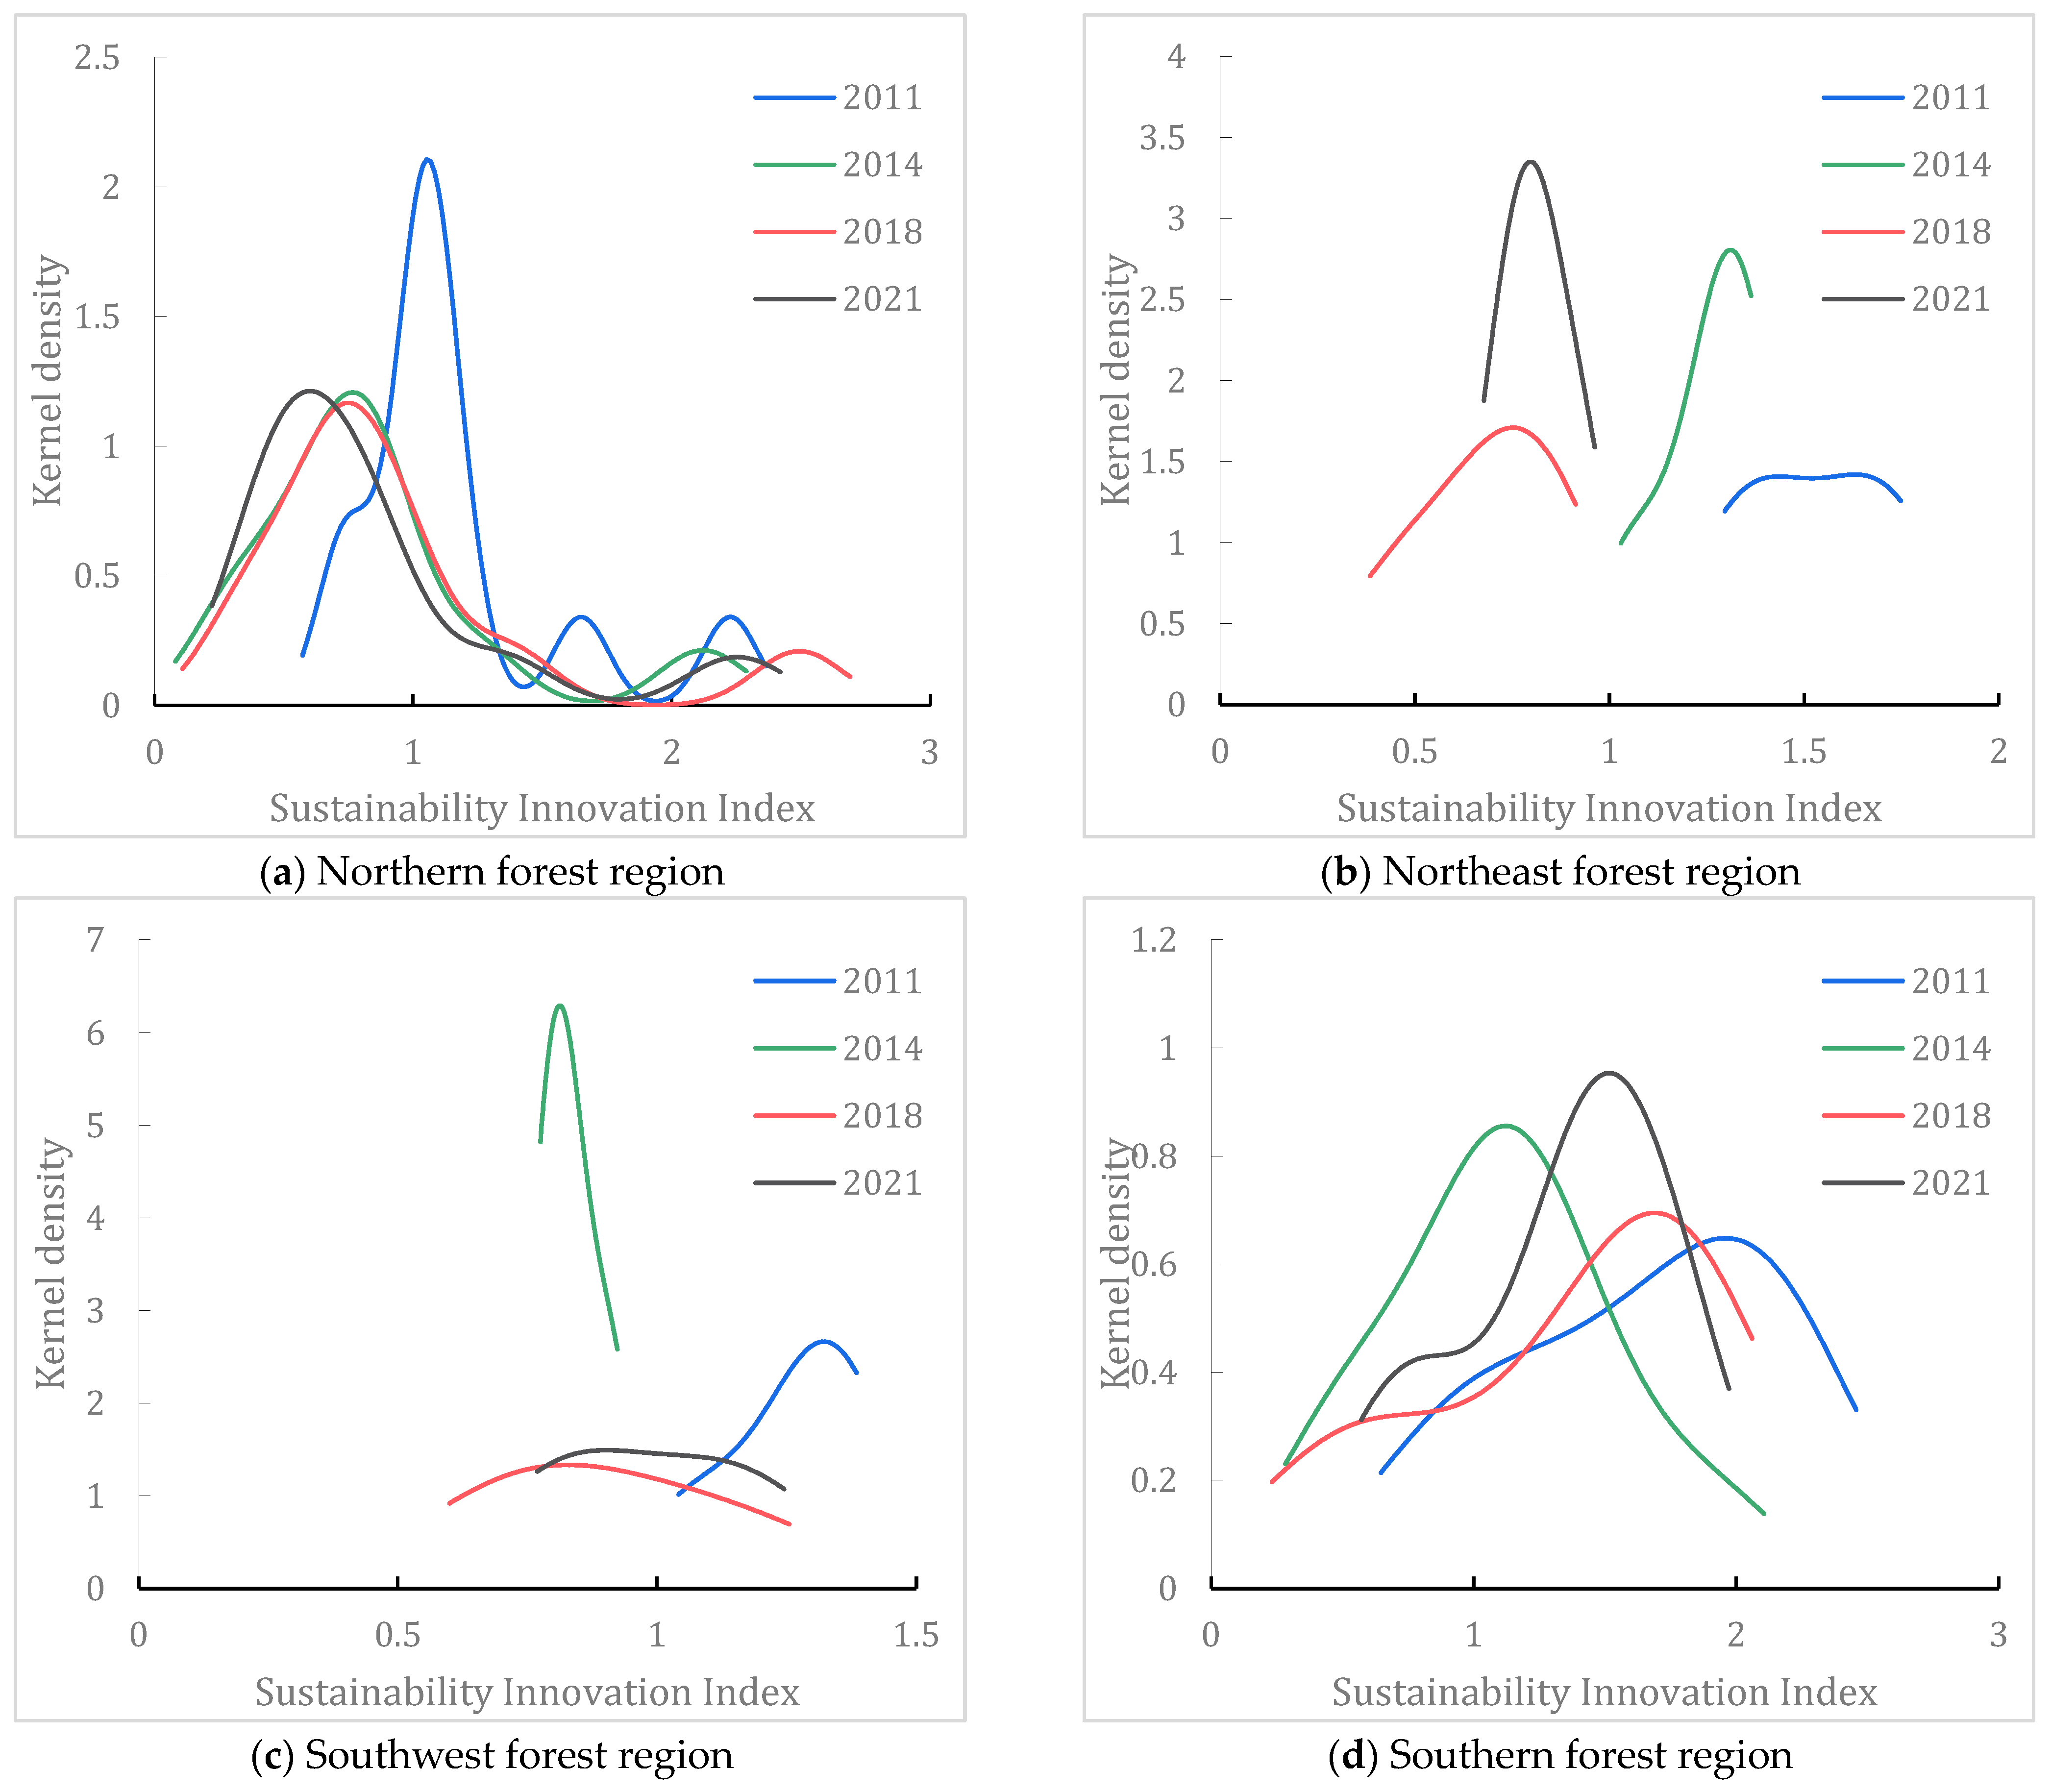
4.3. Distribution Dynamics and Evolution Characteristics

The dynamics of the distribution of the SII of the wood industry at the national level and in the four regions are plotted as shown in Figure 2 and Figure 3, using 2011, 2014, 2018, and 2021 as representative years.
As can be seen in Figure 2, the position of the main peak of the curve shows a significant leftward shift, indicating that the overall national SII is in a declining state. The height of the main peak shows a fluctuating trend from 2011 to 2021, with the highest height of the main peak in 2014 and the lowest in 2018. Meanwhile, the width expansion trend is more obvious, indicating that the gap between regions is still continuing to widen. And there is only one main peak, indicating that there is no multipolarization.
Figure 3 shows the dynamics of kernel density distribution in the four regions. In Figure 3a, the position of the wave peak gradually shifts to the left, indicating that the SII in the northern forest area is in a declining trend. The main peak height declines significantly and gradually tends to flatten the style, and the right trailing extension continues to widen, indicating that the differences within the northern forest area have the characteristic of persistent expansion. Observing Figure 3b, the position of the main peak in the northeast forest region gradually shifted to the left, indicating that the SII of the northeast forest region is continuously improving. The trailing trend has weakened, indicating a tendency to narrow the gap within it. Two main peaks appeared in 2011, but there was not much change in the relative positions of the main peaks to the main peaks and the side peaks to the side peaks, which responded to the possible existence of the polarization phenomenon in the northeast forest region.
As can be seen from Figure 3c, the curve of the southwest forest region has a clear trend of leftward shift, but there is a clear rightward shift in 2021, indicating that the SII of the southwest forest region has rebounded after a period of decline. The height of the main peak evolved from a thin and narrow form to a flat form over time, indicating that the SII within the region showed a widening trend. As can be seen from Figure 3d, the overall curve shape of the southern forest region is closer to that of the whole country, with the position of the wave peak showing a leftward shift. The height of the main peak has increased, and the width has decreased, which indicates that there is a narrowing trend in the differences within the southern forest region.

4.4. Regional Differences and Their Sources

Based on Equations (9)–(17), the Dagum Gini coefficient of the SII of China’s regional wood industry can be measured, as shown in Table 5, Table 6 and Table 7. It can be found that the average value of the overall Gini coefficient of the SII of China’s wood industry from 2011 to 2021 is 0.236, and the maximum and the minimum are 0.282 (2018) and 0.181 (2011), which shows that the overall regional differences in the SII of the wood industry have tended to expand significantly, and the degree of coordination of the innovation of the wood industry in each region is in urgent need of further improvement.
(1) Intraregional differences. Combined with Table 5, it can be seen that the mean value of the four regions of SII varies significantly, and there is a serious internal imbalance. The mean value of the Gini coefficient in the northern forest region, northeastern forest region, southwestern forest region, and southern forest region in 2011–2021 are 0.250, 0.096, 0.089, and 0.195, respectively. In terms of the trend of evolution, the northeastern forest region, the southern forest region are in significant fluctuations in a downward trend, and the Gini coefficient values of both the northern forestry region and the southwestern forestry region have increased, but the southwestern forestry region has increased more slowly.
(2) Inter-regional differences. Based on Table 6, it is easy to find that there are obvious differences in the distribution pattern of the Gini coefficient among the four regions. According to the size of the difference, the difference between different regions can be divided into three levels: (A) the difference between the southern forest region and the other three regions is large, and is still in a state of continuous enlargement, belonging to the first level. (B) The difference between the northern forest region and the northeastern forest region, the northern forest region and the southwestern forest region, although it is a widening trend, but the Gini coefficient value is lower, belonging to the second level. (C) The difference between the northeastern forest region and the southwestern forest region is the smallest, and the mean value of the Gini coefficient is 0.157, showing a fluctuating growth trend, but still with the first and second levels there is a certain gap, is classified as the third level. Accordingly, it can be seen that the SII of China’s wood industry still has large inter-regional differences, and the imbalance is still obvious.
(3) Sources of regional differences and their contribution rates. Table 7 shows the results of the decomposition of the overall differences and their sources of the SII. In terms of the sources of differences, the contribution rate of the differences within each region to the overall differences during the examination period is always located between 25.26% and 30.18%, and the overall trend of change is relatively smooth. The contribution of the net value difference between regions to the overall difference experienced a downward and then upward trend, falling from 46.12% to 27.69% and then rising to 48.78%. Accordingly, it can be seen that compared with the contribution rate of intraregional differences, the contribution rate of inter-regional net value differences is larger, which is the main source of regional differences in the SII of China’s wood industry.
Moreover, the contribution of inter-regional differences to the overall differences has been strengthened in recent years. In addition, the overall contribution rate of hypervariance density remains stable in fluctuation and is larger than the intraregional Gini coefficient, indicating that the degree of imbalance in the SII of the wood industry is increasing.

4.5. Convergence Characteristics of Sustainable Innovation Index of China’s Wood Industry

4.5.1. Results of σ Convergence

Table 8 presents the results of the σ convergence test for sustainable innovations in China’s wood industry from 2011 to 2021. As far as the evolutionary pattern is concerned, the country as a whole shows an obvious upward trend.
The direction of the coefficient of variation is obviously different in different regions. (1) The southwestern forest area increased as much as 244.19% during the study period, but its mean value was 0.0167, which was significantly lower than that of other regions. (2) The mean value of the coefficient of variation in the northern forest region is 0.1132, and the year-on-year increase is as high as 180.67%. Taking 2018 as the node, the evolutionary trend of “slowly rising, slowly falling” was observed in the northern forest region, reflecting a slight σ convergence trend in the northern forest region after 2018. (3) The mean value of the coefficient of variation in the northeastern forest area is 0.0207, with the largest decrease of 15.63%, which is roughly in the form of “small increase—small decrease”. Among them, the slight decline stage is from 2017 to 2021, and the σ convergence pattern is more obvious. (4) The coefficient of variation in the southern forest area decreased by 8.47% during the study period, with 2017 as the node, showing a trend of “slowly rising-slowly declining”, and the pattern of σ convergence has also been more obvious in recent years.
In summary, there is a significant σ convergence trend in the northeastern and southern forest regions during the period, indicating that the differences in the sustainable innovation level of the wood industry in these two regions show a narrowing trend, which is basically consistent with the results of the kernel density estimation and the results of the Dagum Gini coefficient analysis.

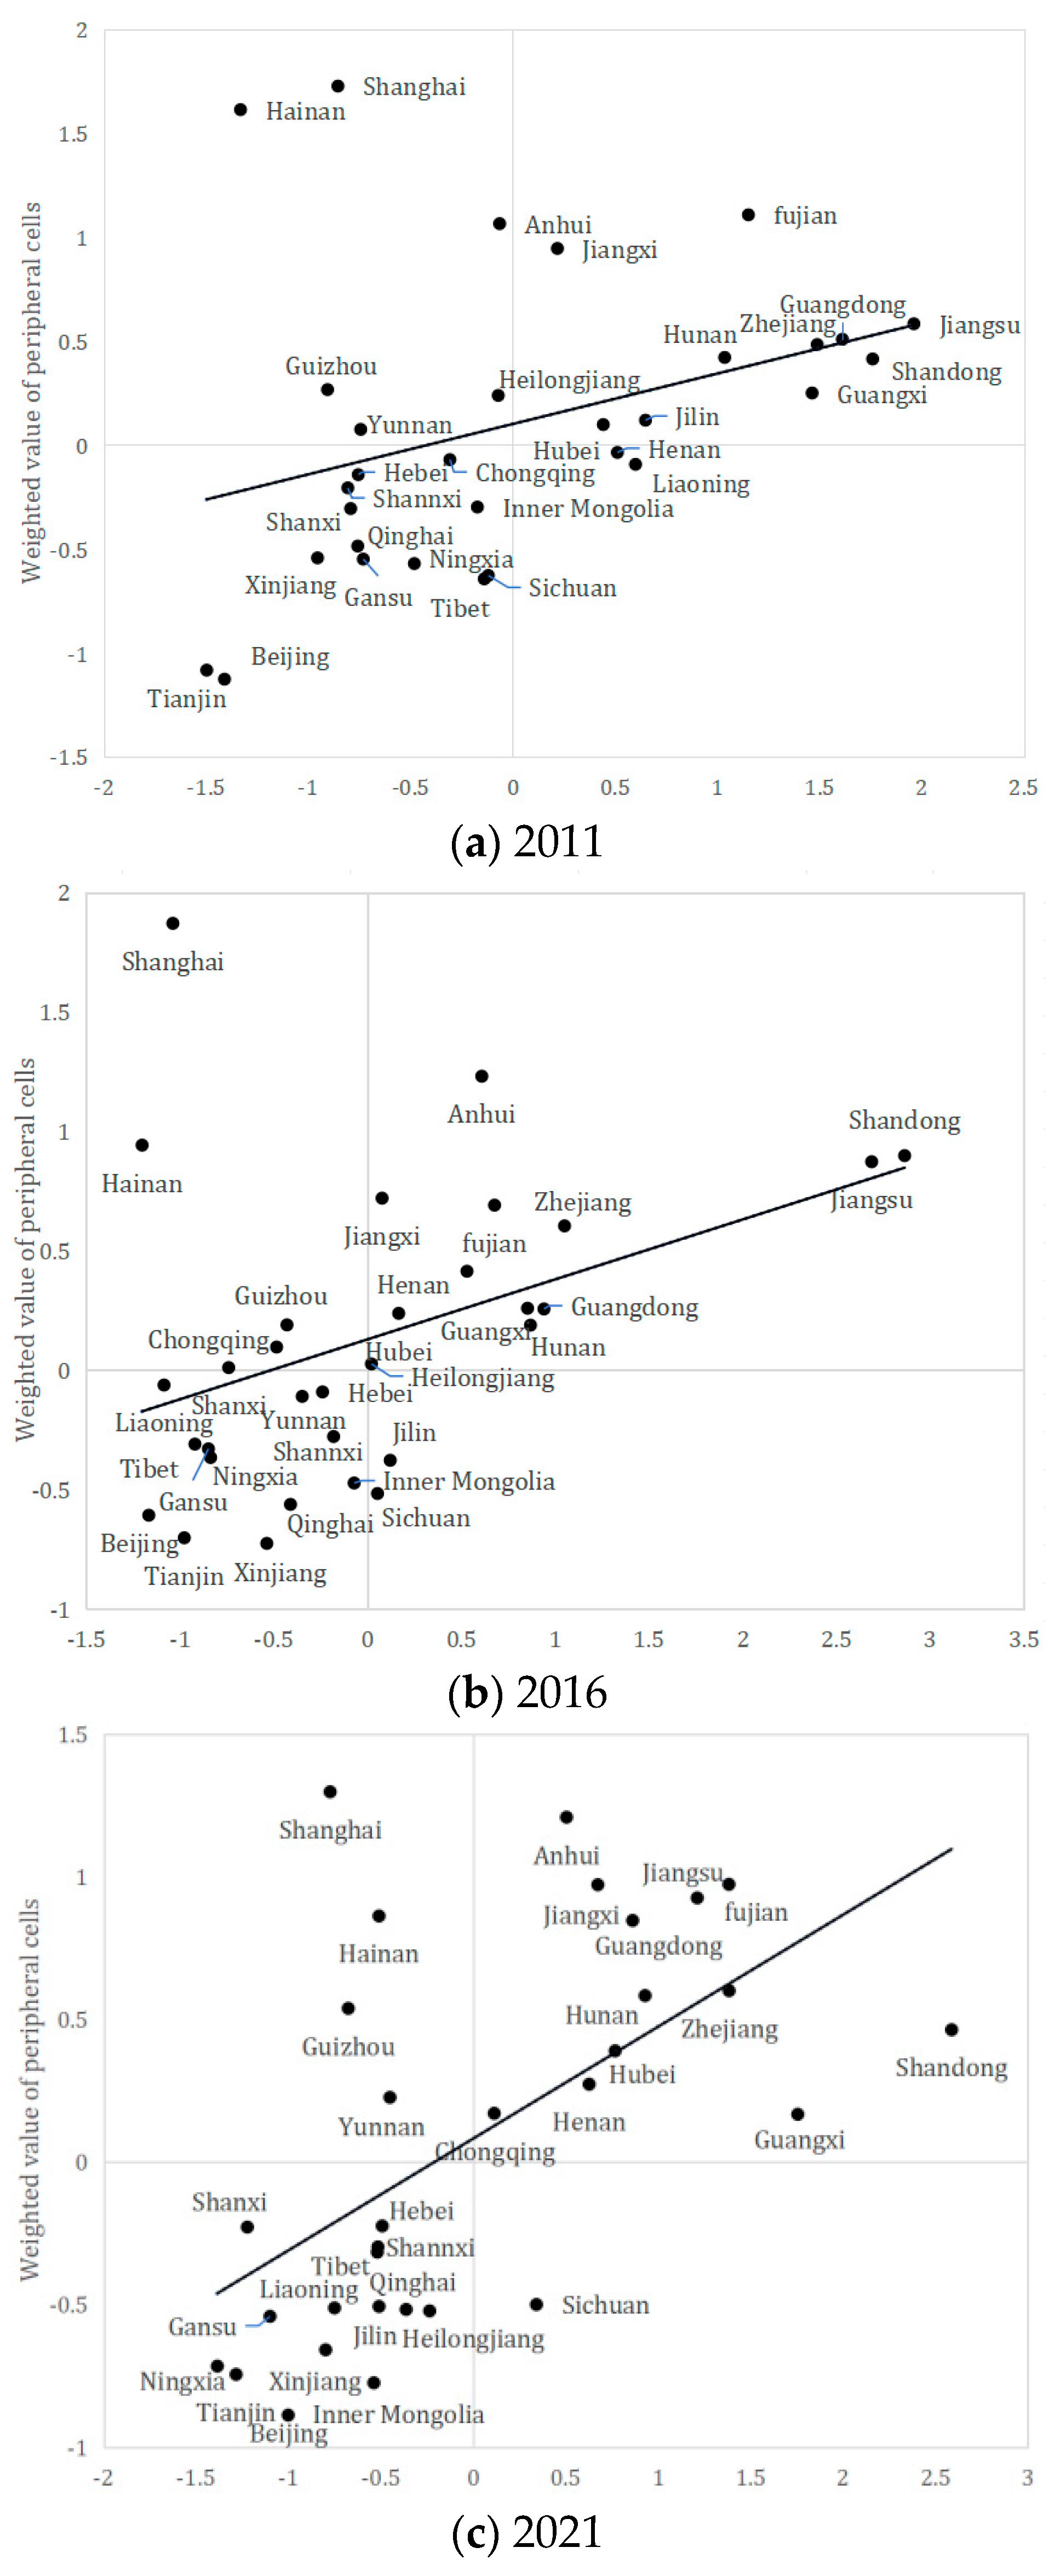
4.5.2. Spatial Correlation Analysis

  • Global Moran’s I
The Global Moran’s I test results based on the geographic distance matrix and neighbor matrix are as shown in Table 9. The results show that the Global Moran’s I for each year is positive, and all of them passed the 10% level of significance test, indicating that there is a certain positive correlation between the SII of China’s wood industry at the spatial level. In terms of time trend, the Global Moran’s I gradually rises in fluctuation, indicating that its spatial correlation is fluctuating and rising.
2.
Local Moran’s I
In order to visualize the SII of the wood industry in each sample and its relationship with neighboring provinces, a scatter plot of Local Moran’s I is drawn based on the results of Equation (22), which reveals the spatial clustering of SII of the wood industry in each province, as shown in Figure 4.
Observation shows that most of the provinces in China are in the H-H quadrant and L-L quadrant with positive spatial correlation, no matter based on the geographic distance matrix or the adjacency matrix. This indicates that there is a high-high agglomeration or low-low agglomeration pattern of sustainable innovation in China.

4.5.3. Trend of β Convergence

  • Absolute β convergence analysis
The absolute β convergence test results of the SII of China’s wood industry are shown in Table 10. It can be found that: (1) Overall, there is an obvious trend of absolute β convergence in the whole country and the four forest regions. The northern forest region with a relatively low development level has a higher convergence speed. (2) From the positive and negative convergence coefficients, the absolute β convergence coefficients of the whole country and the four forest regions are negative and pass the significance test at the 1% level. That is to say, under the assumption that the factor endowment levels of the wood industry are exactly the same everywhere, it means that sustainable innovation in the whole country and the four regions will converge to the same level as time goes by. (3) From the absolute value of the convergence coefficient, the southern forest area (0.7998) > northern forest area (0.7805) > countrywide (0.6024) > southwestern forest area (0.5855) > northeastern forest area (0.3003). The southern and northern forest areas have the fastest rate of convergence, which is higher than the national average, followed by the southwestern forest area. The convergence rate of the northern forest area is the slowest. (4) The coefficient of the northern forest region and the ρ coefficient of the whole country are significantly positive, indicating that there is a significant positive spatial spillover effect of the SII in the northern forest region and the whole country.
2.
Conditional β convergence analysis
In order to ensure that the research conclusions are more robust and accurate, in the process of establishing the conditional β convergence model, the following seven control variables are introduced to carry out specific analyses: the output value of the wood industry, the real average price of wood product sales, the sales revenue of wood products, the sales volume of wood products, and the number of employees at the end of the year. The conditional β convergence test results of the SII are shown in Table 11.
The results in Table 11 show that the R2 and Log(L) of the conditional β convergence model are larger compared with the estimation results of the absolute β convergence model, indicating that the estimation results of the conditional β convergence model are more scientific. Overall, there is an obvious trend of conditional β convergence in the whole country and the four forest regions, and the southwest forest region has a faster convergence rate in the conditional β convergence model. This indicates that due to the regional heterogeneity of resource endowment, policy environment, industrial structure, and other factors, the main driving factors and convergence speed of SII are not the same, and the spatial imbalance phenomenon of sustainable innovation development will continue to exist in a period of time.

5. Discussion

5.1. Regional Imbalance in Sustainable Innovation Hinders Wood Industry Progress and Fair Benefit Allocation

In the process of promoting sustainable innovation in the wood industry, it is still a long way to coordinate the pace of the western development, central rise, and northeast revitalization strategies and to narrow the regional differences in the sustainable innovation level [50,51]. In recent years, many Chinese companies in the wood industry have begun to actively explore the path of sustainable innovation, including but not limited to the adoption of advanced wood processing technologies to reduce resource waste, the implementation of forest certification systems to ensure the legality and sustainability of raw material sources, and the development of environmentally friendly wood products to meet market demand for green building materials [52]. For example, by introducing intelligent production lines, some enterprises have realized accurate management of the whole process from raw material procurement to product manufacturing, significantly improving resource efficiency and product quality [53]. At the same time, some enterprises also actively participate in certification systems such as the International Forest Stewardship Council (FSC) as an important means to enhance brand image and market competitiveness [54].
However, the geographical distribution of these positive innovative activities and sustainable practices shows a significant imbalance. In the western region, despite its rich forest resources, the wood industry’s technological innovation and sustainable development capabilities are relatively weak due to poor infrastructure and brain drain [55]. In contrast, the eastern coastal region, with its strong economic strength and technological accumulation, has achieved more significant results in the green transformation of the wood industry. Although the central and northeastern regions are also gradually promoting industrial upgrading, they still face many challenges in sustainable innovation, such as low conversion rates of technological innovation results and insufficient financial support, which further exacerbate the development differences between regions [56].
This inter-regional imbalance in the level of sustainable innovation not only restricts the pace of development of the wood industry as a whole in the direction of greener and more efficient, but also leads to an unfair distribution of benefits. The western region, as a resource exporter, often fails to fully enjoy the economic benefits of value-added resource processing, while the eastern coastal regions occupy the high-end position of the industrial chain by virtue of technological advantages and market advantages. In the long term, this will be detrimental to the coordinated development of the regional economy and social stability.

5.2. Differential Impact of Regional Differences on β Convergence of Wood Industry Conditions and Sustainable Innovation

First of all, from the β convergence coefficient, the β convergence coefficient of the whole country and the four major forest regions is less than 0 and passes the significance test at the 1% level. The results indicate that no matter whether it is at the national or regional level, the growth rate of the SII is in a negative relationship with the initial value, which shows obvious conditional β convergence. There is a clear catching-up effect among the provinces, which has laid a foundation for the realization of the wood industry’s sustainability innovation leapfrog development. Notably, the types of wood prevalent in these regions vary significantly, influencing both the raw material base and the sustainability strategies adopted [57]. For instance, the tropical hardwood species abundant in the southern forestry region contrast with the boreal softwoods of the northern forestry region, impacting resource availability, processing techniques, and market niches [58].
From the absolute value of the β convergence coefficient, southwest forestry region (15.27%) > southern forestry region (14.30%) > northern forestry region (12.45%) > countrywide (8.92%) > northeast forestry region (5.04%). This indicates that the southwest forestry region and southern forestry region have the fastest rate of convergence, potentially due to the rich diversity and high-value tropical woods available in these areas, which facilitate rapid technological adaptation and market responsiveness [59]. The southern forestry region, with its diverse wood species suitable for both traditional and modern applications, follows closely. Conversely, the northeast forestry region, reliant mainly on slower-growing coniferous species, exhibits the slowest convergence rate [60]. The specific wood types available in each region influence not only production processes but also the trajectory of sustainability innovations. The southwest forest region has a faster rate of convergence after taking into account the control variables, indicating that the above control variables are indeed important driving factors for sustainable innovation in the wood industry. Additionally, the speed of convergence in the northeast forest region is accelerated, which means that the realization has the basic conditions for leapfrog development.
Second, the conditional β convergence of regions is significantly affected by the control variables. (1) Higher wood industry output value usually implies that the region’s wood industry has stronger economic strength and resource base, which, combined with locally available wood species, helps to promote technological innovation and industrial upgrading tailored to those species. (2) The sales price is an important factor reflecting the market supply-demand relationship and the competitiveness of the industry. Higher sales prices may imply that the region’s wood products have higher added value and market recognition, which can help stimulate enterprises to carry out more innovative activities to enhance product competitiveness. (3) Sales revenue directly reflects the economic efficiency and market performance of enterprises. Higher sales revenue can provide enterprises with more financial support for R&D investment, talent introduction, and technology upgrading, thus promoting the development of sustainable innovation. (4) Larger sales volume means strong market demand, which can help stimulate the innovation drive of enterprises to promote product upgrading and market expansion. (5) A larger number of employees means that the region’s wood industry has a richer talent pool and stronger innovation capacity. At the same time, the gathering and mobility of talents also help knowledge overflow and technology diffusion, promoting the innovation level of the whole industry.

6. Conclusions and Recommendations

6.1. Conclusions

Based on the comprehensive understanding of the concept of sustainable innovation in the wood industry, this paper constructs a specific evaluation index system from five dimensions: factor support sustainability, industrial benefits sustainability, innovative research and development sustainability, application promotion sustainability, and international cooperation sustainability, and measures the SII of the wood industry by using the PP method. The kernel density estimation method is used to analyze the actual distribution dynamics of the SII, the Dagum Gini coefficient is used to reveal the regional differences and their sources, and the spatial convergence characteristics are examined with the spatial measurement. The main conclusions of the study are as follows:
First, during the study period, the overall SII of the national wood industry has decreased, and the imbalance between regions has become more obvious. Specifically, the SII of the wood industry in the southern forestry region is much higher than that in the other three regions, followed by the southwest forestry region, and lagging behind in the northern forestry region and the northeast forestry region. In addition, the upward trend of the southern forestry region and southwest forestry region against the trend is gradually highlighted, especially since the southwest forestry region has a strong late-mover advantage.
Secondly, the SII of the wood industry in each region of China shows significant heterogeneous characteristics. The Gini coefficients of the northeast forestry region and the southern forestry region show a downward trend, and the Gini coefficient values of the northern forestry region and the southwest forestry region have increased. The Gini coefficients of the northern forest region and the southern forest region are higher than those of other regions, which fully demonstrates that there is significant regional heterogeneity in the sustainable innovation of China’s wood industry and that this difference is being strengthened year by year. The inter-regional differences of SII show a certain tendency to strengthen over time, which is the main source of regional differences.
Thirdly, the SII of China’s wood industry shows certain global positive correlation characteristics at the spatial level, which is manifested in the H-H and L-L spatial clustering effects, but with a weak decreasing trend. During the study period, the magnitude of deviation from the average level in the northeastern forest area and southern forest area decreased significantly over time, and there was a significant σ convergence trend. Under the premise of controlling other factors unchanged, the convergence speeds of the whole country, northeast forestry region, southwest forestry region, and south forestry region all show an upward trend, indicating that the sustainability innovation index of the wood industry has an obvious “catching-up effect”. It is necessary to explore appropriate and differentiated ideas for leapfrogging based on spatial nonequilibrium patterns and convergence trends, taking into account the economic and social conditions of the wood industry in each region and province. Thus, regional disparities can be further reduced in the process of promoting regional coordinated development strategies.

6.2. Policy Recommendations

Based on the above research conclusions, the following policy recommendations are put forward in response to the problems existing in the sustainable innovation of the wood industry:
  • Strengthen the innovation leadership of advantageous forest areas and deepen cooperation and exchange
Given that the SII of the wood industry in the southern forest region significantly surpasses that of other regions, it is imperative to capitalize on this advantageous position. Enhanced support for innovation, research, and development in the region’s wood industry is crucial for promoting further industrial technology upgrading and transformation. We should encourage the wood industry in the Southern Forestry Region to forge stronger ties and exchanges with leading domestic and international enterprises. This collaboration will facilitate the introduction of cutting-edge technology and management expertise, thereby bolstering the overall competitiveness and sustainable development capabilities of the wood industry. Moreover, regarding the financial performance of the wood industry in the southern forest area, it is essential to further refine the industrial structure, enhance production efficiency, and reduce production costs. By achieving these objectives, we can strike a balance between economic and ecological benefits, ensuring a win-win scenario for both.
2.
Strengthen the support of elements to enhance the overall efficiency of the industry
Given the strong late-mover advantage demonstrated by the SII (Standardized Innovation Index) of the wood industry in the southwest forest area, it is imperative to intensify investments in this regional wood industry. Enhancing talent training and technology research and development efforts will be crucial in promoting the rapid development of the industry. We should encourage the wood industry in the southwest forest region to capitalize on its regional characteristics and develop innovative products with strong market competitiveness. Expanding domestic and international markets will further boost the industry’s overall efficiency.
Additionally, it is essential to strengthen the integration and collaboration of the wood industry in the southwest forest region with other industries. By fostering industrial chain synergies, we can enhance the overall value-added and sustainable development capability of the wood industry. This integrated approach will not only accelerate the growth of the wood industry but also contribute to the economic diversification and resilience of the region. By leveraging its late-mover advantage, the southwest forest area’s wood industry has the potential to become a significant contributor to the region’s economic prosperity and environmental sustainability.
3.
Increase support to promote the rapid development of backward forest areas
Given the current relatively backward status of the wood industry’s SII in the northern forest area, targeted policy measures must be crafted to bolster support for the region’s wood industry and elevate its overall level. It is essential to strengthen technological innovation within the wood industry in the northern forest region, introducing and nurturing a cadre of high-caliber technical talents. Moreover, we must encourage the wood industry in the northern forest region to forge stronger ties and exchanges with other regions. Learning from advanced experiences will promote the synergistic development of the industry.
In response to the notable deviation of the SII magnitude in the northeastern forest region from the average level over time, it is crucial to consolidate the development trend and maintain a stable level of innovation. Furthermore, financial management and cost control must be strengthened in the wood industry of the northeast forest region to improve economic efficiency and safeguard sustainable development. We should also encourage the wood industry in the northeast forest region to actively engage in international market competition, expand its international market presence, and enhance the international influence of the wood industry.
In addition, in order to improve the overall SII of China’s wood industry, policy synergy and resource integration should be strengthened nationwide to promote the balanced development of the wood industry in various regions. At the same time, a perfect monitoring and evaluation system should be established to measure and analyze the SII of the wood industry on a regular basis, so as to provide a scientific basis for policy-making.

Author Contributions

M.Z.: Methodology, Software, Validation, Formal analysis, Investigation, Data Curation, Writing—Original Draft, Visualization. Y.M.: Writing—Original Draft, Visualization. W.L.: Methodology, Data Curation, Original Draft. N.M.: Writing—Review and Editing, Supervision, Project administration, Funding acquisition. All authors have read and agreed to the published version of the manuscript.

Funding

This work by Mengwan Zhang was supported by Beijing Forestry University of China and was supported by the Fundamental Research Funds for the Central Universities (no. 2021SRZ05) and Beijing Social Science Foundation Planning Project (no. 21GLB036).

Data Availability Statement

Data will be made available on request.

Conflicts of Interest

The authors declare that they have no known competing financial interests or personal relationships that could have appeared to influence the work reported in this paper.

References

  1. Dahlander, L.; Gann, D.M.; Wallin, M.W. How open is innovation? A retrospective and ideas forward. Res. Policy 2021, 50, 104218. [Google Scholar] [CrossRef]
  2. Cui, R.; Song, H.; Li, D. Global value chain embeddedness, technology spillover and enterprise innovation. Int. Rev. Econ. Financ. 2024, 93, 758–771. [Google Scholar] [CrossRef]
  3. Fabrizio, K.R.; Poczter, S.; Zelner, B.A. Does innovation policy attract international competition? Evidence from energy storage. Res. Policy 2017, 46, 1106–1117. [Google Scholar] [CrossRef]
  4. Liu, Y.; Zhao, X.; Kong, F. The dynamic impact of digital economy on the green development of traditional manufacturing industry: Evidence from China. Econ. Anal. Policy 2023, 80, 143–160. [Google Scholar] [CrossRef]
  5. Liu, H.; Zhao, H.; Li, S. Future social change of manufacturing and service industries: Service-oriented manufacturing under the integration of innovation-flows drive. Technol. Forecast. Soc. Chang. 2023, 196, 122808. [Google Scholar] [CrossRef]
  6. Zhang, Q.; Li, Y.; Yu, C.; Qi, J.; Yang, C.; Cheng, B.; Liang, S. Global timber harvest footprints of nations and virtual timber trade flows. J. Clean. Prod. 2020, 250, 119503. [Google Scholar] [CrossRef]
  7. Chen, C.; Duan, C.; Li, J.; Liu, Y.; Ma, X.; Zheng, L.; Stavik, J.; Ni, Y. Cellulose (dissolving pulp) manufacturing processes and properties: A mini-review. BioResources 2016, 11, 5553–5564. [Google Scholar] [CrossRef]
  8. Hasan, S.S.; Zhang, Y.; Chu, X.; Teng, Y. The role of big data in China’s sustainable forest management. For. Econ. Rev. 2019, 1, 96–105. [Google Scholar] [CrossRef]
  9. Calik, E.; Bardudeen, F. A measurement scale to evaluate sustainable innovation performance in manufacturing organizations. Procedia CIRP 2016, 40, 449–454. [Google Scholar] [CrossRef]
  10. Alfranca, O.; Voces, R.; Herruzo, A.C.; Diaz-Balteiro, L. Effects of innovation on the European wood industry market structure. For. Policy Econ. 2014, 40, 40–47. [Google Scholar] [CrossRef]
  11. Ng, B.; Thiruchelvam, K. The dynamics of innovation in Malaysia’s wooden furniture industry: Innovation actors and linkages. For. Policy Econ. 2012, 14, 107–118. [Google Scholar] [CrossRef]
  12. Molinaro, M.; Orzes, G. From forest to finished products: The contribution of Industry 4.0 technologies to the wood sector. Comput. Ind. 2022, 138, 103637. [Google Scholar] [CrossRef]
  13. Purkus, A.; Hagemann, N.; Bedtke, N.; Gawel, E. Towards a sustainable innovation system for the German wood-based bioeconomy: Implications for policy design. J. Clean. Prod. 2018, 172, 3955–3968. [Google Scholar] [CrossRef]
  14. Li, N.; Toppinen, A.; Lantta, M. Managerial perceptions of SMEs in the wood industry supply chain on corporate responsibility and competitive advantage: Evidence from China and Finland. J. Small Bus. Manag. 2016, 54, 162–186. [Google Scholar] [CrossRef]
  15. Tao, C.; Gao, Z.; Cheng, B.; Chen, F.; Yu, C. Enhancing wood resource efficiency through spatial agglomeration: Insights from China’s wood-processing industry. Resour. Conserv. Recycl. 2024, 203, 107453. [Google Scholar] [CrossRef]
  16. Degler, T.; Agarwal, N.; Nylund, P.A.; Brem, A. Sustainable innovation types: A bibliometric review. Int. J. Innov. Manag. 2021, 25, 2150096. [Google Scholar] [CrossRef]
  17. Shakeel, J.; Mardani, A.; Chofreh, A.G.; Goni, F.A.; Klemeš, J.J. Anatomy of sustainable business model innovation. J. Clean. Prod. 2020, 261, 121201. [Google Scholar] [CrossRef]
  18. Ruggerio, C.A. Sustainability and sustainable development: A review of principles and definitions. Sci. Total Environ. 2021, 786, 147481. [Google Scholar] [CrossRef]
  19. Silvestre, B.S.; Ţîrcă, D.M. Innovations for sustainable development: Moving toward a sustainable future. J. Clean. Prod. 2019, 208, 325–332. [Google Scholar] [CrossRef]
  20. Zeng, D.; Hu, J.; Ouyang, T. Managing innovation paradox in the sustainable innovation ecosystem: A case study of ambidextrous capability in a focal firm. Sustainability 2017, 9, 2091. [Google Scholar] [CrossRef]
  21. Ilic, S.; Petrovic, T.; Djukic, G. Eco-innovation and sustainable development. Probl. Ekorozwoju 2022, 17, 197–203. [Google Scholar] [CrossRef]
  22. Bakhtina, V.A. Innovation and its potential in the context of the ecological component of sustainable development. Sustain. Account. Manag. Policy J. 2011, 2, 248–262. [Google Scholar]
  23. Dyck, B.; Silvestre, B.S. Enhancing socio-ecological value creation through sustainable innovation 2.0: Moving away from maximizing financial value capture. J. Clean. Prod. 2018, 171, 1593–1604. [Google Scholar] [CrossRef]
  24. Zhang, Z.; Li, L.; Zhang, H. A sustainable innovation strategy oriented toward complex product Servitization. Sustainability 2022, 14, 4290. [Google Scholar] [CrossRef]
  25. Escobar, A.; Luna, J.; Caraballo, A. Barriers to sustainable green innovation in meeting the challenges of the global economy of firms. Glob. J. Environ. Sci. Manag. 2023, 9, 219–232. [Google Scholar]
  26. Hermundsdottir, F.; Aspelund, A. Competitive sustainable manufacturing-Sustainability strategies, environmental and social innovations, and their effects on firm performance. J. Clean. Prod. 2022, 370, 133474. [Google Scholar] [CrossRef]
  27. Schaltegger, S.; Wagner, M. Sustainable entrepreneurship and sustainability innovation: Categories and interactions. Bus. Strategy Environ. 2011, 20, 222–237. [Google Scholar] [CrossRef]
  28. Johnsson, S.; Andersson, E.; Thollander, P.; Karlsson, M. Energy savings and greenhouse gas mitigation potential in the Swedish wood industry. Energy 2019, 187, 115919. [Google Scholar] [CrossRef]
  29. Zhan, W.; Yang, Z.; Xu, H.; Xue, S.; Lin, J.; Guan, X. Exploring the potential of StyleGAN for modeling high-quality and diverse digital wood textures: Towards advancements in the wood industry. Ind. Crops Prod. 2024, 209, 117880. [Google Scholar] [CrossRef]
  30. Evans, S.; Vladimirova, D.; Holgado, M.; Van Fossen, K.; Yang, M.; Silva, E.A.; Barlow, C.Y. Business model innovation for sustainability: Towards a unified perspective for creation of sustainable business models. Bus. Strategy Environ. 2017, 26, 597–608. [Google Scholar] [CrossRef]
  31. Stojčić, N.; Anić, I.; Aralica, Z. Do firms in clusters perform better? Lessons from wood-processing industries in new EU member states. For. Policy Econ. 2019, 109, 102043. [Google Scholar] [CrossRef]
  32. Scordato, L.; Klitkou, A.; Tartiu, V.E.; Coenen, L. Policy mixes for the sustainability transition of the pulp and paper industry in Sweden. J. Clean. Prod. 2018, 183, 1216–1227. [Google Scholar] [CrossRef]
  33. Schulte, M.; Jonsson, R.; Eggers, J.; Hammar, T.; Stendahl, J.; Hansson, P. Demand-driven climate change mitigation and trade-offs from wood product substitution: The case of Swedish multi-family housing construction. J. Clean. Prod. 2023, 421, 138487. [Google Scholar] [CrossRef]
  34. Khoaele, K.K.; Gbadeyan, O.J.; Chunilall, V.; Sithole, B. A review on waste wood reinforced polymer composites and their processing for construction materials. Int. J. Sustain. Eng. 2023, 16, 104–116. [Google Scholar] [CrossRef]
  35. Zanchini, R.; Blanc, S.; Pippinato, L.; Poratelli, F.; Bruzzese, S.; Brun, F. Enhancing wood products through ENplus, FSC and PEFC certifications: Which attributes do consumers value the most? For. Policy Econ. 2022, 142, 102782. [Google Scholar] [CrossRef]
  36. Vergarechea, M.; Astrup, R.; Fischer, C.; Øistad, K.; Blattert, C.; Hartikainen, M.; Eyvindson, K.; Di Fulvio, F.; Forsell, N.; Burgas, D. Future wood demands and ecosystem services trade-offs: A policy analysis in Norway. For. Policy Econ. 2023, 147, 102899. [Google Scholar] [CrossRef]
  37. Cai, Z.; Aguilar, F.X. Consumer stated purchasing preferences and corporate social responsibility in the wood products industry: A conjoint analysis in the US and China. Ecol. Econ. 2013, 95, 118–127. [Google Scholar] [CrossRef]
  38. Sachs, J.D. The Age of Sustainable Development; Columbia University Press: New York, NY, USA, 2015; ISBN 0231173148. [Google Scholar]
  39. Khorshidi, K.; Choukolaei, H.A.; Ghasemi, P. Sustainable solutions for the wood and paper industry: A comprehensive assessment of the rural environment impact. J. Eng. Res. 2023, in press. [Google Scholar] [CrossRef]
  40. Nijnik, M.; Nijnik, A.; Sarkki, S.; Muñoz-Rojas, J.; Miller, D.; Kopiy, S. Is forest related decision-making in European treeline areas socially innovative? A Q-methodology enquiry into the perspectives of international experts. For. Policy Econ. 2018, 92, 210–219. [Google Scholar] [CrossRef]
  41. Ziemnowicz, C.; Joseph, A. Schumpeter and innovation. In Encyclopedia of Creativity, Invention, Innovation and Entrepreneurship; Springer: Berlin/Heidelberg, Germany, 2020; pp. 1517–1522. [Google Scholar]
  42. Moore, J.E.; Mascarenhas, A.; Bain, J.; Straus, S.E. Developing a comprehensive definition of sustainability. Implement. Sci. 2017, 12, 110. [Google Scholar] [CrossRef]
  43. Domljan, I.; Domljan, V. Enterprise-based Support to Innovative Activities. In International Conference “New Technologies, Development and Applications; Springer: Cham, Switzerland, 2021; pp. 1166–1172. [Google Scholar]
  44. Le, T.T.; Vo, X.V.; Venkatesh, V.G. Role of green innovation and supply chain management in driving sustainable corporate performance. J. Clean. Prod. 2022, 374, 133875. [Google Scholar] [CrossRef]
  45. Zhang, F.; Zhu, L. Enhancing corporate sustainable development: Stakeholder pressures, organizational learning, and green innovation. Bus. Strategy Environ. 2019, 28, 1012–1026. [Google Scholar] [CrossRef]
  46. Wang, W.; Feng, Y.J.; Chen, W.F.; Li, F.L. An Evaluation Method of Water Resources Carrying Capacity Based on Projection Pursuit Model. Adv. Mater. Res. 2013, 652, 1710–1716. [Google Scholar] [CrossRef]
  47. Ge, M.; Lin, H. Evaluation of China’s regional innovation capability based on simulated annealing projection pursuit model and nested fuzzy evaluation model. Expert Syst. 2023, 40, e13179. [Google Scholar] [CrossRef]
  48. Anselin, L.; Rey, S. Properties of tests for spatial dependence in linear regression models. Geogr. Anal. 1991, 23, 112–131. [Google Scholar] [CrossRef]
  49. Xue, L.; Luo, X.; Wu, X. Carbon sequestration efficiency in four major forest regions in China: Measurement, drivers and convergence. J. Nat. Resour. 2016, 31, 1351–1363. (In Chinese) [Google Scholar]
  50. Zheng, C.; Deng, F.; Li, C.; Yang, Z. The impact of China’s western development strategy on energy conservation and emission reduction. Environ. Impact Assess. Rev. 2022, 94, 106743. [Google Scholar] [CrossRef]
  51. Ren, W.; Xue, B.; Yang, J.; Lu, C. Effects of the Northeast China revitalization strategy on regional economic growth and social development. Chin. Geogr. Sci. 2020, 30, 791–809. [Google Scholar] [CrossRef]
  52. Wan, M.; Lähtinen, K.; Toppinen, A. Strategic transformation in the value-added wood products companies: Case study evidence from China. Int. J. Emerg. Mark. 2015, 10, 224–242. [Google Scholar] [CrossRef]
  53. Luo, Y.; Chen, Y.; Tao, C.; Yang, C.; Xiang, F.; Xu, C.; Lin, F. The Impact of the Digital Economy on Supply Chain Security: Evidence from China’s Wooden Furniture Industry. Forests 2024, 15, 879. [Google Scholar] [CrossRef]
  54. Tan, Q.; Imamura, K.; Nagasaka, K.; Inoue, M. Consumer price premiums for FSC-labeled wood flooring: A comparison of five Chinese cities. BioProducts Bus. 2020, 5, 13–24. [Google Scholar]
  55. Barbu, M.C.; Tudor, E.M. State of the art of the Chinese forestry, wood industry and its markets. Wood Mater. Sci. Eng. 2022, 17, 1030–1039. [Google Scholar] [CrossRef]
  56. Zhang, M.; Song, G.; Ma, N. A mechanism for upgrading the global value chain of China’s wood industries based on sustainable green growth. J. Clean. Prod. 2024, 449, 141717. [Google Scholar] [CrossRef]
  57. Schubert, M.; Panzarasa, G.; Burgert, I. Sustainability in wood products: A new perspective for handling natural diversity. Chem. Rev. 2022, 123, 1889–1924. [Google Scholar] [CrossRef]
  58. Dong, X.; Gan, W.; Shang, Y.; Tang, J.; Wang, Y.; Cao, Z.; Xie, Y.; Liu, J.; Bai, L.; Li, J. Low-value wood for sustainable high-performance structural materials. Nat. Sustain. 2022, 5, 628–635. [Google Scholar] [CrossRef]
  59. Mi, X.; Feng, G.; Hu, Y.; Zhang, J.; Chen, L.; Corlett, R.T.; Hughes, A.C.; Pimm, S.; Schmid, B.; Shi, S. The global significance of biodiversity science in China: An overview. Natl. Sci. Rev. 2021, 8, b32. [Google Scholar] [CrossRef]
  60. Chen, N.; Qin, F.; Zhai, Y.; Cao, H.; Zhang, R.; Cao, F. Evaluation of coordinated development of forestry management efficiency and forest ecological security: A spatiotemporal empirical study based on China’s provinces. J. Clean. Prod. 2020, 260, 121042. [Google Scholar] [CrossRef]
Figure 1. Internal logic of sustainable innovation.
Forests 15 02168 g001
Figure 2. Distribution dynamics of the sustainable innovation index in China’s overall wood industry.
Forests 15 02168 g002
Figure 3. Distribution dynamics of the sustainable innovation index of the wood industry in four regions of China.
Forests 15 02168 g003
Figure 4. Local Moran’s I Scatter of sustainable innovation index of China’s Wood Industry, 2011, 2016, 2021.
Forests 15 02168 g004
Table 1. Indicator system for evaluating the level of sustainability and innovation in the wood industry.
First Level IndicatorsSecond Level IndicatorsThird Level IndicatorsType
Sustainable innovation levelFactors support sustainabilityNumber of enterprise unitsPositive
Fixed assets investmentPositive
Average number of employeesPositive
Industrial benefits sustainabilityNet profit marginPositive
Asset liability ratioPositive
Total asset contribution ratePositive
Operating revenue realized per 100 CNY of assetsPositive
Current asset turnover ratePositive
Operating costs per 100 CNY of operating revenueNegative
Operating revenue profit marginPositive
Average wagePositive
Carbon emissionsNegative
Innovative research
and development sustainability
Technology funding investmentPositive
Number of R&D in science and technologyPositive
Number of research institutionsPositive
Application promotion
sustainability
Sales expense ratioPositive
Administrative/management expense ratioPositive
Number of key forestry leading enterprisesPositive
Industrial agglomeration levelPositive
International cooperation sustainabilityCustoms export valuePositive
Foreign capital dependenceInterval
Table 2. Division of forest areas in China.
RegionProvince
Northern Forest RegionBeijing, Tianjin, Hebei, Shanxi, Shandong, Henan, Shaanxi, Gansu, Qinghai, Ningxia, Xinjiang
Northeast Forest RegionInner Mongolia, Liaoning, Jilin, Heilongjiang
Southwest Forest RegionSichuan, Yunnan, Tibet
Southern Forest RegionShanghai, Jiangsu, Zhejiang, Fujian, Anhui, Jiangxi, Hubei, Hunan, Guangdong, Guangxi, Hainan, Guizhou
Table 3. Sustainable innovation index for the wood industry in China as a whole and in four regions, 2011–2021.
Region20112012201320142015201620172018201920202021
Northern Forest Region1.1650.9290.9620.8491.1091.0490.8890.9280.8290.8550.841
Northeast Forest Region1.5301.4041.2441.2511.0371.0370.7440.6840.6560.6390.814
Southwest Forest Region1.2630.9641.0330.8351.0210.9460.7170.9010.8541.0330.990
Southern Forest Region1.6531.3241.3411.1121.3091.4041.2721.3611.2661.3401.341
Countrywide1.4141.1481.1541.0011.1661.1710.9961.0610.9791.0381.050
Table 4. Regional distribution of four levels of sustainable innovation in China’s wood industry.
LevelSouthern Forest RegionNorthern Forest RegionNortheast Forest RegionSouthwest Forest Region
high levelJiangsu, Zhejiang, Fujian, Hunan, Guangdong, GuangxiShandong, Henan
medium-high levelAnhui, Jiangxi, Hubei JilinSichuan
medium-low level Hebei, Shaanxi, QinghaiInner Mongolia, HeilongjiangChongqing
low levelShanghai, Hainan, GuizhouBeijing, Tianjin, Shanxi, Gansu, Ningxia, XinjiangLiaoningYunnan, Tibet
Table 5. Overall Gini coefficient and intraregional Gini coefficient of the sustainable innovation index of China’s wood industry, 2011–2021.
Gini Coefficient20112012201320142015201620172018201920202021Average
Countrywide0.181 0.220 0.216 0.229 0.195 0.236 0.270 0.282 0.258 0.272 0.241 0.236
Northern Forest Region0.168 0.208 0.254 0.281 0.212 0.248 0.234 0.294 0.258 0.303 0.290 0.250
Northeast Forest Region0.059 0.098 0.037 0.044 0.132 0.119 0.190 0.133 0.093 0.094 0.056 0.096
Southwest Forest Region0.047 0.076 0.044 0.030 0.073 0.107 0.161 0.127 0.152 0.065 0.092 0.089
Southern Forestry Region0.168 0.208 0.207 0.210 0.182 0.203 0.231 0.209 0.179 0.201 0.154 0.195
Table 6. Inter-regional Gini coefficient of the sustainable innovation index of China’s wood industry, 2011–2021.
20112012201320142015201620172018201920202021Average
South~North interregional0.2390.2720.2770.2850.2250.2860.3030.3350.3100.3280.3240.289
South-North~East interregional0.1470.1670.1560.1520.2010.2260.3290.3750.3540.3770.2640.250
South-South~West interregional0.1900.2340.2010.2120.1990.2520.3360.2860.2700.2180.2030.237
North-North~East interregional0.1920.2530.2220.2710.1850.220.2290.2530.2120.2530.2160.228
North-South~West interregional0.1440.1690.1970.1920.1590.1960.2210.2290.2280.2480.2450.203
North-East~South-West interregional0.0980.1910.0960.1990.1170.1390.1830.1710.1880.2360.1140.157
Table 7. Results of the Dagum Gini coefficient and its source decomposition of the sustainable innovation index of China’s wood industry, 2011–2021.
YearCountrywideIntra-Regional Gini CoefficientContribution/% Inter-Regional Gini Contribution Contribution/%Hypervariance Density Gini Contribution Contribution/%
20110.1810.04926.740.08446.120.04927.13
20120.2200.06027.420.09342.460.06630.12
20130.2160.06429.600.08036.830.07333.57
20140.2290.06628.910.08336.080.08035.01
20150.1950.05930.180.05427.690.08242.13
20160.2360.06828.660.08335.030.08636.31
20170.2700.07527.700.12245.260.07327.04
20180.2820.07626.910.12544.320.08128.78
20190.2580.06525.380.12648.890.06625.73
20200.2720.07226.550.13650.100.06423.34
20210.2410.06125.260.11848.780.06325.96
Table 8. Results of the σ convergence test for sustainable innovation in China’s wood industry, 2011–2021.
RegionNorthern Forest RegionNortheastern Forest RegionSouthwestern Forest RegionSouthern Forest Region
20110.0538 0.0064 0.0043 0.0472
20120.0767 0.0157 0.0096 0.0723
20130.1062 0.0023 0.0037 0.0731
20140.1391 0.0043 0.0016 0.0733
20150.0788 0.0335 0.0089 0.0632
20160.1177 0.0344 0.0193 0.0737
20170.0993 0.0631 0.0463 0.0925
20180.1545 0.0314 0.0260 0.0877
20190.1180 0.0159 0.0410 0.0699
20200.1498 0.0150 0.0084 0.0751
20210.1510 0.0054 0.0148 0.0432
Average0.1132 0.0207 0.0167 0.0701
Table 9. Global Moran’s I and test results of sustainable innovation in China’s wood industry, 2011–2021.
YearGeographic Distance MatrixAdjacency Matrix
Moran’s IZ-Valuep-ValueMoran’s IZ-Valuep-Value
20110.0640.970 0.1780.1912.0430.041
20120.1171.425 0.0840.1531.6790.093
20130.0991.498 0.0760.1731.910.056
20140.1031.446 0.0840.1561.730.084
20150.0941.463 0.0880.181.9540.051
20160.1061.605 0.0650.2612.7310.006
20170.1191.454 0.0850.2592.6670.008
20180.1271.558 0.0750.3333.3470.000
20190.1381.853 0.0440.4043.9610.000
20200.1321.796 0.0470.3533.4950.000
20210.1171.724 0.0510.3283.3050.000
Table 10. Absolute β convergence of the sustainable innovation index for the wood industry.
ProjectCountrywideNorthern Forest RegionNortheastern Forest RegionSouthwestern Forest RegionSouthern Forest Region
Model TypeTwo-way fixed SLMTwo-way fixed SEMOLSTwo-way fixed SLMTwo-way fixed SLM
β−0.6024−0.7805−0.3003−0.5855−0.7998
θ 0.02890.0273-0.01110.0138
ρ 0.0799--−0.4813−0.1429
λ -−0.2712---
R20.37560.42380.20080.41940.5073
Log-L109.439140.6490-31.223986.6001
Spatial fixed effectYesYes-YesYes
Time fixed effectYesYes-YesYes
Hausmantest41.2581.68-84.6142.90
LM-lag46.7515.3890.3762.56118.017
R-LM-lag0.9650.0011.4671.06225.842
LM-error46.0195.4520.0445.14823.466
R-LM-error0.2330.0641.1363.64931.291
Convergence rate/%8.385313.78723.24698.005714.6210
Table 11. Conditional β convergence of sustainable innovation index for the wood industry.
ProjectCountrywideNorthern Forest RegionNortheastern Forest RegionSouthwestern Forest RegionSouthern Forest Region
Model TypeTwo-way fixed SLMTwo-way fixed SLMOLSTwo-way fixed SEMTwo-way fixed SLM
β−0.6252−0.7458−0.4256−0.8136−0.7926
θ 0.02690.0281-0.00560.01267
ρ 0.0938−0.1476---−0.2091
λ ---−0.4555262-
R20.40110.42940.70040.63720.5169
Log-L120.464139.8413-44.987291.1812
Spatial fixed effectYesYes-YesYes
Time fixed effectYesYes-YesYes
Hausmantest100.7077.76-47.85138.21
LM-lag31.7781.4732.38112.0906.613
R-LM-lag0.1205.7676.2126.4496.120
LM-error38.9004.5680.3345.89915.427
R-LM-error7.2428.8624.1640.25814.933
Convergence rate/%8.9212.455.0415.2714.30
Disclaimer/Publisher’s Note: The statements, opinions and data contained in all publications are solely those of the individual author(s) and contributor(s) and not of MDPI and/or the editor(s). MDPI and/or the editor(s) disclaim responsibility for any injury to people or property resulting from any ideas, methods, instructions or products referred to in the content.

