Article

Numerical Simulation and Bayesian Optimization CatBoost Prediction Method for Characteristic Parameters of Veneer Roller Pressing and Defibering

1
Research Institute of Wood Industry, Chinese Academy of Forestry, Beijing 100091, China
2
College of Mechanical and Electrical Engineering, Northeast Forestry University, Harbin 150006, China
*
Author to whom correspondence should be addressed.
Forests 2024, 15(12), 2173; https://doi.org/10.3390/f15122173
Submission received: 19 November 2024 / Revised: 1 December 2024 / Accepted: 4 December 2024 / Published: 10 December 2024

Abstract

:
Defibering equipment is employed in the production of scrimber for the purpose of wood veneer rolling, cutting, and directional fiber separation. However, the current defibering equipment exhibits a notable degree of automation deficiency, relying more on manual operation and empirical methods for process control, which impedes the stability of the defibering equipment and the defibering quality. This study presented an in-depth finite element analysis of the roller-pressing process for veneer defibering equipment, and a prediction method incorporating numerical simulation and ensemble learning was proposed through data collection and feature selection. The objective is to integrate this method into the intelligent decision-making system of the equipment, with the aim of improving the productivity of the equipment and effectively stabilizing the product quality. The simulation process and the analysis of the results in ABAQUS 2020 revealed that the roller gap and roller velocity of the defibering equipment, as well as the geometrical parameters of the veneer, have a significant influence on the defibering effect. Combining these factors, 702 simulation experiments were devised and executed, and a database was constructed based on the model-building parameters and simulation outcomes. The strain and stress observed in the simulation results served to represent the veneer force and veneer deformation. The CatBoost algorithm was used to establish prediction models for the key parameters of the defibering effect, and the Bayesian Optimization and 5-fold cross-validation techniques enabled the strain and stress prediction models to achieve coefficients of determination of 0.98 and 0.97 for the training and test datasets, respectively. Shapley Additive Explanation was used to provide insight into the contribution of each feature, thereby guiding the selection of feature parameters and simplifying the model. The results show that the scheme can effectively determine the core process parameters of the defibering equipment and then provide a practical control strategy for intelligent online control.

1. Introduction

Wood scrimber is a material characterized by a combination of strength and texture, formed through the use of artificial fast-growing forest timber, sandy shrubs, and other biomass materials as raw materials. The material is then subjected to directional reorganization through roller-pressing and defibering technology and subsequently glued through hot pressing [1]. Scrimber exhibits a high utilization rate of raw materials, strong dimensional stability, and the potential for the production of high-value-added products [2]. Scrimber has gradually supplanted traditional timber and become the principal material for the fabrication of an array of engineering and architectural decorative components. It is extensively utilized in furniture, decorative embellishments, architectural engineering, ground paving, and other domains [3,4]. In 1977, Australian scientist Coleman developed a scrimber manufacturing apparatus [5], and in 1989, his team constructed the world’s inaugural scrimber production line. Research on wood–bamboo scrimber has been conducted in China [6], the United States, Japan [7,8], Germany, Canada, and other countries, with the objective of establishing a pilot production line [9]. Following approximately two decades of continuous research and technological advancement, the pivotal breakthroughs in scrimber manufacturing technologies and industrialization have led to the realization of large-scale industrial production.
The process of scrimber production encompasses a range of techniques, including veneer rotary cutting, roller pressing and defibering, immersing, drying, and assembly [10]. These methods are facilitated by a variety of equipment, primarily comprising sawing, rotary cutting, defibering, soaking, drying, forming, and special treatment apparatus. Defibering equipment is employed in the production of scrimber for the purpose of wood veneer rolling, cutting, and directional fiber separation. The working principle is to use the pressure generated by the rotation of the roller and the friction between the roller and the veneer, which results in the plastic deformation, compression, and split of the wood veneer. This process occurs on the surface of the veneer, leading to the formation of a series of point or line cracks. The aim of this is to prepare the fibrotic veneer with uniform fiber thickness and no fracture in the longitudinal direction. The effect of veneer defibering on the quality of the subsequent immersing and compressing processes, and thus on the quality of the resulting scrimber, is significant [11]. Furthermore, the technical indicators and performance parameters of the pressing and defibering equipment will also affect the product quality and output of the scrimber production line, which in turn affects the efficiency and capacity of the production process.
Chinese scholars have made significant advancements in the enhancement and utilization of the mechanical configuration of defibering equipment, thereby facilitating the automation of scrimber manufacturing equipment systems [12]. In accordance with the characteristics, strength, and hardness of the wood, a variety of roller-pressing and defibering tools have been developed. Some of this machinery is equipped with lifting and adjusting devices, some have defibering rollers with different teeth heights, and some are highly adaptable and capable of continuous processing.
Despite the considerable advances made in defibering equipment technology in recent years, it remains essential to undertake manual adjustments to key technical parameters and to integrate a substantial body of empirical data with comprehensive pre-operational testing. This status quo leads to the existing defibering equipment still exhibiting shortcomings, including low process stability, defibering precision, and defibering effects, which have required further improvement. Despite some scholars having proposed PLC control systems, photoelectric sensors, machine-vision detection systems, and other means, they are lacking in terms of the optimization of equipment operation from a system-level perspective, limited by the production scale and the constraints between the intelligent upgrading of equipment and mechanical structure adjustment, and the research and application of intelligent control in the field of veneer defibering equipment has been at a standstill. The conventional approach to studying the process of veneer roller pressing and defibering under full operational conditions is not cost-effective or time-efficient, particularly when engineering requirements are taken into account.
The roll–pressing action and the performance indexes and appearance dimensions of the rolled specimens have been subjected to in-depth analysis. Adachi et al. [13] investigated the strain distribution and shear flow of fir specimens of varying sizes and moisture contents under roll pressing, employing image analysis methods. This revealed the intricate relationship between the roll–pressing action, the contact angle between the roller and the specimen, the moisture content, and the shear stress. Kocovic et al. [14] found that the compression forces generated by roll pressing significantly increased the hardness, the modulus of elasticity, and the surface quality of wood products through their own roll-pressing device.
Numerical simulation has been used in the analysis of forces in the roll-pressing process of equipment and in the analysis of the forces between the rollers and the specimens in the discussion of the rolling process [15,16]. Wu et al. [17] adopted the dynamic explicit finite element method (FEM), which integrated the microscale elastic deformation of the work roll in the rolling system with the bulk plastic deformation of the metal strip. Yang et al. [18] established the core algorithm of the dynamic rolling friction contact model by explicit FEM and demonstrated the rationality of explicit FEM in dealing with non-linear problems such as friction, material properties, arbitrary contact geometry, and boundary conditions. The numerical analysis method can be used to examine the actual working conditions of the veneer and the pressing-roller force formula; that is, the mechanical model as a load, according to the pressing-roller work boundary conditions. This is achieved through the use of an explicit dynamics numerical analysis method, which simulates the process of veneer defibration by pressing-rollers in real time and analyses the time-related changes in the veneer force conditions [19]. In order to meet the intelligent control requirements of the defibering equipment, it is essential to develop a mathematical model of the veneer defibration process. The modeling process is complex and lacks a standard derivation formula. Consequently, an “end-to-end” characteristic parameter prediction model can be constructed through ensemble learning based on the explicit element simulation results of veneer defibration. This improves the usability of parameter prediction in practical applications.
Models derived from neural networks and the decision tree theory are able to accurately capture and predict the correlations and trends between multiple factors without the need for an in-depth understanding of complex correlation mechanisms, by virtue of their ability to learn and recognize patterns in large amounts of data [20]. Consequently, these models are particularly adept at handling intricate non-linear relationships. Despite the fact that neural network models are frequently adopted due to their high fitting accuracy, they are not suitable for application scenarios that require explicit decision-making or judgment because of their high data requirements, long training time, and poor model interpretability [21]. Ensemble learning algorithms based on decision trees, such as the Random Forest and Gradient Boosting Decision Tree (GBDT) algorithms, have demonstrated efficient and accurate fitting performance, as well as strong resistance to overfitting in the context of small datasets, and have been able to intuitively obtain the feature importance ranking [22,23]. CatBoost employs a symmetric decision tree as the base learner, which is capable of efficiently and effectively handling category-based features, and exhibits excellent fitting performance and rapid training speed [24]. Apart from these, there will be several parameters where we need to optimize those parameters for several ensemble-based techniques to enhance model performance, such as Random Search, Evolutionary Algorithms, Bayesian Optimization (BO), etc. [25].
Based on the above literature analysis, this study proposes a methodology for predicting the characteristic parameters of veneer roller pressing and defibering based on numerical simulation, and ensemble learning is proposed for an algorithmic layer application of an intelligent decision-making system. The significant contributions of this article are as follows:
(1)
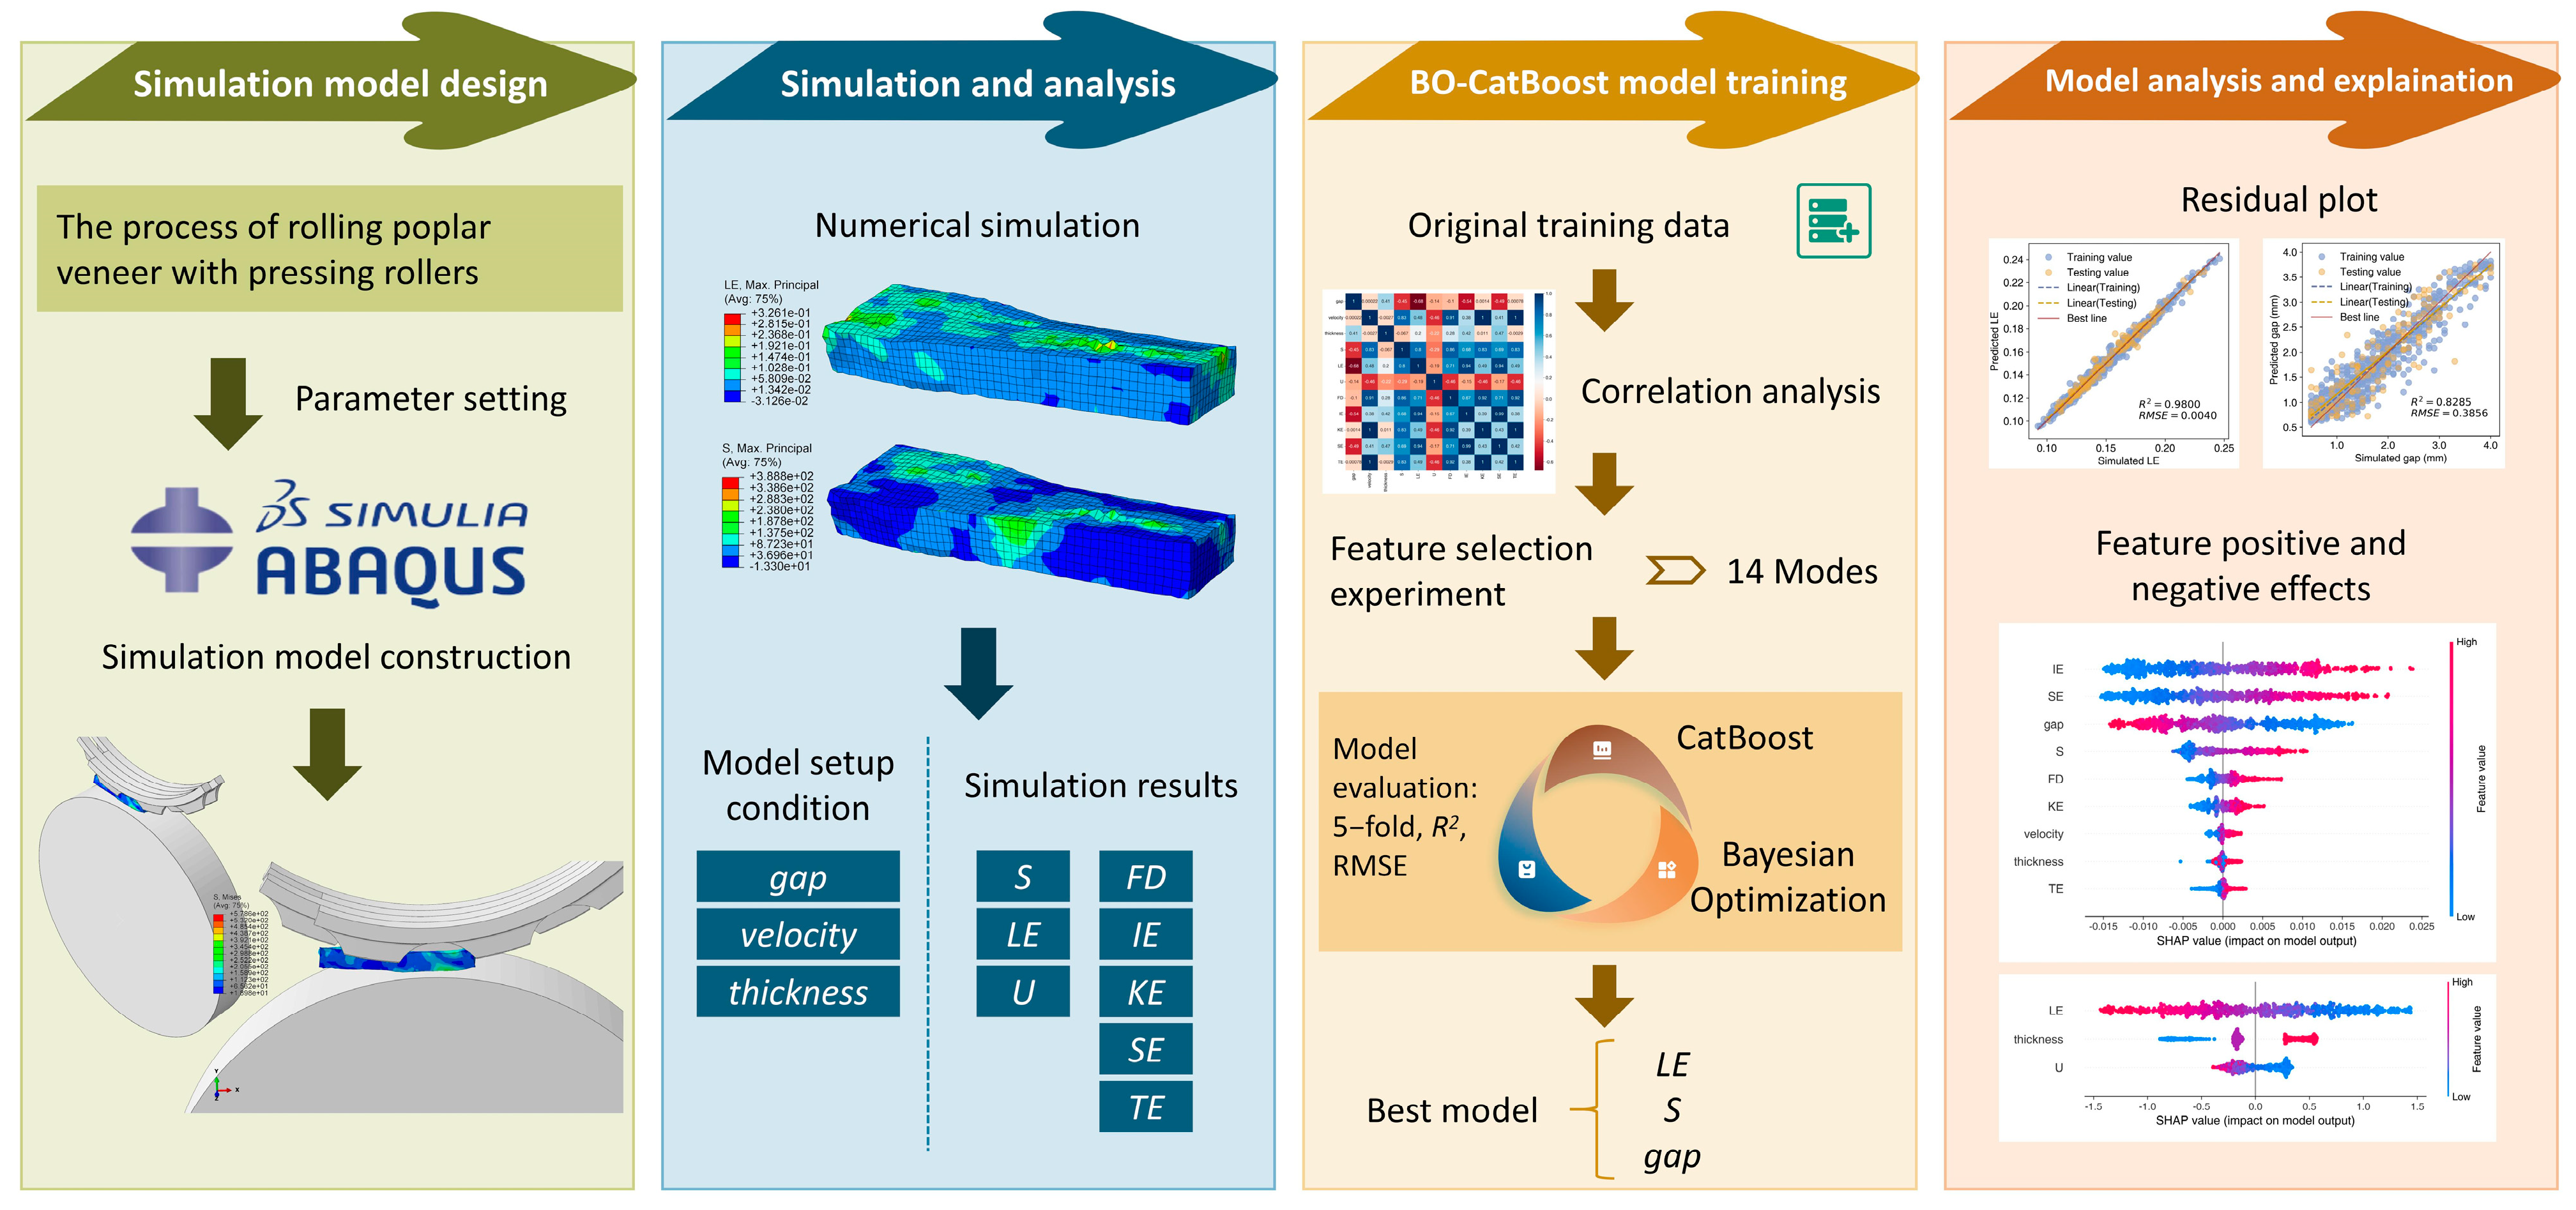
Establishing an FEM model of veneer rolled by the unit of the pressing roller.
(2)
Analyzing the effects of key characteristic parameters on the stress, strain, and energy fields of the veneer to determine the characteristic parameters of veneer roller pressing and defibering that will ultimately be involved in the prediction task, based on the FEM model created in task (1).
(3)
Using the numerical simulation results as the main research data, the CatBoost model is improved by using the BO algorithm, and constructs the BO-CatBoost prediction model for the characteristic parameters of veneer roller pressing and defibering.
(4)
The features that significantly affect the prediction results are analyzed using the Shapley Additive Explanation (SHAP) method, thus providing a more profound understanding of the decision-making process.

2. Research Methodology

The framework of this study is illustrated in Figure 1, where the ABAQUS 2020 software was used to develop a simplified wood veneer model of roller pressing and defibering. This model was used as a benchmark to simulate the stress–strain situation of wood veneer with different thicknesses under different roller gaps and roller velocities. The essential data for the defibration process were obtained through simulation, and a dataset comprising key parameters such as roller gap, roller velocity, veneer thickness, maximum principal local effects (LE), maximum principal stress (S), spatial displacement (U), frictional dissipation (FD), internal energy (IE), kinetic energy (KE), strain energy (SE), total energy (TE), and so forth was constructed. Subsequently, the data underwent preprocessing, after which the BO-CatBoost integrated learning method was employed to construct the regression model. Given the limited size of the dataset, this study employed a 5-fold cross-validation method to optimize the utilization of available data and accurately reflect the actual prediction accuracy of the model. Furthermore, the SHAP algorithm was utilized to analyze the degree of contribution of the input features to the output results, thereby providing an explanation for the prediction process and the degree of veneer defibration. The results of this study could provide robust decision support for the control of the veneer defibering process.

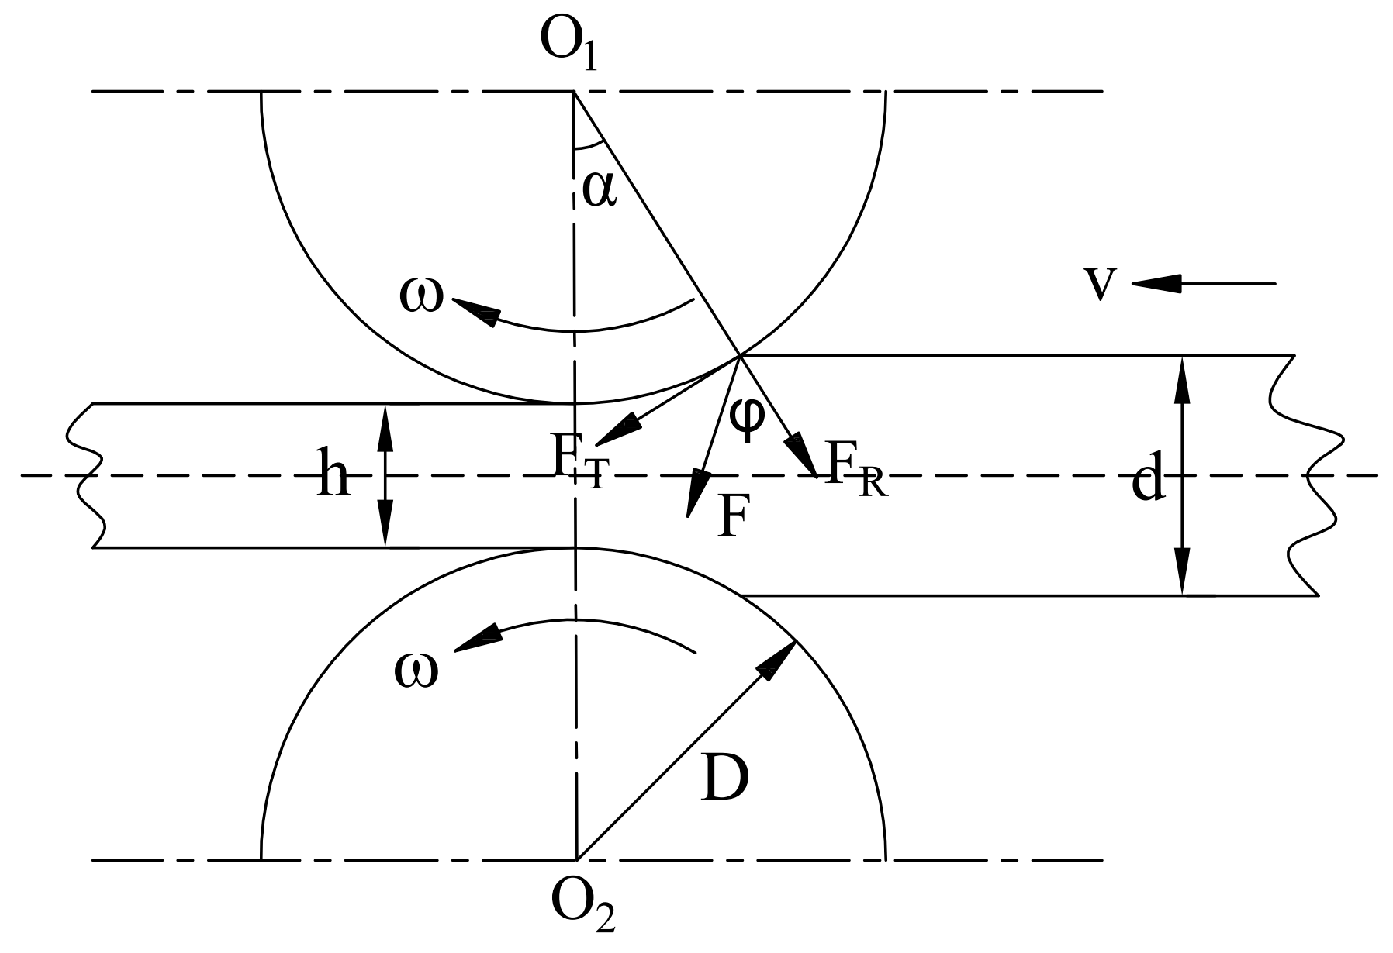
2.1. Force Analysis and Simulation of Rolling Process

2.1.1. Force Analysis

Veneer defibering equipment mainly uses the roller principle to achieve the separation of wood bundles. The pressing-roller unit is the basic processing unit. The veneer defibration process needs to go through a number of sets of pressing-roller units for the longitudinal spreading of the roller press to defiber, as shown in Figure 2. The pressing-roller unit, for a group of vertical axes, is set up in a configuration of two rotating up and down, with the distance being adjustable. Each pair of rollers consists of an upper roller with a transverse setting (defibering roller) and a lower roller with a transverse setting (friction roller). The friction roller is a fixed roller with a number of bulbous protruding units or reticulated protruding units arranged in a circular pattern on its outer surface. When the defibering roller is connected by a screw or a screw elevator, the roller gap is set at a fixed distance; when the defibering roller is connected by a screw and a pitch-adjusting coil-spring structure, the roller gap can be dynamically adjusted with the thickness of the veneer. The defibering roller is equipped with an equidistant arrangement of defibering teeth, defibering teeth with a knife edge, and each circle of defibering blades along its circumference is arranged in a stepwise manner to make the veneering force more uniform, usually adopting the interleaved teeth distribution form.
The veneer is affected by the combined effect of the shear force generated by the defibering roller and the friction force generated by the friction roller as it is defibered by the pressing-roller unit. The geometric relationship between the defibering roller and the veneer is shown in Figure 3. The veneer has a certain initial speed before entering the first set of pressing rollers. As it is rapidly squeezed by friction, the veneer is pressed and enters the teeth blades of the defibering roller, where it is subjected to the shearing force of the roll teeth, resulting in a fractured morphology on the surface. In order to ensure that the veneer can smoothly enter the two pressing rollers and be crushed during defibering, the defibering roller and the veneer must maintain a certain friction angle between them [26].
The diameter of the defibering roller is D , the distance between the upper and lower defibering rollers (roller gap) is h , the thickness of the veneer is d , the friction angle between the veneer and the defibering roller is φ, and the initial gripping angle of the veneer is α. After the veneer enters the working area, the defibering roller generates a frictional force F T and a normal force F R on the veneer, and the horizontal combined force F h o r i z o n t a l and the vertical combined force F v e r t i c a l are:
F h o r i z o n t a l = F T cos α F R sin α
F v e r t i c a l = F T sin α + F R cos α
By adjusting the gap and velocity of the pressing roller unit, the defibered veneer is regulated according to different thicknesses of wood veneer to achieve the required defibering quality to match the subsequent process. Defibering equipment is usually used to control the quality of veneer defibering by changing the roller gaps and roller velocity, as well as increasing the number of pressing roller units. In practice, different thicknesses, widths, and types of veneer must be matched with corresponding roller gaps and roller velocities to achieve the defibering quality of the process standard. Considering the limitations of simulation analysis and the efficiency of large-scale simulation, the roller gap, roller velocity, veneer thickness, pressure, and defibering effect were selected as the key parameters for evaluating the characteristics of veneer roller pressing and defibering in this study.

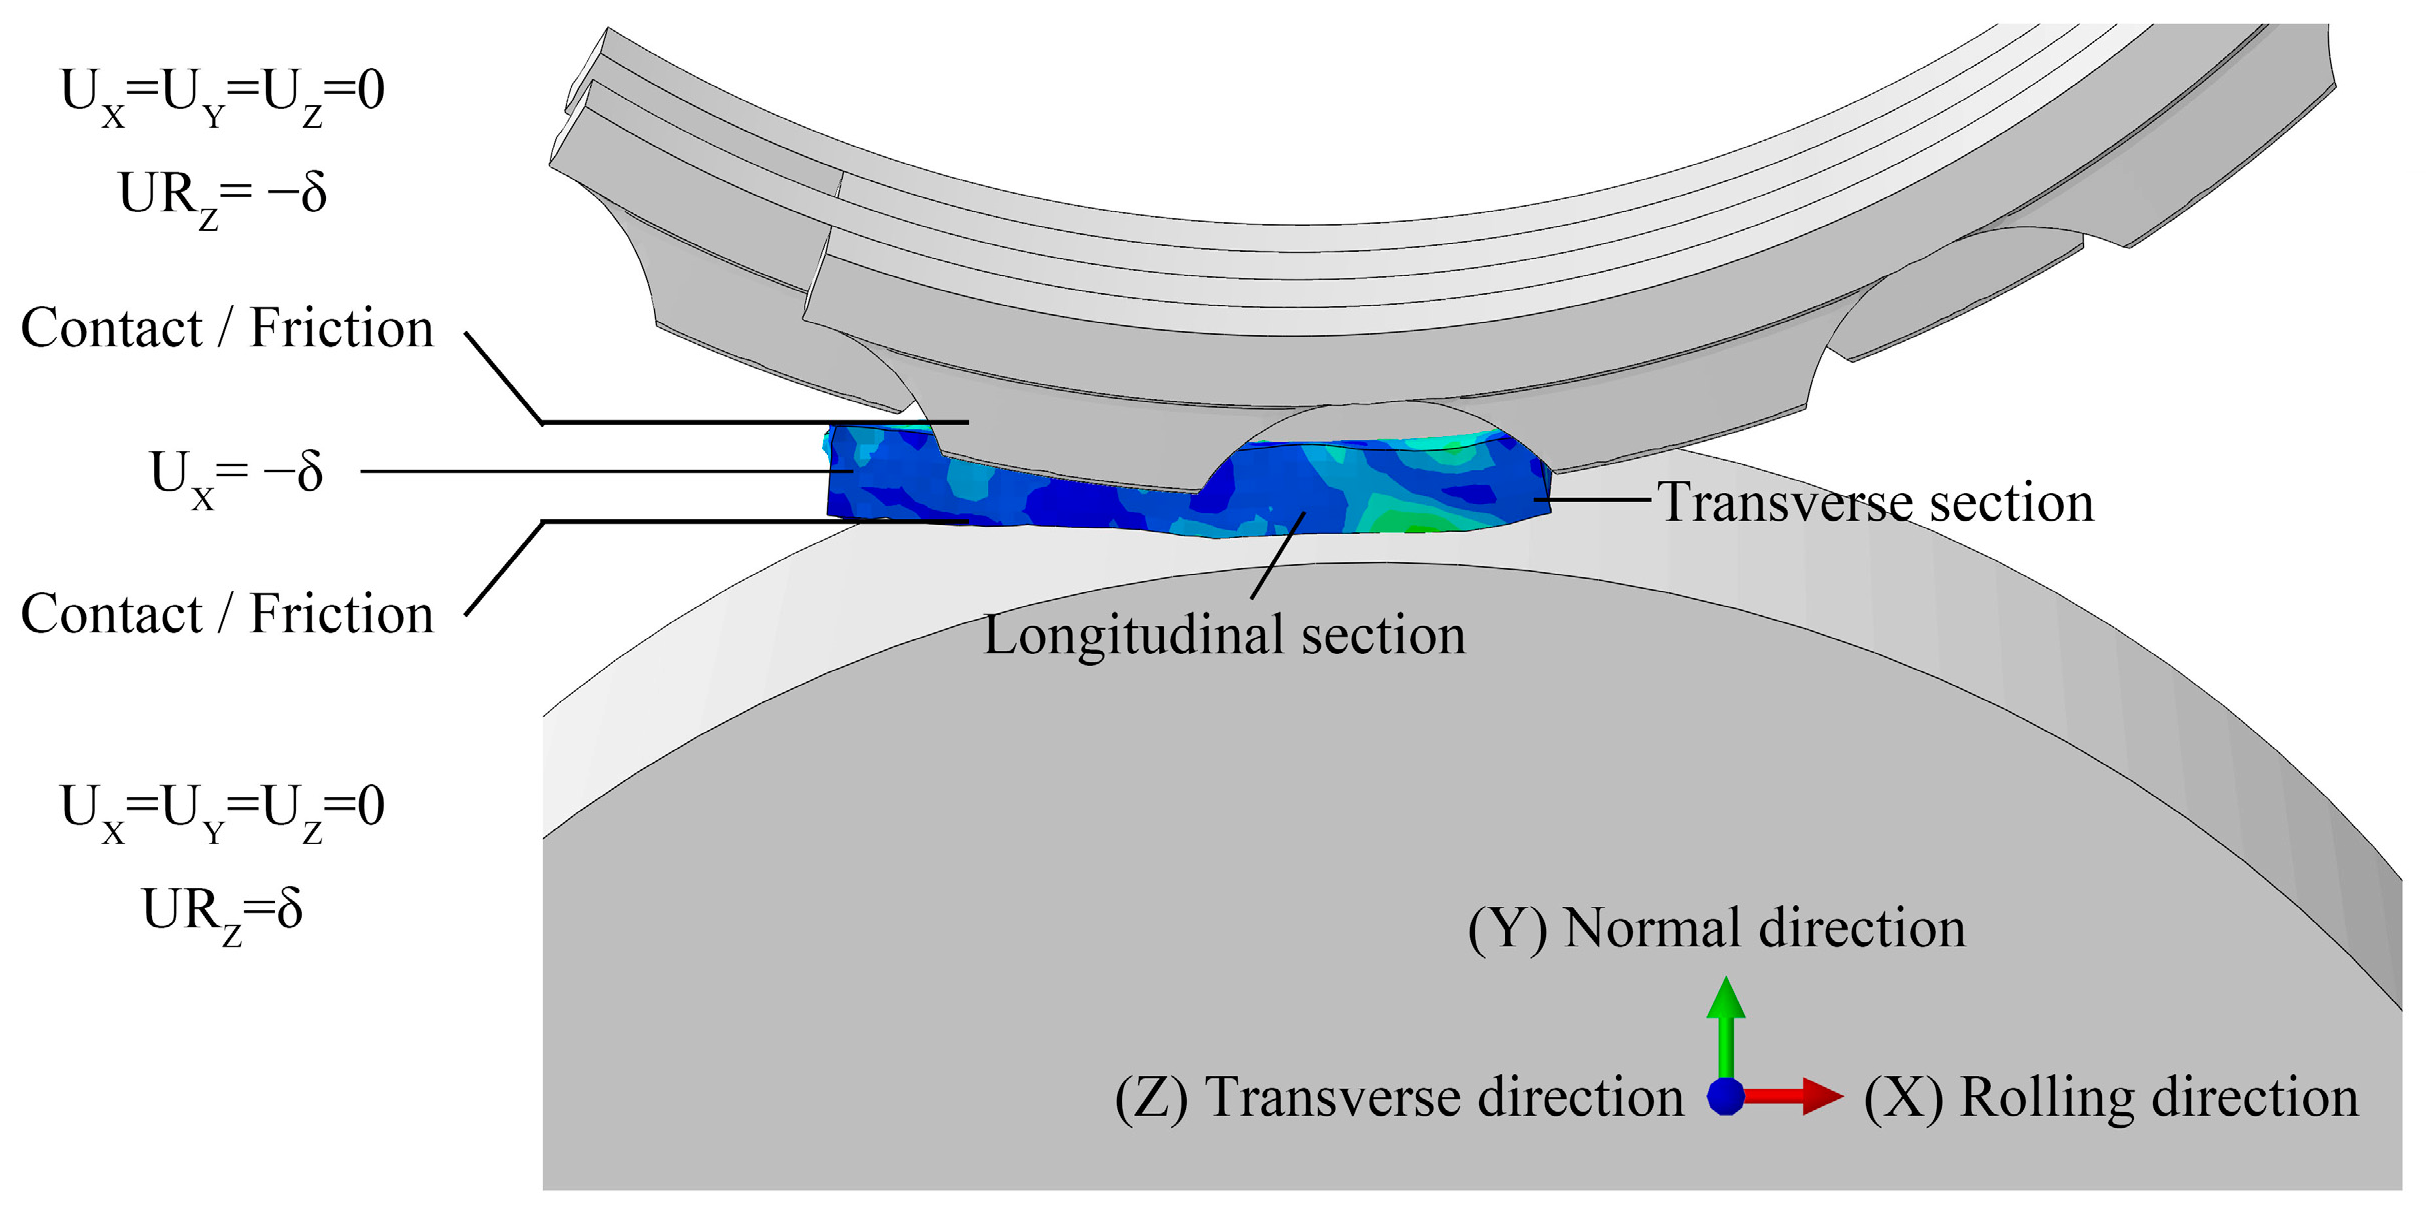
2.1.2. FEM Model Establishment

The process of veneer roller pressing and defibering is inherently complex, as it typically involves multiple rolling cycles to achieve the desired level of defibering. A multitude of physical processes is involved, including the elastic and plastic deformation of the veneer by the roller, damage to the veneer, cutting, the friction contact forces exerted by the defibering roller, and so forth. In order to reduce the amount of calculations and the complexity of the model, the study simplified and abstracted the defibering roller model to a certain extent, while retaining the key structure of the model and ensuring the accuracy of the calculation. (1) The roll-pressing analysis of the pressing-roller unit was limited to a single group. The defibering roller was simplified to a four-row roller tooth model with an interleaved teeth distribution, with approximately one-quarter of the model established based on selected features of the roller. (2) In actual production, the veneer is conveyed to the pressing roller room by manual loading or roller conveyor. In the actual simulation, the veneer was imparted with a specific initial velocity in order to engage with the roller group. (3) In order to facilitate the subsequent calculation of the field variable output of all nodes subsequent to the division of the veneer into meshes, the length of the veneer was reduced proportionately. This ensures that only the defibering law of the veneer can be simulated. (4) The anilox-like protruding cells on the surface of the pressing roller, whose main function is to provide friction, were ignored in the modeling.
In the ABAQUS software, a three-dimensional FEM model was established to simulate the process of veneer roller pressing and defibering. The design and assembly of the roller size parameters are based on the actual production of defibering equipment manufacturing requirements. The parameters are as follows: a friction roller radius of 95 mm, a depth of 30 mm; a veneer length of 50 mm, a thickness of 4–6 mm, a width of 15 mm; a defibering roller radius (excluding teeth) of 95 mm, an average width of the roller teeth of 2 mm, a roller teeth gap of 2.96 mm and a roller teeth depth of 7.5 mm. The friction roller, made of 45# steel, is regarded as a rigid body that meshes with the hexahedral unit medial-axis algorithm. The defibering roller is made of Q345 material and is also positioned as a rigid body. Hypermesh is employed to refine the tetrahedral mesh of the defibering roller components to enhance the precision of the calculations, due to the irregular structure of the defibering teeth, which are the primary source of cracks and damage to the veneer. The veneer is a type of poplar wood that is suitable for scrimber processing. Its mechanical properties are presented in Table 1. The hexahedral elements have been selected for use in veneer grid division. Table 2 shows the main characteristic values for the simulation.
The boundary conditions and coordinate system of the FEM model of the pressing-roller unit are shown schematically in Figure 4. The positional relationships of the rolling direction (X), normal direction (Y), and transverse direction (Z) are given in the figure. The contact area consists of two parts, both exhibiting friction: the upper surface of the defibering roller and the veneer, as well as the lower surface of the friction roller and the veneer. The penalty function contact method was chosen with a friction coefficient of 0.5. Maxps Damage was used to simulate the cracking of the veneer at the end of the rolling process. The corresponding maximum principal stress value is entered as the critical damage criterion, which is determined by combining the mechanical properties of the veneer with the simulation test results. The loads and boundary conditions of the veneer and the pressing roller are controlled by displacements and angular velocities in accordance with the prevailing operational conditions. The veneer can only be moved in the negative direction of the x-axis; the defibering roller rotates clockwise and the friction roller rotates anti-clockwise. A predefined velocity field or pressure load is applied to the veneer part to ensure that the veneer has a certain initial velocity before entering the two counter-rotating pressing rollers. Create an analysis step using an explicit dynamic method.

2.2. BO-CatBoost

CatBoost, as a third-generation algorithm of the GBDT family, is an ensemble learning method. Its distinctive feature is that it does not necessitate any preprocessing of category-based features and can utilize feature combinations to augment the feature dimension. By adopting the sorting idea, CatBoost has effectively solved the problems of gradient bias and prediction bias, which in turn reduces the risk of overfitting and makes it possible to construct highly accurate models [27,28]. CatBoost has a number of tunable parameters that can affect the model’s performance and training speed. CatBoost’s hyperparameters are optimized using BO, which is mainly used in scenarios where function cost evaluation is complicated (long training time and high tuning cost), the model is black-boxed (the objective function cannot be directly observed), and the goal of optimization is the global optimum [29,30]. BO is combined with probability distributions to generate optimal samples by tuning each hyperparameter. The optimization process starts with a large search area, using past performance to improve search speed, and then gradually focuses on specific regions around the optimal parameters found in previous iterations [31,32,33].
In this study, the domains of the considered hyperparameters were as follows: iterations (iter), learning_rate (η), depth, l2_leaf_reg (l2), rsm, random_seed (seed), and subsample. The default maximum number of iterations for CatBoost was 500, the default learning rate was 0.03, and the default depth was 6. It could be observed that an increase in the number of iterations resulted in enhanced outcomes, albeit at the expense of prolonged training periods. A large number of iterations increased the risk of overfitting. Therefore, the tree depth was usually chosen to be small to reduce this risk. Furthermore, the learning rate decreased as the number of iterations increased. Consequently, it was crucial to identify the optimal number of iterations and learning rate for the model training speed and model performance. Similarly, the other parameters such as the subsample and rsm regularization terms needed to be optimized by identifying the trade-off between these parameters with precision. Table 3 shows the range of hyperparameters to be optimized for the CatBoost model and their roles.
The main hyperparameter settings of CatBoost are categorized as optimization problems. Supposing the hyperparameter set to be optimized is χ = χ i i = 1 N , a population with N number of hyperparameter sets, the i th randomly generated hyperparameter set is χ i = i t e r i ,   η i ,   d e p t h i ,   l 2 i ,   r s m i ,   s e e d i ,   s u b s a m p l e i . The main modules of BO include the objective function, probability model, acquisition function, and BO loop. The focus of this work is to obtain the global maximum χ * of the objective function f χ in the set of hyperparameters χ using BO methods and subsequently determine the corresponding optimal combination of hyperparameters for CatBoost.
In this study, the accuracy of 5-fold cross-validation was used as the objective function of BO. For the veneer strain prediction problem involving p r e d i c t S = s i ,   a t i i = 1 N , χ = χ i i = 1 N and m o d e l F c a t b o o s t S ,   χ i , the objective is to find optimal χ i * that optimize the following objective function:
χ i * = argmax χ i χ j = 1 m σ a t j ^ , a t j = argmax χ i χ j = 1 m σ c a t b o o s t c t j , χ i , a t j
In Equation (3), σ · is the 5-fold cross-validation function, a t j ^ is the prediction y j ^ = c a t b o o s t ( c t j , χ i ) , and a t j is the given true target.
Based on the sampling points of the objective function, BO approximates the unknown shape of the objective function using proxy optimization. Gaussian Process Regression (GP) is used to model the proxy function, which is fully specified by its mean and covariance functions (also known as kernel functions) [34]. The mean function represents the expected value of the function at each input point, while the covariance function characterizes the relationship between the different input points and controls the smoothing and behavior of the generated function. The acquisition function guides the optimization process by using the mean and variance provided by the GP to suggest the next point in the objective function to be evaluated [35]. Common acquisition functions include expected improvement, upper confidence limit, and knowledge gradient.

2.3. Cross-Validation and Evaluation Criteria

K-fold cross-validation is an important method in machine learning [36,37]. The optimal model is obtained by k-fold cross-validation methods, in which the training set is randomly divided into k copies, and the k subsets are traversed in turn, with the current subset used for testing and the remaining k−1 copies used for training [38,39]. Finally, the performance evaluation results of k times are averaged to obtain the final evaluation results. Due to the limited simulation data, 5-fold cross-validation was chosen to estimate the performance and generalization ability of the model.
The performance of the CatBoost prediction model was evaluated using the coefficient of determination ( R 2 ), the mean absolute error (MAE), the mean squared error (MSE), and the root mean squared error (RMSE) [40]. The four evaluation measures are calculated as shown in Equations (4)–(7):
R 2 = 1 i = 1 m y i ^ y i 2 i = 1 m y i ¯ y i 2
M A E = 1 m i = 1 m y i y i ^
M S E = 1 m i = 1 m y i y i ^ 2
R M S E = 1 m i = 1 m y i y i ^ 2
In the above formulas, m is the sample size, y i ^ is the predicted value, y i is the true value and y i ¯ is the average of y i .
Furthermore, the SHAP method can be employed to elucidate the significance of features in CatBoost prediction models [41]. The fundamental premise of SHAP is to calculate the marginal contribution of each feature to the model output, which can be utilized to explain the so-called “black-box model” at the global and local levels, respectively. SHAP is an additive explanatory model, wherein all features are regarded as “contributors”. For each prediction sample, the model generates a prediction value, and for each feature of this sample, a corresponding SHAP value is generated, representing the influence of the feature on the prediction. Equation (8) contains specific details on how to calculate SHAP values:
f X ´ = J 0 + i = 1 K J i X i
where f is an interpretation model; X ´ indicates whether the input parameter i is present in the set of input parameters, such as when i is in the set of input parameters X ´ = 1 , and when i is not in the set of input parameters X ´ = 0 ; K is the number of input parameters; J is the attribution of input parameters.

3. Experimental Setup and Result Analysis

3.1. Simulated Analysis of Veneer Roller Pressing and Defibering

This study employed the ABAQUS model established in Section 2.1 to analyze the effects of three key factors, namely roller gap, roller velocity, and veneer thickness, on the stress and strain of the veneer during the processing of rolled veneer by pressing rollers. Stress could be defined as the combined force acting perpendicular to the vertical direction of the cross-section at a given point in the veneer, while strain could be understood as the degree of deformation of the veneer. Two definitions corresponded to the defibering effect observed in actual production. The history output variables and field output variables of the simulation results were subjected to in-depth analysis employing the control variable method, the median selection method, and the cross-section analysis method. Macroscopically, the results of the stress nephogram for each frame were presented; microscopically, the stress–strain values at the nodes of the veneer division mesh were compared. In actual production, wood veneer with a thickness of 6 mm was frequently rotary cut as the veneer material for the defibering process, and wood veneer with a thickness of 4 mm was also rotary cut for processing and production. In order to guarantee safety, given the high-speed rotation of the pressing roller, the roller gap was set at a secure distance of 0.5 mm, while the maximum roller gap was determined according to the thickness of the veneer. The rated speed of the pressing roller was 1.32 rps, which corresponds to a linear speed of approximately 800 mm/s. The optimal speed range for the frequency converter was 50% to 100%. In practical operational conditions, the velocity of the pressing roller exerted a considerable influence on the efficiency of the processing procedure. A reduction in the velocity would result in a decline in the mechanical properties of the pressing-roller unit, which in turn gave rise to the issue of board feeding and processing resistance. Furthermore, the defibration process would inevitably result in the production of wood chips. Thus, if the pressing-roller velocity were excessive, it would relatively easily cause the machine to become blocked. In order to prevent this, it is essential to ensure that the velocity of the pressing roller is matched with that of the inlet and outlet roller conveying lines. This would enable the processing speed of the veneer to be accurately determined. Consequently, this study selected three structural factors, as illustrated in Table 4, conducted repeated simulation experiments, and obtained a total of 702 sets of simulation results.

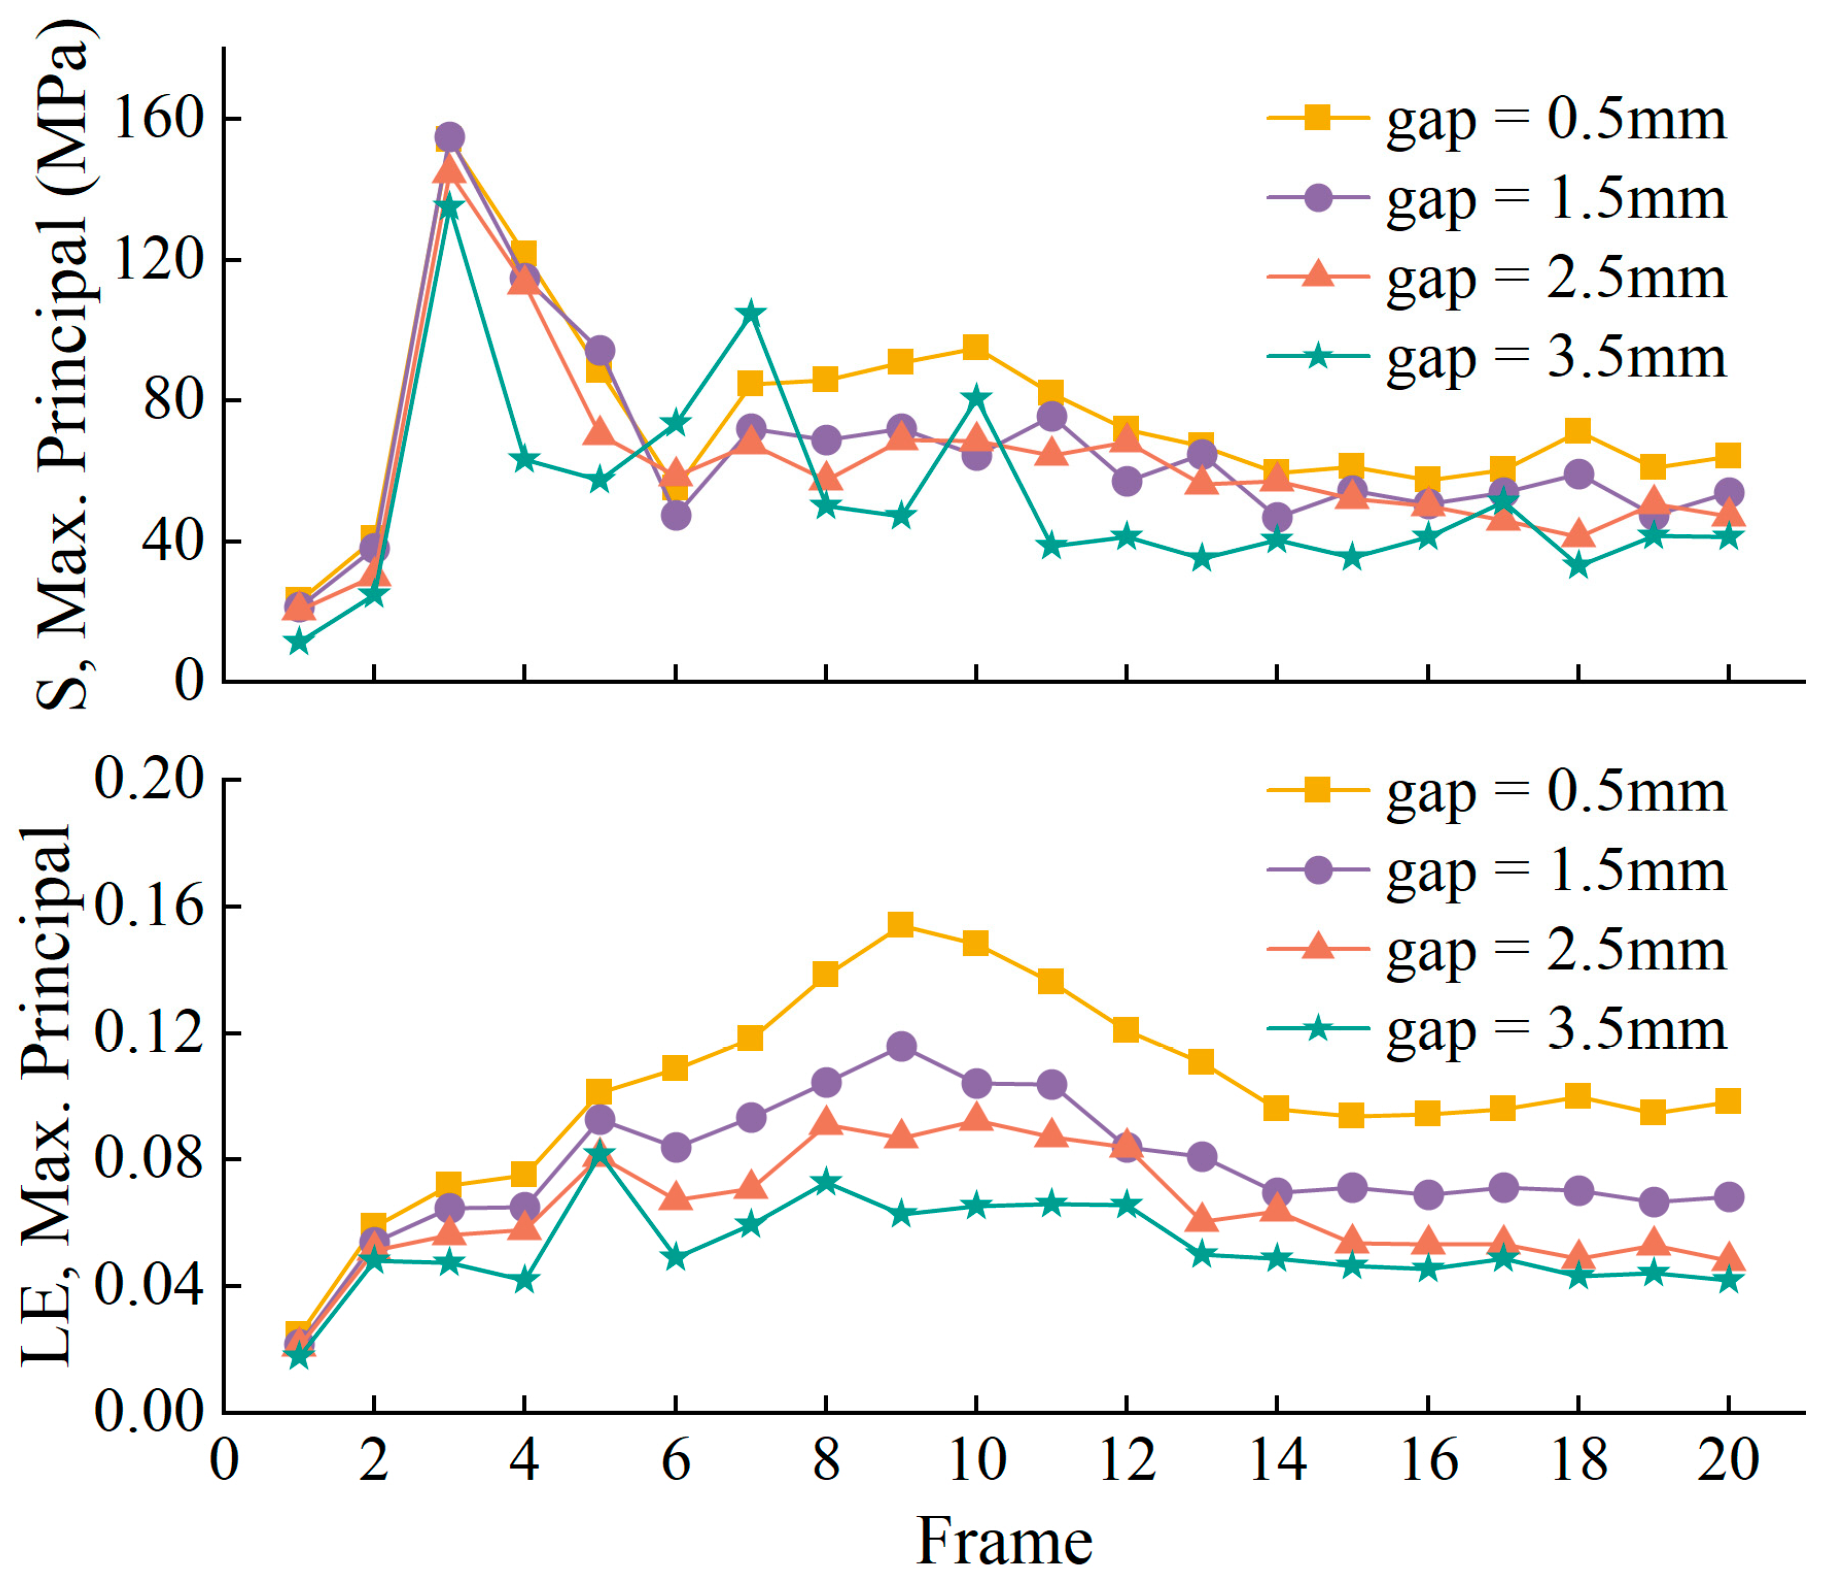
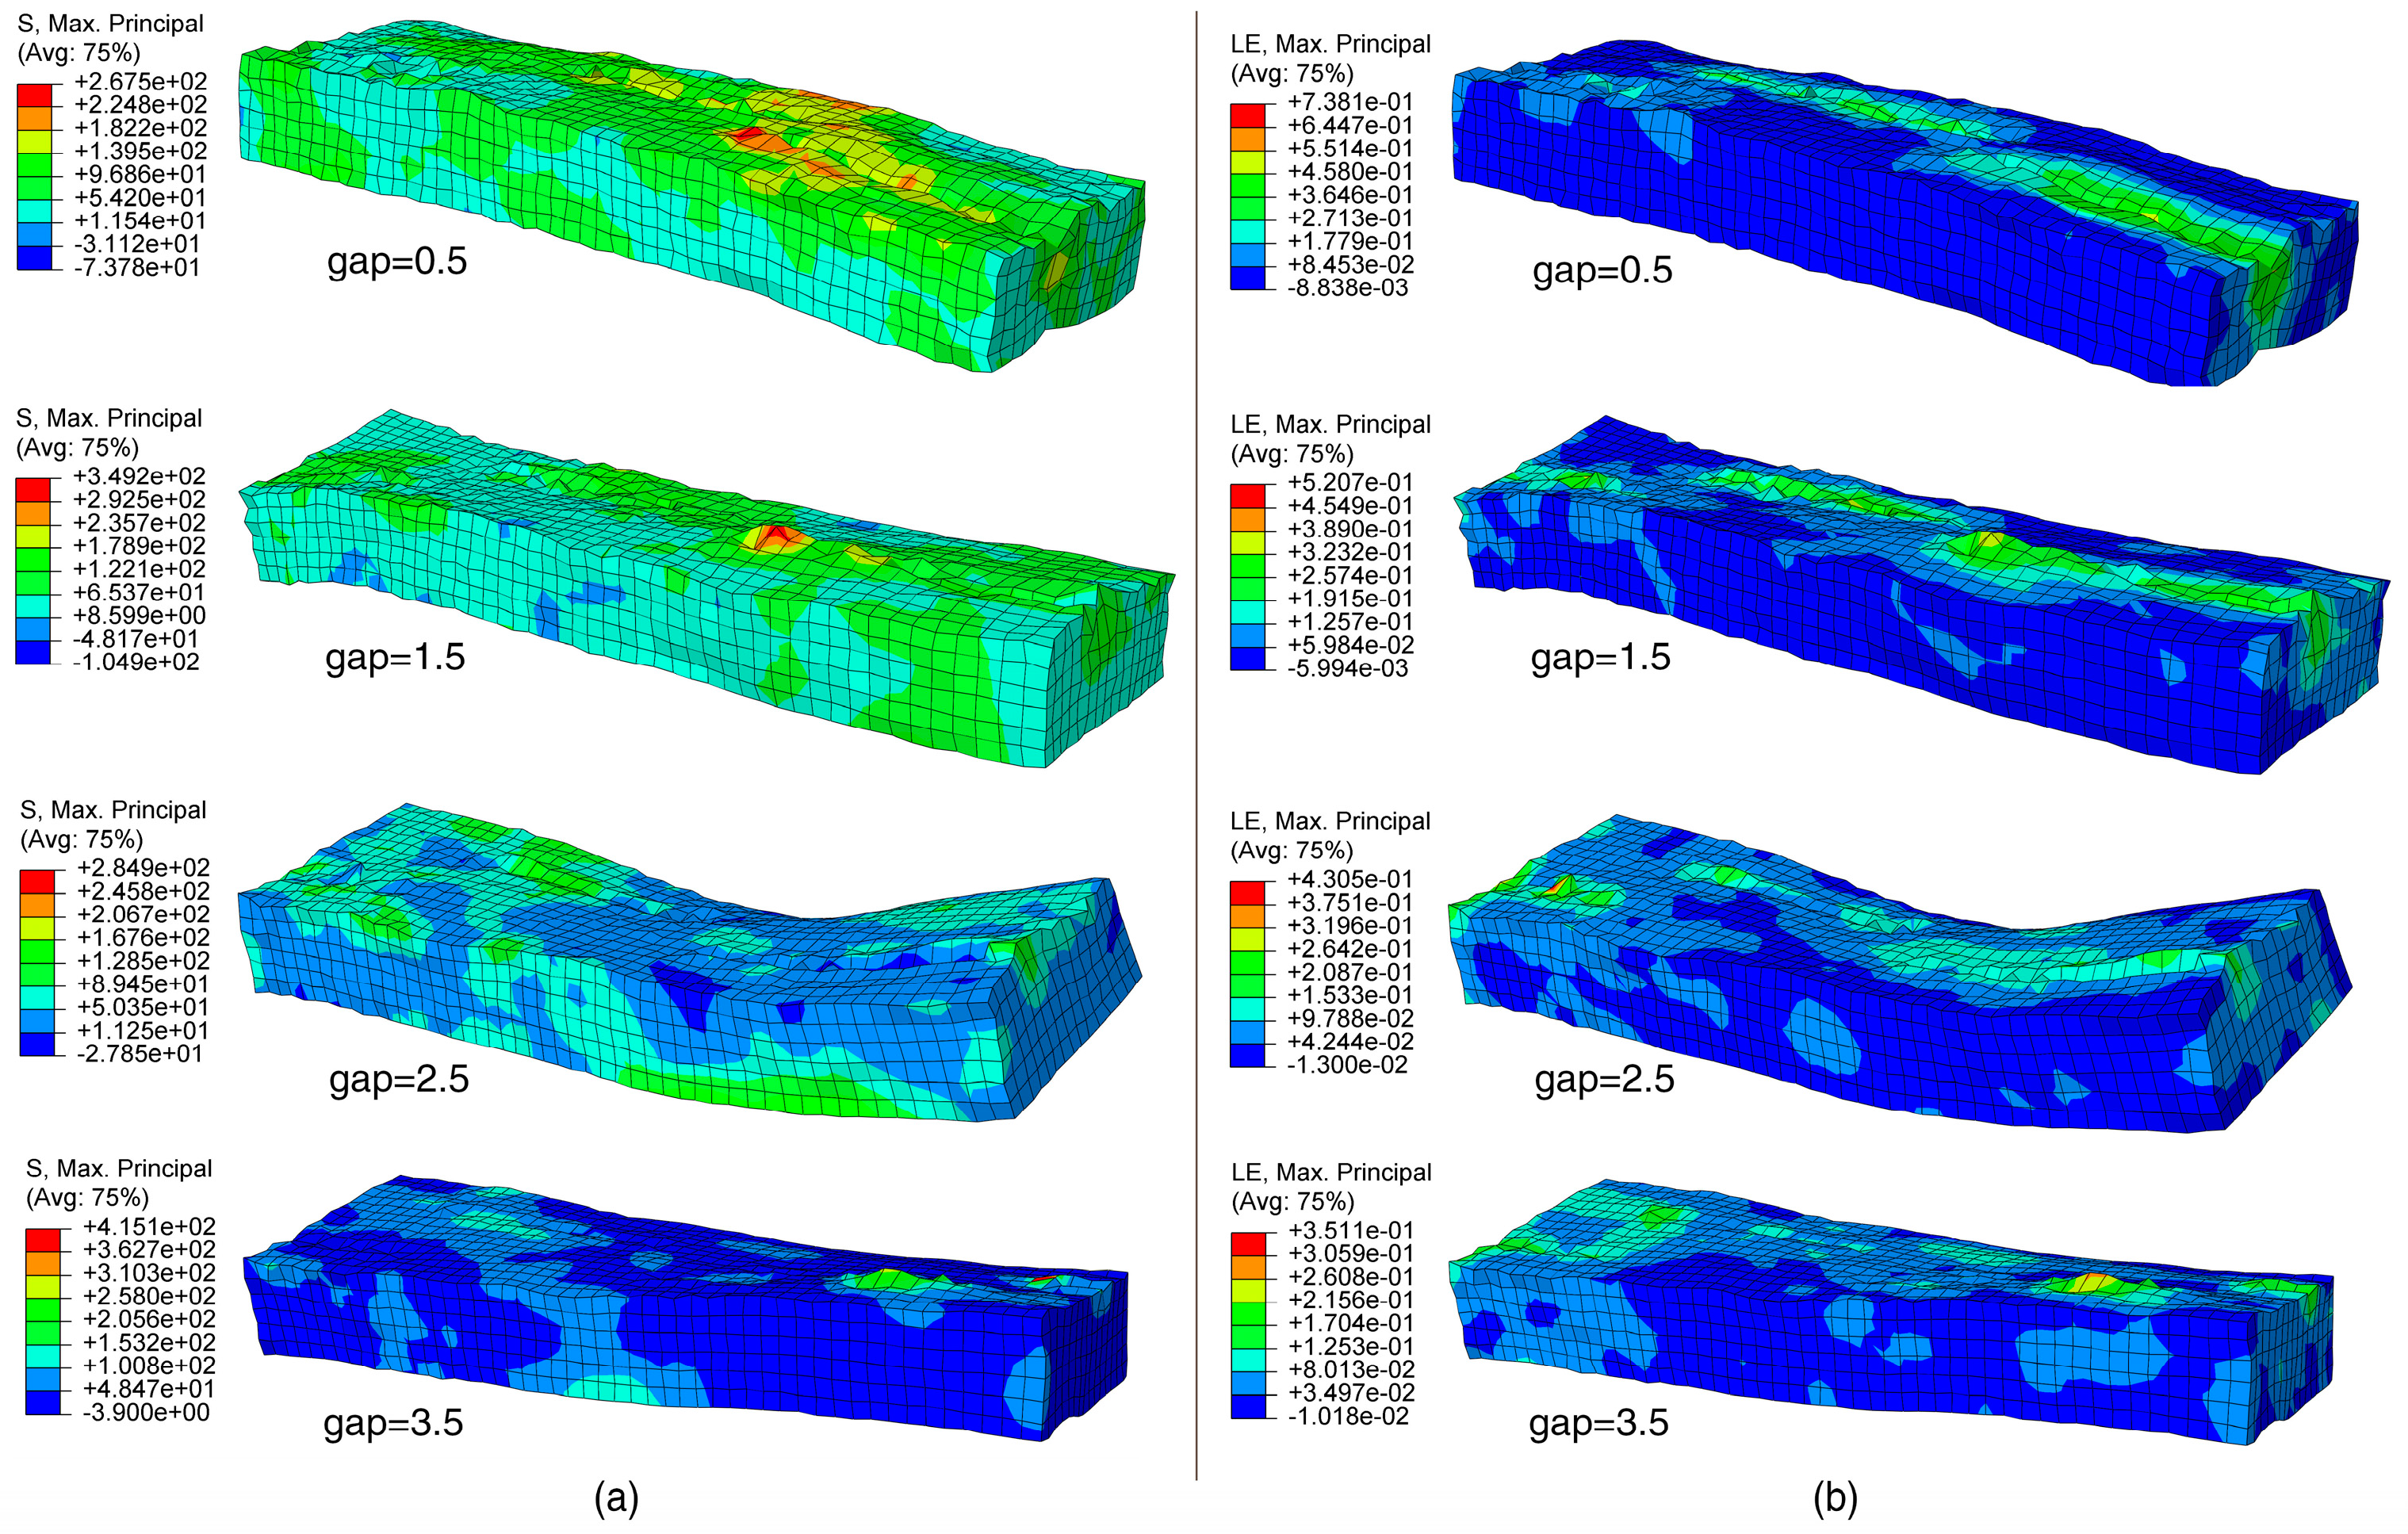
3.1.1. The Effect of Roller Gap in Defibering

The roller gap had a considerable impact on defibering deformation. The thickness of the veneer directly affected the stress-field distribution of the plate, so a stress-field analysis of the plate with different thicknesses was needed. We selected the simulation results of a veneer thickness of 6 mm and a roller velocity of 600 mm/s, under the conditions of a roller gap of 0.5, 1.5, 2.5, and 3.5, respectively. The distributions of the maximum principal stress (S, Max. Principal) and the maximum principal local effects (LE, Max. Principal) of the veneer rolling process are shown in Figure 5. The kinetic energy for the whole model (ALLKE) and strain energy for the whole model (ALLSE) are shown in the comparisons of the four models in Figure 6, and the average stress–strain nephograms of all nodes for each frame of the four models are shown in Figure 7. The results presented in Figure 7 are derived from frame 15 of the simulation, which depicts the moment when the roller teeth are about to disengage from the veneer. This occurs when two roller teeth exert force on the veneer. It can be observed that as the teeth become more deeply embedded, the stress and strain in the veneer increase. When the force exceeds the maximum principal stress threshold for veneer damage, the veneer begins to exhibit visible signs of damage. This phenomenon is illustrated by the red, orange, and yellow regions in Figure 7.
As the roller gap is reduced, the depth of the roll teeth embedded in the veneer also increases, resulting in an elevated average stress and strain on the veneer. This, in turn, intensifies the degree of crushing and deformation of the veneer, and consequently, the output of the ALLKE and ALLSE values also increases. In this process, the force exerted on the veneer can be attributed to the combined action of the shear force generated by the defibering roller and the friction force exerted by the friction roller. The distribution of forces is such that the stress areas are mainly concentrated on the upper and lower surfaces of the veneer, while the areas located in the center layer and not affected by the crushing of the roll teeth are relatively less stressed. This non-uniformity of force distribution gives rise to differences in the stress condition of the veneer in the longitudinal direction.

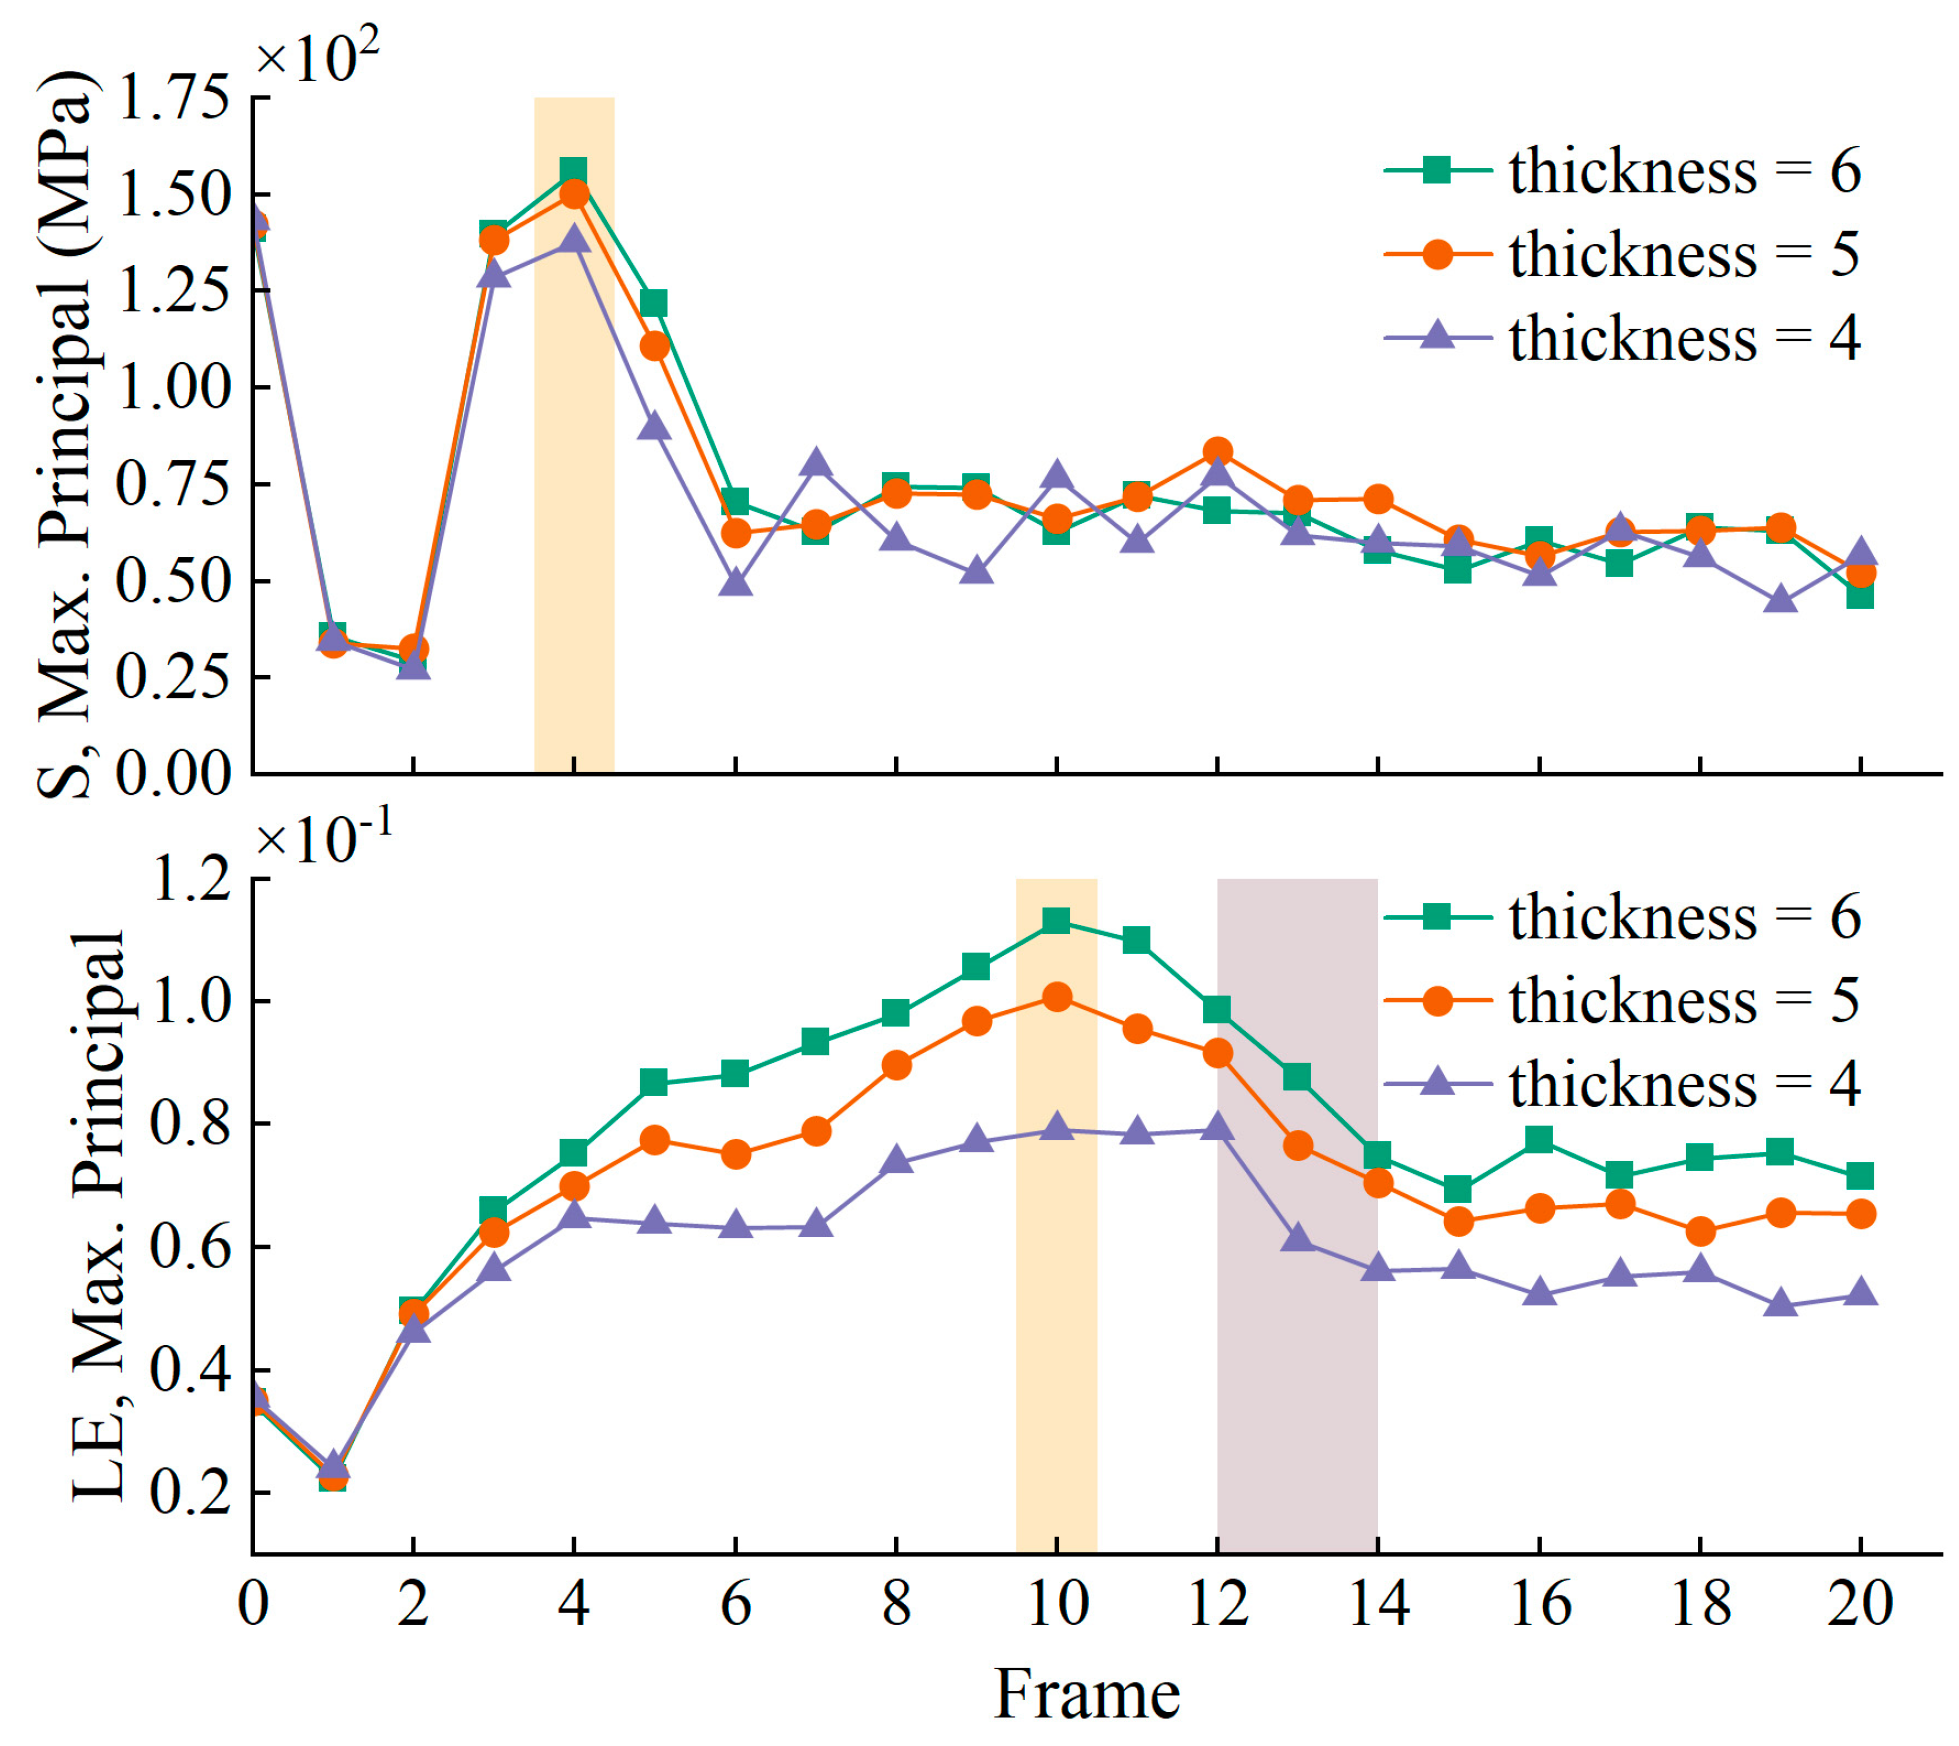
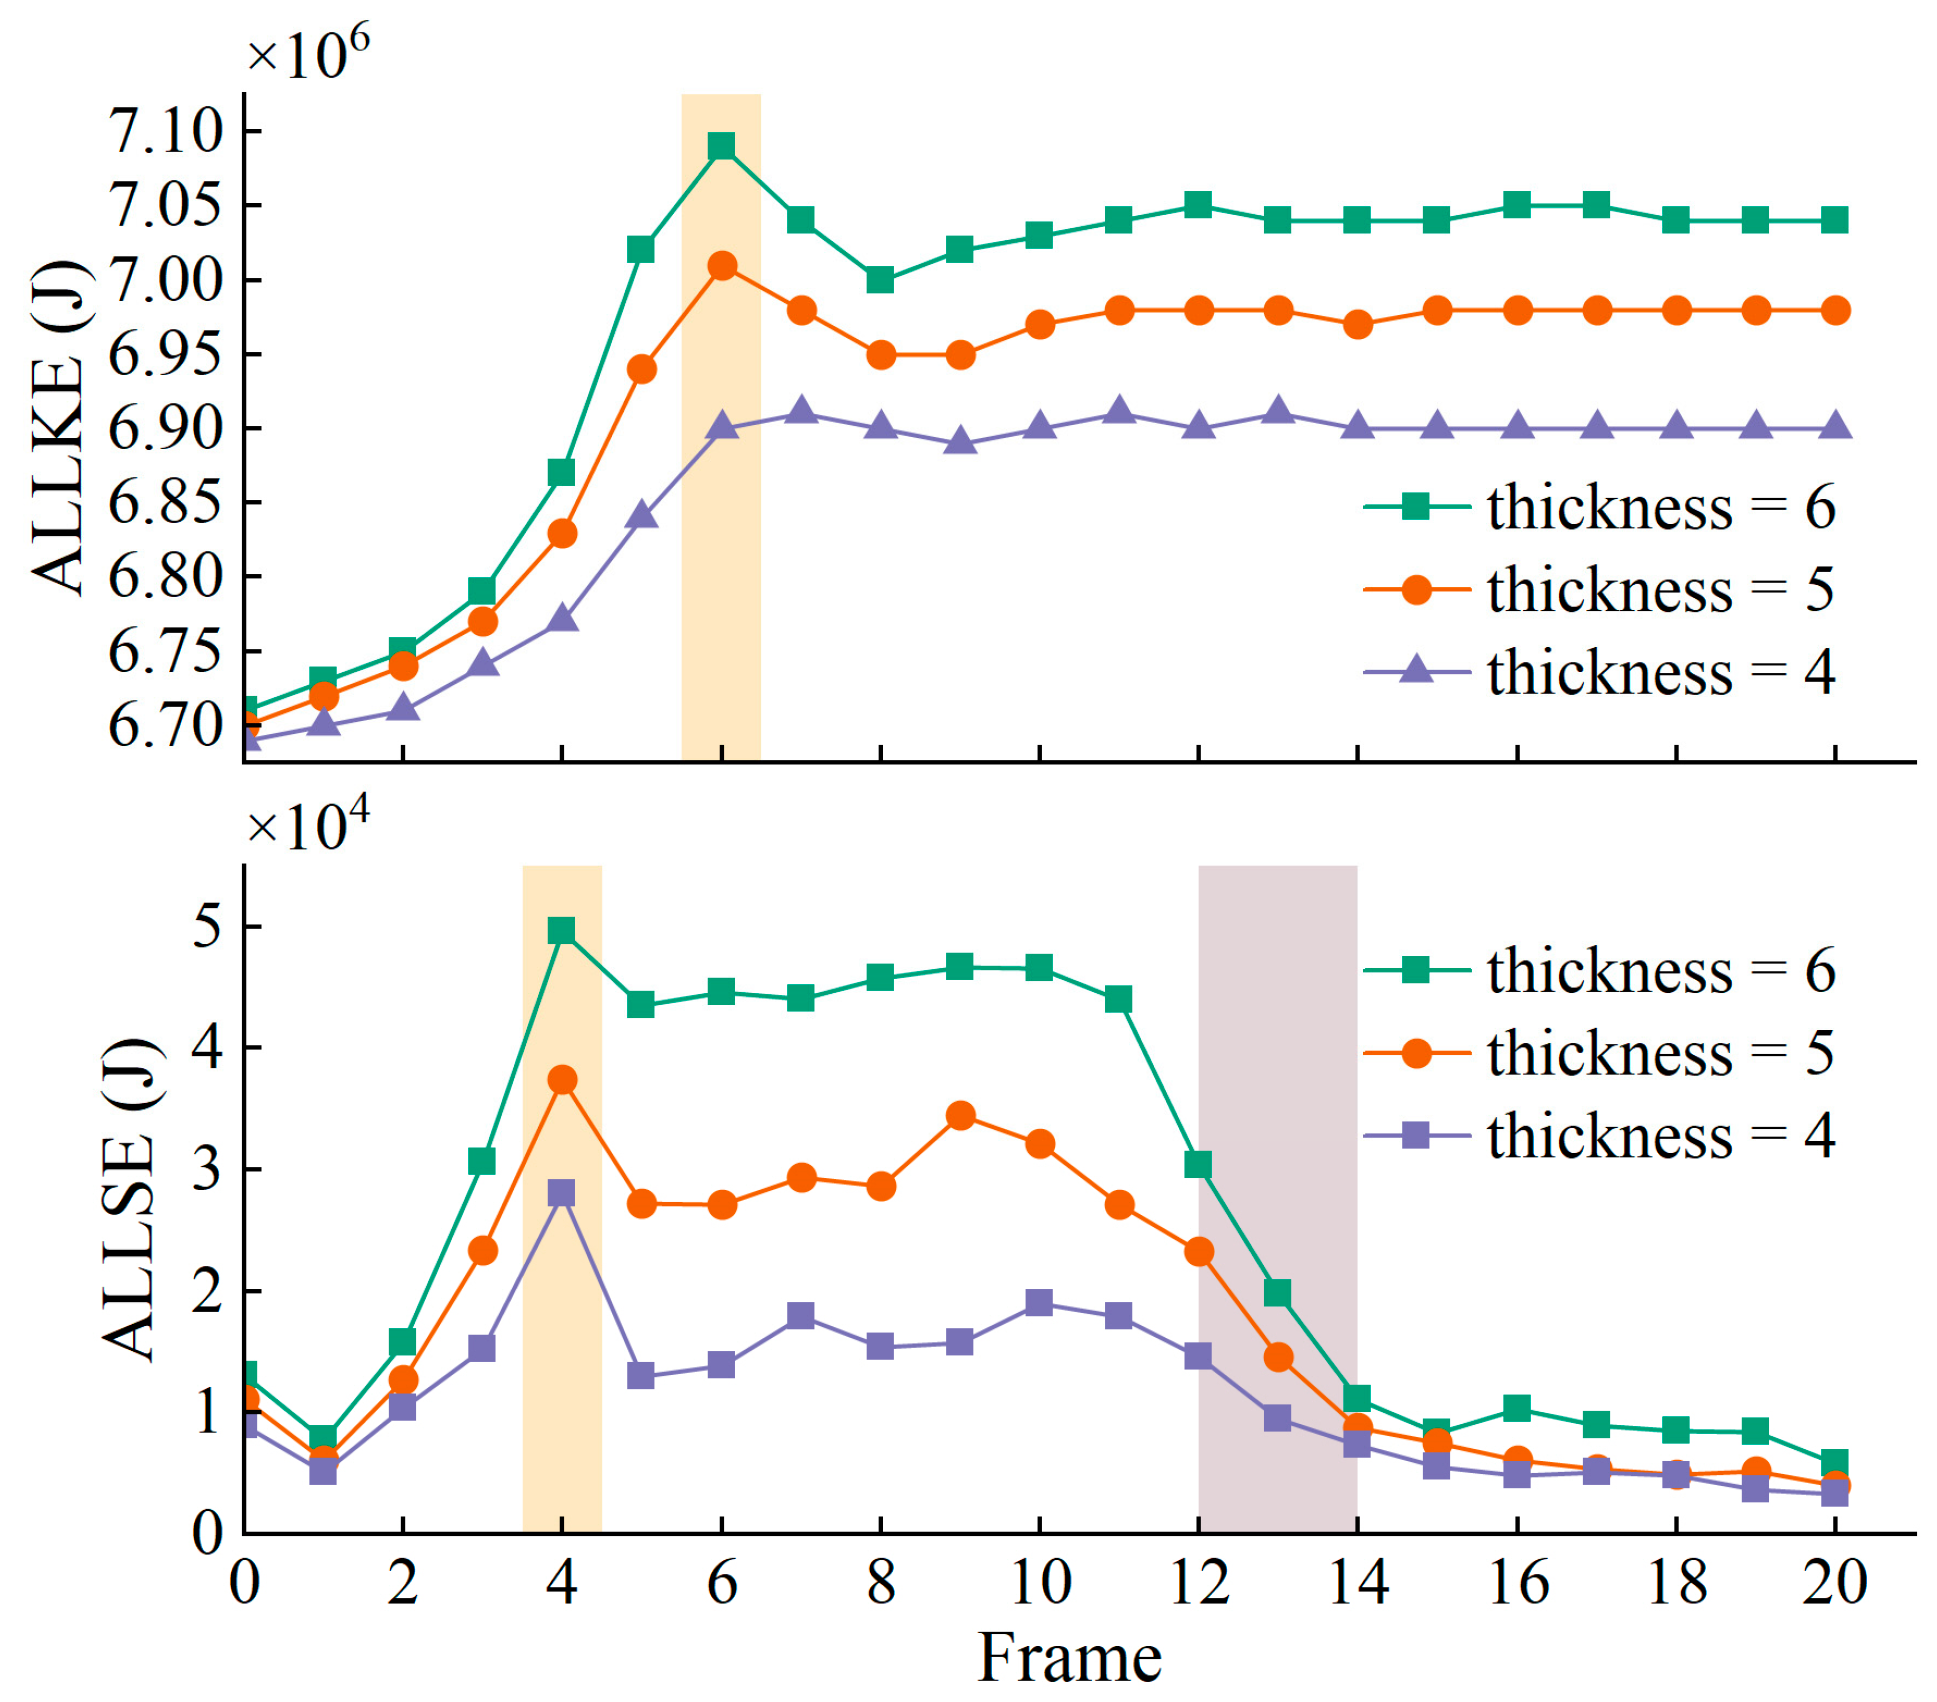
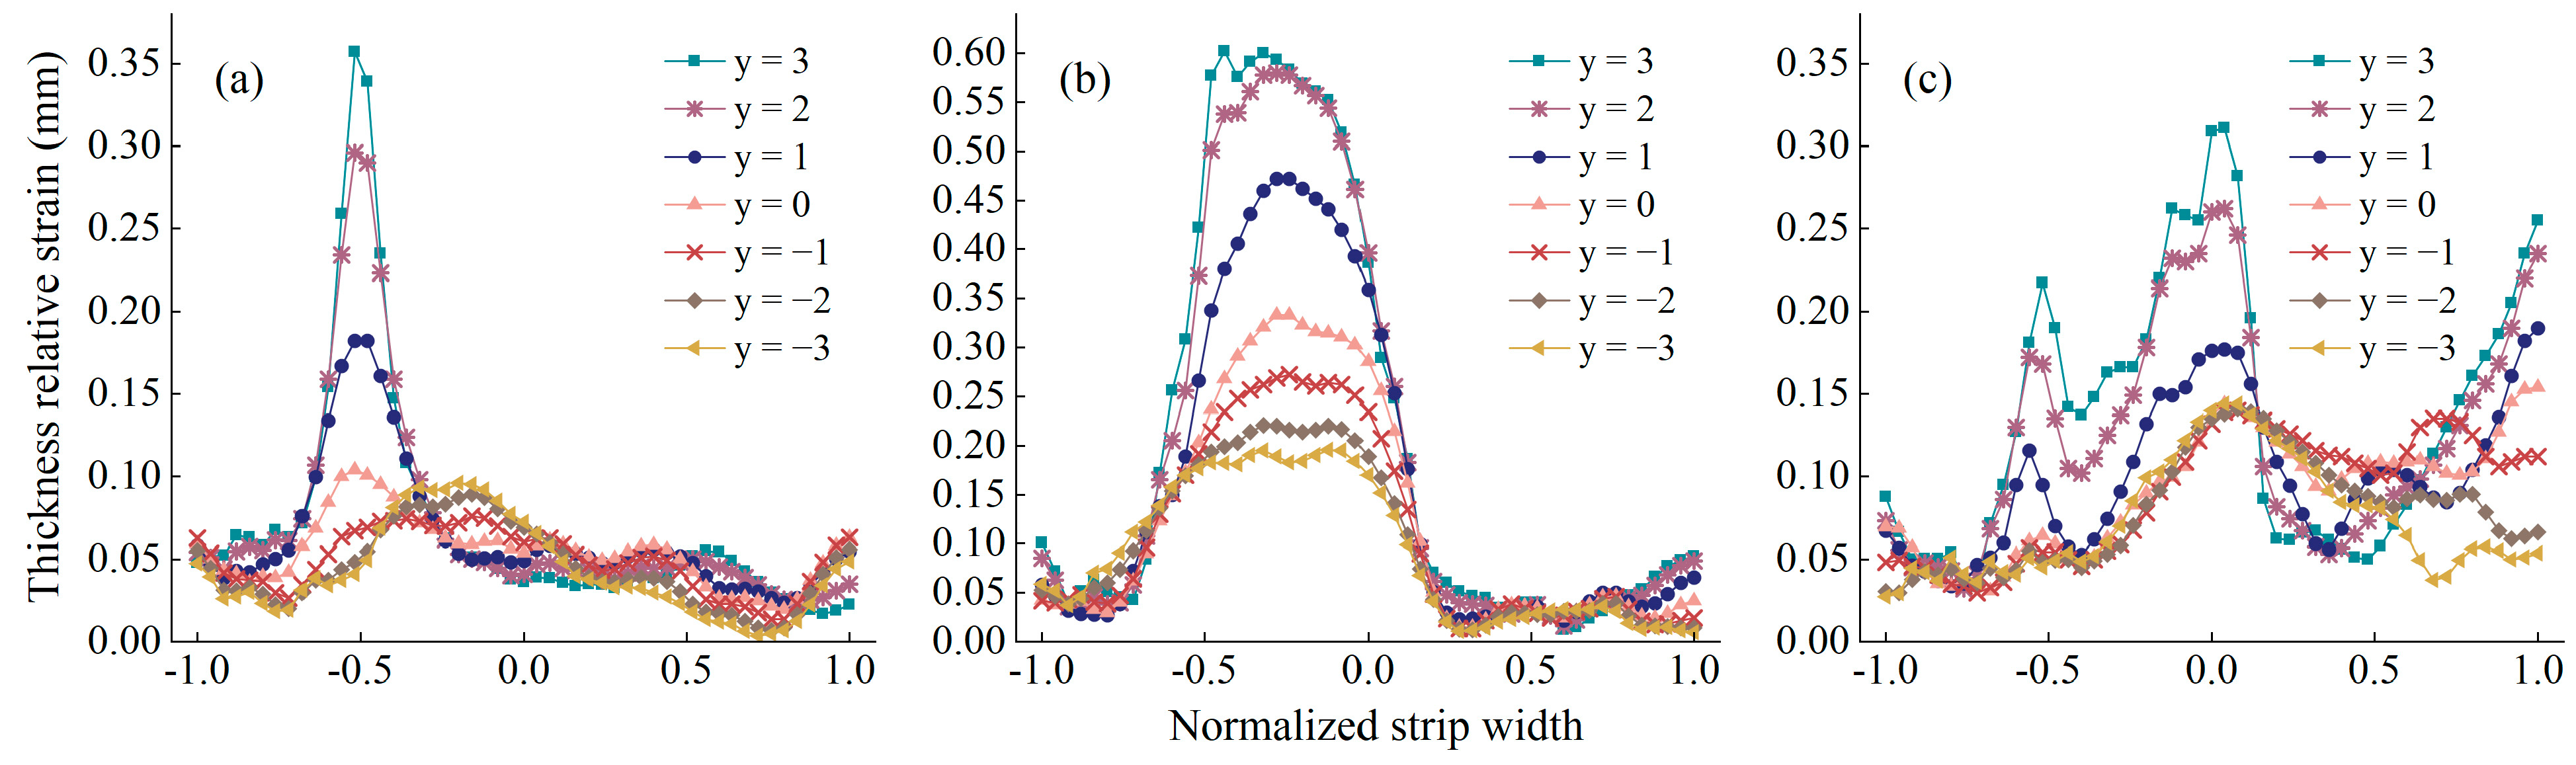
3.1.2. The Effect of Veneer Thickness in Defibering

The process of veneer defibering gives rise to a notable disparity in the dispersion of defibering deformation stresses across a range of veneer thicknesses. A detailed analysis is conducted on three models with veneer thicknesses of 4 mm, 5 mm, and 6 mm, respectively, under the conditions of a roller velocity of 650 mm/s and a roller gap of 1.5 mm. The specific analysis results are presented in Figure 8 and Figure 9. The distribution of stress within the deformation zone of the veneer defibering process is not uniform, and a notable concentration of stress is evident upon the entry of the roll teeth into the veneer in the fourth frame. During the continuous rolling of the pressing roller and the continuous bending of the veneer, the veneer undergoes elastic–plastic deformation, which results in a more uniform stress distribution. However, as the accumulation of stresses reaches a specific stage, the degree of strain gradually increases. At the conclusion of the roll pressing process, a certain degree of strain recovery occurs due to elastic deformation.
In comparison to the 4 mm thickness veneer, the 6 mm thickness plate exhibits a more pronounced stress concentration in the contact area between the roller teeth and the veneer, with the maximum equivalent stress extreme value increased by 19.8%. This is due to the fact that the thicker veneer employed in the actual roll-pressing process exhibits a robust resistance to deformation, and needs to rely on the roll teeth to provide a larger shear force. A 4 mm thick plate is relatively thin and exhibits poor deformation resistance, necessitating a smaller shear force. Conversely, thicker veneers in the defibering process accumulate greater kinetic and strain energies. As evidenced by the above analysis, an increase in plate thickness results in a greater inhomogeneity of strength distribution in the thickness direction. Therefore, it is essential to consider the influence of thicker plate material properties on the processing of such plates.
In order to gain further insight into the influence of plate thickness on the machining process, a number of key time points have been selected for detailed analysis of the stress field distribution, so as to clarify the specific effect of the force exerted by the roll teeth on the veneer. In particular, a model comprising a veneer thickness of 6 mm, a roller velocity of 600 mm/s, and a roller gap of 2.5 mm is selected for detailed analysis. Specifically, it is observed that at frame 4, the roll teeth begin to make contact with the veneer; at frame 7, the roll teeth penetrate further into the veneer; and at frame 10, the roll teeth are completely detached from the veneer. The equivalent stress nephograms for these three critical time points are presented in Figure 10. In the 3D coordinate system, the longitudinal section of the veneer (i.e., the section along the z-axis) is selected as the study object, as illustrated in Figure 10a. The y-axis coordinates are labeled in detail, and accordingly, the shape of the roll compression cross-section for the three keyframes was obtained, as shown in Figure 11. In Figure 11, the horizontal coordinates have been normalized in order to facilitate comparison between the cross-sections of varying lengths. The vertical coordinate records the relative displacement of the veneer on the y-axis, both before and after defibering, thereby enabling the visualization of the deformation pattern of the material along the y-axis direction during the defibering process.
The stress concentration is primarily evident in the contact area between the roll teeth and the veneer. The maximum equivalent stresses in the cross-section of the three keyframes are 774.39 MPa, 650.697 MPa, and 521.118 MPa, respectively. In order to achieve the desired effect of cracking the veneer, the roll teeth must generate a significant shear force in the entry phase. In the penetration phase stage, the teeth must continue to exert a shear force along the angle of the entry phase. Once this has been achieved, the roll teeth leave the veneer and complete the defibering process. The yield stress is observed to be higher in the surface layer and lower in the middle layer of the veneer, due to the inherent thickness characteristics of the material. The distribution of stress and strain is illustrated in Figure 10. The figure depicts areas of high stress and strain, represented by colors such as red, orange, and yellow, which correspond to regions where the roller teeth are embedded to a greater depth. In these areas, the stress state exceeds the maximum principal stresses that the veneer can withstand, resulting in damage to the veneer.

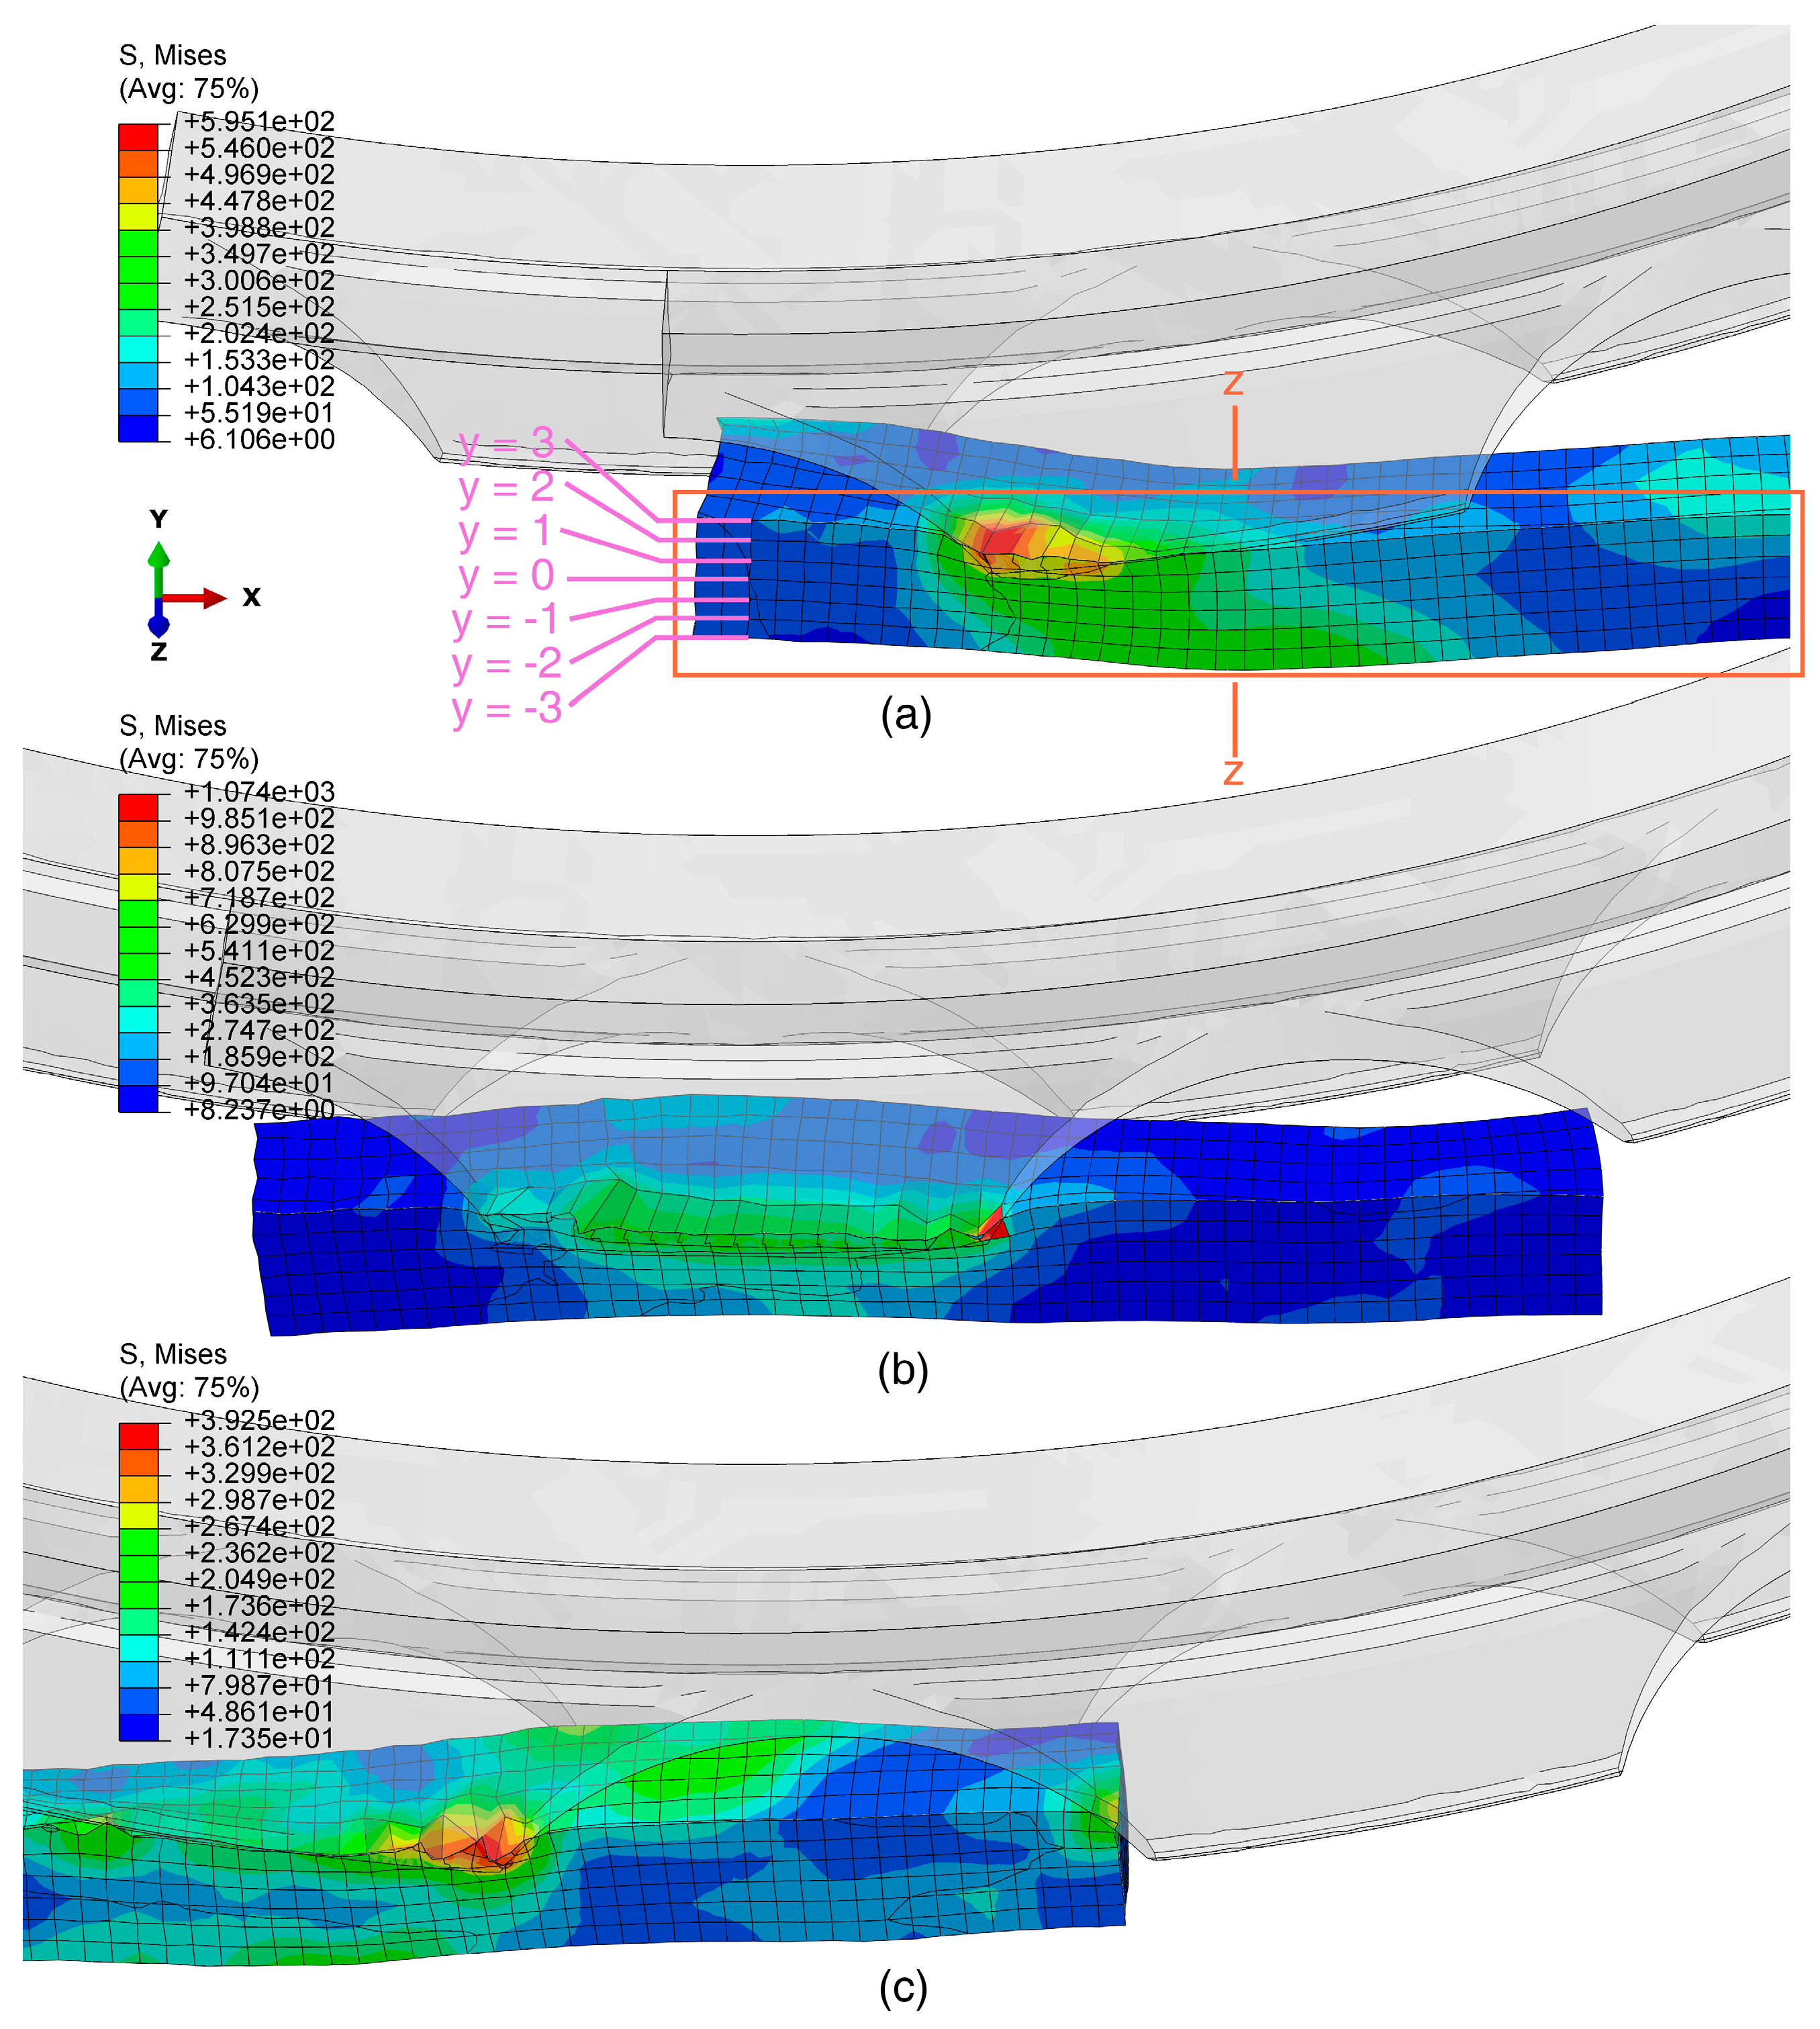
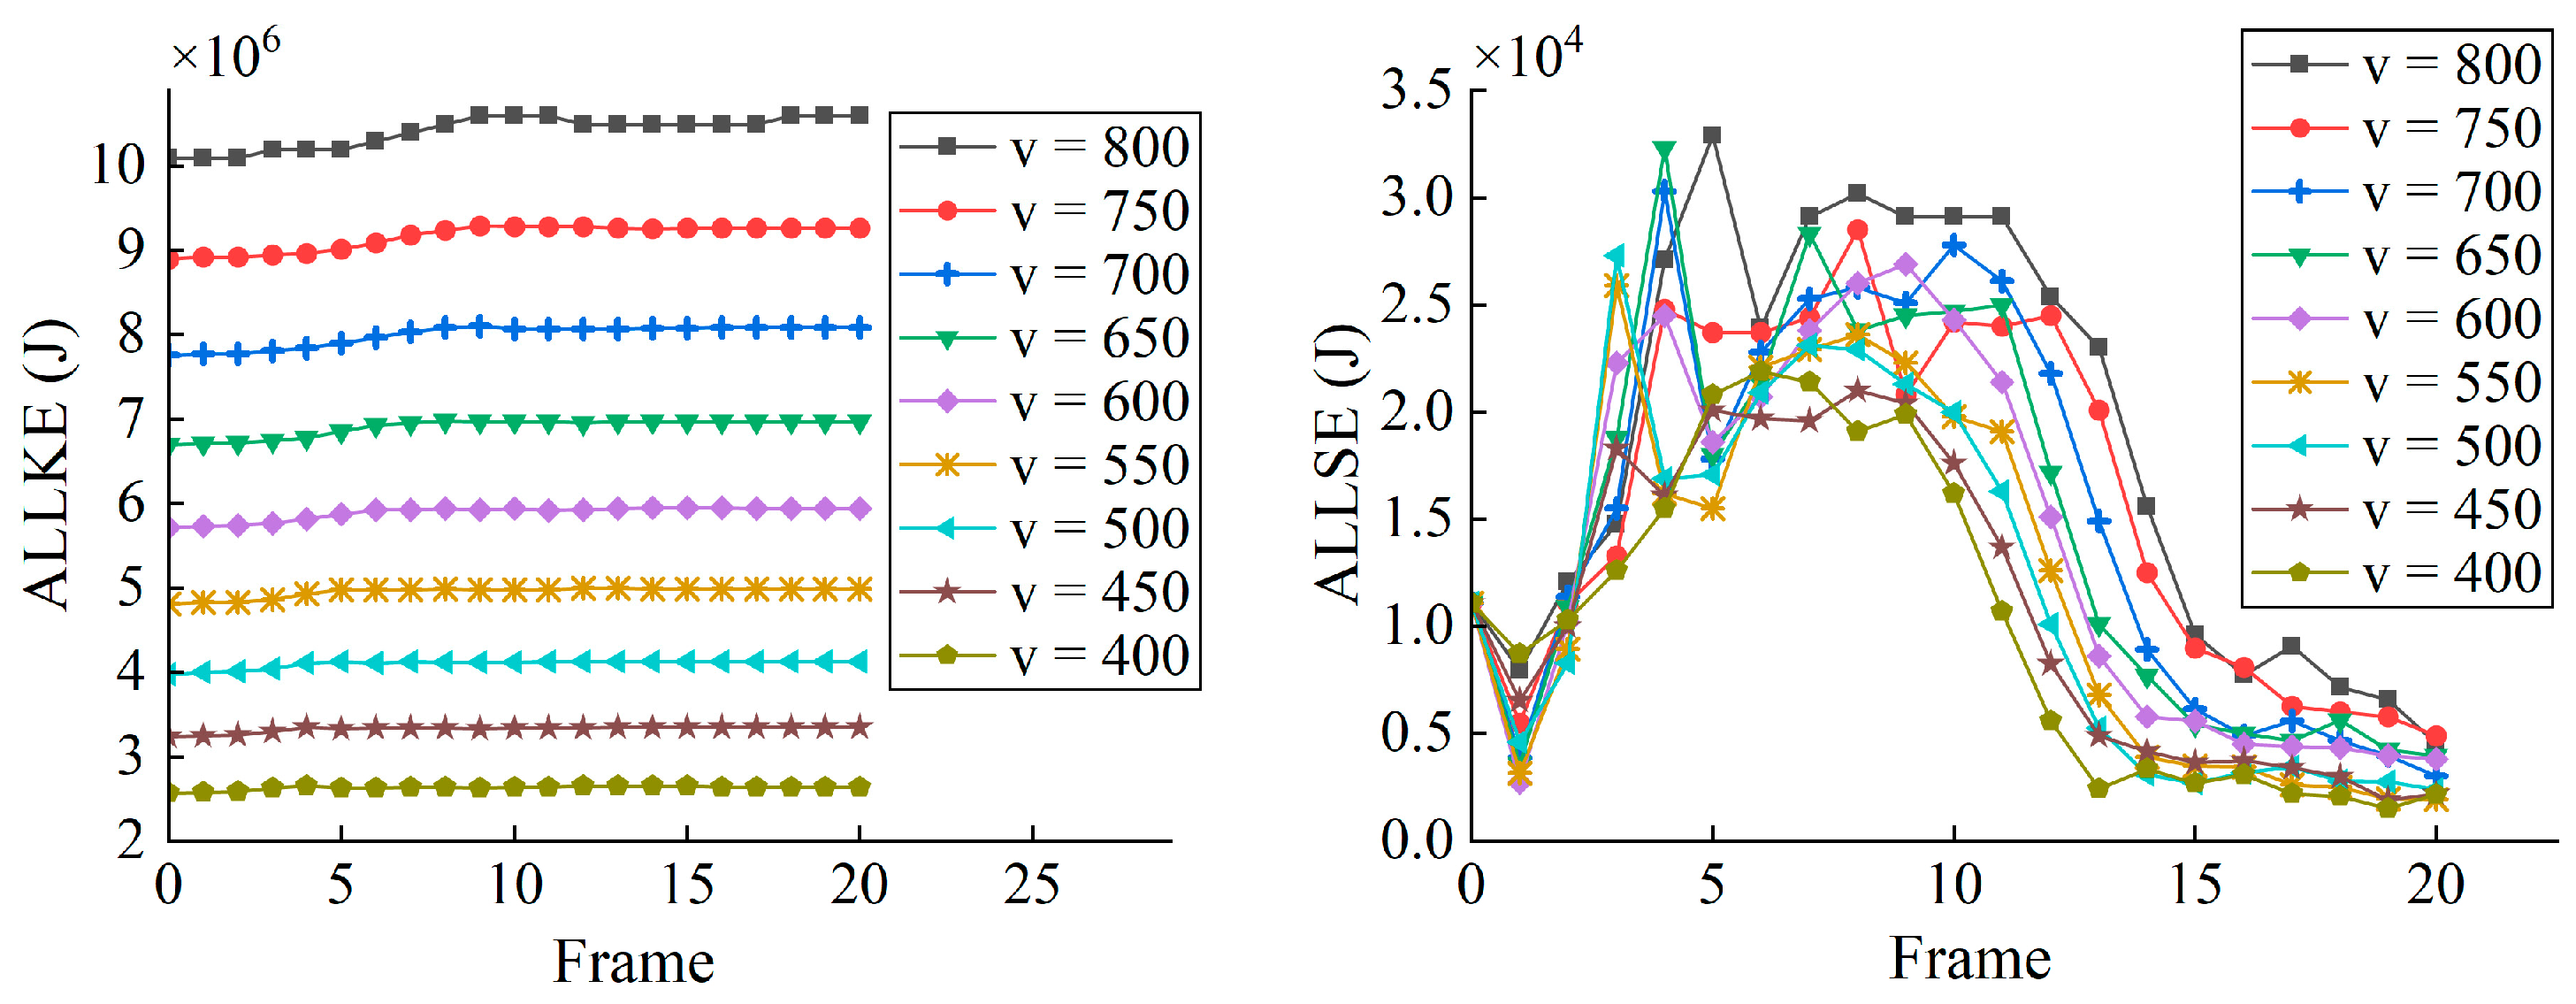
3.1.3. The Effect of Roller Velocity in Defibering

Processing speed affects the efficiency and quality of veneer defibering to a certain extent. Under the premise of ensuring the forming quality, it is important to increase the processing speed of veneer for actual production. The influence of roller velocity on the defibering of veneer is analyzed under the premise of a veneer thickness of 5 mm and roller gap of 2 mm. The velocity varies from 400 to 800 mm/s, with increments of 50 mm/s. The results are presented in Figure 12 and Figure 13. It can be observed that an increase in defibering speed results in a corresponding rise in the strain of the veneer. When the processing speed is within the range of 400 to 550 mm/s, the defibering effect of the veneer remains relatively unaffected. However, it is evident that as the processing speed increases, the stress and strain of the veneer also rise. Additionally, it can be seen that thicker veneers tend to accumulate greater kinetic energy and strain energy during the defibering process.

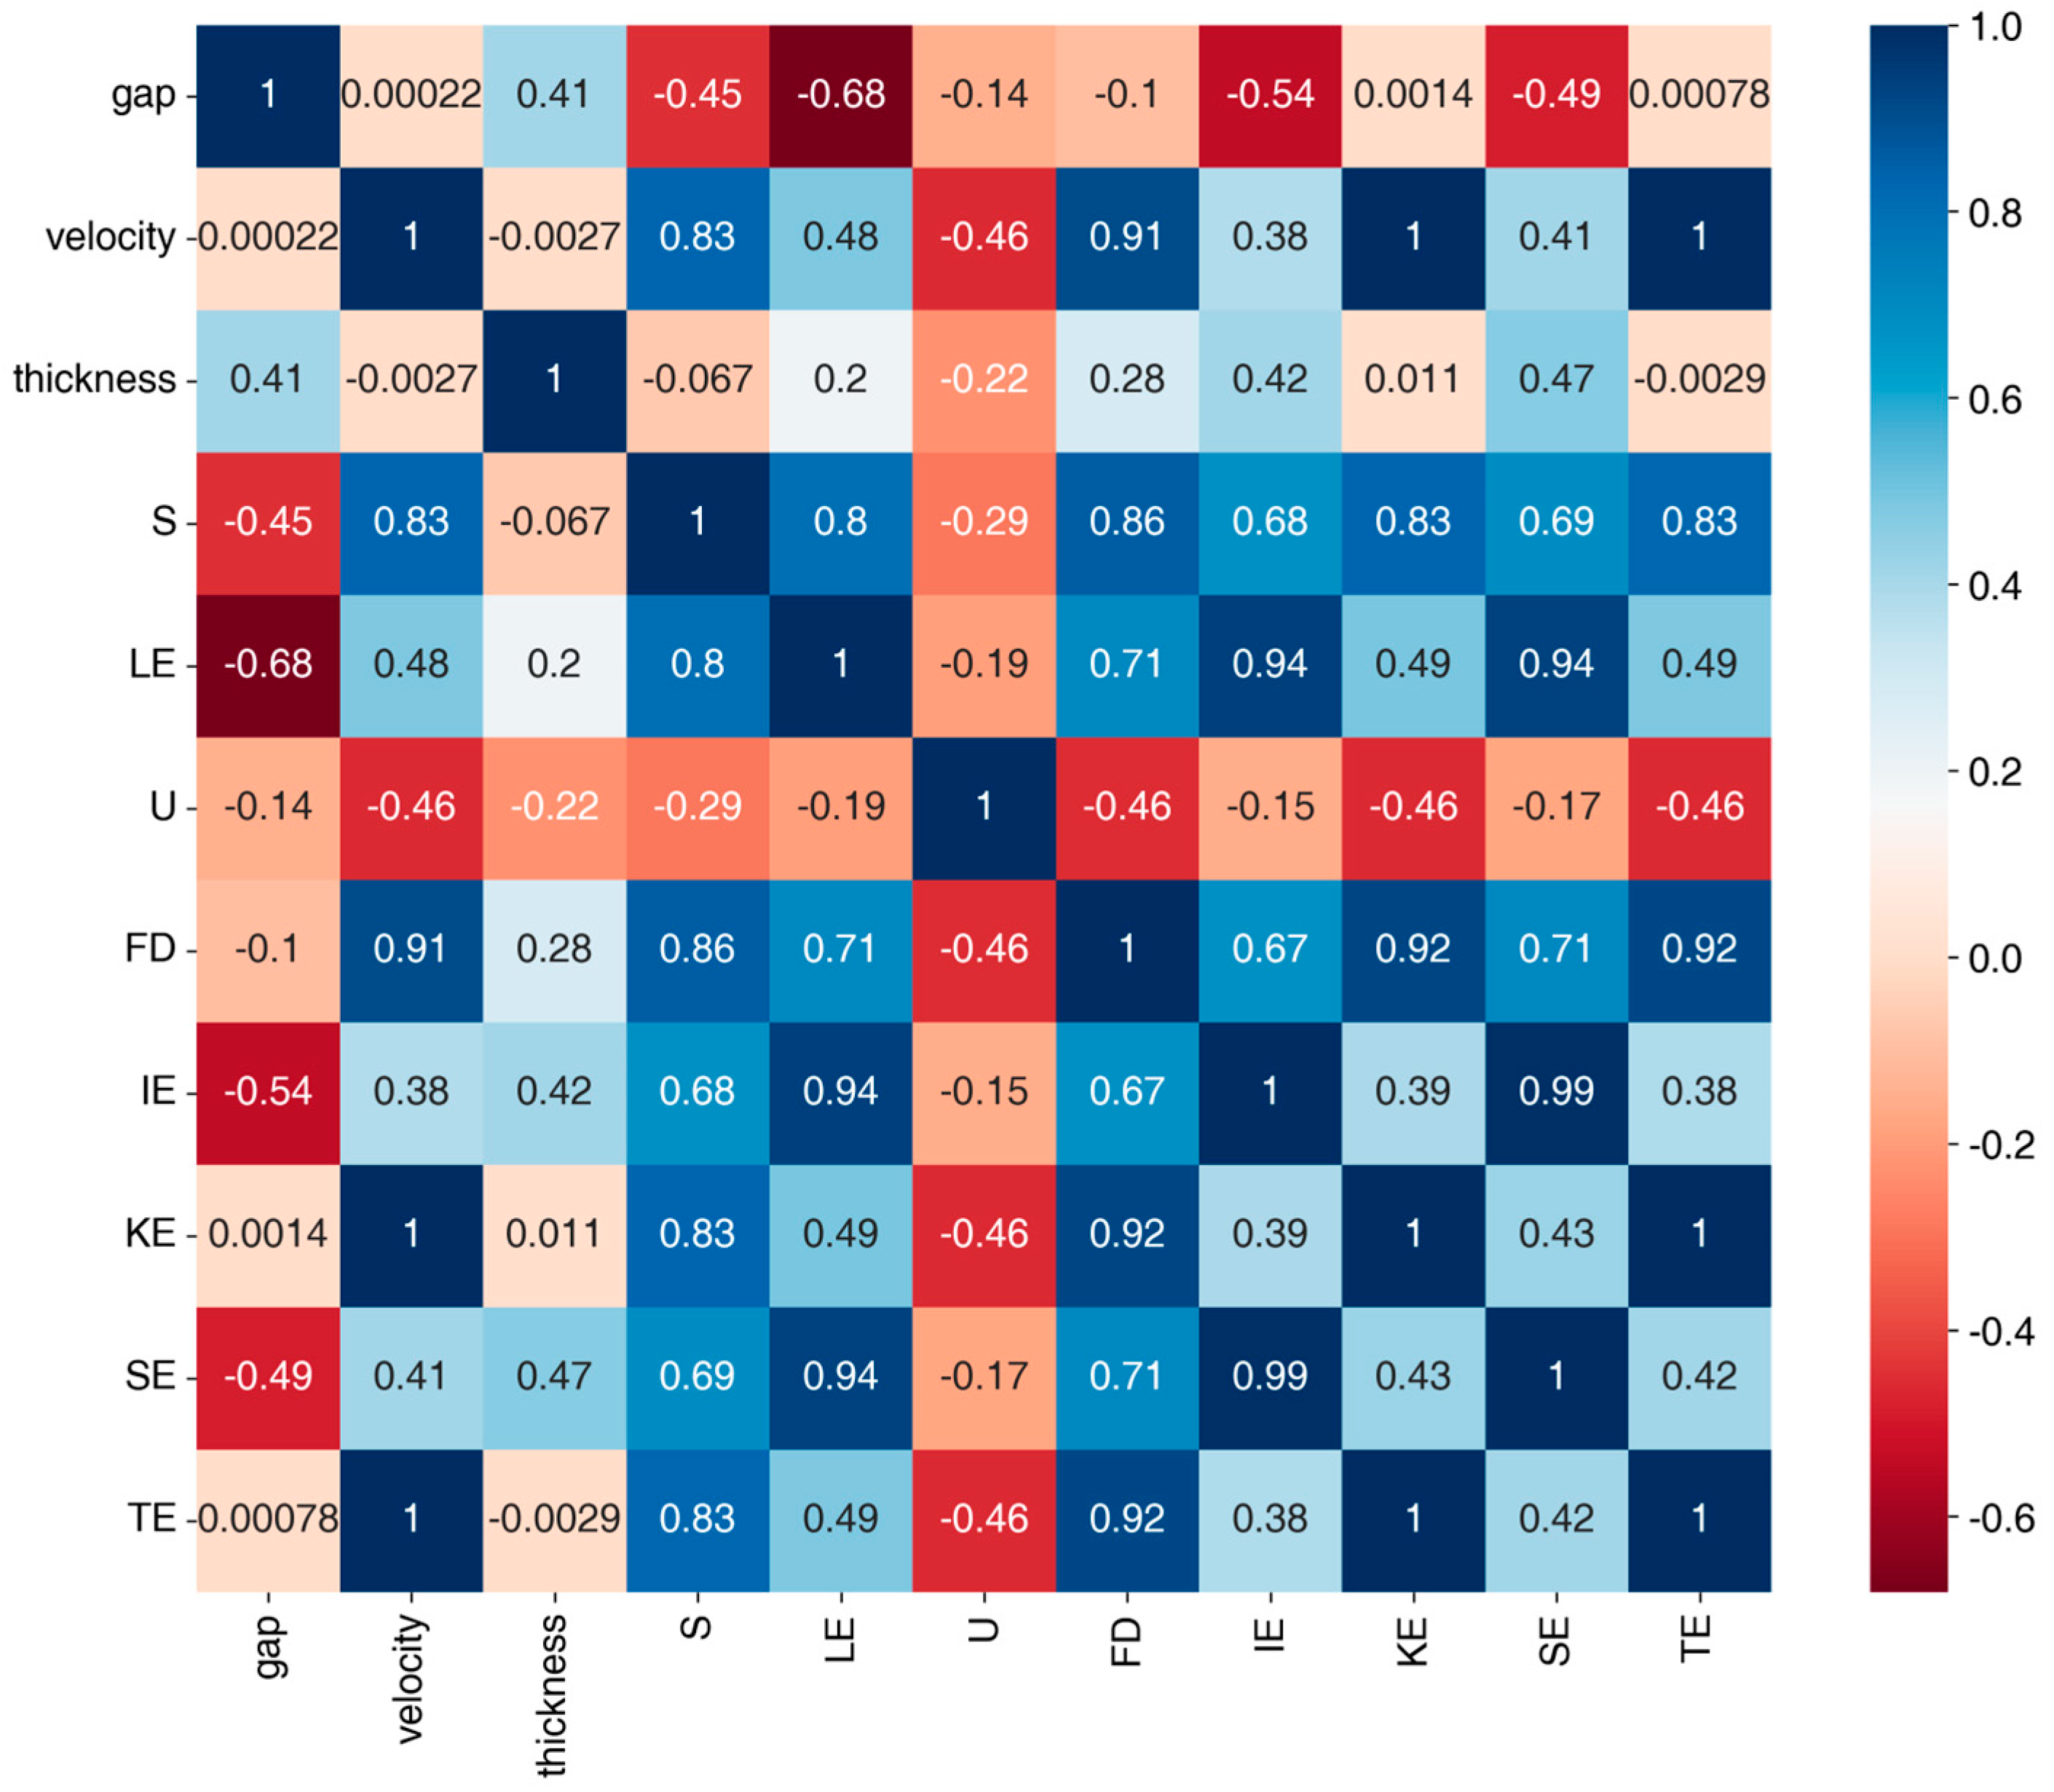
3.2. Feature Selection and Prediction Results Analysis

3.2.1. Dataset Generation and Modes Creation

A dataset for machine learning was generated based on the model setup conditions and simulation results of the numerical simulation. In the model setup, three key factors were selected as the condition variables: roller gap, roller velocity, and veneer thickness. The simulation results exported maximum principal stress, maximum principal strain, spatial displacement, frictional dissipation, internal energy, kinetic energy, strain energy, and total energy. The energy information was calculated as the mean of all frames. For maximum principal stress and maximum principal strain, the maximum value of each node was calculated for all frames, and the mean of all nodes was subsequently calculated. For spatial displacement, the displacement of each node of the veneer in the cross-section was calculated for the mean of all frames, and the mean of all nodes was further calculated. These 11 pieces of information collectively constituted a sample. The range of values for the variables is presented in Table 5.
The variance–covariance matrix (Figure 14) illustrates the pairwise correlation coefficients between the 11 variables, thereby elucidating the overall pattern of covariation of these variables. The examination of data pertaining to the principal variables involved in the rolled veneer process offers significant insights into the interconnections and dependencies between these variables within the system. This contributes to a more profound comprehension of the dynamic nature of the process. In particular, the results of the analyses indicate numerous instances where there is a high degree of positive correlation between variables, as clearly demonstrated by the blue square data in Figure 14.
A significant positive correlation is observed between velocity and FD, with a coefficient of 0.91. Similarly, a strong positive correlation is evident between velocity and KE and TE, with coefficients of 1. These findings can be interpreted from a physical standpoint. The effects of friction are proportional to the relative velocity. An increase in roller velocity between the contact surfaces of the pressing roller and the veneer results in a greater degree of frictional action, which in turn generates more frictional energy. Additionally, the mechanical properties of the veneer, including roughness, and other factors influence the magnitude of FD. According to the equation E k = 1 / 2   m v 2 , which involves kinetic energy E k , mass m , and velocity v , any change in roller velocity will be reflected in a corresponding change in kinetic energy. There is a high positive correlation between velocity and S, with a coefficient of 0.83. The experimental poplar veneers display both viscoelastic and plastic behaviors. As the roller velocity increases, the veneer exhibits a higher stress response due to a faster deformation rate.
The alteration in roller velocity directly results in a corresponding change in the total energy, as kinetic energy constitutes the majority of the total energy present during the defibration process. The calculation of SE and IE is based on the same stress, strain, and displacement fields, which results in a strong positive correlation between the two, with a coefficient of 0.99. Furthermore, a significant positive correlation is observed between TE and FD, with a coefficient of 0.92.
This section of the study proposes the utilization of feature selection (Modes) to reorganize the original data in accordance with the feature and target categories, with the objective of enhancing the performance of the learning algorithm by reducing the dimensionality of the dataset. As illustrated in Figure 14, there are several variables with a high degree of correlation (coefficient > 0.9), and the input features are optimized by reducing such variables in order to improve the computational efficiency. Additionally, Table 6 depicts the selection of distinct variables as both features and targets for machine learning. In certain modes, if a highly positive correlation is observed between two simulation result variables, only one of the variables is retained in order to enhance computational efficiency. In particular, when the target variable is set to LE (Mode 1-x) or U (Mode 2-x), the method will predict the veneer defibering effect. In the event that the target variable is set to S (Mode 3-x), the method will predict the change in stress under specific conditions. In order to align with the objective of intelligent regulation of roller gap and roller velocity in a real production environment, the target variables gap or velocity (Mode 4-x) are predicted.

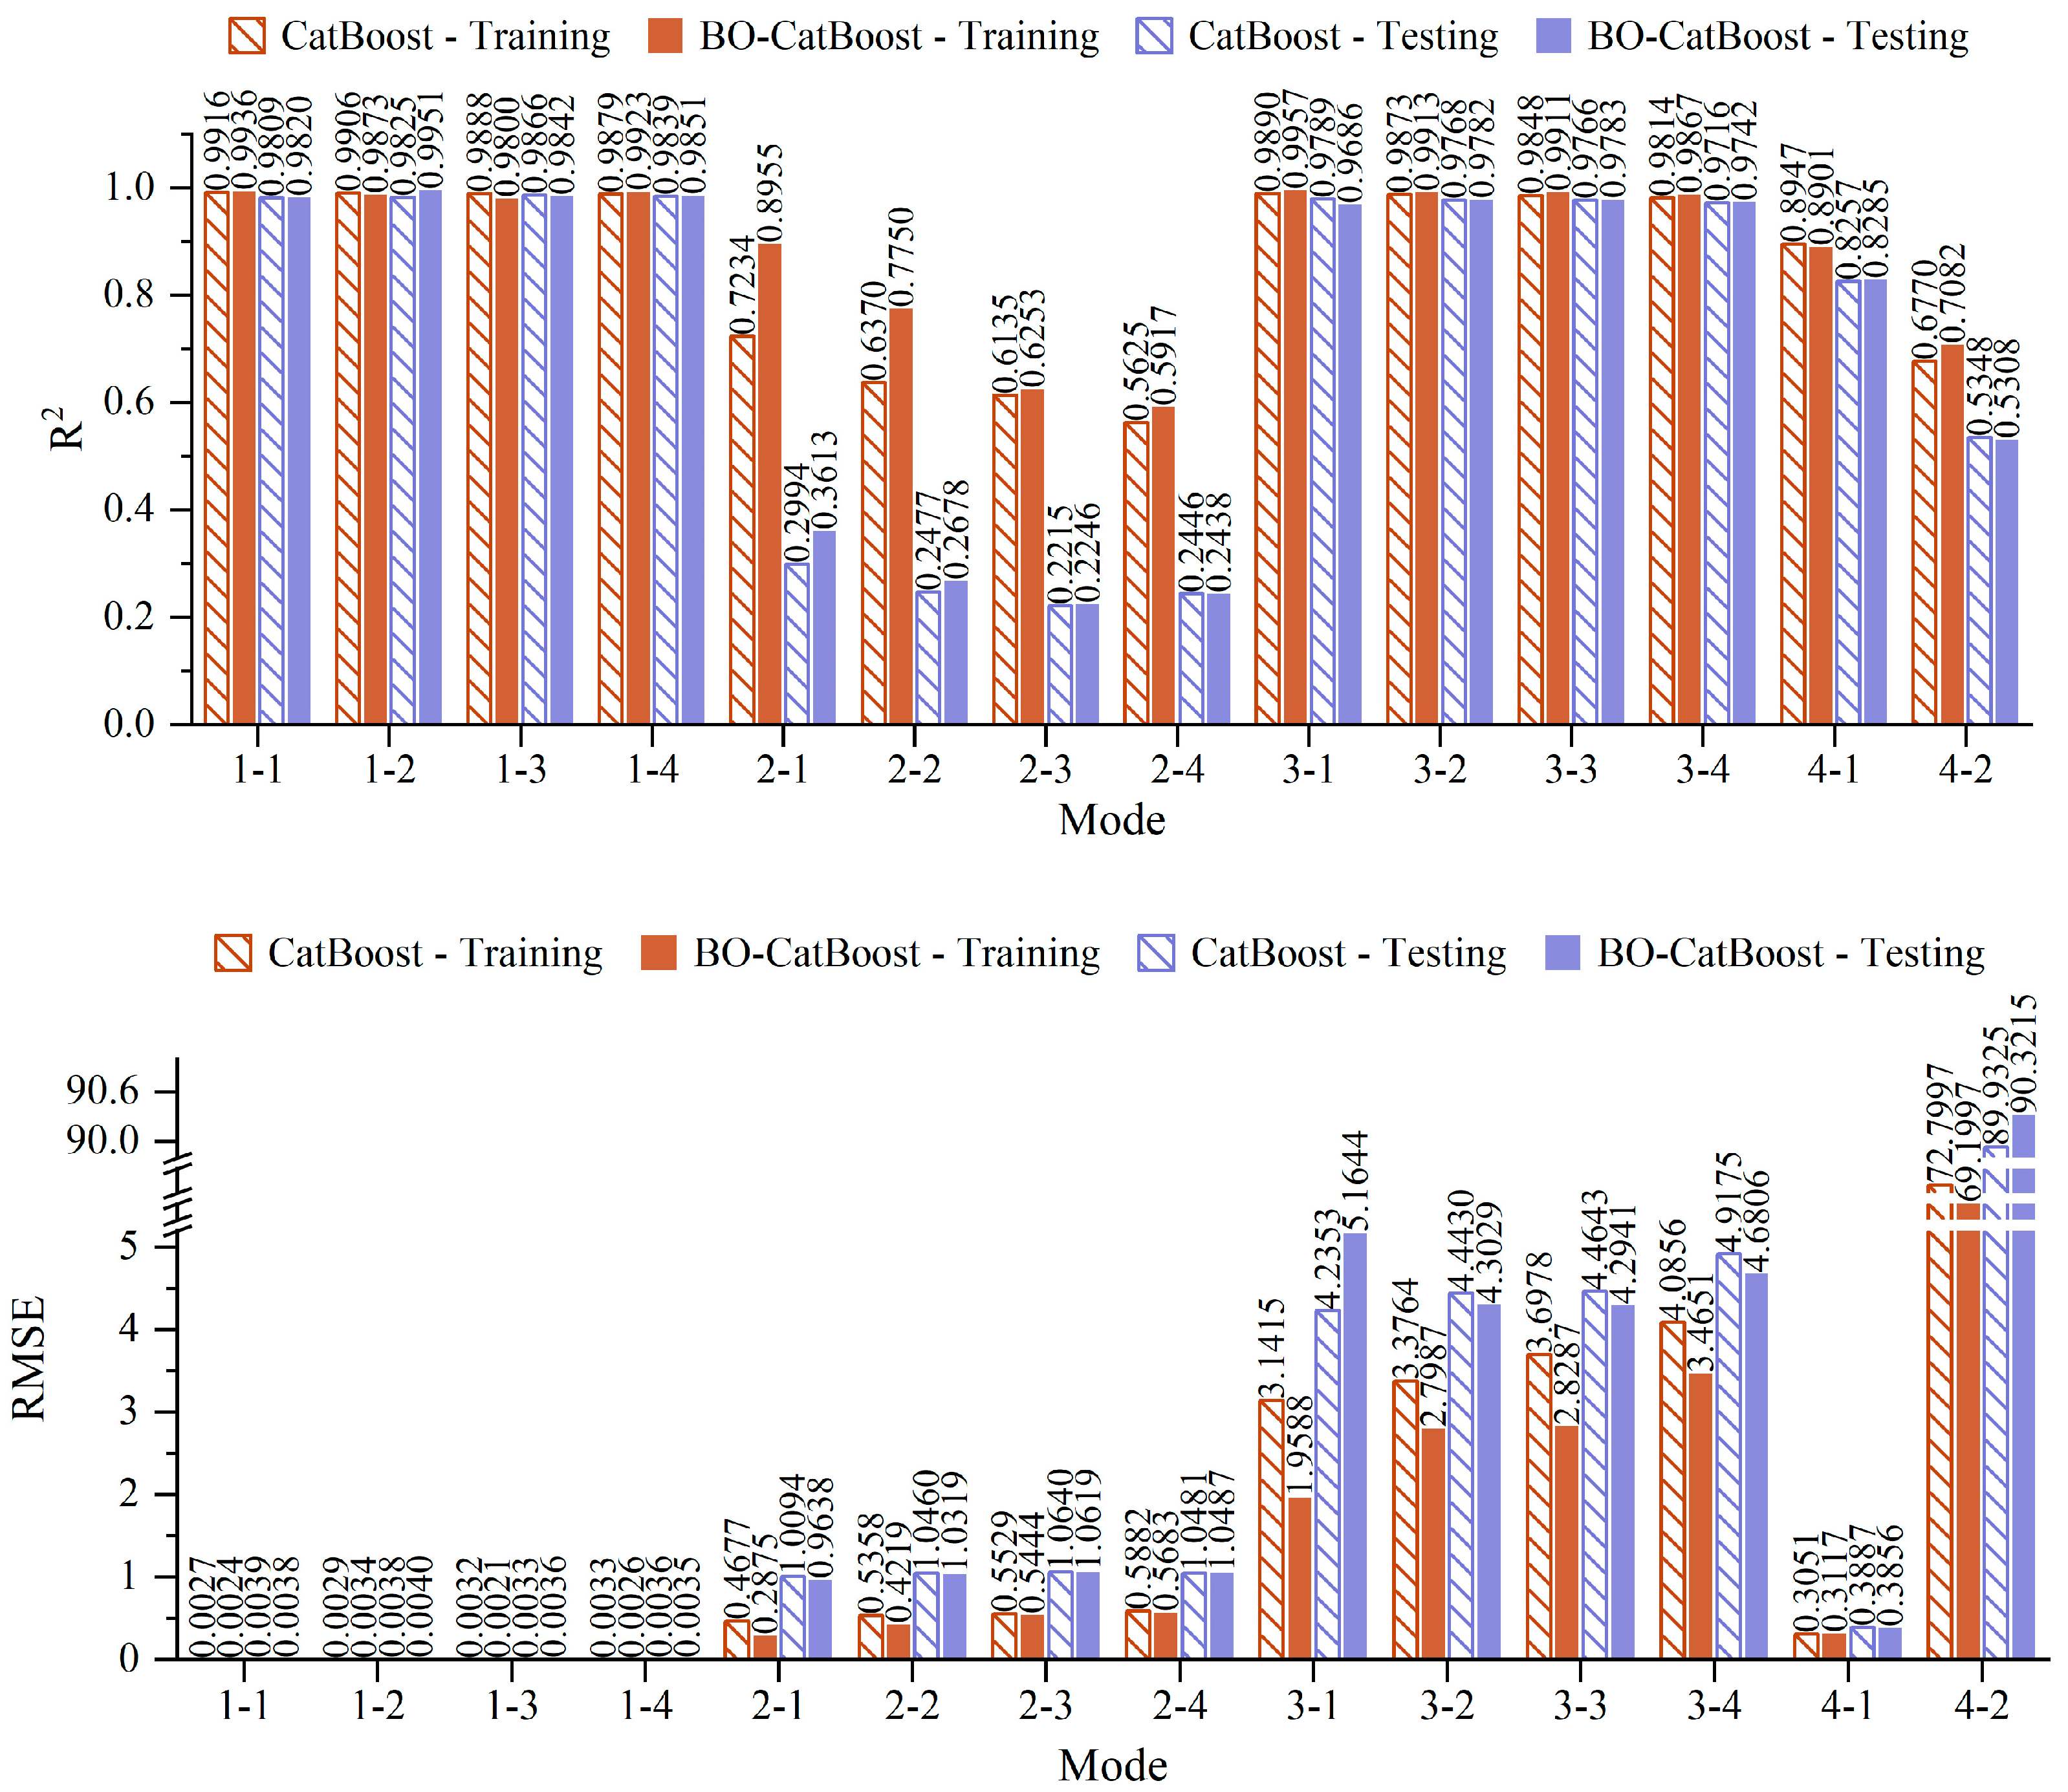
3.2.2. Performance Analysis Before and After Hyperparameter Optimization

This subsection involves the examination of the efficacy of training the CatBoost model on a dataset comprising disparate input and output variables, and assessing the plausibility of the various model configurations based on the feature selection table in Table 6. In order to validate the effectiveness of the model, the dataset was subjected to exhaustive analysis and visualization in order to assess its feasibility. In each test mode, the dataset was divided into an 80% training sample set and a 20% testing sample set. The impact of hyperparameter optimization on the performance of the CatBoost model was evaluated by comparing the performance of the optimized hyperparameters with that of the default hyperparameters. The combined results for the 14 modes are presented in Figure 15 and Table 7. The outcomes of seven pivotal hyperparameter investigations are illustrated in Table 8, with the remaining hyperparameters configured to their default values. The findings demonstrate that the optimized hyperparameters exert varying degrees of positive influence on the training and testing performance of the model.
In the datasets Mode 1-x and Mode 3-x, CatBoost has previously demonstrated robust performance prior to the BO of hyperparameters. This can be attributed to the high correlation observed between the predictive model variables of LE and S. As a result, the R 2 values of the optimized models exhibited a slight improvement, though not a considerable one. Nevertheless, the BO hyperparameter optimization resulted in a notable enhancement in the RMSE for Mode 3-x. For instance, the RMSE of the training set for Mode 3-2 reduced from 3.3764 to 2.7987, while the RMSE of the test set decreased from 4.4430 to 4.3029. Similarly, for Mode 3-3, the RMSE of the training set reduced from 3.6978 to 2.8287, and the RMSE of the test set reduced from 4.4643 to 4.2941. In a 5-fold cross-validation evaluation comparing the pre- and post-optimization models, BO similarly improved the performance and generalization of the models for both sets.
The BO hyperparameter optimization strategy has been demonstrated to result in a notable enhancement in the performance of the CatBoost model in both Mode 2-1 and Mode 2-2 prediction tasks for U. In particular, for Mode 2-1, the R 2 of the training set improved from 0.7234 to 0.8955, while the RMSE reduced from 0.4677 to 0.2875; on the test set, the R 2 increased from 0.2994 to 0.3613, while the RMSE reduced from 1.0094 to 0.9638. Similarly, in Mode 2-2, the R 2 of the training set improved from 0.6370 to 0.7750 and RMSE decreased from 0.5358 to 0.4219; on the test set, R 2 improved from 0.2477 to 0.2678, and RMSE decreased from 1.0460 to 1.0319. However, in the Mode 2-3 and Mode 2-4 prediction tasks, the tuning of the CatBoost model by the BO hyperparameter optimization had a limited effect, and no significant improvement in model prediction performance was observed.
Although it was generally accepted that R 2 > 0.7 would be an acceptable result for models with high residual data [42], the Mode 2-1 and Mode 2-2 test sets did not perform as well as the training set. By monitoring key metrics throughout the training process, potential issues such as overfitting, excessive model complexity, and improperly set hyperparameters were identified and addressed. Further analysis revealed that this phenomenon might be attributed to the low correlation between the features and the target. In particular, the extent of spatial displacement in the numerical simulation was a crucial aspect that not only reflected the shape change but also illuminated the alteration of the internal microstructure. This was intimately associated with the dynamic response of the model and the structural stability. However, the poor prediction of U also indirectly indicated a lack of regularity in the change in surface cracks on the veneer structure, which was consistent with the actual experimental observations. Consequently, the Mode 2-x case would not be analyzed in subsequent analysis.
In the gap prediction task, the CatBoost model demonstrated superior performance with minimal adjustment to the BO hyperparameter optimization. Prior to and following the optimization, the model exhibited the highest performance metrics on both the test and training sets, with R 2 = 0.8947 and RMSE = 0.3051, respectively. However, in the prediction of velocity, although the BO hyperparameter optimization significantly enhanced the performance of the CatBoost model, resulting in an increase in R 2 from 0.6770 to 0.7082 and a decrease in RMSE from 72.7997 to 69.1997 for the Mode 4-2 training set, the overall prediction of the model remained unsatisfactory. It was hypothesized that this could be due to the influence of additional factors, such as veneer moisture content and tree species, on roller velocity in practice. Consequently, it was decided not to conduct a detailed analysis of the Mode 4-2 case in subsequent investigations.
Figure 16 illustrates a scatter plot with regression lines for the predicted and actual values of the five optimized mode models. Each data point in the scatter plot represents an observation, with the horizontal axis representing the simulated value and the vertical axis representing the corresponding predicted value. The closer the points are to the regression line, the more accurate the predictive performance of the model. As can be seen from the scatterplot and the regression line, the models for LE and S have high prediction accuracy, with most points close to the regression line. The prediction for gap has a regularity, although the accuracy is not as good.

3.2.3. Interpretability Analysis Using SHAP Values

Ensemble learning algorithms must achieve an appropriate equilibrium between interpretability and performance, in accordance with the particular requirements of applications. The scenario under consideration in this study entails specific requirements with regard to interpretability. The non-linear relationship between different input features and the target variables of the BO-CatBoost-based veneer defibering prediction model was revealed using the SHAP method in this subsection. Figure 17 illustrates the impact of modifying the input features on the SHAP values of the strains. The features are listed in order of importance from top to bottom. The color trends demonstrate not only the positive and negative correlations between strain and the input variables, but also indicate that if the SHAP values are predominantly concentrated around 0, it signifies that these features exert a minimal influence on the strain. Figure 17a–h illustrate the correlation trends between strain and stress with each input variable in the models trained with full input variables and selected partial variables. In particular, internal energy, strain energy, and roller gap have a greater effect on strain; conversely, veneer thickness, strain energy, and internal energy have a smaller effect on stress. All other factors have a significant effect on stress. Upon a reduction in the input variables, the influence of the same variables on different models varies. Roller gap consistently exerts a significant impact on strain, whereas roller velocity and veneer thickness exert an influence on strain intermittency. Conversely, roller velocity consistently exerts a significant impact on stress, while veneer thickness exerts a negligible influence on stress. Table 9 compares some of the models studied based on the training time, and the results demonstrate that Mode 1-4 and Mode 3-4 exhibit a slight reduction in accuracy but an improvement in execution efficiency. Furthermore, the selection of fewer input variables results in a reduction in model complexity.

4. Conclusions and Prospects

This paper proposed a prediction method for characteristic parameters of veneer roller pressing and defibering, with the ABAQUS software used to create a simplified model of rolled veneer by a pressing-roller unit. The simulation analysis was based on three key structural factors, namely roller gap, roller velocity, and veneer thickness. A total of 702 sets of simulation experiments were conducted using the exhaustive enumeration method, and the influence of each factor on the stress–strain in the process of veneer defibering was analyzed in detail. The simulation results were further correlated with the veneer force and veneer deformation in defibration processing. The results demonstrated that the roller gap exerted a considerable influence on the deformation of the defibered veneer, the thickness of the veneer directly affected the force exerted on the veneer during the roll-pressing process, and the processing speed determined the defibering effect of the veneer to a certain extent. Furthermore, an analysis of the longitudinal section of the force application process of a single roller tooth on a veneer allowed the influence of the plate thickness on the machining process to be elucidated. This paved the way for the subsequent study of the effect of tooth depth on the defibering effect.
A dataset for machine learning was generated based on the model setup conditions and simulation results of the numerical simulation. In this dataset, the strains and spatial displacements obtained from the simulation were plotted against the defibering effect of the actual veneer, while the stress values obtained from the simulation were plotted against the forces in the vertical direction of the veneer. Fourteen different dataset models were constructed on the original dataset based on the results of data correlation analysis, in order to optimize the combination of input variables for subsequent analyses and to predict five parameters, including strain, spatial displacement, stress, roller velocity, and roller gap.
This study provided a comprehensive exploration of the application of the CatBoost model using the BO of hyperparameters in the prediction of characteristics parameters with rolled veneer. Through a comparative analysis, models with outstanding performance in predicting strain, stress, and roller gap were selected and subjected to further analysis to ascertain the characteristic importance by the SHAP method. The findings can be summarized as follows:
  • BO-CatBoost improved the model performance to varying degrees, significantly improving the R 2 and generalization of the model and reducing the prediction error.
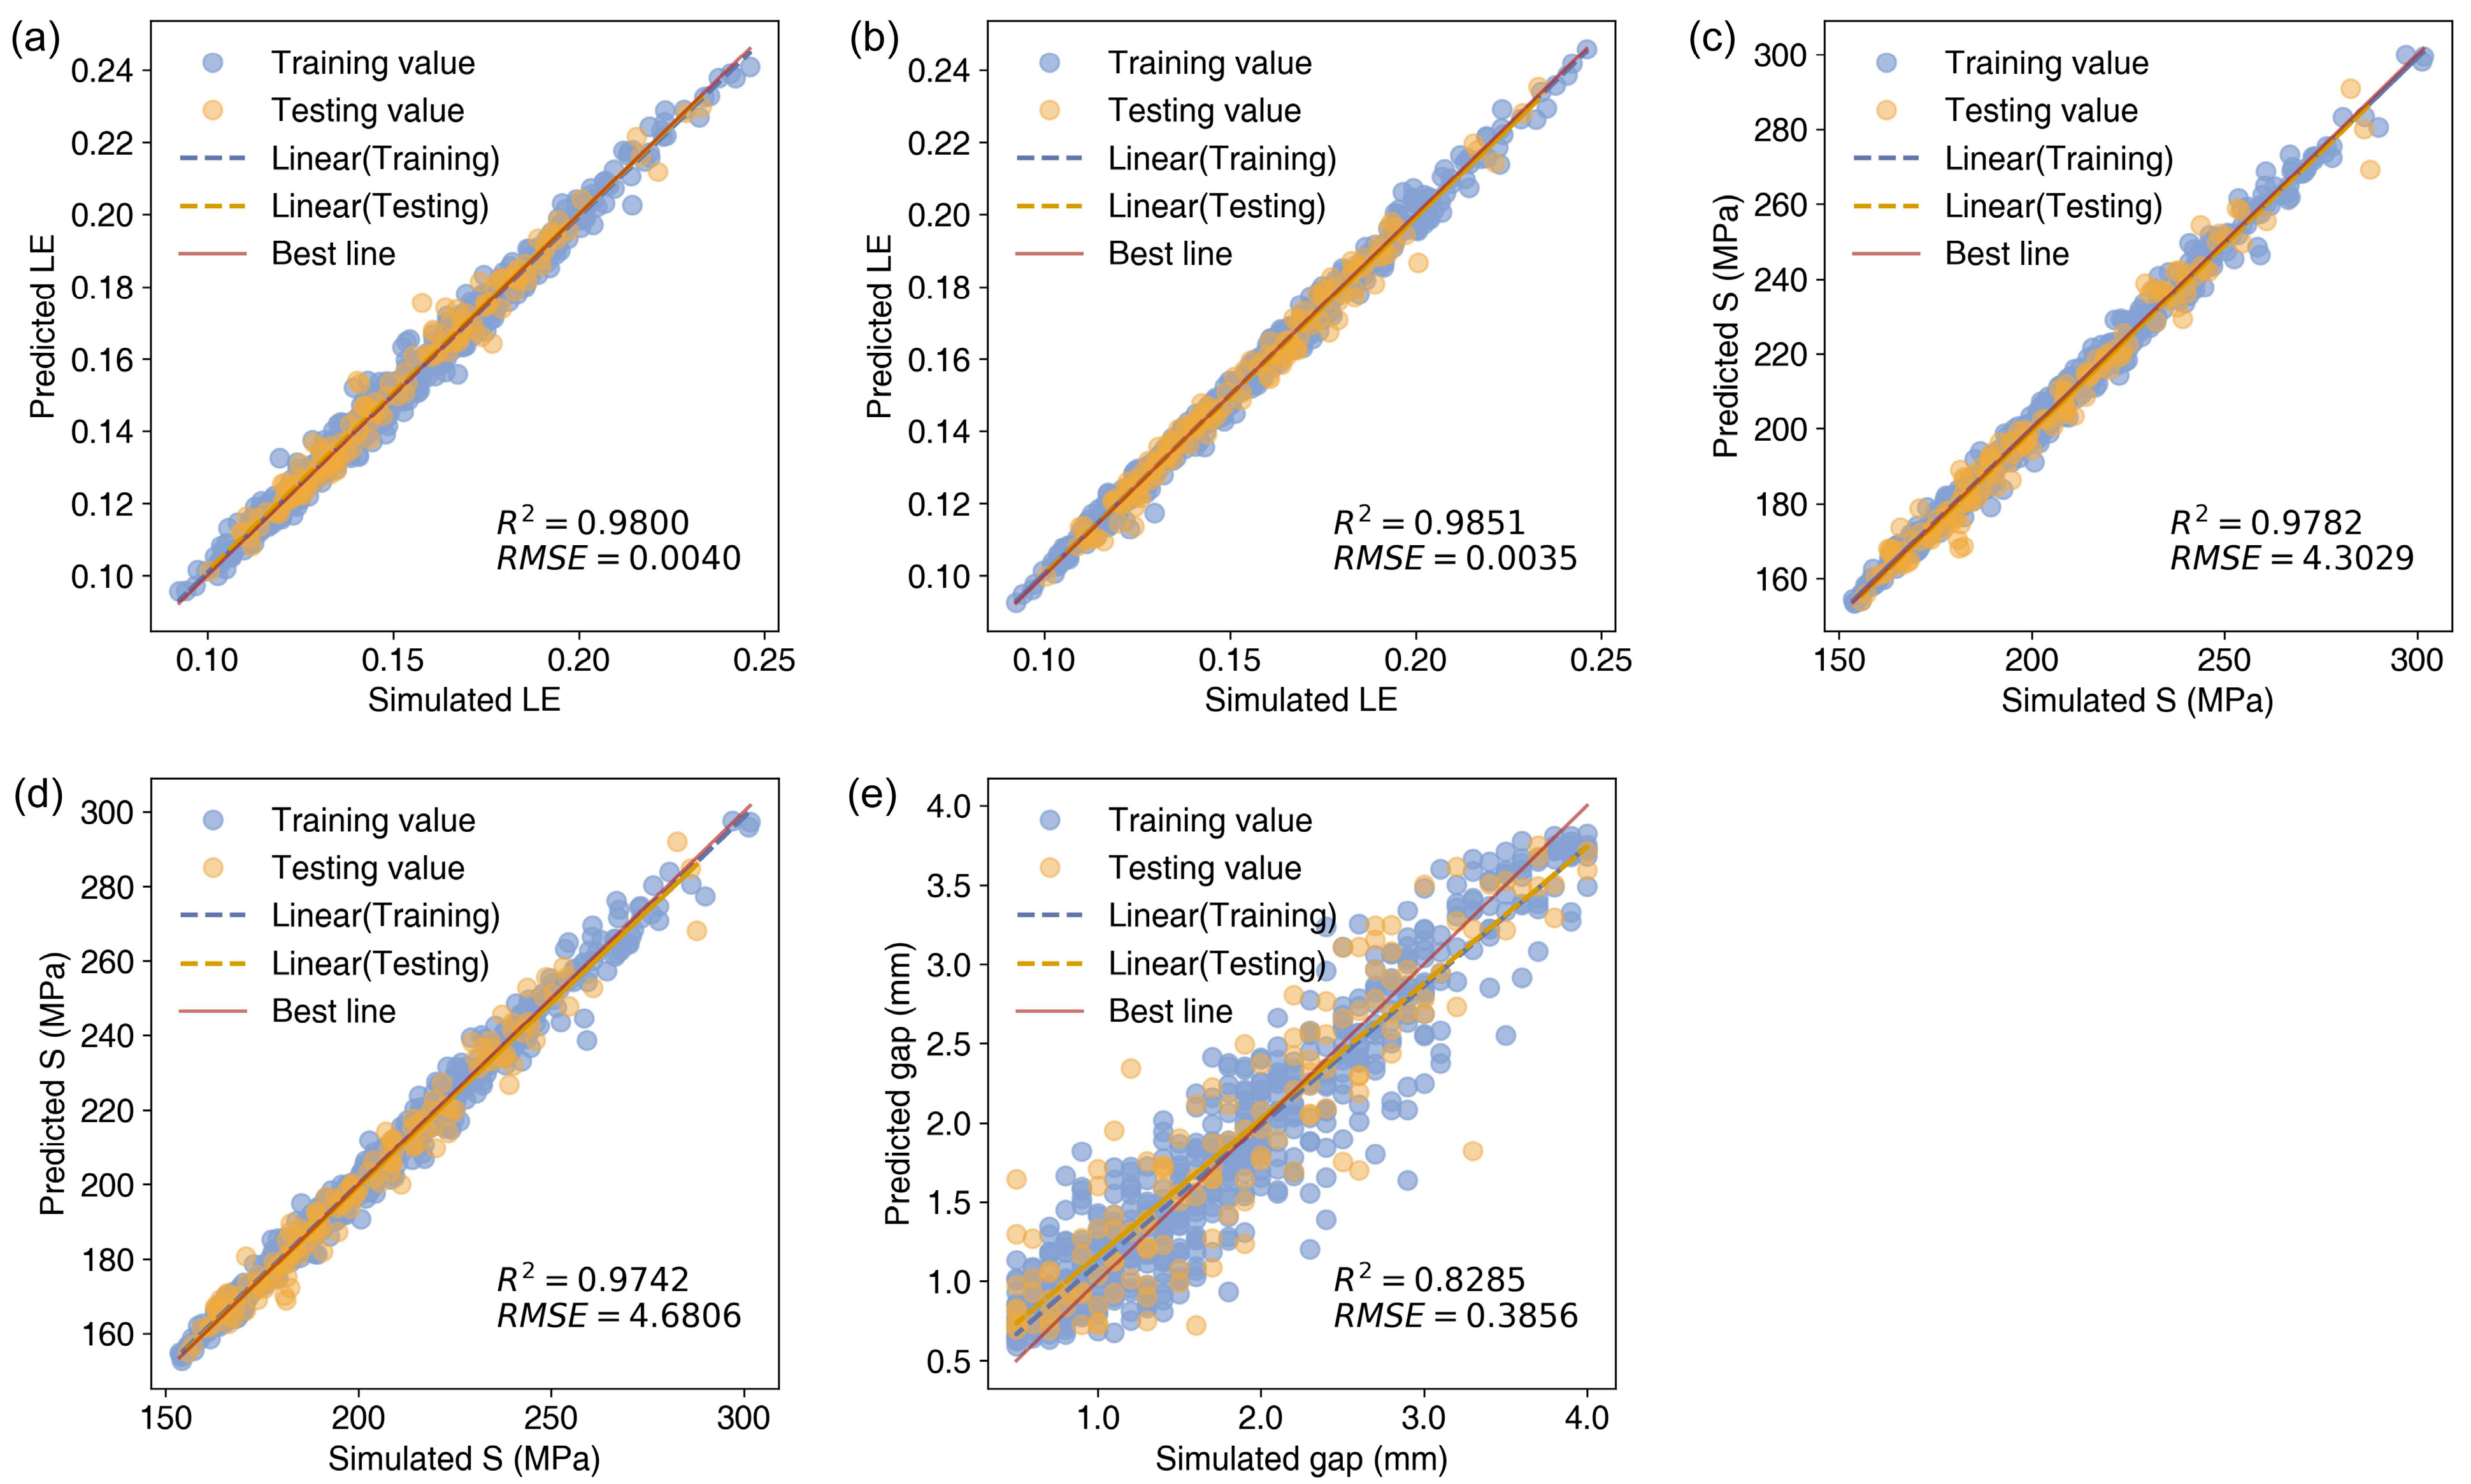
  • The model demonstrated notable efficacy in strain prediction, attaining an R 2 of 0.98 for both the training and test sets, with a mean value of 0.9 or greater for the 5-fold cross-validation results. The R 2 for stress prediction also reached 0.97. However, the 5-fold cross-validation results indicated that the model’s generalization ability required improvement.
  • In practical applications, the roller gap prediction may also take into account factors such as the tree species, the moisture content of the veneer, and changes in width and thickness before and after defibering. Despite there being few features related to roller gap prediction in the current simulation, the method demonstrated excellent prediction performance, thereby underscoring its potential for application in intelligent decision-making systems.
  • By reducing the number of input features when predicting the same goal, it was possible to analyze the correlation between features. The model was also observed to exhibit reduced complexity and enhanced execution efficiency while maintaining the fundamental performance characteristics. The optimal input feature combinations were Mode 1-4 and Mode 3-4.
  • The analysis of the input characteristics of the prediction model based on the SHAP algorithm revealed that the influence of different variables varies across different models. To illustrate, roller gap exerted a considerable influence on strain, whereas roller velocity exerted a more pronounced effect on stress, and veneer thickness exerted a comparatively lesser effect on stress.
  • The prediction model of veneer defibering key parameters, established by applying the BO-CatBoost algorithm, could accurately evaluate the key variables, thereby providing crucial data reference and theoretical support for the realization of online regulation of the roller defibering process.
In conclusion, this study represents a pioneering application of numerical simulation technology and ensemble learning to the defibering roller process of poplar veneer, offering a theoretical analysis that advances the state of knowledge in this field. The findings of this study offer substantial practical implications for the intelligent advancement and enhancement of defibering equipment systems in the future, in contrast with the conventional trial-and-error approach and empirical methodology employed in the testing of defibering equipment. The study also provides the potential for anticipating the impact of veneer defibering and for making intelligent and precise adjustments to critical processing parameters.
In future work, we will further investigate the impact of defibering rollers with varying tooth depths on the repeated roll pressure of veneer. Additionally, we will conduct a comprehensive analysis of the mechanical properties parameters of poplar wood, including but not limited to factors such as moisture content and tree species. Furthermore, a more rigorous theoretical validation of the boundary conditions for numerical simulation will be conducted, and the existing defibering equipment will be upgraded for experimental testing of pressure. Based on the aforementioned analysis and test results, we will further refine the scheme of the intelligent decision-making system for defibering equipment. The BO-CatBoost algorithm will be used to establish a prediction model for the regulating variables, in order to accomplish the purpose of online regulation of the roller-pressure defibering process and achieve the intelligent and precise control of the defibering process.

Author Contributions

Conceptualization, C.Y., Y.Z. and Q.W.; methodology, Q.W. and C.Y.; software, Q.W. and X.W.; writing—original draft preparation, Q.W.; writing—review and editing, C.Y.; project administration, Y.Z.; supervision, Y.X.; resources, Y.Z. and Y.X. data curation, X.W.; visualization, P.C. All authors have read and agreed to the published version of the manuscript.

Funding

This research was supported by the Central Level Public Welfare Research Institutes Basic Research Fund, China (Grant No. CAFYBB2021ZX001).

Data Availability Statement

The datasets used and analyzed during the current study available from the corresponding author on reasonable request.

Conflicts of Interest

The authors declare no conflicts of interest.

References

  1. Huang, Y.; Ji, Y.; Yu, W. Development of Bamboo Scrimber: A Literature Review. J. Wood Sci. 2019, 65, 25. [Google Scholar] [CrossRef]
  2. Sun, X.; He, M.; Liang, F.; Li, Z.; Wu, L.; Sun, Y. Experimental Investigation into the Mechanical Properties of Scrimber Composite for Structural Applications. Constr. Build. Mater. 2021, 276, 122234. [Google Scholar] [CrossRef]
  3. Li, X.; Rao, F.; Li, N.; Lei, W.; Bao, M.; Bao, Y.; Li, L.; Duan, Z.; Zu, Q.; Zhang, Y.; et al. High-Performance Bamboo Scrimber Composite Prepared from Heat-Treated Bambusa Chungii Units with Different Resin Contents for Outdoor Use. Ind. Crops Prod. 2023, 205, 117503. [Google Scholar] [CrossRef]
  4. Li, X.; Li, L.; Li, N.; Bao, M.; Bao, Y.; Wu, Z.; Wang, J.; Rao, F.; Chen, Y. Sustainable Production of Engineered Bamboo Scrimber Composites for Construction and Flooring Applications. Constr. Build. Mater. 2022, 347, 128615. [Google Scholar] [CrossRef]
  5. Coleman, J.; Hills, S. Reconsolidated Wood Product. US Patent 4232067, 4 November 1980. [Google Scholar]
  6. Yu, W. Current Status and Future Trend of Science and Technology for Reconstituted Materials in China. Chin. J. Wood Sci. and Technol. 2023, 37, 1–7. [Google Scholar] [CrossRef]
  7. Nugroho, N.; Ando, N. Development of Structural Composite Products Made from Bamboo I: Fundamental Properties of Bamboo Zephyr Board. J. Wood Sci. 2000, 46, 68–74. [Google Scholar] [CrossRef]
  8. Nugroho, N.; Ando, N. Development of Structural Composite Products Made from Bamboo II: Fundamental Properties of Laminated Bamboo Lumber. J. Wood Sci. 2001, 47, 237–242. [Google Scholar] [CrossRef]
  9. Zhu, A.; Hong, Y.; Zhang, X.; Yu, H.; Wang, H.; Wang, Y.; Yu, W. Research Progress on Carbon Footprint of Wood/Bamboo Products Based on the Life Cycle. China For. Prod. Ind. 2023, 60, 83–87. [Google Scholar] [CrossRef]
  10. Gao, Q.; Lin, Q.; Huang, Y.; Hu, J.; Yu, W. High-Performance Wood Scrimber Prepared by a Roller-Pressing Impregnation Method. Constr. Build. Mater. 2023, 368, 130404. [Google Scholar] [CrossRef]
  11. Yang, N.; Zhang, Y. Technological Innovation for Bamboo Scrimber and Its Key Technical Problems Faced. World Bamboo Rattan 2021, 19, 64–68. [Google Scholar]
  12. Wang, Q.; Zhang, Y.; Yan, C.; Liu, Z.; Wang, X. Research Status of the Scrimber Roller Press Equipment and System Intelligent Development Trend. World For. Res. 2024, 37, 74–79. [Google Scholar] [CrossRef]
  13. Adachi, K.; Inoue, M.; Kawai, S. Deformation Behavior of Wood by Roller Pressing. Mokuzai Gakkaishi 2005, 51, 234–242. [Google Scholar] [CrossRef]
  14. Kocovic, V.; Dzunic, D.; Kostic, S.; Brzakovic, L.; Tadic, B.; Prica, M.; Vukelic, D. Investigation into the Effects of Roller Pressing on Hardness, Roughness and Elastic Modulus of Wooden Workpieces. Appl. Sci. 2022, 12, 5575. [Google Scholar] [CrossRef]
  15. Zhou, S.-R.; Shi, L.-L.; Xiong, G.; Kang, S.-B.; Qin, Y.-L.; Yan, H.-Q. Global Buckling Behaviour of Bamboo Scrimber Box Columns under Axial Compression: Experimental Tests and Numerical Modelling. J. Build. Eng. 2023, 63, 105435. [Google Scholar] [CrossRef]
  16. Wei, Y.; Tang, S.; Ji, X.; Zhao, K.; Li, G. Stress-Strain Behavior and Model of Bamboo Scrimber under Cyclic Axial Compression. Eng. Struct. 2020, 209, 110279. [Google Scholar] [CrossRef]
  17. Wu, C.; Zhang, L.; Qu, P.; Li, S.; Jiang, Z.; Li, W. Surface Texture Transfer in Skin-Pass Rolling with the Effect of Roll Surface Wear. Wear 2021, 476, 203764. [Google Scholar] [CrossRef]
  18. Yang, Z.; Deng, X.; Li, Z. Numerical Modeling of Dynamic Frictional Rolling Contact with an Explicit Finite Element Method. Tribol. Int. 2019, 129, 214–231. [Google Scholar] [CrossRef]
  19. Song, J.; Lan, J.; Zhu, L.; Jiang, Z.; Zhang, Z.; Han, J.; Ma, C. Finite Element Simulation and Microstructural Analysis of Roll Forming for DP590 High-Strength Dual-Phase Steel Wheel Rims. Materials 2024, 17, 3795. [Google Scholar] [CrossRef]
  20. Yu, J.; Zhangzhong, L.; Lan, R.; Zhang, X.; Xu, L.; Li, J. Ensemble Learning Simulation Method for Hydraulic Characteristic Parameters of Emitters Driven by Limited Data. Agronomy 2023, 13, 986. [Google Scholar] [CrossRef]
  21. Cherif, E.K.; Lucas, R.; Ait Tchakoucht, T.; Gama, I.; Ribeiro, I.; Domingos, T.; Proença, V. Predicting Fractional Shrub Cover in Heterogeneous Mediterranean Landscapes Using Machine Learning and Sentinel-2 Imagery. Forests 2024, 15, 1739. [Google Scholar] [CrossRef]
  22. Mienye, I.D.; Sun, Y.; Wang, Z. Prediction Performance of Improved Decision Tree-Based Algorithms: A Review. Procedia Manuf. 2019, 35, 698–703. [Google Scholar] [CrossRef]
  23. Nguyen, N.-H.; Tong, K.T.; Lee, S.; Karamanli, A.; Vo, T.P. Prediction Compressive Strength of Cement-Based Mortar Containing Metakaolin Using Explainable Categorical Gradient Boosting Model. Eng. Struct. 2022, 269, 114768. [Google Scholar] [CrossRef]
  24. Hancock, J.; Khoshgoftaar, T.M. CatBoost for Big Data: An Interdisciplinary Review. J. Big Data 2020, 7, 94. [Google Scholar] [CrossRef]
  25. Islam, A.M.; Masud, F.B.; Ahmed, M.R.; Jafar, A.I.; Ullah, J.R.; Islam, S.; Shatabda, S.; Islam, A.K.M.M. An Attention-Guided Deep-Learning-Based Network with Bayesian Optimization for Forest Fire Classification and Localization. Forests 2023, 14, 2080. [Google Scholar] [CrossRef]
  26. Ma, Y.; Xu, Q.; Yang, C. Cutting principle and mechanical analysis of scrimber rolling fluffer. Wood Process. Mach. 2016, 27, 698. [Google Scholar] [CrossRef]
  27. Prokhorenkova, L.; Gusev, G.; Vorobev, A.; Dorogush, A.V.; Gulin, A. CatBoost: Unbiased Boosting with Categorical Features. arXiv 2019, arXiv:1706.09516. [Google Scholar]
  28. Bentéjac, C.; Csörgő, A.; Martínez-Muñoz, G. A Comparative Analysis of Gradient Boosting Algorithms. Artif. Intell. Rev. 2021, 54, 1937–1967. [Google Scholar] [CrossRef]
  29. Hassanali, M.; Soltanaghaei, M.; Javdani Gandomani, T.; Zamani Boroujeni, F. Software Development Effort Estimation Using Boosting Algorithms and Automatic Tuning of Hyperparameters with Optuna. J. Softw. Evol. Process 2024, 36, e2665. [Google Scholar] [CrossRef]
  30. Kong, Q.; He, C.; Liao, L.; Xu, J.; Yuan, C. Hyperparameter Optimization for Interfacial Bond Strength Prediction between Fiber-Reinforced Polymer and Concrete. Structures 2023, 51, 573–601. [Google Scholar] [CrossRef]
  31. Levesque, J.-C.; Durand, A.; Gagne, C.; Sabourin, R. Bayesian Optimization for Conditional Hyperparameter Spaces. In Proceedings of the 2017 International Joint Conference on Neural Networks (IJCNN), Anchorage, AK, USA, 14–19 May 2017; pp. 286–293. [Google Scholar] [CrossRef]
  32. Sjöberg, A.; Önnheim, M.; Gustavsson, E.; Jirstrand, M. Architecture-Aware Bayesian Optimization for Neural Network Tuning. In Artificial Neural Networks and Machine Learning—ICANN 2019: Deep Learning; Tetko, I.V., Kůrková, V., Karpov, P., Theis, F., Eds.; Lecture Notes in Computer Science; Springer International Publishing: Cham, Switzerland, 2019; Volume 11728, pp. 220–231. [Google Scholar] [CrossRef]
  33. Nguyen, T.D.; Gupta, S.; Rana, S.; Venkatesh, S. Stable Bayesian Optimization. In Advances in Knowledge Discovery and Data Mining; Kim, J., Shim, K., Cao, L., Lee, J.-G., Lin, X., Moon, Y.-S., Eds.; Lecture Notes in Computer Science; Springer International Publishing: Cham, Switzerland, 2017; Volume 10235, pp. 578–591. [Google Scholar] [CrossRef]
  34. Hebbal, A.; Balesdent, M.; Brevault, L.; Melab, N.; Talbi, E.-G. Deep Gaussian Process for Multi-Objective Bayesian Optimization. Optim. Eng. 2023, 24, 1809–1848. [Google Scholar] [CrossRef]
  35. He, B.; Zhang, S.; Yang, F.; Yan, C.; Zhou, D.; Zeng, X. An Efficient Bayesian Optimization Approach for Analog Circuit Synthesis via Sparse Gaussian Process Modeling. In Proceedings of the 2020 Design, Automation & Test in Europe Conference & Exhibition (DATE), Grenoble, France, 9–13 March 2020; pp. 67–72. [Google Scholar] [CrossRef]
  36. Vasinek, M.; Plato, J.; Snasel, V. Limitations on Low Variance K-Fold Cross Validation in Learning Set of Rules Inducers. In Proceedings of the 2016 International Conference on Intelligent Networking and Collaborative Systems (INCoS), Ostrava, Czech Republic, 7–9 September 2016; pp. 207–214. [Google Scholar] [CrossRef]
  37. Yu, S.; Gu, C.; Liu, W.; O’Neill, M. Deep Learning-Based Hardware Trojan Detection with Block-Based Netlist Information Extraction. IEEE Trans. Emerg. Top. Comput. 2022, 10, 1837–1853. [Google Scholar] [CrossRef]
  38. Lundberg, S.; Lee, S.-I. A Unified Approach to Interpreting Model Predictions. arXiv 2017, arXiv:1705.07874. [Google Scholar]
  39. Liu, F.; Wang, X.; Li, T.; Huang, M.; Hu, T.; Wen, Y.; Su, Y. An Automated and Interpretable Machine Learning Scheme for Power System Transient Stability Assessment. Energies 2023, 16, 1956. [Google Scholar] [CrossRef]
  40. Rastgoo, A.; Khajavi, H. A Novel Study on Forecasting the Airfoil Self-Noise, Using a Hybrid Model Based on the Combination of CatBoost and Arithmetic Optimization Algorithm. Expert Syst. Appl. 2023, 229, 120576. [Google Scholar] [CrossRef]
  41. Huang, R.; Ni, J.; Qiao, P.; Wang, Q.; Shi, X.; Yin, Q. An Explainable Prediction Model for Aerodynamic Noise of an Engine Turbocharger Compressor Using an Ensemble Learning and Shapley Additive Explanations Approach. Sustainability 2023, 15, 13405. [Google Scholar] [CrossRef]
  42. Feng, Z.; Champliaud, H. Analyses of Profile Radial-Axial Ring Rolling Process Based on Explicit Finite Element Method. In Volume 2: Computer Technology and Bolted Joints; American Society of Mechanical Engineers: Anaheim, CA, USA, 2014; p. V002T02A013. [Google Scholar] [CrossRef]
Figure 1. Overall technical solution.
Forests 15 02173 g001
Figure 2. A schematic diagram of the roller structure of the veneer defibering equipment.
Forests 15 02173 g002
Figure 3. The geometry of rolled veneer.
Forests 15 02173 g003
Figure 4. FEM model schematic representation of boundary conditions and coordinate system.
Forests 15 02173 g004
Figure 5. Average stress and strain results under different roller gaps.
Forests 15 02173 g005
Figure 6. ALLKE and ALLSE results under different roller gaps.
Forests 15 02173 g006
Figure 7. A simulation stress–strain distribution diagram of a veneer thickness of 6 mm and a roller velocity of 600 mm/s. (a) Stress distribution mapping of the veneer rolling process; (b) strain distribution mapping of the veneer rolling process.
Forests 15 02173 g007
Figure 8. Average stress and strain results under different roller thicknesses.
Forests 15 02173 g008
Figure 9. ALLKE and ALLSE results under different roller thicknesses.
Forests 15 02173 g009
Figure 10. Equivalent stress nephograms at critical time points. (a) Frame 4; (b) frame 7; (c) frame 10.
Forests 15 02173 g010
Figure 11. Section shape after rolling. (a) Frame 4; (b) frame 7; (c) frame 10.
Forests 15 02173 g011
Figure 12. Average stress and strain results under different roller velocity.
Forests 15 02173 g012
Figure 13. ALLKE and ALLSE results under different roller velocity.
Forests 15 02173 g013
Figure 14. Heatmap of the correlation matrix of the data.
Forests 15 02173 g014
Figure 15. Comparison of model performance with and without BO.
Forests 15 02173 g015
Figure 16. Performance of the BO-CatBoost Modes. (a) Mode 1-2; (b) Mode 1-4; (c) Mode 3-2; (d) Mode 3-4; (e) Mode 4-1.
Forests 15 02173 g016
Figure 17. Relationship between the SHAP value and the values of different input features.
Forests 15 02173 g017
Table 1. Mechanical property parameters of veneer.
E 1 (MPa) E 2 (MPa) E 3 (MPa) G 12 (MPa) G 13 (MPa) G 23 (MPa) V 12 V 13 V 23
41709004807006201700.130.70.75
E 1 , E 2 , E 3 are the moduli of elasticity in longitudinal, transversal and radial directions; G 12 , G 13 , G 23 are the shear moduli in longitudinal, transversal and radial planes; V 12 , V 13 , V 23 are the Poisson ratio.
Table 2. FEM model characteristic values.
PropertiesPartsTypesValue
Geometrical featuresVeneerLength50 mm
Thickness4–6 mm
Width15 mm
RollersRadius95 mm
Depth30 mm
MaterialsVeneer-Table 1 shows
Defibering roller-Q345
Friction roller-45# steel
MeshVeneer-Tetrahedral mesh
Defibering roller-Tetrahedral mesh (medial axis algorithm)
Friction roller-Hexahedral unit
Maxps DamageVeneerMax Principal Stress100 Mpa
Damage Stabilization Cohesive1 × 10−5
Tangential BehaviorVeneer and RollersFriction Coeff0.5
Analysis step--Dynamic, Explicit
LoadVeneer (transverse section direction)pressure100 Mpa
Defibering rollerZ-axis rotation−400–−800 mm/s
Friction rollerZ-axis rotation400–800 mm/s
Table 3. CatBoost hyperparameter information to be optimized.
ParametersTypeRange ValueExplanations
iterationsint[500, 1500]Determines the number of gradient lifting of the algorithm.
learning_ratefloat[0.02, 0.5]Helps the algorithm to better control the contribution of weak learners in each iteration, improving the accuracy of the overall model.
depthint[4, 10]Controls the depth of the tree to be used.
l2_leaf_regfloat[1, 10]Controls the degree of regularization of the model to avoid overfitting.
rsmfloat[0.6, 1.0]Able to add diversity to the model training process to improve the accuracy of the model.
random_seedint[100, 500]Can control the initialization state of the stochastic process used to ensure the reproducibility of the experiment.
subsamplefloat[0.6, 1.0]Used primarily for data sampling to reduce the risk of model overfitting and improve model generalization.
Table 4. Simulation experiment design parameters for different structural factors.
Veneer Thickness (mm)Roller Velocity (mm/s)ROLLER Gap (mm)Simulation Result Array
4[400, 800, 50][0.5, 2, 0.1]9 × 16 = 144
5[400, 800, 50][0.5, 3, 0.1]9 × 26 = 234
6[400, 800, 50][0.5, 4, 0.1]9 × 36 = 324
The expression [400, 800, 50] denotes the generation of a sequence of integers, commencing from 400 and concluding at 800 in increments of 50, and continuing in this manner.
Table 5. Variables of numerical simulation dataset (702 samples) for veneer defibering.
VariablesSymbolUnitMinimumMaximumMeanStandard Deviation
Roller gapgapmm0.504.001.880.94
Roller velocityvelocitymm/s400.00800.00600.21129.16
Veneer thicknessthicknessmm4.006.005.260.77
Maximum principal stressSMpa153.59301.60205.1829.88
Maximum principal strainLE-0.090.250.150.03
Spatial displacementUmm0.185.661.410.97
Frictional dissipationFDJ20,340.77186,125.4183,960.9939,101.63
Internal energyIEJ7787.1179,670.3327,514.7813,554.63
Kinetic energyKEJ2,607,400.0010,547,661.906,175,309.592,532,188.00
Strain energySEJ5555.0742,857.2517,223.597163.84
Total energyTEJ2,508,794.0010,073,704.765,930,829.352,450,048.91
Table 6. Feature selection table.
Mode LabelsGapVelocityThicknessSLEUFDIEKESETE
Mode 1-1
Mode 1-2
Mode 1-3
Mode 1-4
Mode 2-1
Mode 2-2
Mode 2-3
Mode 2-4
Mode 3-1
Mode 3-2
Mode 3-3
Mode 3-4
Mode 4-1
Mode 4-2
Adopt “√” for features and “★” for targets.
Table 7. Results on performance metrics of modes in the test set.
Mode LabelsCatBoostBO-CatBoost
R 2 MAEMSERMSE5-Fold R 2 MAEMSERMSE5-Fold
Mode 1-10.98090.002700.00390.93780.98200.002700.00380.9672
Mode 1-20.98250.002600.00380.93020.98000.002800.00400.9664
Mode 1-30.98660.002400.00330.90210.98420.002700.00360.9228
Mode 1-40.98390.002700.00360.86790.98510.002700.00350.9089
Mode 2-10.29940.65691.01881.00940.16010.36130.62980.92890.96380.1705
Mode 2-20.24770.66361.09401.04600.13340.26780.65521.06481.03190.0834
Mode 2-30.22150.67581.13211.06400.04360.22460.67171.12761.06190.0701
Mode 2-40.24460.66991.09851.04810.15000.24380.66831.09971.04870.1528
Mode 3-10.97893.160817.93754.2353−0.09040.96863.848026.67105.16440.4175
Mode 3-20.97683.273019.74034.4430−0.23020.97823.177518.51464.30290.3210
Mode 3-30.97663.395619.92984.4643−0.16260.97833.274018.43914.29410.3768
Mode 3-40.97163.736624.18214.9175−0.29050.97423.492921.90814.68060.2747
Mode 4-10.82570.29500.15110.38870.77940.82850.28980.14870.38560.7825
Mode 4-20.534871.02998087.857989.9325−17.24780.530869.10238157.97790.3215−17.3382
Table 8. The results of hyperparameter optimization.
Mode LabelsOptimal ParametersDefault Parameters
IterationsLearning_RateDepthl2_leaf_regrsmRandom_SeedSubsample
Mode 1-16770.13235.9540.8161540.804‘loss_function’: ‘RMSE’,
‘iterations’: 500,
‘learning_rate’: 0.03,
‘random_seed’: 500,
‘l2_leaf_reg’: 3,
‘subsample’: 0.6,
‘best_model_min_trees’: 50,
‘depth’: 6,
‘min_data_in_leaf’: 300,
‘one_hot_max_size’: 4,
‘rsm’: 0.6,
Mode 1-25950.023114280.6
Mode 1-38260.22355.4290.7492950.769
Mode 1-45250.531.2450.6243610.613
Mode 2-19160.10668.9450.7723910.6
Mode 2-27780.04455.6720.6732990.773
Mode 2-38900.0258.4940.7893480.6
Mode 2-47760.02810.63850.6
Mode 3-18380.41146.8410.6233800.889
Mode 3-26350.29131.420.912500.733
Mode 3-35210.531012150.6
Mode 3-46060.14644.7220.9214610.716
Mode 4-15580.0241.2260.64930.6
Mode 4-28010.05354.3670.8182090.985
Table 9. Training time (execution time) of the studied models.
Prediction Modes1-11-21-31-43-13-23-33-44-1
Execution Time (ms)979639128039027608275655281030
Disclaimer/Publisher’s Note: The statements, opinions and data contained in all publications are solely those of the individual author(s) and contributor(s) and not of MDPI and/or the editor(s). MDPI and/or the editor(s) disclaim responsibility for any injury to people or property resulting from any ideas, methods, instructions or products referred to in the content.

