Article

Effect of Plantation Density on Some Physical and Technological Parameters of Scots Pine (Pinus sylvestris L.)

1
Institute of Civil Engineering and Architecture, Volga State University of Technology, Lenin sq. 3, 424000 Yoshkar-Ola, Mari El Republic, Russia
2
Institute of Forestry and Nature Management, Volga State University of Technology, Lenin sq. 3, 424000 Yoshkar-Ola, Mari El Republic, Russia
*
Author to whom correspondence should be addressed.
Forests 2024, 15(2), 233; https://doi.org/10.3390/f15020233
Submission received: 2 January 2024 / Revised: 19 January 2024 / Accepted: 20 January 2024 / Published: 25 January 2024
(This article belongs to the Section Forest Biodiversity)

Abstract

:
The issue of optimising the initial stand density (ISD) of tree plantations has high practical importance. The objective of this study was to non-destructively evaluate the influence of the initial stand density of Scots pine (Pinus sylvestris L.) plantations located in the European part of the Russian Federation on wood basic density (BD), moisture content (MC), ultrasound velocity (UV), latewood content, and drilling resistance (DR). The trees at the age of 45 years with initial plantation densities of 500, 1000, 3000, 5000, and 10,000 trees/ha were tested by a 5 cm-long core sample for gravimetric MCGM and BD by PULSAR-2.2 for UV along the height (UVH) and through the tree trunk diameter (UVD) by the IML-RESI PD-400 tool for DR, as well as by GANN HT 85T for MC based on the electrical-resistance method (MCERM). A significant influence of ISD was found on DBH, UVD, MCGM, and MCERM. ISD had no significant impact on BD, UVH, and DR. The wood BD ranged from 356 to 578 kg·m−3 with a mean value of 434 ± 3.3 kg·m−3 and was restricted by the soil and environmental factors. DBH and 70% MCERM were good indicators of tree vitality. Linear correlations between DBH and MCERM (R2 = 0.67), DBH and MCGM (R2 = 0.74), DR and BD (R2 = 0.71), and the two-factor model MCGM = f(DBH, BD) with R2 = 0.76 were found.

1. Introduction

The initial density of forest plantations is one of the key factors determining their productivity, marketability, viability, and environmental protection. It also affects the overall economic efficiency (profitability) of forest cultivation. Research literature contains extensive discussion on the issue of stand density optimisation, which is utterly important from a practical standpoint. The multifaceted nature of the problem and a wide range of possible solutions account for why it has not lost its relevance [1,2,3,4,5,6,7,8,9,10,11].
It has been established that there is no relative optimal stand density for the initial and current plantations [12]. The optimal stand density is determined by the set goal, which can be either increasing complex productivity while accounting for all biological components of forest ecosystems, obtaining wood of the required quality and quantity in the shortest possible time, or enhancing the stability and durability of plantations, their environmental and protective functions, and the appeal for human recreation.
Most researchers aimed to investigate the dynamics of taxation indicators. Studies examining the impact of pine-planting practices and their initial density on the mechanical and physical properties of wood, as well as its technical quality, are limited. The most important parameter of wood is basic density, which also determines the trees’ resistance to icing, wind loads, snowdrifts, and trunk rot. The research findings on this subject are far from conclusive [8,13,14,15]. This is caused by the variety of forest biogeocenoses, as well as the way in which environmental conditions affect them. Thus, for example, Poluboiarinov and Fedorov [13] claimed that in the northwest of the European part of Russia, the increased density of Scots pine (Pinus sylvestris L.) plantations led to a significant reduction in tree height increment (r = −0.62), the width of annual rings (r = −0.95), and wood density (r = −0.58). Nevertheless, it had a negligible impact on the length of the tracheids (r = 0.20) and the proportion of the latewood (r = 0.17). Zhu et al. [2] noted that with an increase in red pine (Pinus resinosa Ait.) stand density, the average width of the annual layer decreases (r = −0.90, −0.96), which, according to the authors, is the most accurate parameter to describe the influence of stand density on wood density and anatomical parameters of tracheids. Using the SilviScan, the authors found that with a decrease in the average width of the annual layer, the wood density as a whole increases (r = −0.30), while the density of latewood decreases (r = 0.45) and the density of early wood in the annual layer increases (r = −0.52).
The initial density of Populus tometosa plantations in China, according to Sang et al. [7], did not significantly affect the wood’s basic density. Wood density had a weak and positive correlation with poplar growth traits within each planting density. Similar results with no significant effect of initial plantation density on wood’s basic density were presented by Melo et al. [10] and Cassidy et al. [11]. A negative relationship between wood density and initial plantation density was found for Hevea brasiliensis by Naji et al. [5].
Melekhov et al. [16] came to the conclusion that in order to produce high-quality wood, Scots pine plantations should have an initial stand density of at least 1000–1200 trees/ha. The best result of wood properties in fresh ramen (forest site type C2) was observed in a variation with a plantation density of 10,000 trees/ha [17]. According to Konovalov [18], the wood density (at 12% moisture content, MC) in pine plantations located in the northern and southern subzones of the taiga ranged from 490 to 540 kg·m−3. In pine plantations in the middle taiga subzone, the wood density (at 12% MC) did not depend on the forest site type. It changed depending on the method of plantation establishment: in plantations, from 444 to 483 kg·m−3, in seed crops, from 491 to 510 kg·m−3 [19,20]. The wood density (at 12% MC) varied from 428 to 484 kg·m−3 in 26-year-old pine stands with varying stand densities (10,000–40,000 trees/ha) established in the Tambov region for subor forests (forest site type B2). About 20,000 trees per hectare was the number at which both wood density and stock volume reached their maximum levels. On plantations with the lowest and highest number of trees per ha, the wood density (at 12% MC) was almost the same (428 ± 2.4 and 427 ± 3.5 kg·m−3) [14]. The origin of Scots pine planting material can have a significant influence on the density and mechanical properties of wood [21].
Thinning and increased spacing between trees on plantations often resulted in a decrease in the wood density in coniferous forests [22,23]. The dependence of wood density on the number of trees in pine and spruce stands in Lithuania [24], as well as Cariniana legalis in Brazil [25], was low positive. However, in Australian Eucalyptus plantations, the reverse was observed [26]. Results from research on geographical species reveal that the causes of the variance in wood-density values are not only the number of trees per hectare but also the physical and geographical conditions, as well as the hereditary characteristics of the trees [27,28].
A literature review revealed that there was no unanimous opinion on how the initial stand density affected the variability of the wood’s basic density or other wood properties of Scots pine. Presumably, the strength characteristics of wood are predetermined hereditarily, which can be used in cultivation in order to increase the environmental and resource potential of plantations during artificial forest regeneration. With all the disparity in the results, it is nevertheless possible to make certain generalisations:
(1)
when growing in dense groups, during the first years, seedlings have a higher increase in height and trunk diameter. Thereafter, the situation changes to the contrary;
(2)
the diameter of trees is far more influenced by the initial stand density than their height, which is primarily determined by MC and the fertility of soil;
(3)
during the first 15–30 years of plantation establishment, i.e., before crown and root closure, when intraspecific competition for resources comes into effect, the stocking volume is proportional to the initial stand density. After that, this dependence gradually changes into a dome shape and even inversely proportional relationship;
(4)
reducing the initial stand density allows for obtaining large-size wood in shorter periods of time;
(5)
when stand density is excessively high, wood productivity is reduced as a result of both intraspecific competition and fallout from snow and wind loads;
(6)
there is a greater chance of insect damage when plantations are initially planted at a low density;
(7)
trees planted too densely will eventually fall, and their width growth will slow down;
(8)
planting too densely is not viable from an economic standpoint as it leads to overpaying for labour and seedlings.
Non-destructive testing and evaluation techniques, such as the time-of-flight acoustic method, based on measuring the acoustic wave velocity and drilling resistance (DR) measurements, are widely used to evaluate the quality and internal condition of wood in stands [29,30]. One of the main objectives when using the DR method is to evaluate the accuracy of the indirect prediction of the wood density in growing trees. The degree of correlation of these parameters (R2) varied from 0.28 to 0.93 [31,32,33]. The use of DR data with a limited penetration depth of a drill bit into a growing tree allows for higher accuracy of wood density prediction: R2 = 0.93 for a drilling depth of 50 mm [31] and R2 > 0.80 for a drilling depth of up to 15 mm [34]. Some studies concluded that in order to increase the accuracy of assessing the mechanical and physical properties of wood in a tree, combined acoustic and DR measurement methods can be applied [35,36]. Non-destructive acoustic methods for evaluating wood quality can be used to indirectly determine the density and stiffness of the wood [37,38].
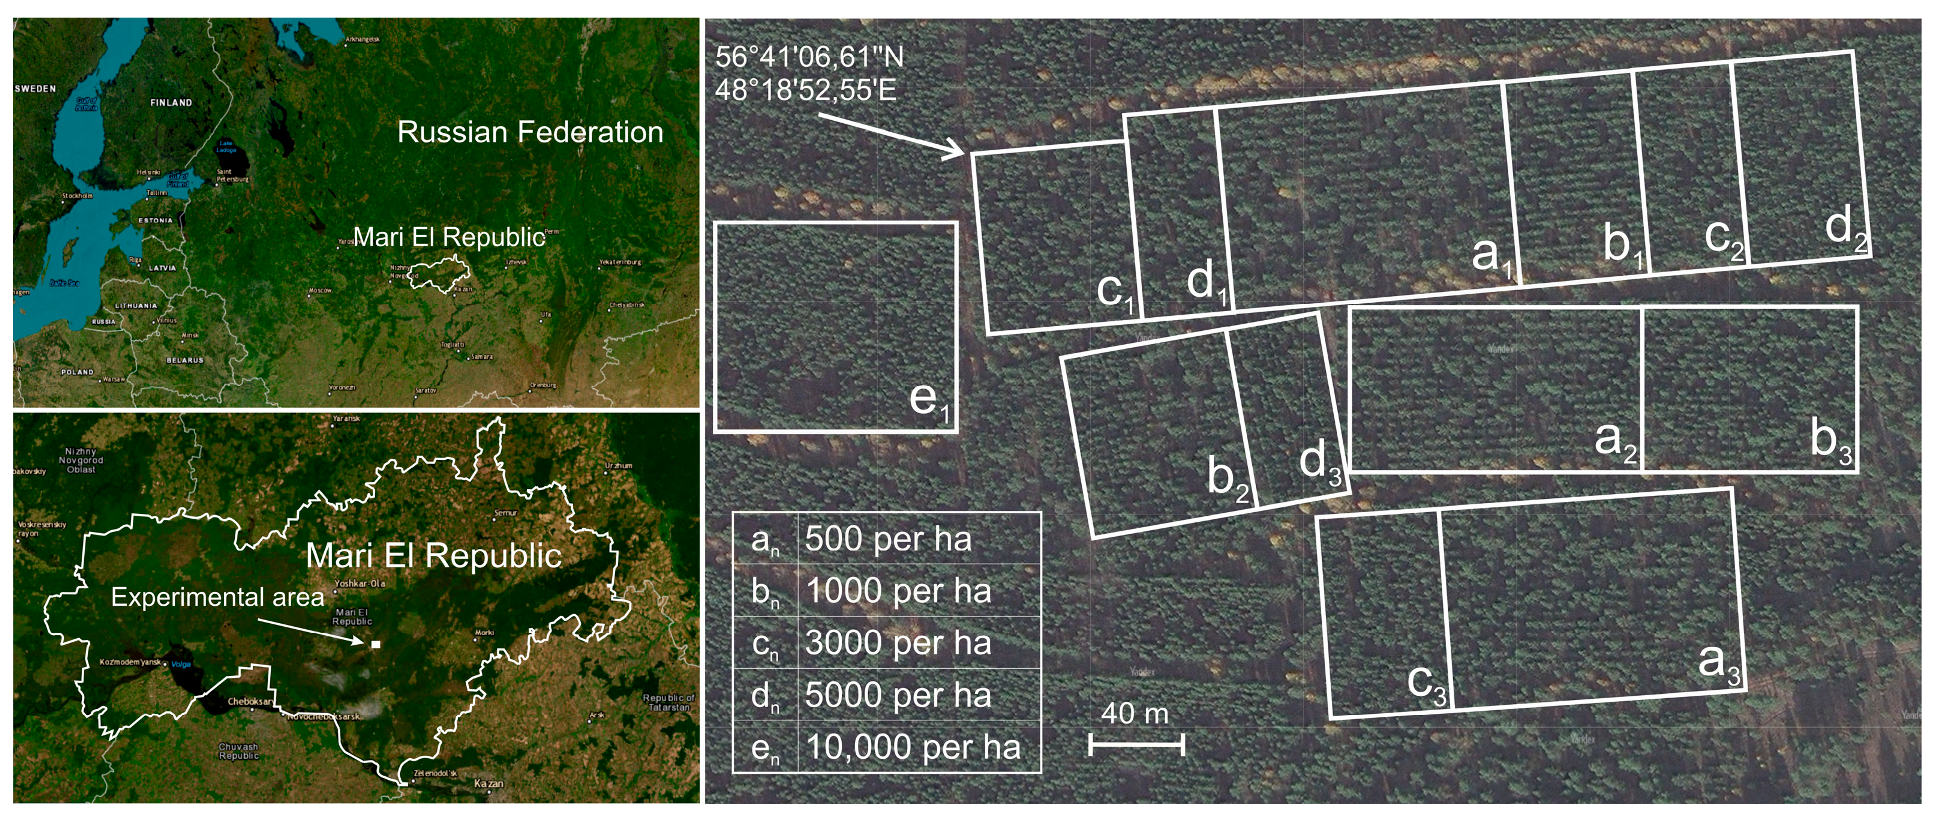
Using contemporary non-destructive methods and approaches required the optimisation of the methods and technologies of pine plantations in the Republic of Mari El and the Middle Volga region of the Russian Federation. The research aims to study the effect of the initial plantation density of Scots pine plantations on the tree diameter, width of the annual layer, MC, basic density, ultrasound velocity, and DR.

2. Materials and Methods

2.1. Study Site

The object of the study was Scots pine trees on the experimental plantation, which was created in 1977 in the central part of the Mari El Republic, Russian Federation (Figure 1).
Tree planting was conducted on the site, which was originally covered with a 50-year-old natural pine forest destroyed by wildfire. Plantation consists of 15 experimental plots with three repetitions of initial densities of 500, 1000, 3000, 5000, and 10,000 trees per ha (Figure 1 and Figure 2). Studied plantation differs from other objects ever created on this topic by the large size of the plots and the presence of very low initial tree density. The plantation was established with 2-year-old Scots pine seedlings and forest planting equipment. The research site has flat relief. The soil is dry, loose and sandy, subacid, low in nutrients, and soddy-low in podzolic acid [8]. The groundwater table is located at a depth of over six metres below the surface. The forest site type is lichen-dominated pine. The plots received no agrotechnical or silvicultural treatments.

2.2. Tree Measurements

Lines of trees were randomly chosen from experimental plots. Twenty trees from each plot and a selected line (nearby lines) were measured for diameter, MC, DR, and ultrasound velocity at breast height (Figure 3). Moisture content was measured by GANN HT 85T and 40 mm-long needles (GANN Mess- und Regeltechnik GmbH., Stuttgart, Germany) from the north side using the electrical-resistance method.
Ultrasound velocity was determined for each tree by the time-of-flight method. The transit time of the ultrasound wave was measured using the PULSAR-2.2 tool (Interpribor LLC, Chelyabinsk, Russia) along the height of the trunk over 500 mm from the north side of the tree and radially through the trunk diameter in a north–south direction. Additional acoustic sensor indentations were made in the bark xylem prior to an acoustic measurement. After that, the transit time was adjusted while considering the average thickness of the tree bark. The mean transit time of five measurements was used to calculate the ultrasound velocity.
In order to conduct the DR measurements, an IML-RESI PD-400 tool and standard drill bit were used (IML System GmbH, Wiesloch, Germany). Measurements of DR were made from bark to bark at a constant feed rate of 1.5 m·min−1 and a rotating frequency of 2500 min−1 in the north–south direction. Drilling-resistance and feeding-resistance (FR) parameters were measured and digitally recorded every 0.1 mm of the drilling depth. The DR profiles obtained from each tree included a relative DR curve reflecting the torsion force on the drill bit and an FR curve reflecting the pressure exerted on the tool, both recorded in percentage of the amplitude. Drilling resistance and FR data were saved and processed using the PD-Tools PRO-V1.67. The DR profiles were adjusted by removing the shaft-friction component [39,40,41,42] based on the hypothesis of its linear increase with increasing drilling depth.
A 5 cm-long (5 mm in diameter) core sample was extracted in close proximity (10–20 mm) to the location of DR holes from each tree for wood MC and basic density evaluation by the gravimetric method. Core samples close to the bark were placed in individual plastic tubes and measured later in the day. The volume of 5 cm-long cores was evaluated in green condition by digital calliper (Insize Co., Ltd., Suzhou, China) with the core mean diameter evaluated in two directions: parallel and perpendicular to the grain direction. The mass of cores (0.001 g) was measured in green and oven-dried conditions. The basic density of wood cores was determined as [43]:
ρ b ( B D ) = m 0 / V M A X ,
where ρb is the basic density (kg·m−3), m0 is the oven-dry mass, and VMAX is the volume at green condition.
Latewood content (LC, %) was calculated as mean proportion of latewood in the wood annual layer using measurements by light microscope. The MC of wood cores was evaluated according to standard [44] as the ratio between the mass of water in the core and the mass of the core in oven-dry conditions. Mean DR and FR corresponding to the 5 cm-long cores (without DR data for bark and phloem) were compared between groups of trees with varied plantation densities and correlated with wood’s basic density. The estimated parameters of trees and wood properties, their corresponding acronyms, and coding to make the data easier to read are presented in Table 1.
The statistical differences between the mean values were assessed using ANOVA and Tukey’s HSD (honestly significant difference). All statistical analyses were performed in Microsoft Excel® 2016, Statistica 10 (Dell Technologies Inc., Round Rock, TX, USA) and SigmaPlot 14 (Systat Software Inc., San Jose, CA, USA) at the 95% confidence level.

3. Results and Discussion

It has been found that there are considerable variations within the estimated parameters of the trees and wood characteristics on the experiment plots. Significant variations occur in the mean DBH (X1), the mean width of annual layers (X2), the proportion of the latewood (X3), and the gravimetric MC of wood (X5) (Table 2). The value of the ultrasound velocity in wood undergoes the fewest changes (X6, X7). The basic density of wood, as a target indicator of its quality, varied from 356 to 578 kg·m−3 with a mean value of 434 ± 3.3 kg·m−3. The variability of tree parameter values is a source of the natural selection of individuals in coenopopulations, ensuring their sustainable development. The heterogeneity of cenopopulations also indicates the possibility of selection of the most promising individuals for a target trait.
The effect of the initial stand density on the variation of the estimated parameters was different. It most significantly influenced the MC, mean width of annual layers, and DBH variability (62.1%–72.7%, Table 3). Less impact of the initial stand density was on ultrasound velocity along the tree trunk, and, particularly, the basic density of wood, which is consistent with previous studies [8].
Most of the parameters exhibited significantly different values across all experiment variations, indicating the heterogeneity of the tree population (Table 4). Thus, the highest values were observed in the DBH, the proportion of latewood, MC, and DR on the experiment plot with the lowest plantation density. The ultrasound velocity in wood along the height of the trunk was minimal. On the experimental plot with a stand density of 10,000 trees per ha, the wood basic density was the maximum, and the values of most of the other estimated parameters were minimal. The highest values of ultrasound velocity along the height of the trunk were observed on plots with a density of 5000 trees per ha, while the highest DBH was observed on plots with a stand density of 500 trees per ha.
Table 5 applies a multiple comparison procedure. Homogenous groups are identified using columns of Xs. Within each column for estimated parameters, the levels containing Xs form a group of means within which there are no statistically significant differences.
Figure 4 shows box-plot diagrams illustrating the range of the estimated parameters distributed by initial plantation density.
The absence of a statistically significant effect of the initial stand density on the UVH is consistent with the previously obtained results for red pine (Pinus resinosa) and jack pine (Pinus banksiana) with two groups of initial plantation density >1997 and <988 trees per ha [37].
According to the data presented, the main contribution to the dispersion of most of the estimated parameters is made by the individual characteristics of trees. These characteristics are likely fixed in the tree’s genome and show up in the initial data series as odd noises that distort the influence of the factor of the initial stand density. The value of the standard deviation of the parameters changes according to the experiment variations without any discernible pattern, reflecting the varying representativeness of the genotype of trees in cenopopulations. Thus, for example, the experimental plot with an initial stand density of 3000 trees per ha had the highest variability in DBH, UV
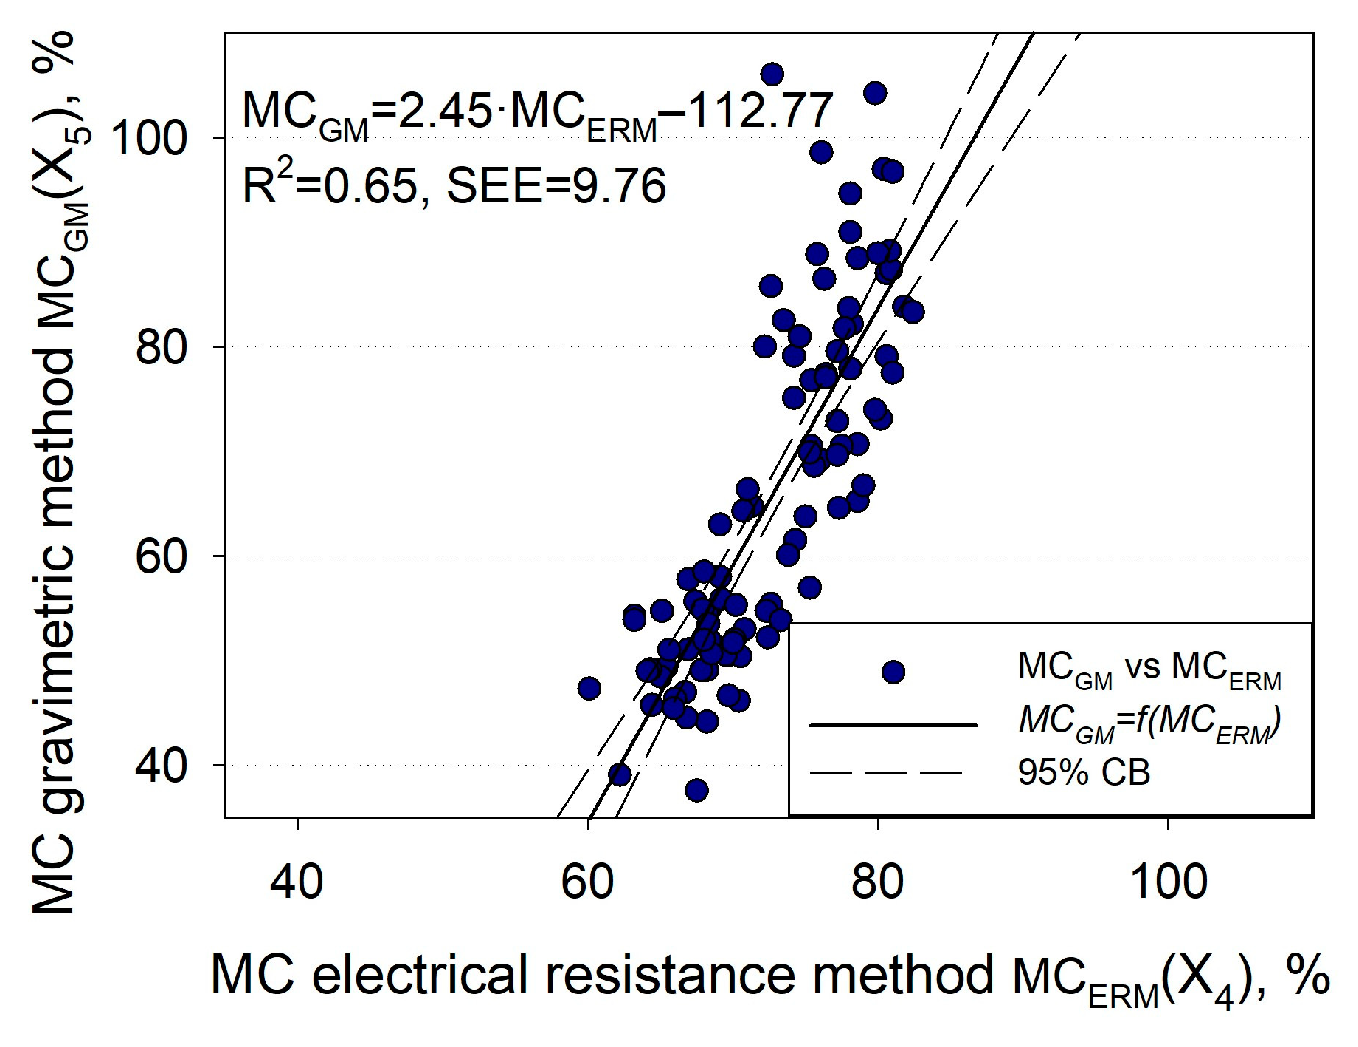
H, and sapwood MC measured by the electrical-resistance method (Table 6). Plots with stand densities ranging between 500 and 1000 trees per ha had the highest values of the standard deviation of the mean width of the annual layer. Plots with a stand density between 500 and 10,000 trees per ha had the highest standard deviation of the proportion of latewood. The highest standard deviation was also observed for: sapwood MC estimated by the gravimetric method on plots with a stand density ranging between 1000 and 3000 trees per ha; ultrasound velocity through the plot with a density of 500 trees per ha; and the wood’s basic density on the plot with the initial 1000 trees per ha.
Some series of the estimated parameters from which a small number of outliers were removed had a strong correlation (Table 7, Figure 5, Figure 6 and 
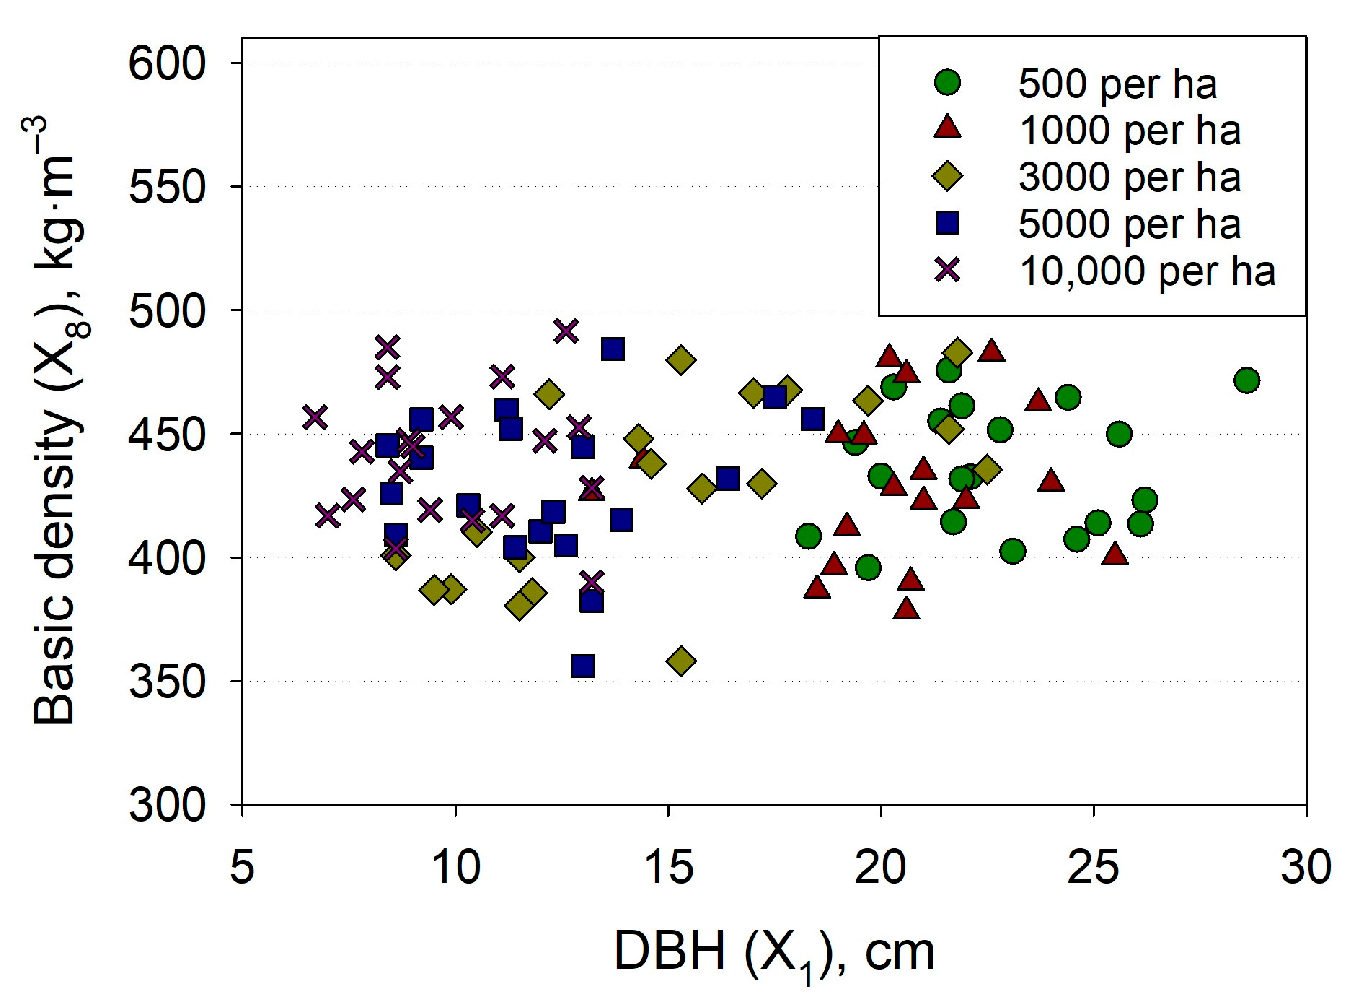
Figure 7). No relationship for the linear model (R2 = 0.01) was found between DBH and the wood’s basic density (Figure 8).
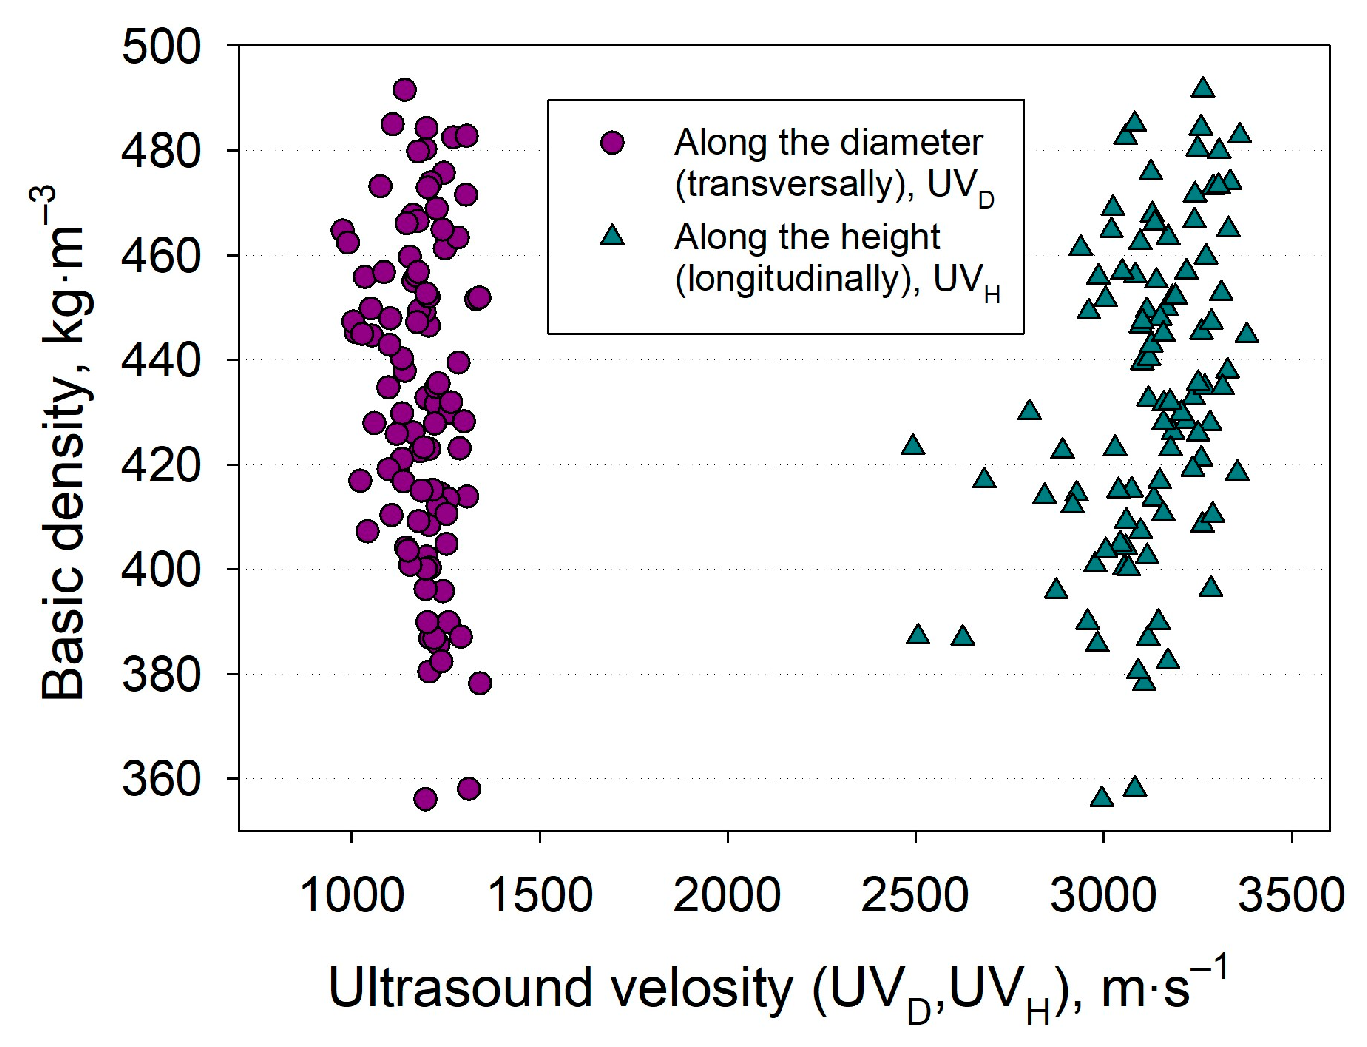
Application of ultrasonic techniques to predict the wood density in growing trees is limited since the relationship between wood basic density and ultrasound velocities was negligible (linear model, R2 = 0.14 for UVH and R2 = 0.04 for UVD, Figure 9).
The estimated parameters can be integrated into two separate clusters based on the degree of their correlation and the informative value (Figure 10). The first cluster, reflecting the viability of tree cenopopulations and the degree of competition between them, includes DBH (X1) and MC (X4 and X5), as well as the measurement of ultrasound velocity wave through the tree trunk (X7). The second cluster characterising the physical, mechanical, and technological properties of wood included indicators of their basic density (X8), DR, and FR (X9 and X10), as well as the measurement of ultrasound velocity signal along the trunk height (X6).
Wood basic density (X8) in growing trees can be predicted by the DR according to the linear regression model, with less predictive power in comparison with results obtained on defect-free cubic specimens [45]:
B D ( X 8 ) = 10.67 D R ( X 9 ) + 225.35 ,   R 2 = 0.71
When assessing the vitality of forest coenopopulations, it is advisable to use only two parameters: the mean diameter of trees and the MC of water-carrying tissues by the electrical-resistance method. In healthy stands with good development prospects, the average value of MC should not be below 70%. The wood’s basic density on the experimental plots does not depend on the plantation density, DBH, mean width of annual layers, or the proportion of latewood, which contradicts the findings of other researchers [2,13,15]. We believe that the unique characteristics of the forest site types of the experimental plots account for the variations in the findings obtained. The initial stand density is not, in our case, a limitation factor for the sapwood basic density. Wood density is limited at the experimental plots by poor and dry soil, leading to a decrease in the sell wall thickness and an increase in the proportion of empty space between the cell walls filled by the water solutions.
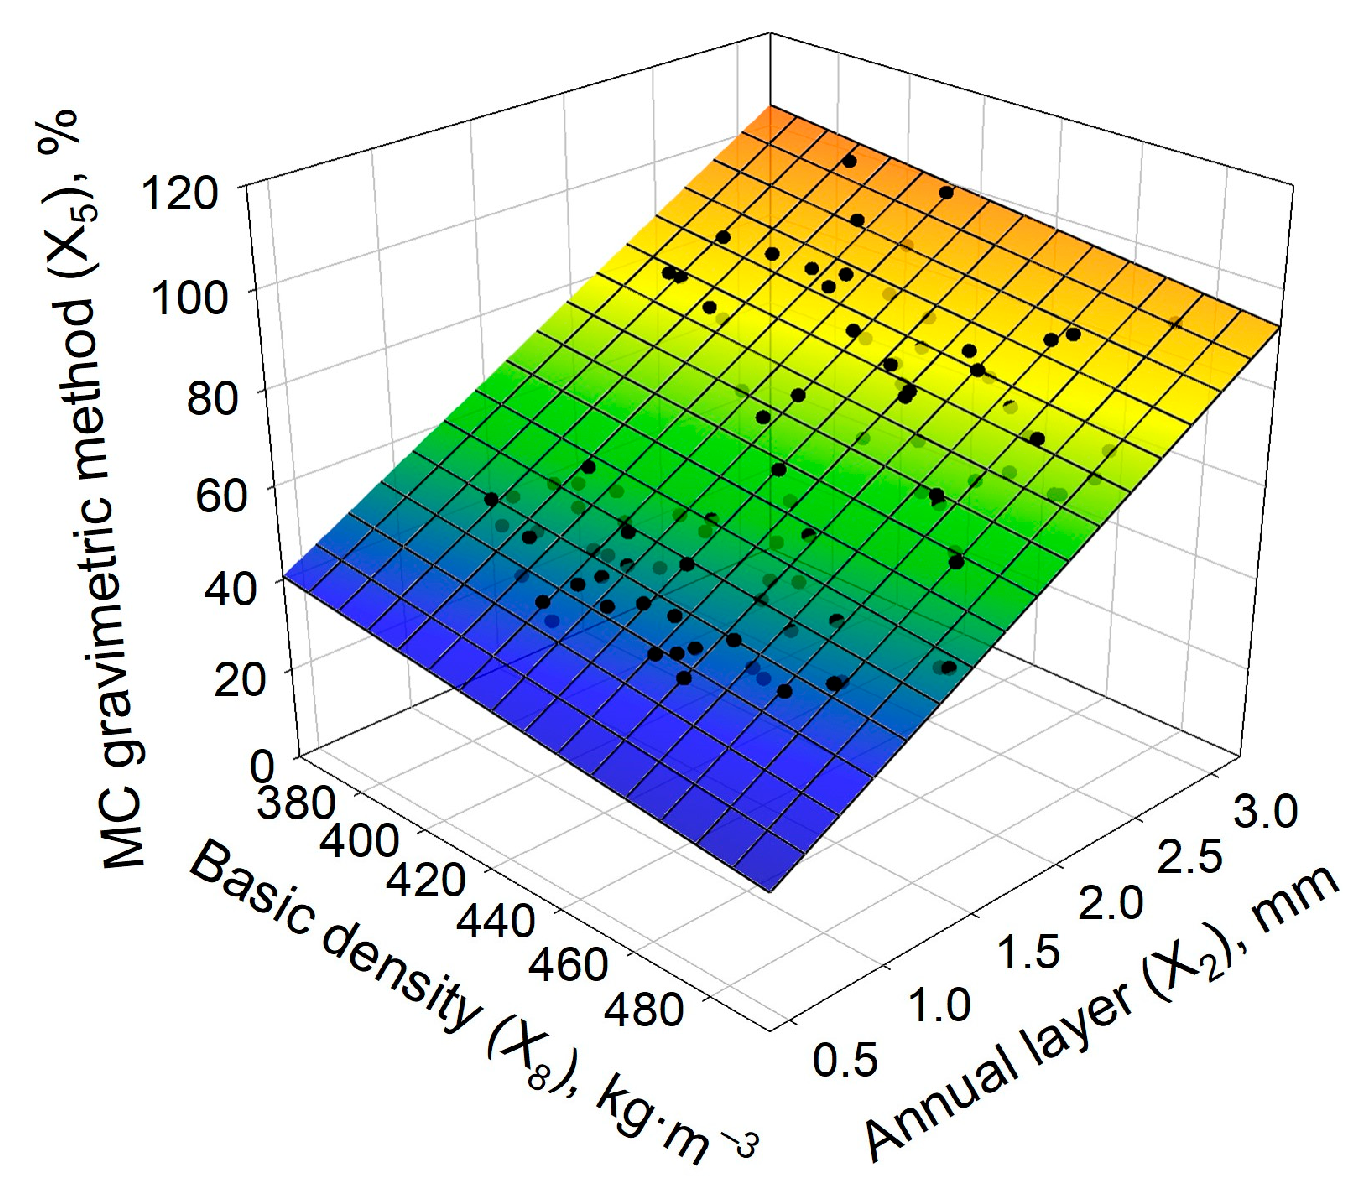
The strong interaction between wood MC, basic density, and mean width of the annual layers, as shown in Figure 11, which can be approximated by the multiple linear model, provides compelling evidence for this conclusion:
M C G M ( X 5 ) = 2.53 M A L ( X 2 ) 0.088 B D ( X 8 ) + 64.24 ,   R 2 = 0.71
Studies have indicated that the DR is not a constant value but rather decreases from sapwood to the pith (Table 8, Figure 12), indicating a proportional decrease in the wood’s basic density. The nature of the change in DR, shown in Figure 12, occurs almost identically for conventional groups of trees with low (<400 kg·m−3) and high basic density (480–570 kg·m−3).
Variation of wood density in the tree radial and longitudinal directions has great commercial importance [46]. Application of the DR allows for a non-destructive, indirect assessment of the wood density variation with high resolution (10 DR data per 1 mm of drilling depth). Radial DR profiles of trees with different diameters can be compared by dividing them into an equal number of sections with mean DR data, as presented in Figure 12.
It was also found that earlywood width for trees with high wood density (480–570 kg·m−3) fluctuated intensively and increased with tree age in comparison with trees with low wood density (<400 kg·m−3). The same trees exhibit quite opposite dynamics in the width of latewood (Figure 13).
Future research will be focused on the relationship between DR and the basic density of wood for different types of pine forests and the prediction of the stiffness of wood in trees by ultrasonic velocity measurements.

4. Conclusions

The high initial density of Scots pine plantations led to a decrease in diameter growth and MC of sapwood. Meanwhile, the wood’s basic density and ultrasound velocity along the tree trunk remained unchanged. Selecting the most promising trees for the intended purpose may be possible due to the variability of tree parameters, which is the foundation for the natural selection of trees in cenopopulations. The two primary factors that most accurately indicated the survival of coenopopulations of a stand were the mean DBH and the MC of their water-carrying tissues evaluated by the electrical-resistance method, which in healthy stands should not be below 70%. This evaluation suggests that the initial stand density of Scots pine plantations should not feature more than 3000 trees per ha, since higher stand densities will result in weakened trees and a reduction in their physiological functions. The basic density of wood in growing trees can be predicted by DR based on a linear regression model. There were differences in the dynamics of the earlywood and latewood width between trees with low and high wood density.

5. Patents

The authors filed a patent application for new non-destructive testing and the evaluation method based on time-of-flight ultrasonic measurements and drilling resistance for assessing the mechanical and physical characteristics of wood in growing trees. Application No. 2023127590 was submitted on 26 October 2023, to the Federal Service for Intellectual Property of the Russian Federation.

Author Contributions

Conceptualization and methodology Y.D. and E.S.; investigation and formal analysis Y.D., E.S. and A.K.; core sample preparation and assessment A.K. and E.S.; writing—original draft preparation Y.D. and E.S.; graphing results E.S.; writing—review and editing Y.D., E.S. and A.K.; funding acquisition E.S., Y.D. and A.K.; supervision E.S. All authors have read and agreed to the published version of the manuscript.

Funding

The research work was supported by the Russian Science Foundation (RSF, No. 23-16-00220), https://rscf.ru/en/project/23-16-00220/ (accessed on 15 May 2023) using equipment of the Core Facility Centre «Ecology, biotechnologies and processes for obtaining environmentally friendly energy carriers» of Volga State University of Technology, Yoshkar-Ola.

Data Availability Statement

Data are contained within the article.

Acknowledgments

The authors gratefully acknowledge Nadezhda Ivanova, Tatyana Tatiana Krivorotova, and Anastasia Prigunova (Volga State University of Technology, Yoshkar-Ola) for drilling-resistance profiles processing.

Conflicts of Interest

The authors declare no conflict of interest.

References

  1. Buzykin, A.I.; Pshenichnikova, L.S.; Suhovolskii, V.G. Gustota i Produktivnost Drevesnyh Cenozov [Density and Productivity of Wood Cenoses]; Nauka: Novosibirsk, Russia, 2002; pp. 1–152. [Google Scholar]
  2. Zhu, J.Y.; Scott, C.T.; Scallon, K.L.; Myers, G.C. Effects of plantation density on wood density and anatomical properties of Red pine (Pinus Resinosa Ait.). Wood Fiber Sci. 2007, 39, 502–512. [Google Scholar]
  3. Sobachkin, D.S.; Benkova, V.E.; Sobachkin, R.S.; Buzykin, A.I. The Influence of density on inventory parameters in young natural and experimental pine forests. Russ. J. For. Sci. 2009, 2, 3–9. [Google Scholar]
  4. Merzlenko, M.D.; Glazunov, Y.B. Growth and state of pine cropper with different density in Serebryanoborskoe experienced forestry. Lesn. Zhurnal-For. J. 2014, 6, 32–40. [Google Scholar]
  5. Naji, H.R.; Bakar, E.S.; Soltani, M.; Ebadi, S.E.; Abdul-Hamid, H.; Javad, S.K.S.; Sahri, M.H. Effect of Initial planting density and tree features on growth, wood density, and anatomical properties from a Hevea brasiliensis trial plantation. For. Prod. J. 2014, 64, 41–47. [Google Scholar]
  6. Rogozin, M.V.; Razin, G.S. Razvitie Drevostoev. Modeli, Zakony, Gipotezy [Development of Forest Stands. Models, Laws, Hypotheses]; Perm State University: Perm, Russia, 2015; pp. 1–277. [Google Scholar]
  7. Sang, Y.; Gao, P.; Kang, X.; Zhang, P. Effect of initial planting density on growth traits and wood properties of triploid Chinese white poplar (Populus tometosa) plantation. Forests 2021, 12, 1676. [Google Scholar] [CrossRef]
  8. Demakov, Y.P. Rezultaty Mnogoletnih Opytov Po Sozdaniyu i Vyrashchivaniyu Kultur Sosny Obyknovennoi v Respublike Marii El [The Results of Long-Term Experiments on the Establishment and Cultivation of Scots Pine in the Republic of Mari El]; Volga State University of Technology: Yoshkar-Ola, Russia, 2022; pp. 1–242. [Google Scholar]
  9. Gabira, M.M.; Girona, M.M.; DesRochers, A.; Kratz, D.; da Silva, R.B.G.; Duarte, M.M.; de Aguiar, N.S.; Wendling, I. The impact of planting density on forest monospecific plantations: An overview. Forest Ecol. Manag. 2023, 534, 120882. [Google Scholar] [CrossRef]
  10. Melo, L.E.D.L.; Silva, C.D.J.; Protásio, T.D.P.; Mota, G.D.S.; Santos, I.S.; Urbinati, C.V.; Trugilho, P.F.; Mori, F.A. Planting density effect on some properties of Schizolobium parahyba wood. Maderas-Cienc. Tecnol. 2018, 20, 381–394. [Google Scholar] [CrossRef]
  11. Cassidy, M.; Palmer, G.; Smith, R.G.B. The effect of wide initial spacing on wood properties in plantation grown Eucalyptus pilularis. New For. 2013, 44, 919–936. [Google Scholar] [CrossRef]
  12. Pisarenko, A.I.; Redko, G.I.; Merzlenko, M.D. Iskusstvennye Lesa [Forest Plantations]; Vserossiiskii Nauchno-Issledovatelskii Informatsionnyi Tsentr «Lesresurs»: Moscow, Russia, 1992; pp. 1–308. [Google Scholar]
  13. Poluboiarinov, O.I.; Fedorov, R.B. Vliyanie klimaticheskih faktorov na plotnost drevesiny sosny obyknovennoi v lesnoi zone evropeiskoi chasti SSSR [The impact of climatic factors on the density of Scots pine stand in the forest zone of the European part of the USSR]. Lesn. Zhurnal-For. J. 1985, 2, 5–9. [Google Scholar]
  14. Revin, A.I.; Smoljanov, A.N.; Starostyuk, N.B. Physical and mechanical wood properties of pine stands of different plantation density in the Tambov region. Lesn. Zhurnal-For. J. 2010, 2, 38–43. [Google Scholar]
  15. Danilov, D.A.; Stepanenko, S.M. Structure and density of wood of spruce and pine in plantations of the Leningrad region. Izv. St.-Peterburg For. Eng. Acad. 2014, 204, 35–46. [Google Scholar]
  16. Melekhov, V.I.; Babich, N.A.; Korchagov, S.A. Kachestvo Drevesiny Sosny v Kulturakh [The Quality of Wood in Pine Plantations]; Arkhangelsk State Technical University: Arkhangelsk, Russia, 2003; pp. 1–110. [Google Scholar]
  17. Lomov, V.D. Struktura Drevostoev Sosny i Anatomicheskoe Stroenie Godichnyh Sloev [Structure of pine stands and anatomical structure of annual layers]. In Proceedings of the 6th RCCWS International Symposium, Krasnoyarsk, Russia, 10–16 September 2018; pp. 138–140. [Google Scholar]
  18. Konovalov, D.Y. Kachestvo Drevesiny Kultur Sosny v Severnoi i Yuzhnoi Podzonah Taigi [The Quality of Pine Wood in the Northern and Southern Taiga Subzones]. Ph.D. Thesis, Arkhangelsk State Technical University, Arkhangelsk, Russia, 2007. [Google Scholar]
  19. Korchagov, S.A. Povyshenie Kachestvennoi Produktivnosti Nasazhdenii na Lesovodstvennoi Osnove [Improving the Quality Productivity of Plantations Based on Forestry Treatment]. Ph.D. Thesis, Arkhangelsk State Technical University, Arkhangelsk, Russia, 2010. [Google Scholar]
  20. Korchagov, S.A.; Gribov, S.E.; Klyukvina, N.A. Sravnitelnaya harakteristika fiziko-mekhanicheskih svoistv drevesiny sosny v posadkah po tipam lesa [Comparative characteristics of physical and mechanical properties of Scots pine in plantations by forest types]. Lesn. Vestn./For. Bull. 2007, 5, 54–56. [Google Scholar]
  21. Konofalska, E.; Kozakiewicz, P.; Buraczyk, W.; Szeligowski, H.; Lachowicz, H. The technical quality of the wood of Scots pine (Pinus sylvestris L.) of diverse genetic origin. Forests 2021, 12, 619. [Google Scholar] [CrossRef]
  22. Bues, C.T. The influence of stand density and thinning on the wood density of South African radiata pine. Holz Roh. Werkst. 1985, 43, 69–73. [Google Scholar] [CrossRef]
  23. Grammel, R. Connections between growing conditions and wood-technological properties of spruce. Eur. J. For. Res. 1990, 109, 119–129. [Google Scholar] [CrossRef]
  24. Šilinskas, B.; Varnagiryte-Kabašinskiene, I.; Aleinikovas, M.; Beniušienė, L.; Aleinikovienė, J.; Škėma, M. Scots pine and Norway spruce wood properties at sites with different stand densities. Forests 2020, 11, 587. [Google Scholar] [CrossRef]
  25. Oliveira, I.R.; Chagas, M.P.; Bouillet, J.-P.; Longui, E.L.; de Lima, I.L. Effect of tree spacing on growth and wood density of 38-year-old Cariniana legalis trees in Brazil. South. For. 2018, 80, 311–318. [Google Scholar] [CrossRef]
  26. Montagu, K.D.; Düttmer, K.; Barton, C.V.M.; Cowie, A.L. Developing general allometric relationships for regional estimates of carbon sequestration—An example using Eucalyptus pilularis from seven contrasting sites. For. Ecol. Manag. 2005, 204, 113–127. [Google Scholar] [CrossRef]
  27. Kuzmin, S.R.; Vaganov, E.A. The anatomic characteristics of Scots pine tree rings in provenances in the Angara river basin. Russ. J. For. Sci. 2007, 4, 3–12. [Google Scholar]
  28. Kuzmin, S.R.; Rogovtsev, R.V. Radial growth and percent of latewood in Scots pine provenance trials in Western and Central Siberia. Sib. J. For. Sci. 2016, 6, 113–125. [Google Scholar] [CrossRef]
  29. Wang, X. Acoustic measurements on trees and logs: A review and analysis. Wood Sci. Technol. 2013, 47, 965–975. [Google Scholar] [CrossRef]
  30. Gao, S.; Wang, X.; Wiemann, M.C.; Brashaw, B.K.; Ross, R.J.; Wang, L. A critical analysis of methods for rapid and non-destructive determination of wood density in standing trees. Ann. For. Sci. 2017, 74, 27. [Google Scholar] [CrossRef]
  31. Bouffier, L.; Charlot, C.; Raffin, A.; Rozenberg, P.; Kremer, A. Can wood density be efficiently selected at early stage in maritime pine (Pinus pinaster Ait.). Ann. For. Sci. 2008, 65, 106. [Google Scholar] [CrossRef]
  32. Fundova, I.; Funda, T.; Wu, H.X. Non-destructive wood density assessment of Scots pine (Pinus Sylvestris L.) using Resistograph and Pilodyn. PLoS ONE 2018, 13, e0204518. [Google Scholar] [CrossRef] [PubMed]
  33. Downes, G.M.; Lausberg, M.; Potts, B.; Pilbeam, D.; Bird, M.; Bradshaw, B. Application of the IML resistograph to the infield assessment of basic Density in Plantation Eucalypts. Aust. For. 2018, 81, 177–185. [Google Scholar] [CrossRef]
  34. Oliveira, J.T.S.; Wang, X.; Vidaurre, G. Assessing specific gravity of young Eucalyptus plantation trees using a resistance drilling technique. Holzforschung 2017, 71, 137–145. [Google Scholar] [CrossRef]
  35. Eckard, J.T.; Isik, F.; Bullock, B.; Li, B.; Gumpertz, M. Selection efficiency for solid wood traits in Pinus taeda using time-of-flight acoustic and micro-drill resistance methods. For. Sci. 2010, 56, 233–241. [Google Scholar]
  36. Todoroki, C.L.; Lowell, E.C.; Filipescu, C.N. Wood density estimates of standing trees by micro-drilling and other non-destructive measures. N. Z. J. For. Sci. 2021, 51, 14. [Google Scholar] [CrossRef]
  37. Chhin, S.; Dahle, G. Using acoustic tomography to infer stem wood quality of pine forests affected by a fungal pathogen in different latitudinal regions and plantation densities. Ecologies 2023, 4, 512–520. [Google Scholar] [CrossRef]
  38. Llana, D.F.; Short, I.; Harte, A.M. Use of non-destructive test methods on Irish hardwood standing trees and small-diameter round timber for prediction of mechanical properties. Ann. For. Sci. 2020, 77, 62. [Google Scholar] [CrossRef]
  39. Nutto, L.; Biechele, T. Drilling resistance measurement and the effect of shaft friction—Using feed force information for improving decay identification on hard tropical wood. In Proceedings of the 19th International Nondestructive Testing and Evaluation of Wood Symposium, Rio de Janeiro, RJ, Brazil, 22–25 September 2015; pp. 154–161. [Google Scholar]
  40. Sharapov, E.; Wang, X.; Smirnova, E. Drill bit friction and its effect on resistance drilling measurements in logs. In Proceedings of the 20th International Nondestructive Testing and Evaluation of Wood Symposium; USDA, Forest Products Laboratory, Madison, WI, USA, 12–15 September 2017; pp. 405–415. [Google Scholar]
  41. Gendvilas, V.; Downes, G.M.; Neyland, M.; Hunt, M.; Jacobs, A.; O’Reilly-Wapstra, J. Friction correction when predicting wood basic density using drilling resistance. Holzforschung 2021, 75, 508–516. [Google Scholar] [CrossRef]
  42. Tiukavina, O.N.; Neverov, N.A.; Melekhov, V.I.; Korchagov, S.A.; Makarov, S.S.; Korepin, D.Y. Osobennosti interpretatsii rezultatov rezistogramm pri otsenke kachestva stvolovoy drevesiny sosny [Resistogram results interpretation in assessing pine trunk wood quality]. Lesn. Vestn./For. Bull. 2023, 27, 18–26. [Google Scholar] [CrossRef]
  43. Ugolev, B.N. Drevesinovedenie s Osnovami Lesnogo Tovarovedeniya [Wood Science with the Basics of Forestry Merchandising]; Moscow State Forest University: Moscow, Russia, 2001; pp. 1–340. [Google Scholar]
  44. GOST 16483.7-71; Drevesina. Metody Opredeleniya Vlazhnosti [Wood. Methods for Determination of Moisture Content]. Standards Publisher: Moscow, Russia, 2006.
  45. Sharapov, E.; Brischke, C.; Militz, H.; Smirnova, E. Prediction of modulus of elasticity in static bending and density of wood at different moisture contents and feed rates by drilling resistance measurements. Eur. J. Wood Prod. 2019, 77, 833–842. [Google Scholar] [CrossRef]
  46. Zaque, L.A.M.; Ferreira, M.D.; Melo, R.R. Radial and longitudinal variation of Araucaria angustifolia wood basic density for different ages. Pesqui. Florest. Bras. 2018, 38, e201601368. [Google Scholar]
Figure 1. Locations of the experimental plantation and plots with different initial plantation densities in the Mari El Republic, Russian Federation.
Forests 15 00233 g001
Figure 2. Images of the experimental plots with different initial plantation densities: (a) 500 trees per ha; (b) 1000 trees per ha; (c) 3000 trees per ha; (d) 5000 trees per ha; (e) 10,000 trees per ha.
Forests 15 00233 g002
Figure 3. Schematic diagram of drilling resistance (DR) and ultrasonic signal transit time (TT) measurements in radial direction (north–south); wood moisture content (MC), TT along the height of the trunk, and extraction of wood core (north side of a tree).
Forests 15 00233 g003
Figure 4. Influence of the initial plantation density on: X1—diameter at breast height (DBH); X8—basic density of wood; X4—moisture content evaluated by the electrical-resistance method (MCERM); X5—moisture content evaluated by the gravimetric method (MCGM); X6—ultrasound velocity along the height of the trunk (UVH); X7—ultrasound velocity through the trunk (UVD); X9—mean drilling resistance corresponding to tree diameter; X10—mean feeding resistance corresponding to tree diameter. Box—25th–75th percentiles; whiskers 10th–90th percentiles; dots 5th–95th percentiles; solid line in the box is the median, dash line is the mean.
Forests 15 00233 g004
Figure 5. Relationship between diameter at breast height (DBH, X1) and moisture content (MC): (a) MC evaluated by the electrical-resistance method (MCERM, X4); (b) MC evaluated by the gravimetric method (MCGM, X5). R2 coefficient of determination; SEE standard error of the estimate; CB confidence band.
Forests 15 00233 g005
Figure 6. Relationship between moisture contents evaluated by the gravimetric (MCGM, X5) and electrical-resistance (MCERM, X4) methods. R2 coefficient of determination, SEE standard error of the estimate, CB confidence band.
Forests 15 00233 g006
Figure 7. Relationship between the diameter at breast height (DBH) and ultrasound velocity through the trunk diameter (UVD) at breast height (circled data are excluded from the linear model).
Forests 15 00233 g007
Figure 8. Interaction between wood’s basic density (BD, X8) and diameter at breast height (DBH, X1) for trees with varied initial stand density.
Forests 15 00233 g008
Figure 9. Interaction between wood basic density and ultrasound velocity through the tree trunk (UVD) and along the height of the trunk (UVH).
Forests 15 00233 g009
Figure 10. Dendrogram of the cluster analysis using Ward’s method and 1–r distance based on Pearson correlation coefficient as similarity index for the estimated parameters.
Forests 15 00233 g010
Figure 11. Experimental data and smoothed surface of the interaction between basic density, mean width of annual layers, and moisture content (MC) of wood evaluated by the gravimetric method.
Forests 15 00233 g011
Figure 12. Mean drilling resistance (DR) of a tree radius divided into five equal sections (I–V). Two groups of trees with sapwood basic density (BD) below 400 kg·m−3 and 480–570 kg·m−3.
Forests 15 00233 g012
Figure 13. Earlywood (a) and latewood (b) width for trees with sapwood basic density (BD) below 400 kg·m−3 and between 480–570 kg·m−3.
Forests 15 00233 g013
Table 1. Encoding of the estimated parameters of trees and wood properties.
ParameterCode
Diameter at breast height (DBH), cmX1
Mean width of the annual layer (DBH/(2·tree age)), mmX2
Latewood content (LC), %X3
Moisture content by electrical resistance method (MCERM), %X4
Moisture content of the core by the gravimetric method (MCGM), %X5
Ultrasound velocity along the tree trunk (UVH), m/cX6
Ultrasound velocity through the tree trunk (UVD), m/cX7
Basic density of sapwood (core) (BD), kg·m−3X8
Drilling resistance for 5 cm depth (core length) (DR), %X9
Feeding resistance for 5 cm depth (core length) (FR), %X10
Table 2. Variability of the estimated parameters.
ParameterM ± mMinMaxSpnCVAsE
X116.0 ± 0.66.728.65.713.661.40.155−1.232
X20.80 ± 0.030.341.430.293.661.40.155−1.232
X330.3 ± 0.918.948.96.83.059.60.2920.435
X472.7 ± 0.660.182.45.480.843.5−0.074−1.036
X565.4 ± 1.637.6106.116.482.559.20.514−0.786
X63117 ± 1724923380167.00.526.7−1.3883.082
X71184 ±8.0 976134180.70.738.9−0.4950.011
X8434 ± 3.335657833.60.843.00.5492.258
X919.5 ± 0.2613.927.92.561.345.40.5100.921
X109.15 ± 0.126.0113.01.251.439.80.4620.575
M ± m—mean and standard error; min, max—minimum and maximum values; S—standard deviation; p—accuracy, %; nCV—normalized coefficient of variation, nCV = 100 × S/(Mmin), %; As—skewness; E—kurtosis.
Table 3. Results of variance decomposition for estimated parameters.
VarianceThe Influence of the Factor (%) and the Level of Probability of Erroneous Conclusion
X1X3X4X5X6X7X8X9X10
Between the groups of stand density72.734.067.062.13.819.52.111.416.4
Inside the group of stand density27.366.033.037.996.280.597.988.683.6
p-value<0.001<0.001<0.001<0.0010.437<0.0010.7280.0210.002
Table 4. Effect of stand density on mean values and standard error of estimated parameters.
Parameter500 per ha1000 per ha3000 per ha5000 per ha10,000 per ha
X122.7 ± 0.620.3 ± 0.614.9 ± 0.912.2 ± 0.69.9 ± 0.5
X332.3 ± 1.425.1 ± 1.429.7 ± 0.926.0 ± 0.628.5 ± 0.9
X478.7 ± 0.576.7 ± 0.772.5 ± 1.067.9 ± 0.867.7 ± 0.5
X581.3 ± 2.679.9 ± 2.962.0 ± 2.852.1 ± 1.751.9 ± 1.0
X63078 ± 263094 ± 323118 ± 493174 ± 273121 ± 47
X71207 ± 201216 ± 161207 ± 161166 ± 161122 ± 14
X8436 ± 6437 ± 10428 ± 8429 ± 7441 ± 6
X921.0 ± 0.719.9 ± 0.518.6 ± 0.618.8 ± 0.519.5 ± 0.4
X1010.0 ± 0.39.5 ± 0.28.8 ± 0.38.6 ± 0.28.9 ± 0.2
Table 5. Results of multiple range tests.
Initial Plantation DensityEstimated Parameters
X1X4X5X6X7X8X9X10
500      x      x      xx  xxxx
1000      x      x      xxxxxxx
3000   x   x   xxxxxxx
5000xxxxxxxxx
10,000xxxxxxxx
Table 6. Effect of stand density on variability of estimated parameters.
ParameterStandard Deviation of Estimated Parameters
500 per ha1000 per ha3000 per ha5000 per ha10,000 per ha
X12.692.874.272.872.10
X30.680.640.480.400.39
X411.808.307.8010.2013.20
X52.363.004.503.472.18
X611.7013.0012.407.564.57
X7118.50143.00218.20119.10208.60
X890.6069.5069.9073.3063.30
X925.4045.2037.5030.5027.30
X103.182.2602.6502.241.75
Table 7. Pearson correlation coefficient between estimated parameters.
ParameterX1X4X5X6X7X8X9X10
X11.00
X40.821.00
X50.860.811.00
X60.050.02−0.111.00
X70.650.310.41−0.151.00
X80.110.09−0.090.38−0.191.00
X90.310.270.230.42−0.080.811.00
X100.490.460.400.390.020.710.921.00
The lower level of significant correlation coefficient was 0.25.
Table 8. Mean and standard error of drilling resistance (DR) for a tree radius divided into five equal sections (I–V).
Trees/haIIIIIIIVV
50023.4 ± 0.620.4 ± 0.919.0 ± 0.816.1 ± 0.514.0 ± 0.6
100023.0 ± 0.519.1 ± 0.517.2 ± 0.715.8 ± 0.613.7 ± 0.5
300023.3 ± 0.619.3 ± 0.516.3 ± 0.414.9 ± 0.512.9 ± 0.5
500024.1 ± 0.721.8 ± 0.617.8 ± 0.516.0 ± 0.413.9 ± 0.3
10,00025.0 ± 0.622.0 ± 0.620.0 ± 0.516.9 ± 0.414.3 ± 0.3
Disclaimer/Publisher’s Note: The statements, opinions and data contained in all publications are solely those of the individual author(s) and contributor(s) and not of MDPI and/or the editor(s). MDPI and/or the editor(s) disclaim responsibility for any injury to people or property resulting from any ideas, methods, instructions or products referred to in the content.

