Article

Evaluation of Fine Root Morphology and Rhizosphere Environmental Characteristics of the Dioecious Idesia polycarpa Maxim

1
Henan Province Engineering Technology Research Center for Idesia, Zhengzhou 450046, China
2
National Forestry and Grassland Administration Key Laboratory for Central Plains Forest Resources Cultivation, Zhengzhou 450046, China
3
College of Forestry, Henan Agricultural University, Zhengzhou 450046, China
4
Department of Chemical Engineering, Tsinghua University, Beijing 100084, China
5
College of New Materials and Chemical Engineering, Beijing Institute of Petrochemical Technology, Beijing 102617, China
*
Authors to whom correspondence should be addressed.
Forests 2024, 15(2), 234; https://doi.org/10.3390/f15020234
Submission received: 19 December 2023 / Revised: 23 January 2024 / Accepted: 24 January 2024 / Published: 25 January 2024

Abstract

:
To explore the differences in the fine root characteristics and rhizosphere environment of male and female Idesia polycarpa Maxim at different stages, 7-year-old male and female I. polycarpa were used as plant materials. The fine root characteristics were measured with a root scanner, and rhizosphere soil was collected at the flowering stage (May), fruit accumulation stage (July), and fruit maturity stage (October). In addition, this study analyzed the soil nutrient characteristics of these conditions at different stages. At the same time, Illumine high-throughput sequencing technology and gas chromatography–tandem mass spectrometry (GC–MS) technology were used to analyze the rhizosphere microbes and metabolites of male and female plants at different stages. The results showed that the total root length, surface area, total volume, root tip number, and total average diameter of the fine root of female plants were larger than those of male plants, and the difference reached its maximum in the fruit material accumulation stage. Total carbon (TC) and total nitrogen (TN) content in the rhizosphere soil of male and female plants significantly differed over multiple stages, while available soil nitrogen and potassium content significantly differed during fruit ripening. The rhizosphere microbial composition of male and female plants was similar, and the dominant bacteria in the rhizosphere soil of each stage were Proteobacteria, Acidobacteria, Ascomycota, and Mortierellomycota. The relative abundance of Bacillus, Arthrobacter, Volutella, and Neocosmospora in rhizosphere soil at different stages differed between male and female plants. Combined with the OPLS-DA model and database retrieval, 29 significantly different metabolites, most of which were carbohydrates, were detected in the rhizosphere soil of male and female plants. Moreover, there were more significant metabolites in the rhizosphere soil at the flowering stage than in the fruit ripening stage. Through RDA analysis, available potassium (AK), Pedomicrobium, Chaetomium, and Glucose 1 had the greatest influence on fine root traits of I. polycarpa. The results indicated that the fine root traits were negatively correlated with AK and rhizosphere metabolites. Moreover, positive correlations were found with rhizosphere microorganism traits. The above results laid a foundation for the field management of I. polycarpa and the screening and application of rhizosphere growth-promoting bacteria resources.

1. Introduction

Due to the long-term evolution of dioecious plants, there are gender differences in morphological characteristics, resource utilization, and biomass accumulation among individuals. This difference is generally related to different reproductive costs [1]. Roots, as one of the most important underground organs of plants, can not only fix the surface but also have important functions in absorbing, converting, and storing [2]. Studies have found differences in root morphology between male and female plants, showing gender dimorphism. The root growth rate and quality of Chaenomelis fructus female plants are significantly higher than those of male plants [3]. In the case of sufficient water, the Populus cathayana female plants have strong competitive ability, but under drought stress, the male plants have strong competitive ability [4]. The intensity of leaf litter affected the reserves of thick and fine roots [5]. The total length, surface area, and volume of female P. cathayana roots of heterosexual adjacent plants are significantly higher than the male plants [6]. Moreover, fine roots are the most active part of plant roots [7] and are the main bearers of nutrients that plants absorb. The growth of the plants is mostly determined by fine root functional traits, including root length, root diameter, specific root length, and root tissue density [8]. Exploring changes in plant root growth helps in understanding plant growth patterns.
The rhizosphere is crucial for exchanging materials and energy between plants and the external environment. Nutrient elements such as N, P, and K in rhizosphere soil are the basis for plant growth and development, but nutrient utilization by male and female plants is quite different due to gender dimorphism [9]. Under full light conditions, C/N and C/P in the coarse roots of female Pinus yunnanensis increased while decreasing in the coarse roots of male plants [10]. Song et al. [11] showed that female P. yunnanensis needed more nitrogen to maintain growth and reproduction. Fu et al. [12] found that the contents of total nitrogen (TN), total phosphorus (TP), total potassium (TK), available phosphorus (AP), and AK in the rhizosphere soil of male plants were significantly higher than those of female plants. Studies have shown that some nutrients in the soil need to be transformed by microorganisms to be absorbed by plants [13,14]. Rhizosphere microorganisms are nutrient cycle catalysts between plant roots and rhizosphere soil [15]. Zhou et al. [16] showed that host genotype affected the composition of plant rhizosphere microorganisms. The relative abundance of Planctomycetaceae, Xanthomonadaceae, and Cytophagaceae in the rhizosphere soil of male Populus euphratica plants was higher than that of female plants [17]. In the interaction between plants and rhizosphere microorganisms, plants affect the composition of soil microbial communities through root exudates, such as sugars, secondary metabolites, and organic acids, and accelerate nutrient decomposition through the action of microorganisms [18,19]. Du et al. [20] found that the total amino acid content in the rhizosphere soil of Beta vulgaris increased with B. vulgaris growth. Mille et al. [21] showed that plant genotypes influenced differences in metabolic profiles in rhizosphere soil. Xia et al. [22] found that the acid phosphatase content in rhizosphere soil in male poplar was higher than that in females. Plant characteristics determine the interaction of plant–soil–microorganisms. Exploring the root environmental differences between male and female plants helps us understand plant biological characteristics.
However, Idesia polycarpa is a dioecious plant of the Idesia genus in Salicaceae. Idesia polycarpa plays a crucial role in landscaping and greening efforts, and their attractive shapes and lush flowers contribute to the aesthetic appeal of outdoor spaces [23]. The fruit yield is high, the oil content is as high as 35%, and the oil is rich in nutrients, such as linoleic acid, vitamin E, and sterols. It is a “double high” vegetable oil with high nutrition and value [24]. At present, relevant scholars have studied the growth of I. polycarpa from the above-ground parts of seeds [25], leaves [26], and branches [27], and there are few reports on its underground parts ([28], unpublished data). Our study used the dioecious Idesia polycarpa Maxim species to explore the differences in fine root morphology, rhizosphere soil nutrients, and their metabolites in male and female plants. This study aimed to gain a deeper understanding of the biological properties, provide a theoretical basis, and lay a foundation for field management of Idesia polycarpa.

2. Materials and Methods

2.1. Overview of the Test Area

The experimental area is located at the Forestry Experimental Station of Henan Agricultural University in Zhengzhou City, Henan Province (112° 42′ 114° 14′ E, and 34° 16′ 34° 58′ N) (Figure 1). The mean annual temperature of this site is 14.2 °C, the annual precipitation is 623.30 mm, and the frost-free period of the year is 220 days. Soils in Zhengzhou City are characterized by low organic matter content, high effective phosphorus content, and coarse texture [29]. The soil texture of this trial site is sandy loam.

2.2. Experimental Materials

In December 2020, three male and three female plants of 7-year-old I. polycarpa, with the same growth and no obvious pests and diseases, were selected from the experimental site. These plants were part of a plantation with a spacing of 1.5 m × 1.5 m. According to the method introduced by Johnson et al. [30], six plants were selected at the experimental site, two minirhizotron tubes were placed in the north–south direction of each experimental material at a 45° angle to the ground, and a total of 12 minirhizotron tubes were embedded. The minirhizotron tubes (length: 100 cm; outer diameter: 7.0 cm; inner diameter: 6.40 cm) had a 45° angle with the ground, about 20 cm was exposed to the ground, and the vertical observation distance was about 40 cm. The leaky part of the micro root canal was wrapped in black tape, and a layer of aluminum foil was added. During the test, the micro root canal was protected against interference [31,32]. Roots were scanned and observed using the Plant Root Growth Monitoring System CL-600 (CID, Camas, WA, USA) during the 25th day of May 2021 (D1; flowering stage, female: CX5; male: XS5), July 2021 (D2; fruit accumulation stage), and October 2021 (D3; fruit maturity stage, female: CX10; male: XS10). The fine root samples were collected at all stages (D1, D2, and D3) and treatments (female and male), and the soil was cleaned and removed to keep the root system intact. Subsequently, the roots were then cut and spread flat in a root tray with distilled water. The water depth was required for the roots to be completely covered, a glass rod was used to place them in a stretched state, and they were finally covered with a backplate for root scanning. The image acquisition area was 21.59 cm × 19.57 cm. At the same time, the sterilized root drill was used to drill 0–20 cm soil samples in the four directions of the selected plant, and the distance was 20 cm from the tree trunk [33]. After mixing evenly, the samples were placed in an incubator with dry ice and returned quickly to the laboratory. Subsequently, one part of the soil sample was placed in a refrigerator at −80 °C to determine soil microorganisms and metabolites, and the other part was dried in the laboratory to determine soil nutrient content.

2.3. Fine Root Morphology Measurement

WinRHIZO Tron MF (Regent Instruments, Inc., Québec, QC, Canada) root analysis software was used to analyze photos of fine roots (the diameter between 2 and 5 mm) taken in each period, and the total root length, root tip number, average root diameter, and total root surface area of the fine roots of male and female I. polycarpa in each stage were obtained. The IBM SPSS Statistics v. 26 (IBM Corp., Armonk, NY, USA; available online: https://www.ibm.com, accessed on 19 January 2024) program was used for ANOVN data analysis, and Origin 23b (available online: https://www.originlab.com, accessed on 19 January 2024) was used to draw bar charts.

2.4. Soil Nutrient Determination and Analysis

According to the soil agrochemical analysis [34], the soil pH value was determined with the pH meter method with a water–soil ratio of 2.5:1. An automatic elemental analyzer (EURO EA3000) (EuroVector S.p.A., Leuven, Belgium) was used to determine the TC and TN. The AN was determined by 1 mol/L NaOH extraction-acid titration. The AP was determined using the 0.5 mol/L NaHCO3 extraction-molybdenum antimony colorimetric method. The AK was determined using a 1 mol/L CH3COONH4 extraction flame photometer.

2.5. Genome Sequencing

Total DNA was extracted as instructed in an E.Z.N.A. ® soil kit (Omega Bio-tek, Norcross, GA, USA). The concentration and purity of DNA were measured using NanoDrop2000, and DNA quality was measured using 1% agarose gel electrophoresis. Primers 341F (5′-ACTCCTACGGGGAGGCAGCAG-3′) and 806R (5′-GGACTACHVGGGTWTCTAAT-3′) were used to amplify the V3-V4 region of the bacterial 16 S r RNA gene. The ITS1-ITS2 mushroom region was amplified with ITS1-1F-F (5′-CTTGGTCATTTAGAGGAAGTAA-3′) and ITS1-1F-R (5′-GCTGCGTTCTTCATCGATGC-3′) by PCR. PCR reaction conditions: 3 min before denaturation at 95 °C, 27 cycles (95 °C and 30 s, 55 °C annealing 30 s, 72 °C extension 30 s), 72 °C extension 10 min to purification of amplified products and construction of library. Once the library was qualified, it was sequenced with the Miseq PE300 platform of Illumina. The Wekemo Tech Group Co., Ltd., Shenzhen, China, was commissioned for DNA extraction, PCR amplification, and sequencing.

2.6. Bioinformatics Analysis

Quality control and de-noising were performed on the sequencing results with the QIIME2 plugin. Based on similarity, the sequence was grouped into the Operational Taxonomic Unit (OTU), and the species were annotated. The Alpha diversity index was computed using QIIME2 (Quantitative Insights Into Microbial Ecology vs. 2022.11) software [35]. R software (V4.1.0) was used to analyze the difference in Alpha diversity index between groups, and a Venn diagram, species relative abundance diagram, microbial and fine root trait redundancy analysis (RDA) diagram, and association heat maps were drawn.

2.7. Determination of Rhizosphere Soil Metabolites

The samples were vacuum freeze-dried and grounded (30 Hz; 30 s) to powder with a grinding instrument. The 0.5 g sample was weighed, and 1 mL methanol:isopropanol:water (3:3:2, V:V:V) extract was added. After shaking at room temperature for 3 min, the sample was placed in an ice water bath for 20 min. After centrifugation at 12,000 r/min for 3 min at 4 °C, the supernatant was transferred to the injection bottle. The 0.020 mL internal standard (10 μg/mL) was added, dried with the nitrogen-blowing instrument, and placed in a freeze-drying machine for freeze-drying. Subsequently, 0.1 mL of methoxyamine pyridine (0.015 g/mL) was added and placed in an oven at 37 °C for 2 h, followed by 0.1 mL of BSTFA (with 1% TMCS) in an oven at 37 °C for 30 min to obtain a derivatization solution. The derivatization solution was diluted to 1 mL, filtered by a 0.22 μm organic phase needle filter, stored in a refrigerator at −20 °C, and injected for GC–MS detection.
This study detected the metabolites using gas chromatography (Agilent8890-5977B, Santa Clara, CA, USA). The qualitative and quantitative analysis of metabolite data was performed based on Maiwei’s self-built S_TMS_MWGC database.

2.8. Metabolite Data Analysis

Using R software, the metabolism of different samples was compared and analyzed, and the results were analyzed using multivariate statistics. Based on the variable importance projection (VIP), the results obtained by OPLS-DA, VIP ≥ 1, and p < 0.05 were defined as significantly altered metabolites (SCMs), and the corresponding differential metabolites were submitted to the KEGG (Kyoto Encyclopedia of Genes and Genomes) website to obtain metabolic pathways. Using R software (V4.1.0), the redundant analysis (RDA) and relative heat maps of significant difference metabolites and fine root characters were plotted.

3. Results

3.1. Fine Root Characteristics of Female and Male Idesia polycarpa

There were significant differences in the morphological characteristics of fine roots between female and male I. polycarpa plants (Figure 2), and the indicators of fine root traits of female plants were higher than those of male plants. In the fruit material accumulation period, the difference in fine roots between male and female plants was greatest. The total root length (134.56%), total surface area (176.52%), total volume (270.00%), and root tip number (113.33%) of fine roots of females were higher than those of male plants. During the period from flowering to fruit accumulation, the total root length of fine roots of female plants maintained an increasing trend, while the total surface area, total volume, and root tip number increased rapidly and then decreased slightly. The total root length, surface area, volume, and root tip number of male fine roots maintained a slow growth trend.

3.2. Nutrient Characteristics of Rhizosphere Soil of Male and Female Plants

Results of the rhizosphere soil nutrient contents of male and female plants in different growth stages showed that the rhizosphere soil pH of male and female plants in each period was alkaline, and there was no significant difference (Figure 3). During the flowering stage, the contents of TC and TN in the rhizosphere soil of female plants were significantly higher than those of male plants, by 30.68% and 31.02%, respectively, and the contents of AN, AP, and AK were lower than those of male plants. During the fruit material accumulation period, nutrient contents in the rhizosphere soil of male and female plants were different but insignificant. During the fruit material accumulation stage, the contents of TC and AK in the rhizosphere of male plants were significantly lower than those of female plants by 27.33% and 25.29%, respectively. However, the contents of TN and AN were significantly higher than those of female plants by 32.22% and 54.79%.

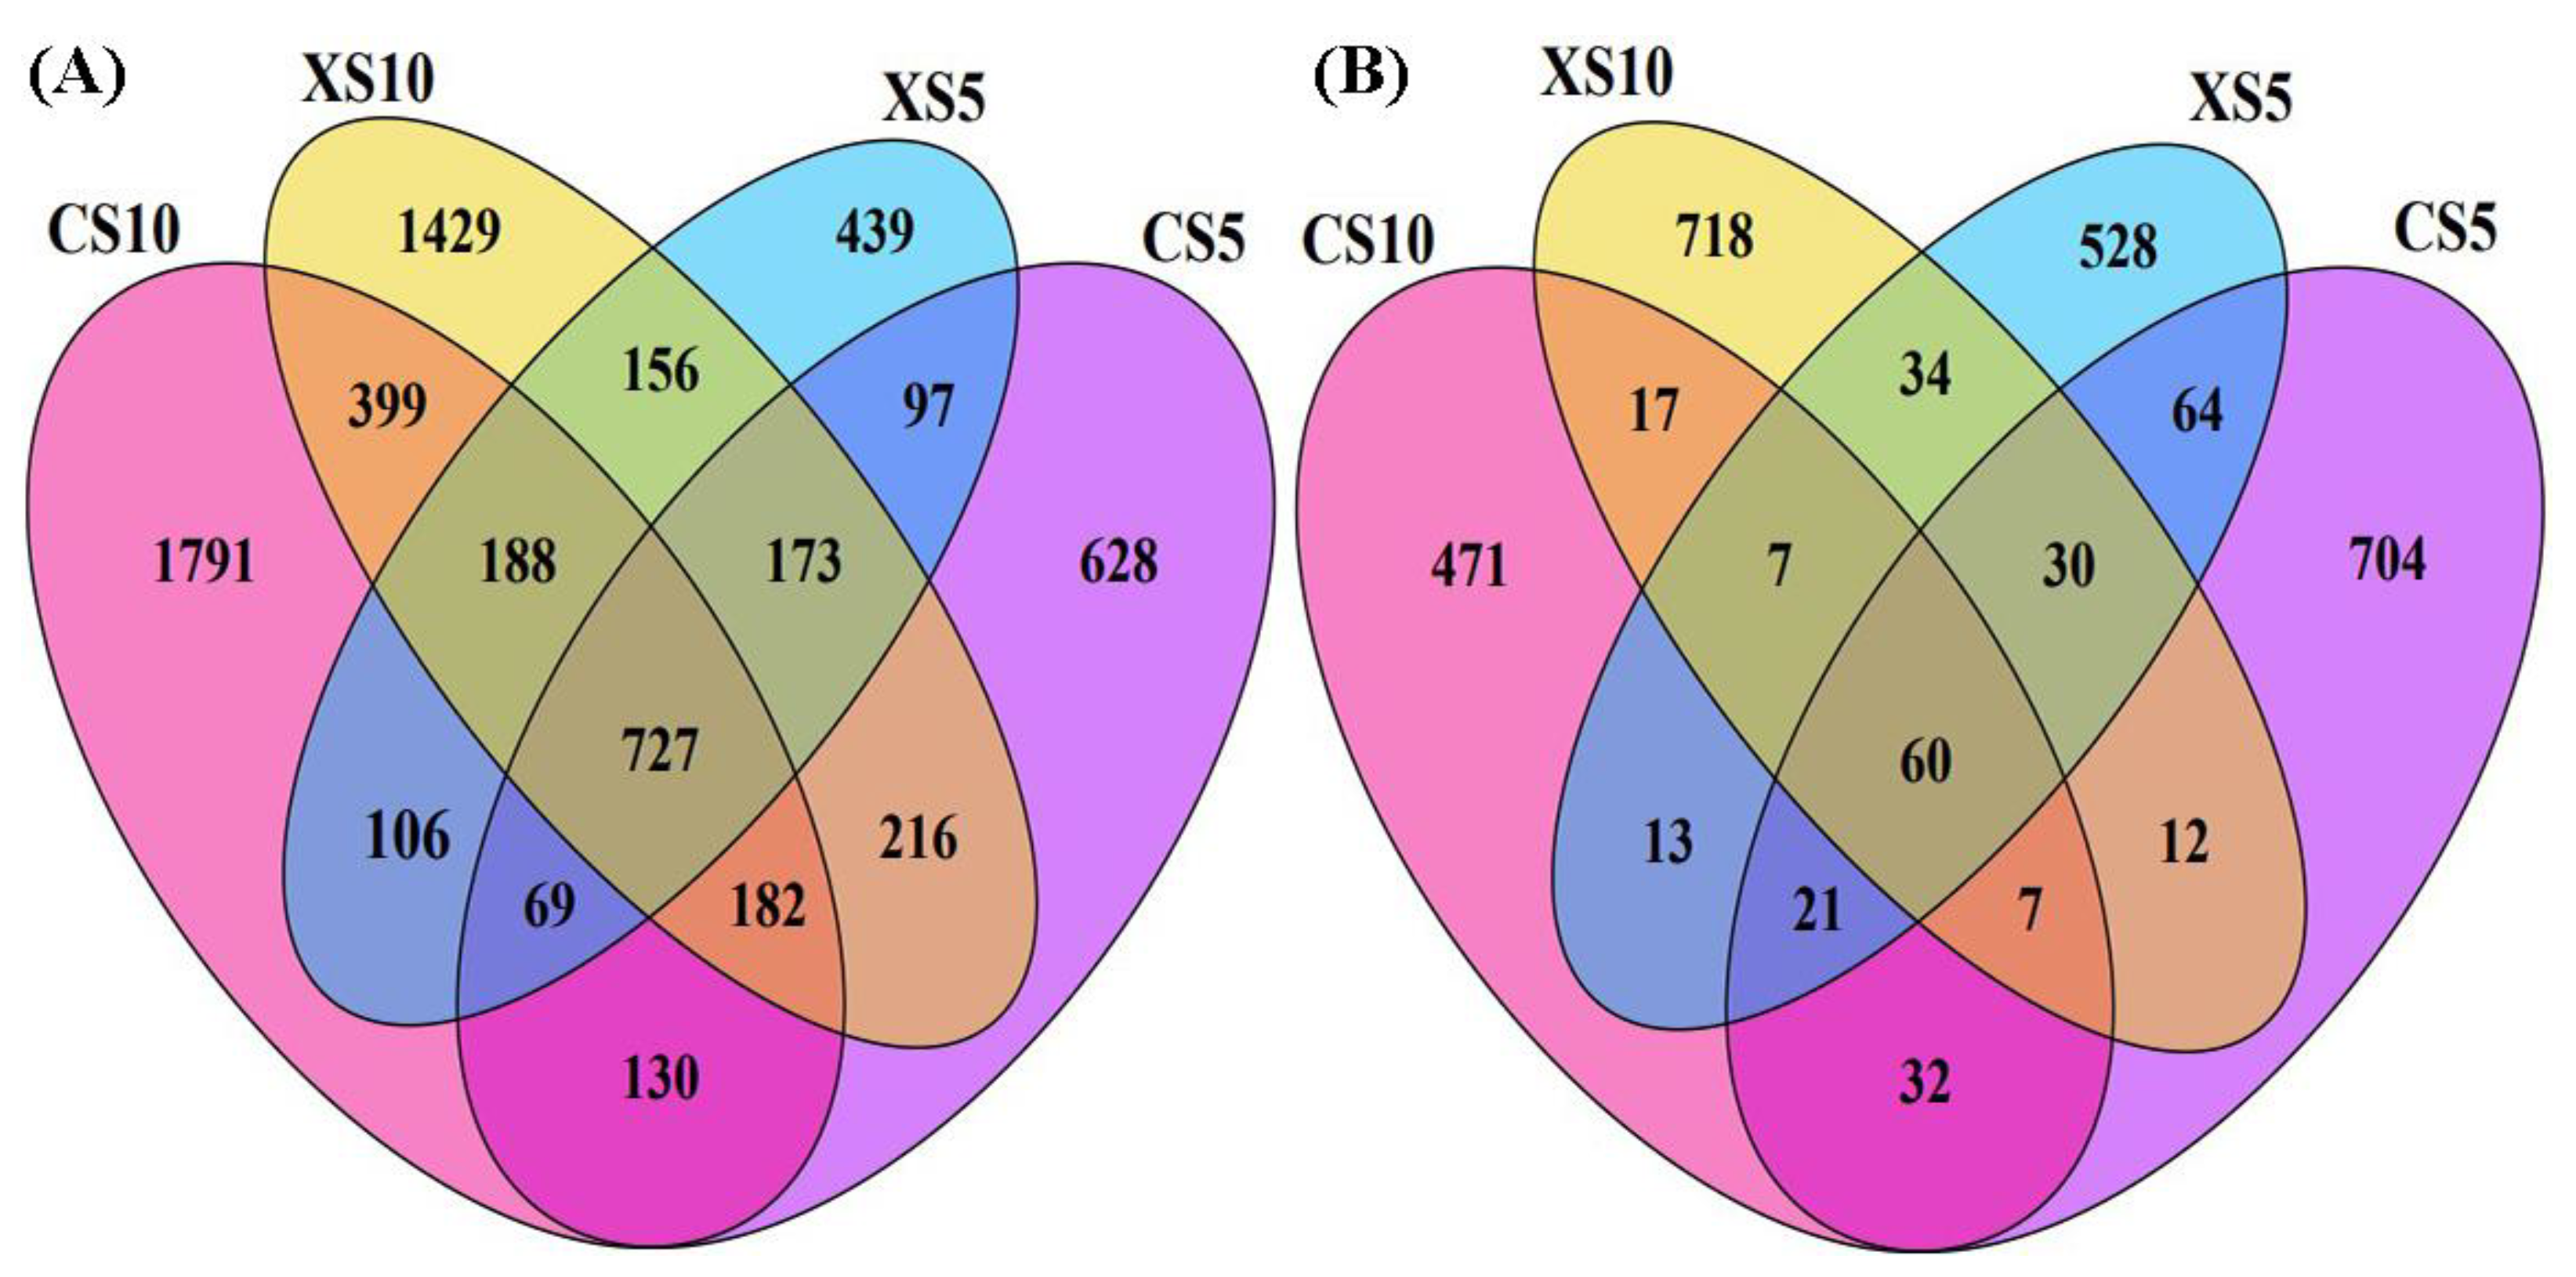
3.3. Microbial Diversity in Rhizosphere Soil of I. polycarpa in Different Stages

The sparse OTU richness curve of bacterial and fungal communities in different soil samples showed that OTU richness tended to be stable with the increase in sample size (Figure 4). In addition, the coverage of all soil samples (Goods coverage) was above 99% (Table 1 and Table 2), indicating that the sequencing depth meets the requirements and can reflect the actual situation of the sample.
The results of the Venn diagram showed that a total of 2222 bacterial OTUs and 930 fungal OTUs were detected in the rhizosphere soil of the female plants at the flowering stage, which was greater than the male plants of 1955 and 757 (Figure 5A,B). During the fruit ripening period, 3592 bacterial OTUs were detected in the rhizosphere soil of female plants, which was greater than 3470 in male plants. Additionally, there were 628 fungal OTUs in female plants, which was less than of 879 in male plants. The total OTUs of male and female plants were 1496 and 91, respectively. Overall, the total number of OTUs and differential OTUs in the rhizosphere soil bacterial community of male and female plants was higher than those in the fungal community.
Analysis of bacterial diversity in the rhizosphere soil of male and female plants showed that Shannon and Simpson’s rhizosphere soil bacteria of male and female plants were similar (Table 1). Further, the ACE and Chao1 of male plants were lower than those of female plants at the flowering stage and higher than those of female plants at the fruit ripening stage, which did not reach a significant level. The results of the diversity analysis of rhizosphere fungi showed that Shannon and Simpson fungi in the rhizosphere soil of male plants were similar to those of female plants, but ACE and Chao1 were higher than those of female plants and reached a significant level at the fruit ripening stage (p < 0.05) (Table 2). The results showed that the diversity of fungi in the rhizosphere soil of male and female plants was similar, and the richness was different.

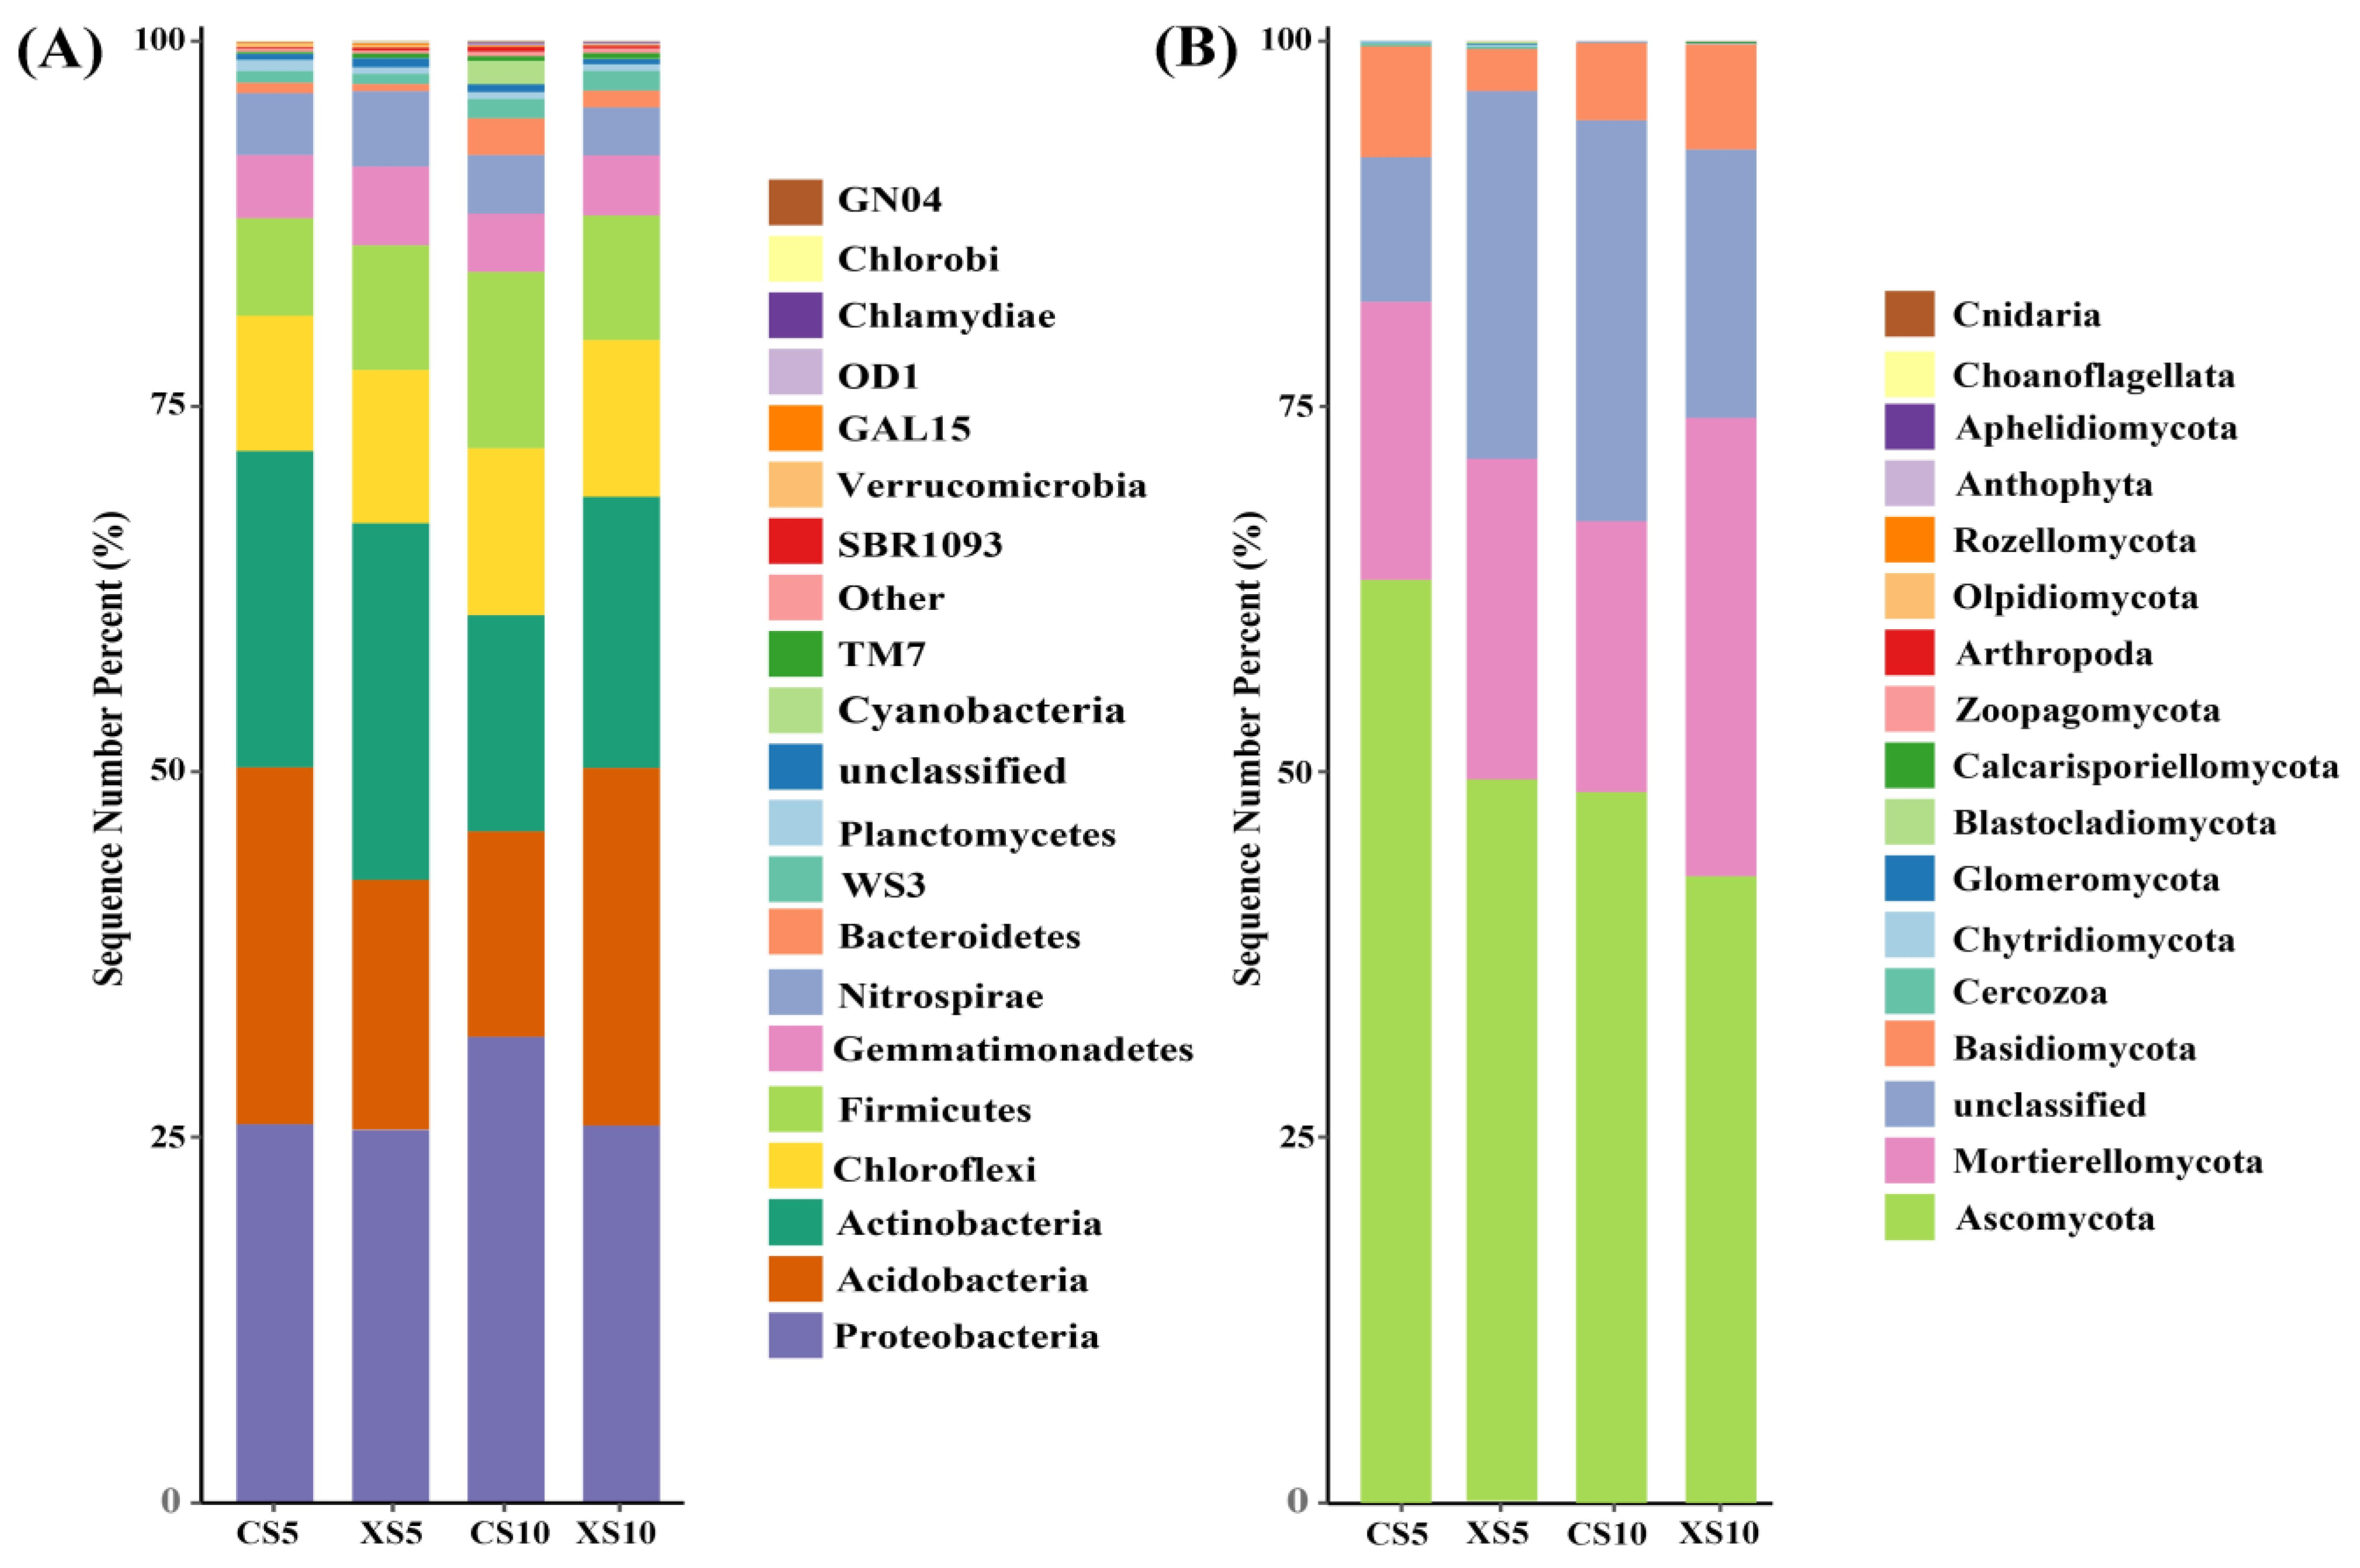
3.4. Microbial Community Composition in Rhizosphere Soil of Male and Female Plants

Based on the analysis of the composition of bacterial and fungal communities in the rhizosphere of male and female plants, it was found that the dominant bacterial phyla in the rhizosphere soil of male and female plants were Proteobacteria, Acidobacteria, and Actinobacteria, and the relative abundance was 25.49%–31.86%, 14.06%–24.47%, and 14.80%–24.43%, respectively (Figure 6A). The average relative abundance of Acidobacteria in the rhizosphere soil of female plants was 7.33% higher than that of male plants at the flowering stage and 10.41% lower than that of male plants at the fruit ripening stage. The average relative abundance of Proteobacteria in the rhizosphere soil of male plants was similar to that of female plants at the flowering stage but lower than that of female plants by 6.07% at the fruit ripening stage. Ascomycota and Mortierellomycota were the dominant fungi in the rhizosphere soil of male and female plants (Figure 6B), and their relative abundance was 42.85%–63.12% and 18.54%–31.37%. The average relative abundance of Ascomycota in the rhizosphere soil of female plants was 13.79% and 5.76% higher than that of male plants at the flowering and fruit maturity stages. In comparison, the average relative abundance of Mortierellomycota in the rhizosphere soil of male plants was 3.05% and 12.84% higher than that of female plants at the flowering and fruit maturity stages.
Further analysis of the composition of bacterial and fungal communities in the rhizosphere soil of male and female plants at the genus level showed that the relative abundance of unknown bacterial genera in the rhizosphere soil of male and female plants was higher, ranging from 71.33% to 79.87%. Our present study analyzed the top ten known genera. The results showed that the average relative abundance of Bacillus and Paenibacillus in the rhizosphere soil of male plants was 1.15% and 0.24% higher than that of female plants, respectively (Figure 7A), while Arthrobacter was 0.38% lower than that of female plants. The average relative abundance of Bacillus and Nitrospira in the rhizosphere soil of female plants was 2.83% and 0.26% higher than in male plants, while Arthrobacter was 0.64% lower than in male plants. The relative abundance of unknown fungal genera in the rhizosphere soil of male and female plants ranged from 28.70% to 44.57%. The analysis of the top ten known genera showed that the average relative abundance of Chaetomium, Solicoccozyma, and Neocosmospora in the rhizosphere soil of female plants at the flowering stage was higher than that of male plants by 7.32%, 2.58%, and 1.60%, respectively, (Figure 7B), while Mortierella, Volutella, and Cephalotrichum were lower than male plants by 3.05%, 6.15%, and 2.31%, respectively. It reached a significant level on Volutella (p < 0.05). However, it was 2.60% and 3.15% lower than the female plants on Stachybotrys and Arthrobotrys, respectively.

3.5. Principal Component Analysis of Metabolites in Rhizosphere Soil of Male and Female Plants

Principal Component Analysis (PCA) of the total GC–MS metabolite data of the rhizosphere soil of male and female plants in the two stages showed that the first principal component accounted for 30.15%, the second principal component accounted for 23.80%, and it cumulatively accounted for 53.95% of the variables (Figure 8A). The male and female flowering plant samples were significantly separated on the first principal component, and the male and female plants were distributed on both sides of the Y axis, preliminarily proving that the metabolites of the two were significantly different. However, the separation effect of male and female plant samples at the fruit ripening stage was poor, indicating that the difference in metabolites between the two was small.
Orthogonal partial least squares discriminant analysis (OPLS-DA) was used to analyze the differences in metabolites in rhizosphere soil between male and female plants at different stages. Results showed that male and female plant samples were significantly separated along the T (1) P axis in both periods, and samples between groups were more dispersed than PCA, indicating significant differences in metabolite levels between groups (Figure 8B,C). The RX2 and Q2 of the two models are greater than 0.5, and RX2 > Q2. The difference between the two is very small and close to 1, which preliminarily shows that the model is more effective and feasible.

3.6. Screening of Differential Metabolites in Rhizosphere Soil of I. polycarpa

Based on the p-value (P1) of the abundance of metabolites in the rhizosphere soil of male and female plants at different post-test periods, a total of 29 metabolites with significant differences were screened during the two periods. During the flowering stage, there were 19 significantly different metabolites produced, including Carbohydrates (12), Alcohol (2), Lipids (2), Acid (1), Aldehyde (1), and Heterocyclic (1) compounds. In addition, in the fruit ripening stage, there were ten significantly different metabolites produced, including Carbohydrates (5), Amines (2), Heterocyclic compounds (2), and others (1). Arabinofuranose, Glucose 1, and D-Allose 2 were significantly different metabolites in those stages. Arabinofuranose showed female plant height abundance in both stages, and Glucose 1 showed male plant height abundance in both stages. Further, the D-Allose 2 showed female plant height abundance in flowering and male plant height abundance in fruit ripening, indicating that these three metabolites play an important role in the growth process of male and female plants. The top five significant differentiated metabolites were ranked from high to low in the VIP value of the OPLS-DA model, as shown in Table 3. The top five differentiated metabolites in flowering showed significant abundance in the rhizosphere soil of female plants. More differentiated metabolites during fruit ripening showed significantly higher abundance in the rhizosphere soil of male plants.

3.7. KEGG Enrichment Analysis

Different metabolites screened in both periods were mapped to the KEGG pathway for annotation and pathway enrichment analysis (Figure 9). Different metabolites during flowering were enriched into eleven metabolic pathways, five of which were significantly enriched. They are ABC transporters, galactose metabolism, starch and sucrose metabolism, secondary metabolite biosynthesis, and fructose and mannose metabolism. A total of nine metabolic pathways were enriched in differential metabolism during fruit ripening, four of which were significantly enriched, namely inositol phosphate metabolism, streptomycin biosynthesis, ascorbate and alternate metabolism, and phosphatidylinositol signaling system.

3.8. Effects of Rhizosphere Environment on Root Traits

To explore the effect of the rhizosphere environment of I. polycarpa on its fine root traits, redundancy analysis (RDA) was performed on rhizosphere nutrients and the top ten bacteria, fungi, and metabolites with significantly different fine root traits. The RDA analysis of nutrients and root traits showed that the first and second ordination axes explained 81.97% and 16.21% of the changes in fine root traits, and the total interpretation rate was 98.18% (Figure 10A). In addition, the AK and pH had a greater impact on the fine root traits of I. polycarpa. The RDA analysis of bacteria and root traits showed that the first and second ordination axes explained 82.39% and 15.59% of changes in fine root traits, and the total interpretation rate was 97.98% (Figure 10B). The Pedomicrobium and Arthrobacter had a greater impact on the fine root traits of I. polycarpa species. The results of the RDA analysis of fungi and root traits showed that the first and second ordination axes explained 76.42% and 20.97% of the changes in fine root traits, with a total interpretation rate of 97.39% (Figure 10C). Chaetomium and Mortierella had a greater impact on the fine root traits of I. polycarpa. The results of the RDA analysis of different metabolites and root traits showed that the first and second ordination axes explained 78.69% and 19.13% of the changes in fine root traits, and the total interpretation rate was 97.82% (Figure 10D). Therefore, this study indicated that Glucose 1 and sucrose greatly influenced the fine root traits of I. polycarpa.
The Spearman correlation heat map evaluated the correlation between rhizosphere environmental factors and fine root traits. The results of the correlation analysis between rhizosphere nutrients and fine root traits showed that AK was significantly negatively correlated with the total volume and total surface area of fine roots (p < 0.01), and correlation coefficients were −0.85 and −0.85, respectively (Figure 11A). The soil pH was significantly positively correlated with tip count (r = 0.85) and total fine root length (r = 0.79) (p < 0.05). In general, soil AK, TC, and TN were negatively correlated with fine root traits. The pH, AN, and AP were positively correlated with fine root traits. The results of the correlation analysis between rhizosphere bacteria and fine root traits indicated that the total length, number of tips, total surface area, and total fine root volume were significantly positively correlated with Lysobacter (0.74, 0.74, 0.75, and 0.74, respectively) and significantly negatively correlated with Pedomicrobium (−0.83, −0.80, −0.79, −0.68, respectively) (Figure 11B). Overall, there were more positive correlations between rhizosphere bacteria and fine root traits. The results of the correlation analysis between rhizosphere fungi and fine root traits showed that the Chaetomium significantly negatively correlated with total length, number of tips, total surface area, and total fine root volume (p < 0.01/0.001), and the correlation coefficients were −0.80, −0.78, −0.85, and −0.79, respectively (Figure 11C). The Geopora showed a significant negative correlation with total length (r = −0.70) and a significant negative correlation with the number of tips (r = −0.77). Overall, there were many positive correlations between rhizosphere fungi and fine root traits. The results of the correlation analysis between rhizosphere metabolites and fine root traits showed that the 4-(2-Methylbutanoyl)sucrose was significantly negatively correlated with the number of tips (−0.85), total length (−0.88), total volume (0.90), and total surface area (−0.94) of fine roots (p < 0.001) (Figure 11D). 2-Phenyl-1,3-oxazol-2-ine, D-(-)-Ribofuranose 2, and sucrose were correlated with some fine root traits.

4. Discussion

The plasticity expression of plant traits plays an important role in plant adaptation to the environment [36]. As the plant’s most active and sensitive component, the fine roots can absorb nutrients by expanding soil space through proliferation and growth [37,38]. They can also adapt more efficiently to the soil environment by changing their functional characteristics, such as fine root morphology and configuration characteristics, to optimize resource acquisition efficiency [39]. Female plants require more reproductive growth than male plants, so they differ in resource demand and distribution [40,41]. In this study, the total root length, total root surface area, total root volume, root tip number, and average root diameter of the fine roots of female plants were greater than those of male plants, indicating that female plants had stronger underground competitiveness than male plants. Studies have shown that the extension length and diameter of new branches of female plants are higher than those of male plants [42,43], indicating that female plants have more developed roots and absorb more nutrients, which is similar to the results of this paper. The growth of plants is greatly affected by the season, and spring yields the maximum growth. In this study, the fine roots of male and female plants were not significantly different in the flowering stage (May). With time, the fine root biomass of female plants increased rapidly, and the female plants’ growth rate was greater than that of male plants. The difference reached its maximum at the fruit accumulation stage (July), similar to the results of Zhao et al. [44]. Appropriate climatic conditions and their increased soil nutrient demand promoted the rapid growth of fine roots of I. polycarpa.
Soil microorganisms play an important role in the rhizosphere microecological environment of plants. They are the driving force for transforming available soil nutrients and the source and reservoir of available soil nutrients. The rhizosphere microbial community structure of plants has strong habitat specificity [45]. Specific plants have unique rhizosphere microbial communities [46]. In this study, it was found that the diversity of bacteria and fungi in the rhizosphere of male and female plants was similar, and the dominant bacteria in the rhizosphere soil of male and female plants were Proteobacteria, Acidobacteria, Actinobacteria, Ascomycota, and Mortierellomycotabe. It shows that the composition of bacterial and fungal communities in the rhizosphere of male and female plants is relatively fixed. Guo et al. [47] showed gender-specific bacterial and fungal communities in the rhizosphere soil of male and female P. euphratica in natural forests, but no specific colonies were found in the rhizosphere in our present study. It may be that the ecological conditions are relatively simple under plantation land conditions. However, in this paper, the relative abundance of bacteria such as Bacillus, Paenibacillus, and Arthrobacter and fungi such as Chaetomium, Mortierella, and Volutella in the rhizosphere soil of males and females differed during the flowering and fruit ripening stages. The female plants need to invest more in reproductive costs than males, and root transfer will show more complex root nutrient exchange. The roots promote the proliferation and extinction of specific microorganisms and improve the rhizosphere environment by shaping the physical and chemical environment of the special rhizosphere soil [48].
Rhizosphere soil metabolites are a comprehensive reflection of root–soil–microbial activities [49]. As a signal substance and microbial nutrient source, they regulate the structure and diversity of rhizosphere microorganisms and plant growth and development through microbial activities. It is an important part of the rhizosphere microecosystem [50]. Our study found that the significant differential metabolites in the rhizosphere soil of male and female plants during the flowering stage were greater than those at the fruit ripening stage. Both male and female flowering plants also achieved vegetative and reproductive growth, increased nutrient demand, and had a strong exchange of roots and soil matter. Further analysis showed that significantly different metabolites between male and female plants were more carbohydrates. Li et al. [51] found that amino acids, sugars, sugar alcohols, and other substances in the soil can provide certain nutrient support for the growth of American ginseng from late autumn to early spring, and sugars are also the main carbon source of microorganisms [52]. The rhizosphere of female plants accumulates more carbohydrates, which can increase the richness of rhizosphere microorganisms and provide a nutrient guarantee for their growth and development. Arabinofuranose, Glucose 1, and D-Allose 2 showed significant differences in the flowering and fruit ripening stages of I. polycarpa, and their contents, which may be closely related to the root activity of I. polycarpa. The KEGG metabolic pathway differential enrichment analysis found that more carbohydrate synthesis and metabolic pathways were enriched in the rhizosphere soil of male and female plants at the flowering stage, consistent with the expression of significantly different metabolites in this period. More stress-resistant material synthesis and metabolic pathways and phosphorus metabolic pathways were enriched during fruit material accumulation. During the fruit material accumulation period, I. polycarpa mainly carried out reproductive growth, and more nutrients were distributed to the fruit [53]. The trees’ resistance decreased, and the synthesis and metabolism of stress-resistant substances in the rhizosphere soil were more conducive to improving plant resistance and vitality.
Plant roots are affected by rhizosphere environmental factors while creating a unique environment. Rhizosphere nutrients are substances that can be used directly by roots and are closely related to root growth. In this paper, RDA analysis showed that AK, Pedomicrobium, Chaetomium, and Glucose 1 in rhizosphere soil had the greatest influence on fine root traits. Potassium can control IAA oxidase activity, increase IAA content, promote carbohydrate transport to roots, and promote root growth [54]. However, correlation analysis showed that the AK content in the rhizosphere soil of I. polycarpa negatively correlated with fine root traits. Chen [55] confirmed that applying potassium fertilizer based on nitrogen and phosphorus can significantly affect root morphology and growth. Our study indicated that a reasonable nitrogen, phosphorus, and potassium ratio can promote root development. This may be one reason for the negative correlation between fine root traits of I. polycarpa and AK content in the rhizosphere. In a later study, the nutrient distribution ratio can be tested to find the optimal soil nutrient match for the growth of I. polycarpa fine roots. Pedomicrobium and Chaetomium are important in removing metal ion pollution from the environment, degrading organic matter in the soil, inhibiting pathogens’ growth, and indirectly affecting roots by regulating environmental conditions [56]. However, both had a significant negative correlation with fine root traits, indicating that both microorganisms strongly inhibited fine root growth. Among other rhizosphere microorganisms, most are positively correlated with the fine root traits of I. polycarpa, which is similar to the results of previous studies on this plant [57]. The interaction between plants and rhizosphere microorganisms is mutually beneficial, and more secondary metabolites will accumulate in rhizosphere soil when the two interact. As the main carbon source of microorganisms, Glucose 1 can be widely used by many microbial groups [58], which is conducive to the growth of rhizosphere microorganisms. Rich microbial diversity can promote the growth and development of plant roots [59]. In this study, metabolites in the rhizosphere of I. polycarpa were found to have more negative effects on the fine roots of I. polycarpa. Organic matter in plant rhizosphere soil has been found to have toxic effects on plants [60]. For example, Marmesin, Cytisine, and Indole-3-acetic acid are in the rhizosphere of continuous cropping. American ginseng had varying degrees of inhibition on the growth of American ginseng roots [61]. Allelochemicals may also be present in the rhizosphere metabolites of I. polycarpa, requiring further investigation.

5. Conclusions

The results indicate that the female plant has a more developed fine root structure than the male plant, which helps the female plant to absorb more nutrients. During the growth of I. polycarpa, there were differences in the utilization of TC, TN, AN, and AK between male and female plants. The composition of bacteria and fungi in the rhizosphere was similar, but there were significant differences in the richness of individual fungi. The carbohydrates were the main metabolites, with significant differences between male and female plants. Further analysis showed that AK, Pedomicrobium, Chaetomium, and Glucose 1 in the rhizosphere environment of male and female plants were the main factors affecting the fine root traits of I. polycarpa. The results provide a theoretical basis for the adaptive mechanism of dioecious plants in spatial and temporal changes, provide a scientific reference for the field management of I. polycarpa, and lay a foundation for the screening and application of rhizosphere growth-promoting bacteria resources of I. polycarpa.

Author Contributions

Conceptualization, Z.L. (Zhi Li); methodology, J.F., S.R., S.W. and Z.L. (Zhi Li); software, J.F., S.R. and Y.Y.; validation, J.F., S.R., Z.L. (Zhen Liu) and Z.L. (Zhi Li); formal analysis, J.F., S.R., T.Z., S.W., Y.Y., Q.Y., C.M., H.W. and L.D.; investigation, J.F., S.R.; resources, Z.L. (Zhi Li); data curation, J.F. and S.R.; writing—original draft preparation, J.F., S.R., Y.Y. and Z.L. (Zhi Li); writing—review and editing, Z.L. (Zhi Li), S.R., Y.Y. and S.W.; visualization, Z.L. (Zhi Li), Z.L. (Zhen Liu), Y.W., G.G., Q.C., X.G., Y.Y., Q.Y., C.M., S.W., T.Z., H.W. and L.D.; supervision, Z.L. (Zhi Li), Z.L. (Zhen Liu), Y.W., G.G., Q.C. and X.G.; project administration, Z.L. (Zhi Li), Z.L. (Zhen Liu), Y.W., Q.C. and X.G.; funding acquisition, Z.L. (Zhi Li) and Z.L. (Zhen Liu). All authors have read and agreed to the published version of the manuscript.

Funding

This research was funded by the Henan Province Postdoctoral Research Project of China (202002053); the Teaching Reform Research and Practice Project of Henan Agricultural University (2022XJGLX054); the Postgraduate Education Reform and Quality Improvement Project of Henan Province (YJS2023AL048); and the Key Forestry Science and Technology Promotion Project of China Central Government (GTH [2023]02).

Data Availability Statement

The data sets generated during and/or analyzed during the current study are available from the corresponding author upon reasonable request.

Acknowledgments

We appreciate the reviewer’s insightful critique, enhancing the caliber of the article. Our gratitude extends to our lab team, specifically Xiaoyan Xue and Huina Zhou, who assisted with this endeavor.

Conflicts of Interest

All the authors declare that there are no conflicts of interest.

References

  1. Lei, Y.B.; Jiang, Y.L.; Chen, K.; Duan, B.L.; Zhang, S.; Korpelaiinen, H.; Nijinemets, Ü.; Li, C.Y. Reproductive investments driven by sex and altitude in sympatric Populus and Salix trees. Tree Physiol. 2017, 37, 1503–1514. [Google Scholar] [CrossRef] [PubMed]
  2. Wang, Z.Q.; Guo, D.L. Root Ecology. Chin. J. Plant Ecol. 2008, 32, 1213–1216. [Google Scholar] [CrossRef]
  3. Vega-Frutis, R.; Guevara, R. Different arbuscular mycorrhizal interactions in male and female plants of wild Carica papaya L. Plant Soil 2009, 322, 165–176. [Google Scholar] [CrossRef]
  4. Chen, J.; Duan, B.; Wang, M.; Korpelainen, H.; Li, C. Intra- and inter-sexual competition of Populus cathayana under different watering regimes. Funct. Ecol. 2014, 28, 124–136. [Google Scholar] [CrossRef]
  5. Wen, X.M.; Xian, T.; Liu, J.Y. Effects of defoliation on growth and non-structural carbohydrates in female and male Populus cathayana chin. J. Ecol. 2021, 40, 41–48. [Google Scholar] [CrossRef]
  6. Zhang, L.M.; Chen, J.; Shen, W.T.; Duan, X.L.; Ge, Y.L.; Dong, Y.F.; Xu, X. Different morphological and physiological responses of Populus cathayana to drought under male and female combination mode. J. China West Norm. Univ. 2019, 40, 325–331. [Google Scholar] [CrossRef]
  7. Chen, G.T.; Tu, L.H.; Peng, Y.; Hu, H.L.; Hu, T.X.; Xu, Z.F.; Liu, L.; Tang, Y. Effect of nitrogen additions on root morphology and chemistry in a subtropical bamboo forest. Plant Soil 2017, 412, 441–451. [Google Scholar] [CrossRef]
  8. Zhang, J.R.; Yan, X.J.; Jia, L.Q.; Fan, A.L.; Wang, X.; Chen, T.T.; Chen, G.S. Morphology and C and N stoichiometry traits of fine Roots of nine understory shrubs in subtropical natural evergreen broad-leaved forest. Acta Ecol. Sin. 2022, 42, 3716–3726. [Google Scholar] [CrossRef]
  9. Fan, B.; Ma, Z.; Gao, P.; Lu, J.; Ding, N.; Sun, K. Functional traits of male and female leaves of Hippophae tibetana on the eastern edge of the Tibetan Plateau and their altitudinal variability. Plants 2022, 11, 2484. [Google Scholar] [CrossRef] [PubMed]
  10. Zhu, Z.Z. Effects of Competition Modes on Growth and Physiological Characteristics of Populus yunnanensis in Different Light Environments; Sichuan Agricultural University: Sichuan, China, 2018. [Google Scholar] [CrossRef]
  11. Song, H.F.; Cai, Z.Y.; Liao, J.; Tang, D.T.; Zhang, S. Sexually differential gene expressions in Poplar roots in response to nitrogen deficiency. Tree Physiol. 2019, 39, 1614–1629. [Google Scholar] [CrossRef] [PubMed]
  12. Fu, H.; Ren, Y.; Chen, Z.X.; Shi, Y.L.; Chen, C.; Sun, G.Q.; Zhou, Y.Q.; Li, Q. Nutrient differences between male and female Zanthoxylum shinifolium sieb. et zucc. and their effects on soil nutrient. Non Wood For. Res. 2022, 40, 192–199. [Google Scholar] [CrossRef]
  13. Zhang, A.; Wang, X.X.; Zhang, D.; Dong, Z.; Ji, H.; Li, H. Localized nutrient supply promotes Maize growth and nutrient acquisition by shaping root morphology and physiology and mycorrhizal symbiosis. Soil Tillage Res. 2023, 25, 105550. [Google Scholar] [CrossRef]
  14. Yang, F.; Jin, C.; Wang, S.; Wang, Y.J.; Wei, L.; Zheng, L.H.; Gu, H.P.; Lam, S.S.; Naushad, M.; Li, C.; et al. Bamboo-based magnetic activated carbon for efficient removal of sulfadiazine: Application and adsorption mechanism. Chemosphere 2023, 323, 138245. [Google Scholar] [CrossRef]
  15. Yu, L.; Huang, Z.; Li, Z.; Korpelainen, H.; Li, C. Sex-specific strategies of nutrient resorption associated with leaf economics in Populus euphratica. J. Ecol. 2022, 110, 2062–2073. [Google Scholar] [CrossRef]
  16. Zhou, Y.; Zhu, H.; Fu, S.; Yao, Q. Variation in soil microbial community structure associated with different Legume species is greater than that associated with different Grass species. Front. Microbiol. 2017, 8, 1007. [Google Scholar] [CrossRef]
  17. Xiao, M.; Zang, H.D.; Liu, S.L.; Ye, R.Z.; Zhu, Z.K.; Su, Y.R.; Wu, J.S.; Ge, T.D. Nitrogen fertilization alters the distribution and fates of photosynthesized carbon in rice–soil systems: A 13C-CO2 pulse labeling study. Plant Soil 2019, 445, 101–112. [Google Scholar] [CrossRef]
  18. Guo, Q.X.; Yan, L.J.; Korpelainen, H.; Niinemets, Ü.; Li, C.Y. Plant-plant interactions and N fertilization shape soil bacterial and fungal communities. Soil Biol. Biochem. 2019, 128, 127–138. [Google Scholar] [CrossRef]
  19. Gu, Y.J.; Liu, Y.H.; Yu, X.W.; Feng, Y.; Yang, X.Y.; Lam, S.S.; Naushad, M.; Li, C.; Sonne, C. Autochthonous bioaugmentation accelerates phenanthrene degradation in acclimated soil. Environ. Res. 2023, 224, 115543. [Google Scholar] [CrossRef] [PubMed]
  20. Du, S.N.; Pan, H.Y.; Xing, Q.N.; Zhang, A.L.; Wang, Q.H. Effects of nitrogen application on amino acid content in rhizosphere of Beet at different development stages. Chin. Agric. Sci. Bull. 2022, 38, 81–88. [Google Scholar] [CrossRef]
  21. Miller, S.B.; Heuberger, A.L.; Broeckling, C.D.; Jahn, C.E. Non-targeted metabolomics reveals Sorghum rhizosphere-associated exudates are influenced by the belowground interaction of substrate and Sorghum genotype. Int. J. Mol. Sci. 2019, 20, 431. [Google Scholar] [CrossRef] [PubMed]
  22. Xia, Z.; He, Y.; Yu, L.; Li, Z.; Korpelainen, H.; Li, C. Revealing interactions between root phenolic metabolomes and rhizosphere bacterial communities in Populus euphratica plantations. Biol. Fertil. Soils 2021, 57, 421–434. [Google Scholar] [CrossRef]
  23. Xue, X.Y.; Liu, Z.; Wang, Y.M.; Geng, X.D.; Cai, Q.F.; Li, Z. Analysis on the development advantages and countermeasures of I. polycarpa industry in Henan province. Hubei Agric. Sci. 2022, 61, 115–120. [Google Scholar] [CrossRef]
  24. Jiang, H.Y.; Pang, G.Y.; Kang, T.R. Purification technology and antioxidant activity of I. polycarpa oil in vitro. Cereals Oils 2022, 35, 59–64. [Google Scholar]
  25. Xu, J.J.; Chen, J.T.; Xie, T.; Li, F.; Geng, Y.Y.; Zhu, Y.Y.; Xu, J. Analysis and comprehensive evaluation of fruit phenotypic diversity in natural populations of I. polycarpa. Seed 2021, 40, 64–71. [Google Scholar] [CrossRef]
  26. Fang, L.S.; Xu, Z.H.; Liu, Z.; Li, Z.; Geng, X.D.; Cai, Q.F.; Zhai, W.J.; Zhou, H.Q.; Wang, Y.M. Changes of contents, endogenous hormones and photosynthetic characteristics of I. polycarpa fruit at the different developmental stages. Sci. Silvae Sin. 2020, 56, 41–52. [Google Scholar] [CrossRef]
  27. Zhang, X.X.; Liu, Z.; Wang, X.J.; Li, Z.; Cai, Q.F.; Geng, X.D.; Wang, Y.M.; Wu, H.Y. Comparison on the growth performance of 2-Year Old I. polycarpa seedlings from different provenances. J. Northwest For. Univ. 2021, 36, 118–123. [Google Scholar] [CrossRef]
  28. Rana, S. Study on the Influence Mechanism of Water and Fertilizer Coupling on the Growth and Development of Idesia polycarpa Seedlings. Ph.D. Thesis, College of Forestry, Henan Agricultural University, Henan, China, 2024. [Google Scholar]
  29. Wu, H.B.; OuYang, S.X.; Liang, J. Research on soil quality characteristics of green areas in Zhengzhou International Tourism Resort Area. Landsc. Gard. 2021, 38, 18–23. [Google Scholar]
  30. Johnson, M.G.; Tingey, D.T.; Philips, D.L.; Storm, M.J. Advancing fine root research with minirhizotrons. Environ. Exp. Bot. 2001, 45, 263–289. [Google Scholar] [CrossRef]
  31. Chen, X.Y.; Eamus, D.; Hutley, L.B. Seasonal patterns of fine-root productivity and turnover in a tropical savanna of northern Australia. J. Trop. Ecol. 2004, 20, 221–224. [Google Scholar] [CrossRef]
  32. Shibata, H.; Hiura, T.; Tanaka, Y.; Takagi, K.; Koike, T. Carbon cycling and budget in a forested basin of southwestern Hokkaido, northern Japan. Ecol. Res. 2005, 20, 325–331. [Google Scholar] [CrossRef]
  33. Zhao, L.; Shang, S.; Shi, D.L.; Xu, H.; Wang, J. Composition and structural characteristics of rhizosphere microorganisms of Polygonum sibiricum (Laxm.) Tzvelev in the Yellow River Delta. Diversity 2022, 14, 965. [Google Scholar] [CrossRef]
  34. Bao, S.D. Soil Agrochemical Analysis; China Agriculture Press: Beijing, China, 2000; pp. 263–270. ISBN 7-109-06644-4. [Google Scholar]
  35. Bolyen, E.; Rideout, J.R.; Dillon, M.R.; Bokulich, N.A.; Abnet, C.C.; Al-Ghalith, G.A.; Alexander, H.; Alm, E.J.; Arumugam, M.; Asnicar, F.; et al. Reproducible, interactive, scalable and extensible microbiome data science using QIIME 2. Nat. Biotechnol. 2019, 37, 852–857. [Google Scholar] [CrossRef] [PubMed]
  36. Roybal, C.M.; Butterfield, B.J. Species-specific trait-environment relationships among populations of widespread grass species. Oecologia 2019, 189, 1017–1026. [Google Scholar] [CrossRef] [PubMed]
  37. Liu, L.; Guo, Y.F.; Liu, X.Y.; Yao, Y.F.; Qi, W. Stump height after regenerative cutting of sea-buckthorn (Hippophae rhamnoides) affects fine root architecture and rhizosphere soil stoichiometric properties. Rhizosphere 2022, 24, 100602. [Google Scholar] [CrossRef]
  38. McCormack, M.L.; Dickie, I.A.; Eissenstat, D.M.; Fahey, T.J.; Fernandez, C.W.; Guo, D.L.; Helmisaari, H.S.; Hobbie, E.A.; Iversen, C.M.; Jackson, R.B.; et al. Redefining fine roots improves understanding of below-ground contributions to terrestrial biosphere processes. New Phytol. 2015, 207, 505–518. [Google Scholar] [CrossRef] [PubMed]
  39. Shively, T.J.; Cook, R.; Maier, C.A.; Garcia, K.; Albaugh, T.J.; Campoe, O.; Leggett, Z. Readily available resources across sites and genotypes result in greater aboveground growth and reduced fine root production in Pinus taeda. For. Ecol. Manag. 2022, 521, 120431. [Google Scholar] [CrossRef]
  40. Obeso, J.R. The costs of reproduction in plants. New Phytol. 2002, 155, 321–348. [Google Scholar] [CrossRef]
  41. Teitel, Z.; Pickup, M.; Field, D.L.; Barrett, S.C. The dynamics of resource allocation and costs of reproduction in a sexually dimorphic, wind-pollinated dioecious plant. Plant Biol. 2016, 18, 98–103. [Google Scholar] [CrossRef]
  42. Rana, S.; Jemim, R.S.; Li, Z.; Geng, X.D.; Wang, Y.M.; Cai, Q.F.; Liu, Z. Study on the pattern of reproductive allocation and fruit development in young dioecious trees of I. polycarpa. S. Afr. J. Bot. 2022, 146, 472–480. [Google Scholar] [CrossRef]
  43. Hoffmann, A.J.; Alliende, M.C. Interactions in the patterns of vegetative growth and reproduction in woody dioecious plants. Oecologia 1984, 61, 109–114. [Google Scholar] [CrossRef]
  44. Zhao, S.C.; Yan, T.F.; Wang, F.H. Root growth and development law and its correlation with aboveground growth of Xinyang Peach in May. Jiangsu Agric. Sci. 2016, 44, 212–213. [Google Scholar] [CrossRef]
  45. Xu, J.; Zhang, Y.; Zhang, P.F.; Trivedi, P.; Riera, N.; Wang, Y.Y.; Liu, X.; Fan, G.Y.; Tang, J.L.; Coletta-Filho, H.D.; et al. The structure and function of the global Citrus rhizosphere microbiome. Nat. Commun. 2018, 9, 4894. [Google Scholar] [CrossRef] [PubMed]
  46. Samad, A.; Trognitz, F.; Compant, S.; Antonielli, L.; Sessitsch, A. Shared and host-specific microbiome diversity and functioning of grapevine and accompanying weed plants: Microbial communities associated with grapevine and vineyard weeds. Environ. Microbiol. 2017, 19, 1407–1424. [Google Scholar] [CrossRef] [PubMed]
  47. Guo, Q.; Liu, J.; Yu, L.; Korpelainen, H.; Li, C.Y. Different sexual impacts of dioecious Populus euphratica on microbial communities and nitrogen cycle processes in natural forests. For. Ecol. Manag. 2021, 496, 119403. [Google Scholar] [CrossRef]
  48. Wu, G.; Yu, F.; Yuan, M.; Wang, J.B.; Liu, C.; He, W.Z.; Ge, Z.H.; Sun, Y.X.; Liu, Y. Responses of rhizosphere bacterial and fungal communities to the long-term continuous monoculture of Water oat. Microorganisms 2022, 10, 2174. [Google Scholar] [CrossRef] [PubMed]
  49. Wang, L.F.; Qin, L.Y.; Sun, X.Y.; Zhao, S.W.; Yu, L.; Chen, S.B.; Wang, M. Salt stress-induced changes in soil metabolites promote cadmium transport into Triticum aestivum tissues. Environ. Sci. 2023, 127, 577–588. [Google Scholar] [CrossRef] [PubMed]
  50. Dakora, F.D.; Phillips, D.A. Root exudates as mediators of mineral acquisition in low-nutrient environments. Plant Soil 2002, 245, 35–47. [Google Scholar] [CrossRef]
  51. Li, C.W.; Bai, X.F.; Chen, G.Z.; Zhu, P.; Zhang, S.T.; Hou, Y.P.; Zhang, X.X. Differences in soil nutrients and phenolic acid Metabolites contents in American ginseng cultivated soils with different restoration years. Chin. Plant Ecol. 2021, 45, 1263–1274. [Google Scholar] [CrossRef]
  52. Salcedo-Vite, K.; Sigala, J.-C.; Segura, D.; Gosset, G.; Martinez, A. Acinetobacter baylyi ADP1 growth performance and lipid accumulation on different carbon sources. Appl. Microbiol. Biotechnol. 2019, 103, 6217–6229. [Google Scholar] [CrossRef]
  53. Wang, Y.L.; Zhang, S.M.; Yuan, J.C.; Cheng, S.; Liang, Y.; Liu, S.T.; Ren, J.; Cai, H.G.; Liu, J.Z. Accumulation and transport characteristics of nutrient for spring maize in different cultivation modes. Soil Fert. Sci. China 2022, 153–161. [Google Scholar] [CrossRef]
  54. Chen, Y.; Zhang, S.; Du, S.F.; Wang, G.Y.; Zhang, J.C.; Jiang, J. Effects of exogenous (K+) potassium application on plant hormones in the roots of Tamarix ramosissima under NaCl stress. Genes 2022, 13, 1803. [Google Scholar] [CrossRef] [PubMed]
  55. Chen, J.X. Effect of K nutrition on Oryza sativa root growth and nutrient uptake. Acta Pedol. Sin. 1997, 182–188. [Google Scholar] [CrossRef]
  56. Orcutt, B.N.; Sylvan, J.B.; Knab, N.J.; Edwards, K.J. Microbial ecology of the dark ocean above, at, and below the seafloor. Microbiol. Mol. Biol. Rev. 2011, 75, 361–422. [Google Scholar] [CrossRef] [PubMed]
  57. Zhang, R.F.; Vivanco, J.M.; Shen, Q.R. The unseen rhizosphere root-soil-microbe interactions for crop production. Curr. Opin. Microbiol. 2017, 37, 8–14. [Google Scholar] [CrossRef] [PubMed]
  58. Paterson, E.; Gebbing, T.; Abel, C.; Sim, A.; Telfer, G. Rhizodeposition shapes rhizosphere microbial community structure in organic soil. New Phytol. 2007, 173, 600–610. [Google Scholar] [CrossRef]
  59. Mendes, L.W.; Tsai, S.M.; Navarrete, A.A.; De, H.M.; Van, V.J.A.; Kuramae, E.E. Soil-borne microbiome: Linking diversity to function. Microb. Ecol. 2015, 70, 255–265. [Google Scholar] [CrossRef]
  60. Wen, T.; Xie, P.; Penton, C.R.; Hale, L.; Thomashow, L.S.; Yang, S.D.; Ding, Z.X.; Su, Y.Q.; Yuan, J.; Shen, Q.R. Specific metabolites drive the deterministic assembly of diseased rhizosphere microbiome through weakening microbial degradation of autotoxin. Microbiome 2022, 10, 177. [Google Scholar] [CrossRef]
  61. Li, L.; Jiang, J.L.; Dong, Y.X.; Shu, Y. Allelochemical substances screening and their allelopathic effects analysis in rhizosphere soil of continuous cropping Panacis quinquefolii radix. Acta Agric. Boreali-Occident. Sin. 2022, 31, 1046–1057. [Google Scholar] [CrossRef]
Figure 1. Geographical location of the test site. (a) The map of China and the Henan province where the study was conducted. (b) The specific location of the test site (red star).
Forests 15 00234 g001
Figure 2. Characteristics of fine roots in male and female plants at different periods (D1: flowering stage; D2: fruit accumulation stage; and D3: fruit maturity stage). (A) Total length, (B) total surface area, (C) total volume, (D) total average diameter, and (E) root tip number. The lowercase letters are indicating the significance level of the values (p < 0.05).
Forests 15 00234 g002
Figure 3. Nutrient characteristics of the rhizosphere in males and females at different stages (D1: flowering stage; D2: fruit accumulation stage; D3: fruit maturity stage). (A) Soil pH; (B) TN, total nitrogen; (C) TC, total carbon; (D) AN, available nitrogen; (E) AP, available phosphorus; and (F) AK, available potassium. The lowercase letters are indicating the significance level of the values (p < 0.05).
Forests 15 00234 g003
Figure 4. Dilution curves of rhizosphere soil of I. polycarpa at different periods. (A) Bacteria and (B) fungi.
Forests 15 00234 g004
Figure 5. Rhizosphere soil microorganism Venn diagram. (A) Bacteria and (B) fungi.
Forests 15 00234 g005
Figure 6. Relative abundance of rhizosphere soil microorganisms at phylum level in different stages. (A) Bacteria and (B) fungi.
Forests 15 00234 g006
Figure 7. Relative abundance of rhizosphere soil microorganisms at genus level in different periods. (A) Bacteria and (B) fungi. The lowercase letters are indicating the significance level of the values (p < 0.05).
Forests 15 00234 g007
Figure 8. (A) Principal component analysis (PCA) of metabolites in rhizosphere soil of male and female plants in different stages; (B) OPLS-DA metabolites in rhizosphere soil of male and female plants in the flowering stage; (C) OPLS-DA metabolites in rhizosphere soil of male and female plants in the fruit ripening stage.
Forests 15 00234 g008
Figure 9. KEGG pathway map of significant differential metabolites in the rhizosphere soil at different stages. (A) Flowering stage, (B) fruit ripening stage.
Forests 15 00234 g009
Figure 10. Redundancy analysis (RDA) of fine root traits and rhizosphere environmental factors. (A) Nutrients, (B) bacteria, (C) fungi, and (D) metabolites. Abbreviations are TC, total carbon; TN, total nitrogen; AN, available nitrogen; AP, available phosphorus; AK, available potassium.
Forests 15 00234 g010
Figure 11. Correlation analysis between fine root traits and rhizosphere environmental factors. (A) Nutrients, (B) bacteria, (C) fungi, and (D) metabolites. Abbreviations are TAD, total average diameter; NOT, root tip number; TL, total length; TSA, total surface area; TV, total volume; TC, total carbon; TN, total nitrogen; AN, available nitrogen; AP, available phosphorus; AK, available potassium. * p < 0.05; ** p < 0.01; *** p < 0.001.
Forests 15 00234 g011
Table 1. Bacterial α diversity index of different samples. The lowercase letters are indicating the significance level of the values (p < 0.05).
SampleGoods CoverageShannonSimpsonACEChao1
CS51 ± 0 a6.1502 ± 0.3259 a0.9633 ± 0.0066 a368.3333 ± 66.3961 a368.3333 ± 66.3961 a
XS51 ± 0 a5.9245 ± 0.4606 a0.9554 ± 0.0113 a233.3333 ± 44.7002 a233.3333 ± 44.7002 a
CS101 ± 0 a5.9357 ± 0.085 a0.9588 ± 0.0039 a304.6666 ± 32.6615 a304.6666 ± 32.6615 a
XS100.9999 ± 0.0001 a5.6706 ± 0.2073 a0.9439 ± 0.0162 a323.5778 ± 20.4549 a323.3476 ± 20.2630 a
Table 2. Fungal α diversity index of different samples. The lowercase letters are indicating the significance level of the values (p < 0.05).
SampleGoods CoverageShannonSimpsonACEChao1
CS50.9985 ± 0.0001 b9.5746 ± 0.0536 b0.9980 ± 0.0001 a1123.1685 ± 47.0738 c1129.1540 ± 48.0329 c
XS50.9995 ± 0 a9.8344 ± 0.1153 a0.9975 ± 0.0005 a1631.3415 ± 28.9380 b1633.2107 ± 29.9486 b
CS100.9988 ± 0.0003 b9.4560 ± 0.0547 b0.9978 ± 0.0002 a1039.9429 ± 18.5783 c1050.0278 ± 18.1969 c
XS100.9995 ± 0 a10.0815 ± 0.0684 a0.9982 ± 0.0002 a1805.6163 ± 8.4434 a1807.9299 ± 9.0967 a
Table 3. Top five differential metabolites in VIP values.
Comparison GroupTotal Number of Differential
Metabolites
The Top Five
Metabolites of VIP Value
Log2FCp-ValueVIPMetabolite TypesType
XS5 VS CS519Myo-Inositol 33.02 × 1000.0146131.561137Alcoholdown
D-(-)-Ribofuranose 21.57 × 1000.0095171.559431Carbohydratedown
D-Allose 21.92 × 1000.0136741.549882Carbohydratedown
D(+)-Talose2.02 × 1000.0179561.54911Carbohydratedown
Sucrose1.62 × 1000.0001011.547348Carbohydratedown
XS10 VS CS1010Glucose 11.4693263.42 × 10−61.886262Carbohydrateup
4-(2-Methylbutanoyl)sucrose0.7966480.0076351.821765Carbohydrateup
2-Phenyl-1,3-oxazol-2-ine0.5691560.0211721.737153Carbohydrateup
N-ethyl-Acetamide−0.109440.018221.736087Carbohydratedown
D-Arabinitol 20.4833920.008221.73337Carbohydrateup
Disclaimer/Publisher’s Note: The statements, opinions and data contained in all publications are solely those of the individual author(s) and contributor(s) and not of MDPI and/or the editor(s). MDPI and/or the editor(s) disclaim responsibility for any injury to people or property resulting from any ideas, methods, instructions or products referred to in the content.

