Abstract
Wood processing products can be used as a substitute for some high carbon emission materials, thus contributing significantly to climate change mitigation. China has significant importance in guaranteeing a stable global supply of wood products. However, China has experienced a decline in wood product exports recently, which could affect the world’s progress toward sustainable development. This study focuses on the spatial agglomeration of China’s wood-processing industry and explores the potential of integrating spatial agglomeration to address the diminishing export growth. We found that the spatial agglomeration of China’s wood-processing industry generally increased rapidly between 1999 and 2004, but decreased after 2004. The centroid of China’s wood-processing is shifting from the northeastern region toward the eastern coastal areas. The industry is more concentrated in the north–south direction and slightly dispersed in the east–west direction. Most sub-sectors of China’s wood-processing industry operate at the primary agglomeration level, indicating significant potential for improvement and further development. The empirical results unveil the substantial positive influence of spatial agglomeration on exports within China’s wood-processing industry, indicating the prospects for enhancing exports through the deliberate exploitation of agglomeration effects. The results advocate the view that spatial agglomeration acts as an essential accelerator for export growth and firms’ international competitiveness. Therefore, spatial agglomeration can alleviate the export constraints of China’s wood-processing industry. The results also show that exports are hampered by increased enterprise productivity. The ‘productivity paradox’ phenomenon has also surfaced in low-tech industries, like the wood-processing industry, as a result of issues with transaction costs, the development path, and policy orientation. Therefore, we should strategically leverage the spatial agglomeration effect, especially in the western region, and guide the moderate competition of enterprises to enhance the competitiveness of low-tech enterprises. China’s wood-processing industry can provide advanced experience and lessons for other countries regarding industrial cluster allocation and sustainable development models.
1. Introduction
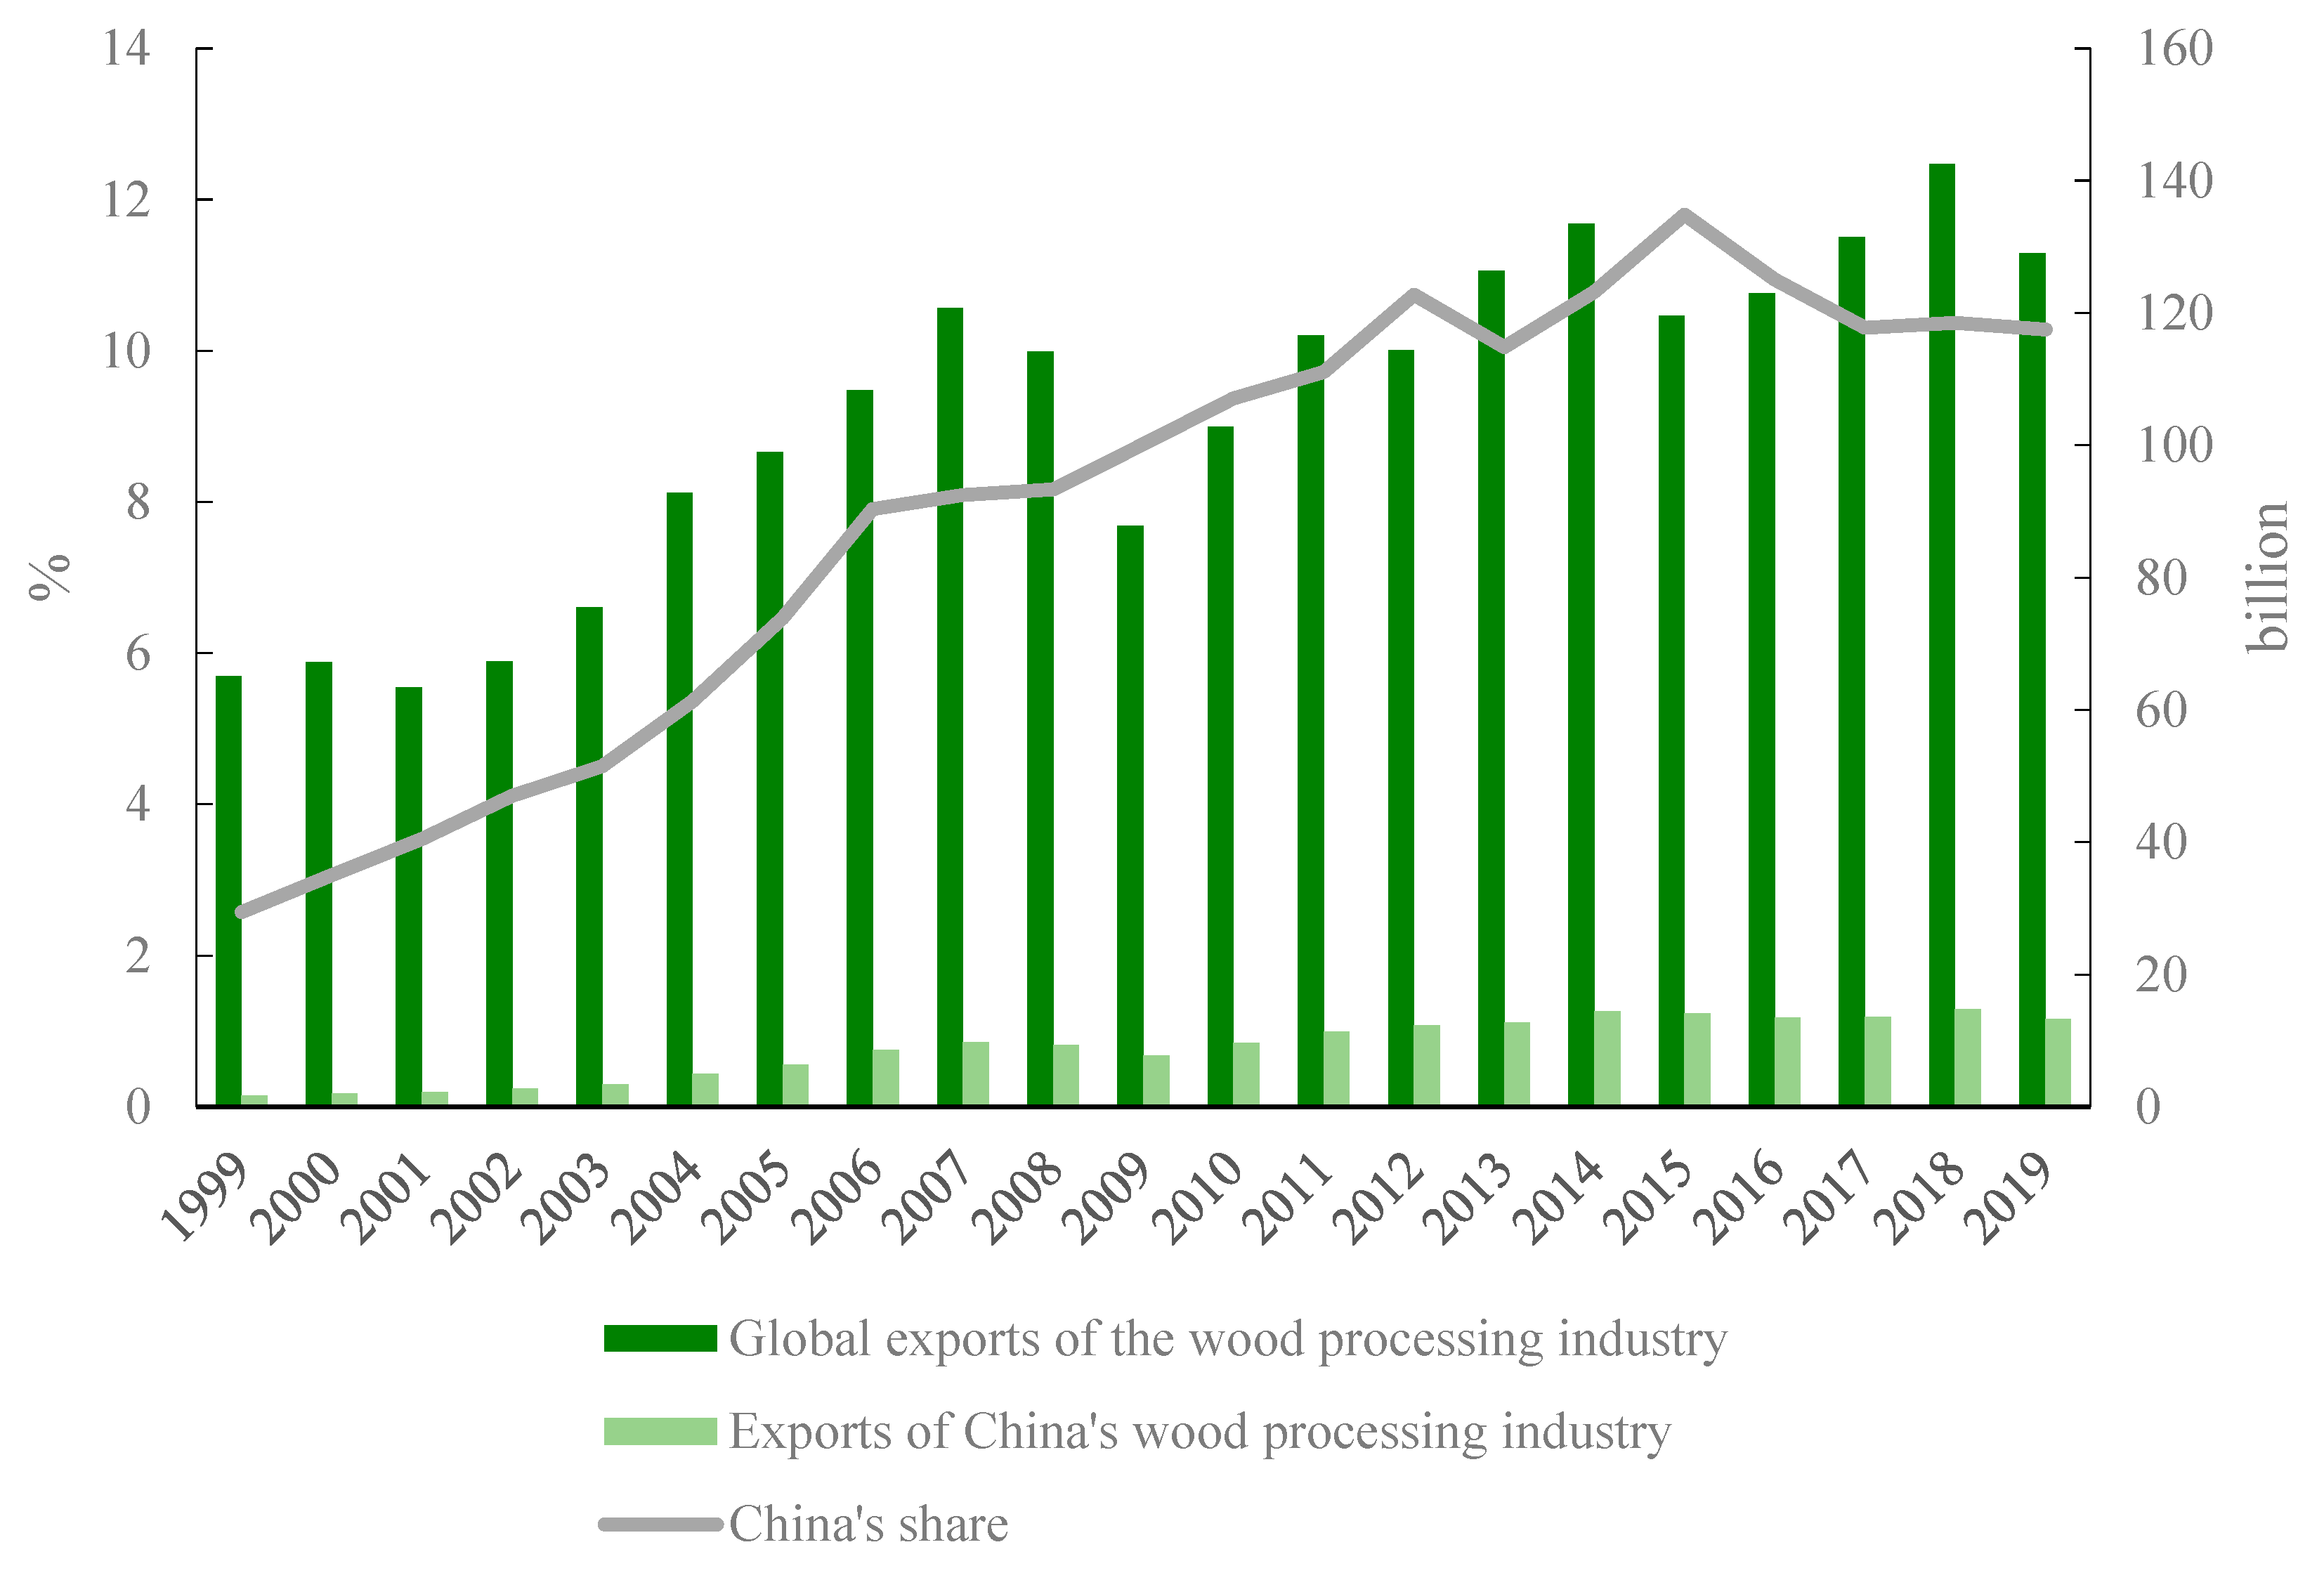
Among the four main raw materials (namely wood, steel, cement, and plastic) used for production, wood is the only biodegradable, renewable, and recyclable material. Wood processing products can substitute some high carbon emission materials, thus contributing significantly to climate change mitigation. Due to the low labor cost and huge domestic market, China has gradually developed a complete industrial chain, consequently taking an essential position in the global wood products market [1]. However, China has experienced a decrease in the provision of wooden products to the global market in recent years. According to the United Nations Commodity Trade Statistics Database (UN Comtrade) and the China Forestry and Grassland Statistical Yearbook, China’s economy developed rapidly after entering the World Trade Organization (WTO), and the share of China’s wood-processing industry exports to the global wood-processing industry exports has been rising. According to Figure 1, only 4.42% of the global market was represented internationally in 2001. China ranked first in the world in terms of its worldwide market share in 2006, which was double that of 2001 at 8.79%. According to a report by the United Nations Food and Agriculture Organization (FAO), the global market for wood processing products was stifled from 2007 to 2008 as a result of the financial crisis, and China’s exports of wood processing products also decreased during this time. However, China’s share of global exports of this sector is still growing. China’s export share increased from 9.93% in 2009 to 11.61% in 2012 because of the industry’s economic recovery following the financial crisis [2], surpassing the export shares of other nations in the world with a total value of 14.122 billion US dollars. China’s foreign market share increased threefold from 2001 to 2015, reaching 13.47%. However, the slowdown in global economic development after 2015 forced products from Southeast Asian nations to compete in the global market at low prices, which had a significant negative effect on China’s exports of wood processing products. With the decline in China’s foreign market share, the growth rate of the industry’s total exports for wood processing in China shifted from positive to negative. Therefore, it is critical to discover strategies to encourage the expansion of China’s wood-processing industry and export growth.

Figure 1.
Export trade of the wood-processing industry. Source: UN Comtrade, China Forestry and Grassland Statistical Yearbook.
Spatial agglomeration is an important economic phenomenon [3,4], which refers to a phenomenon whereby enterprises of the same type tend to congregate in one area to establish ties by sharing policies, information, regional reputation, and marketing channels [4] and gain size effects through interaction. This is done to reduce costs and increase benefits. The spatial agglomeration could bring certain convenience to local enterprises. Therefore, spatial agglomeration may be able to break down the barriers and meet the developmental needs of China’s wood-processing industry. Achieving spatial agglomeration may have a positive impact on the development of enterprises [5], thus promoting export. This paper aims to explore the possibility of boosting the export of China’s wood-processing industry by releasing an agglomeration economy. This paper makes the following contributions. First, we explore the role of spatial agglomeration in promoting export. Since most of the existing literature focuses on the entire manufacturing industry, there is still a lack of targeted analysis of labor-intensive industries, such as the wood-processing industry. In particular, for green materials such as wood, discussing how to improve resource utilization efficiency is very important. Second, previous studies on China’s wood- processing industry have mostly been based on macro-level data, ignoring industrial features and regional heterogeneity. This study conducts a quantitative analysis of spatial agglomeration at the micro-enterprise level, better reflecting the heterogeneous characteristics of wood enterprises. We use standard deviation ellipses to illustrate the agglomeration center of China’s wood-processing industry, which intuitively shows the spatial-temporal evolution of the industry.
2. Literature Review
The spatial agglomeration of the global manufacturing industry exhibits a complex developmental trend. There is continued growth in spatial agglomeration of the industry around the world [6,7]. For instance, the concentration of the German wood-based construction and furniture industries primarily occurs in specific regions, such as Eastern Baden-Württemberg and Lower Bavaria [8]. Meanwhile, influenced by technological progress and global economic changes, the pattern of manufacturing agglomeration is undergoing major alterations [9]. With the rise of anti-globalization, the agglomeration effect brought by spatial agglomeration has attracted more and more attention.
The spatial agglomeration of enterprises in China has come to the attention of scholars with the gradual implementation of policies such as ‘Bringing in’ and ‘Going out’. The research results of scholars are slightly different over time. Some academics think that China’s manufacturing industry has become more spatially agglomerated overall. The remarkable phenomenon of industrial spatial agglomeration in China occurred between 1985 and 1997 [10], increased from 1998 to 2009 [11,12], and will be further enhanced [13]. However, some scholars found that the overall spatial agglomeration of China’s manufacturing industry is not monotonically increasing; rather, it decreased from 1985 to 1997 [14], showed an inverted ‘U’ shape from 1998 to 2008 [15,16], decreased from 2008 to 2013, and declined from 2013 to 2017 [17]. The reasons for the different agglomeration trends may be the difference in data accuracy, the accuracy of measurement methods, and the spatial agglomeration in various industries. Wood is the only renewable raw material that can be recycled out of the four raw materials, e.g., wood, plastic, cement, and steel. Scholars have continuously discovered the agglomeration phenomenon of China’s forestry industry. Cheng found that the timber industry in Zhejiang formed industrial agglomeration with development [18]. Zhou found that the agglomeration of the furniture industry has been formed and can bring industrial advantages [19]. Li found that the agglomeration of the sawn wood and chips industry is mainly affected by market size and local timber forest resources [20]. Zhao analyzed the agglomeration of the forestry industry in China based on the output value [21]. Huang concluded that the spatial agglomeration does exist in China’s forestry industry through local spatial autocorrelation tests [22]. Wei reported that China’s forestry industrial agglomeration has obvious spatial dependence and correlation [23]. Chen found that the spatial agglomeration of China’s forest products industry was relatively low, and the industry was characterized by a very pronounced imbalance in its spatial distribution [24]. However, there are few studies related to the spatial agglomeration and its evolutionary trend in China’s wood-processing industry.
The conclusions about the connection between spatial agglomeration and exports vary. Some scholars believe that spatial agglomeration promotes exports. It is because spatial agglomeration makes it easier for enterprises to obtain information, technology, and channels from other enterprises [25,26], causing knowledge spillover and thus promoting enterprise innovation [27,28,29,30,31,32]. In addition, similar enterprises acquire export experience faster, share information about global markets, and increase marketing externalities [3,4,32,33]., improving export performance through more attractive product prices and more effective cooperation [4,32]. The positive externality of industrial agglomeration does have a significant role in promoting the dual margin of enterprise export, and industrial agglomeration has a positive impact on enterprise export behavior through the flow of innovation factors [10]. Due to the fact that foreign businesses favor doing business in densely populated locations [34,35], areas with high agglomeration levels attract more foreign capital [36], enhancing the productivity and export dual margin [15,37]. In addition, geographical proximity can enable enterprises to save transportation costs [38], reduce production costs, and offer price advantages. Long & Zhang found that spatial agglomeration also promotes export by improving labor productivity [39]. Moreover, the weakening of financing constraints leads to the expansion of the export dual marginal of private enterprises, and the improvement of spatial agglomeration indirectly contributes to the export dual marginal expansion. Enterprises in areas with high agglomeration levels are more likely to become exporters in China [40], with similar research conclusions noted in Italy [32,41].
On the other hand, some scholars believe that spatial agglomeration is not absolutely beneficial to the export of enterprises. The agglomeration of export enterprises makes the labor cost rise, which leads to a decrease in demographic dividends and an increase in export pressure [42]. At the same time, excessive export agglomeration may lead to vicious competition, and export enterprises squeeze each other’s export markets [43], thus hindering export growth. Enterprise cooperation brought by agglomeration is regarded as promoting export performance, while competition has a negative impact on export performance [4,44]. Chile’s export performance is negatively impacted by spatial agglomeration [45]. Moreover, data from the Netherlands demonstrate that after a certain level of spatial agglomeration, the export performance of enterprises is no longer influenced by the spatial agglomeration’s external economic consequences [46,47]. In addition, spatial agglomeration may improve the productivity of enterprises by integrating resources [48], or it may result in fierce competition as the number of enterprises increases, depending on the industries and geographic areas involved [28,49]. In other words, the impact of spatial agglomeration on exports depends on the trade-off between the ‘scale effect’ and ‘crowding effect’, and a significant ‘inverted U-shaped’ relationship exists between them [50]. Similarly, this level has a curve relationship with the export possibility of high-tech emerging enterprises in the United States [34].
A limited number of studies have been conducted on the effect of spatial agglomeration on exports within China’s wood-processing industry. Cheng found that spatial agglomeration promotes the regional brand effect, resource utilization and the sharing effect, industrial division and the cooperation effect, and industrial innovation improvements [51]. Lv performed a case study of four major wood-based panel clusters, which showed that the utility brought by clusters could provide favorable conditions for enterprises to occupy the market [52]. Li revealed that the improvement of the agglomeration promotes exports of the paper industry [53]. The existing literature mostly focuses on the discussion of the manufacturing industry, whereas empirical research on the impact of the spatial agglomeration on exports within China’s wood-processing industry is lacking. Moreover, the current assessment of China’s wood-processing industry’s spatial agglomeration is primarily based on macro-level statistics. We conduct a more precise and realistic quantitative analysis of the spatial agglomeration of China’s wood-processing industry starting at the micro-enterprise perspective and investigate the effects of increasing spatial agglomeration on exports.
3. Spatial Distribution and Theoretical Analysis
3.1. Spatial Distribution of China’s Wood-Processing Industry
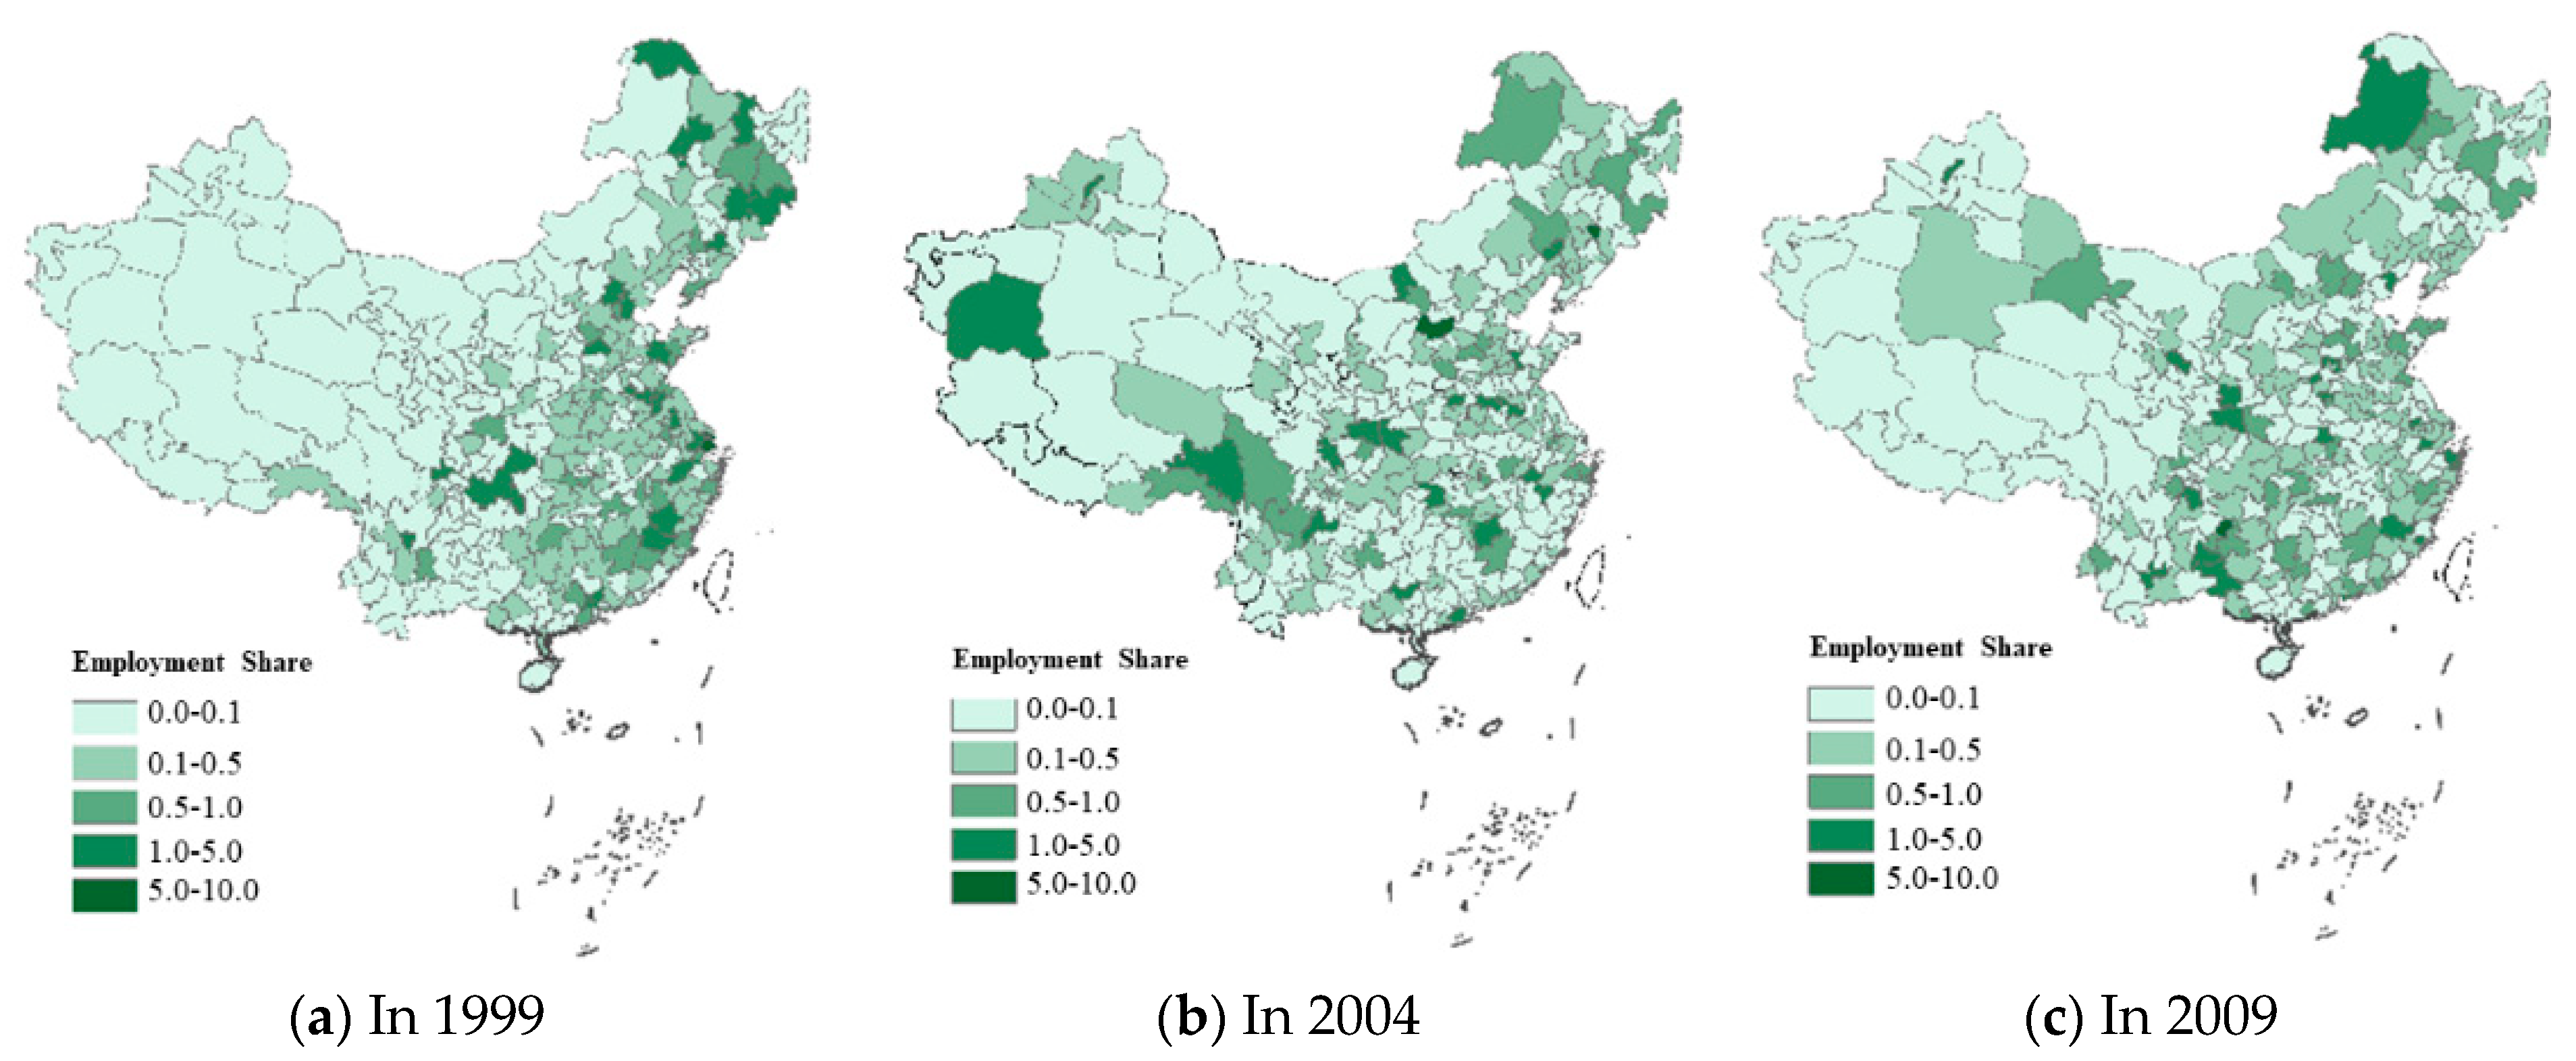
Spatial agglomeration of China’s wood-processing industry has significant potential for improvement and further development. The spatial distribution of China’s wood-processing industry is shown in Figure 2. By comparison, it is found that the three cities with the highest employment shares in 1999 (Shanghai, Qiqihar and Nanping) accounted for 14.70% of the total employment share in China, of which Shanghai was the only city with more than 5%, accounting for 5.82% in China. The top three cities in 2004 (Liaoyuan, Xinzhou, and Baotou) accounted for 18.09% of the total, representing an increase of 3.39% from 1999. Two of them, Liaoyuan and Xinzhou, had employment shares greater than 5%, showing that the size of the wood-processing industry in the cities with the highest employment shares increased between 1999 and 2004. The percentage of the top three cities (Guiyang, Yingkou, and Anyang) in 2009 was lower than it was in 2004. Two of them, Yingkou and Guiyang, each accounting for 13.21% of the total, still had employment shares above 5%, showing that the level of China’s wood-processing industry increased from 1999 to 2004, but declined from 2004 to 2009.

Figure 2.
Spatial distribution of China’s wood-processing industry in 1999, 2004 and 2009. Note: The data in the figure are calculated according to the proportion of employment in the wood-processing industry in each city to the employment in China. The color is divided into five shades. The darker the color, the higher the proportion. Data Source: China Industrial Enterprise Database.
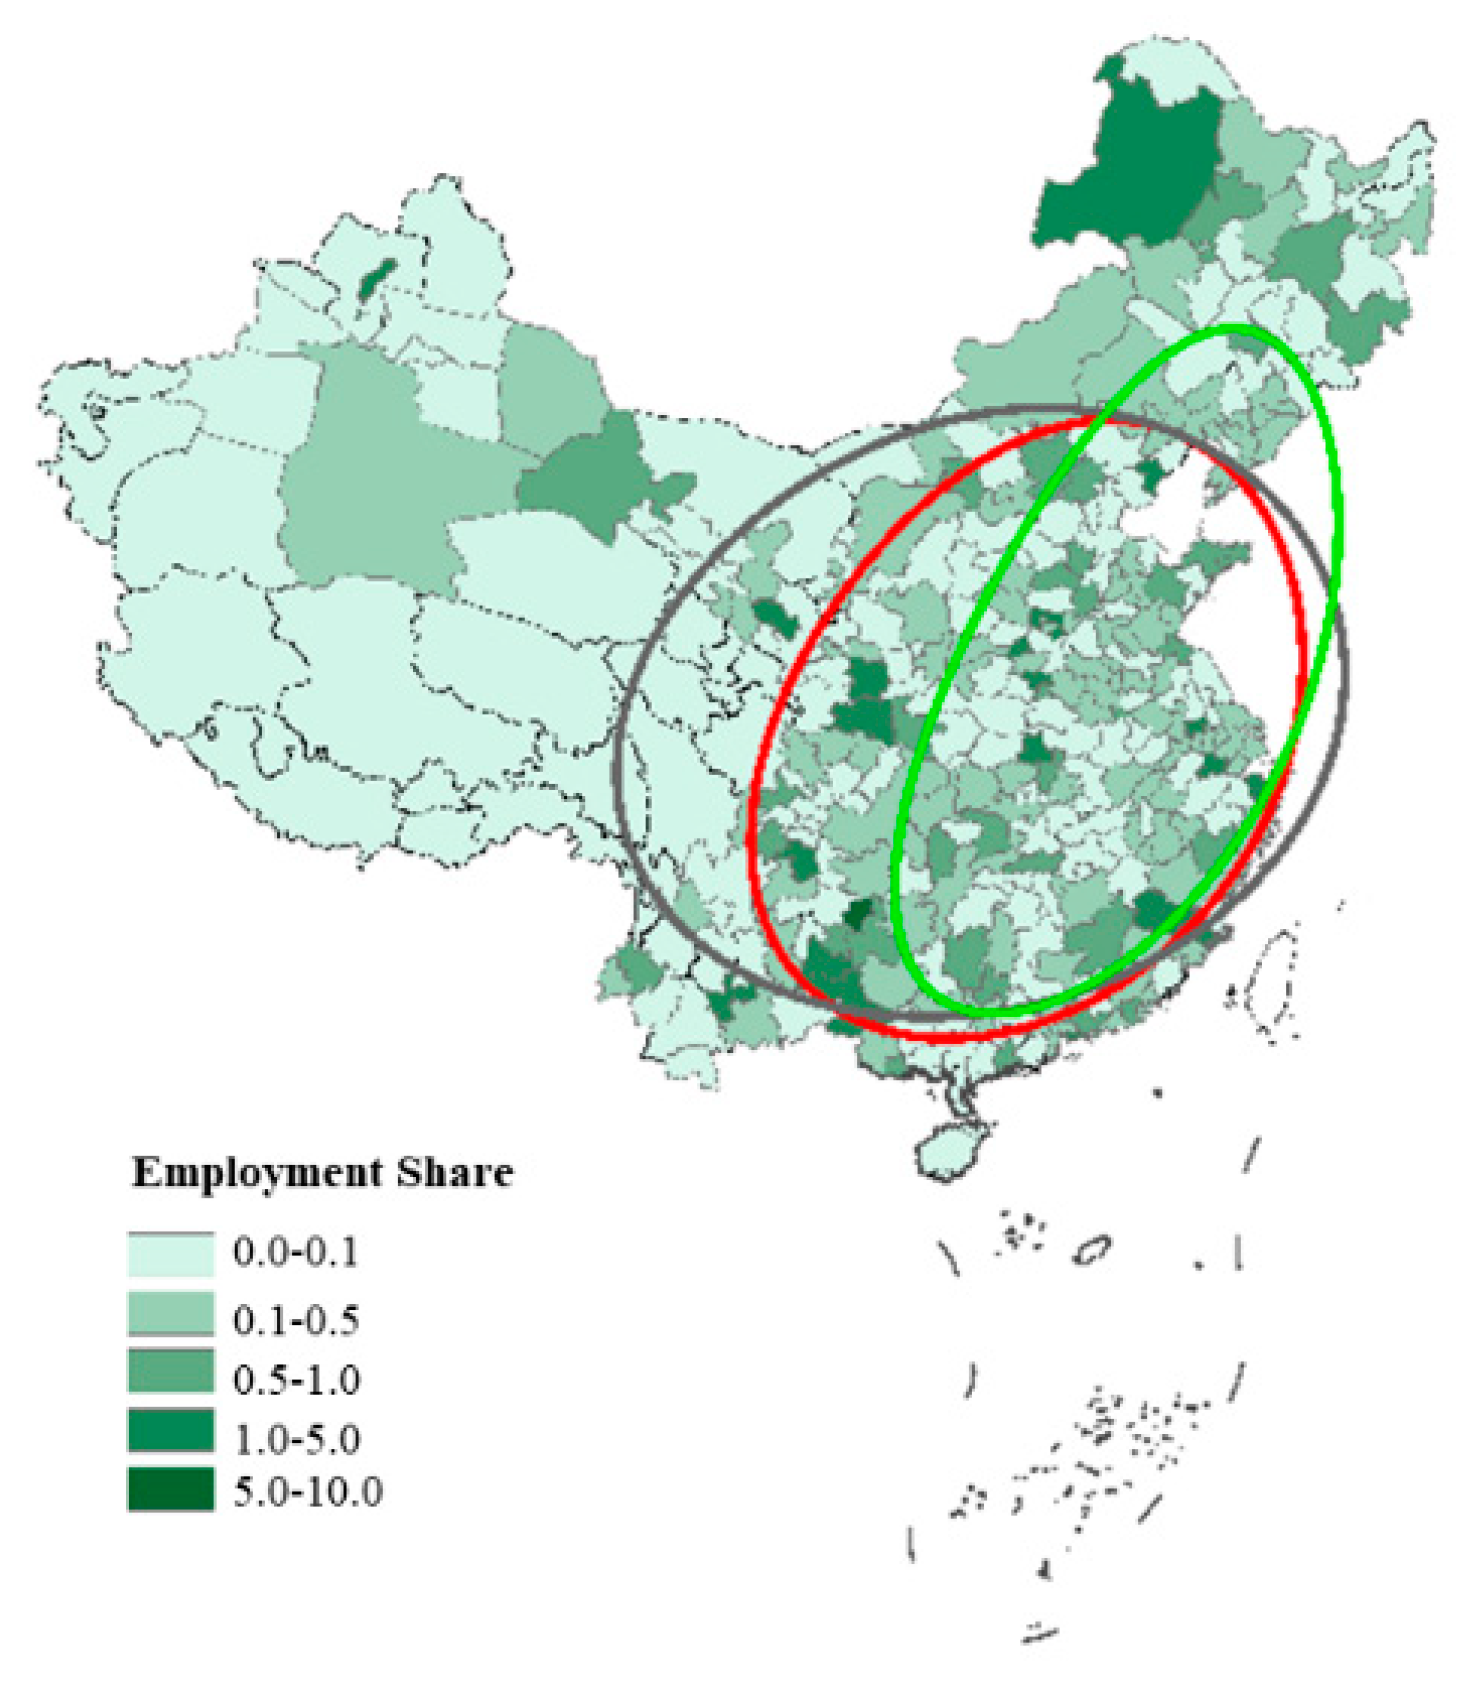
Figure 3 depicts the standard deviation ellipses of China’s urban system and China’s wood-processing industry. We use the standard deviation ellipse of China’s urban system as the control group, which is represented by a black-gray ellipse. The standard deviation ellipse of China’s wood-processing industry in 1999 is presented in green; the standard deviation ellipse for 2009 is red. It can be clearly seen from Figure 3 that compared with China’s urban system, China’s wood-processing industry in 1999 and 2009 has the characteristics of spatial agglomeration. As a control group, the center of gravity for China’s urban system is located at 33.08 N and 111.54 E, namely Xichuan in Henan Province. In 1999, the center of gravity for China’s wood-processing industry was centered at 33.82 N and 117.29 E, which is located in Suzhou in Anhui Province. Clearly, the northeastern cities had a greater agglomeration of China’s wood-processing industry in 1999. In 2009, the center of gravity of the standard deviation ellipse of China’s wood-processing industry was centered at 32.41 N and 113.71 E, which is located in Zhumadian in Henan Province. The results show that the agglomeration center moved from the northeast to the eastern coastal cities compared with 1999. The possible reason is that since half of China’s wood material supply comes from imports, joining the WTO further amplifies the port advantages of the eastern coastal areas. In 1999, the long axis was 12.49, and the short axis was 6.01. In 2009, the long axis was 11.66, and the short axis was 8.29. The long axis in 2009 contracted compared with 1999, while the short axis expanded. As a result, the north–south distribution of China’s wood-processing industry was more concentrated than the east–west distribution, and the spatial agglomeration holds significant potential for improvement.

Figure 3.
Standard deviation ellipses of China’s wood-processing industry in 1999 and 2009. Note: The black-gray ellipse represented the standard deviation ellipse of China’s urban system as the control group; the green ellipse represents the standard deviation ellipse of China’s wood-processing industry in 1999; and the red one represents the standard deviation ellipse for 2009.
3.2. Research Hypothesis
The spatial agglomeration of the wood-processing industry has multiple impacts on exports. First, spatial agglomeration promotes the sharing effect among enterprises, including the specialization effect, diversification effect, public goods effect and risk dispersion effect [25], and expands the export trade of enterprises through information sharing, demonstration, and imitation [54]. Second, spatial agglomeration makes enterprises contend with competition from nearby rival enterprises on the mainland market, forcing them to seek out alternate markets, like exports [39]. Third, spatial agglomeration has a great influence on the innovation and development of enterprises [30], which increases their ability to compete internationally. Fourth, spatial agglomeration increases the comparative advantages of enterprises by bringing them closer together, reducing transportation and transaction costs between upstream and downstream businesses [38]. Therefore, the wood-processing industry has unique industrial characteristics. Wood products are mostly of large volume and a fixed shape, with concomitant high costs of long-distance transport. If the upstream and downstream products of an industrial chain are concentrated at a certain location, the feasibility of reducing production costs is high, thus improving the competitive export advantage. Therefore, we propose the following hypothesis:
H1:
Spatial agglomeration can promote exports within China’s wood-processing industry.
4. Data and Model
4.1. Modelling
To analyze the impact of the spatial agglomeration of China’s wood-processing industry on exports, we build the Model (1–2) based on research about the manufacturing industry by Wen et al. and the manufacturing of forest products by Li et al. [12,55]. We use Stata to realize the fixed effect and generalized method of moments (GMM) estimation to explore the potential of integrating spatial agglomeration to address the diminishing export growth. When the coefficient α1 is greater than 0, EXIN is positively correlated with γ, which means that the improvement in spatial agglomeration promotes exports, while the situation is the opposite when the coefficient α1 less than 0.
Here, i, r, and t represent industry, region, and year, respectively; EXIN is export intensity; γ is agglomeration index; west and cen are the dummy variables of the western and central regions, respectively; TFP is total factor productivity; Finance refers to financing capacity; KAIN is the capital intensity; Size refers to enterprise size; and Age is a business term.
4.2. Variables
4.2.1. Explained Variable: Export Intensity (EXIN)
Export intensity (EXIN), referred to as the degree of internationalization [56], is the ratio of exports to total sales of the enterprises. It is a crucial metric for understanding how an enterprise decides to balance its export and domestic sales [26]. As a proxy variable to measure the export performance of enterprises, export intensity is reflected by the share of export delivery value in industrial sales output value [34]. Wood-processing enterprises prioritize exporting more when their share is higher; conversely, when their share is lower, they prioritize domestic sales more. This shows the dependence of wood-processing enterprises on the international market [57].
4.2.2. Explanatory Variable: Spatial Agglomeration Index
Spatial agglomeration can be measured using a variety of techniques, including the spatial Gini coefficient G, location entropy, spatial agglomeration index EG [58], Herfindal index H, industrial concentration, K function method, L function method, D function method, and M function method. Through an in-depth comparative analysis of various methods, Liu found that the EG index not only reflects the current situation of geographical concentration, but also includes consideration of externalities and resource advantages, which is more comprehensive [59]. As the wood-processing industry is a resource-dependent industry [60], we use the spatial agglomeration index EG (also called γ) proposed by Ellison & Glaeser to quantify the spatial agglomeration of China’s wood-processing industry with enterprise-level data [61]. The formula used to calculate γ is provided as follows:
where r stands for region, i is industry, and j refers to enterprise.
is the original index of the industrial geographical concentration put forward by Ellison and Glaeser. Compared with the Gini coefficient proposed by Florence [62], has a similar economic effect but is easier to calculate and prove. The formula to calculate is provided as follows.
refers to the Herfindal index proposed by Herfindal in the 1950s, which is a comprehensive index used to measure industrial concentration, and its formula is provided as follows:
where is the ratio of employment in region r to the whole of China, which is an index measuring the population density in each region; is the proportion of employment in industry i in region r to the employment of industry i in China, measuring the regional distribution of employment in various industries; and is the proportion of employment of enterprise j in industry i to the employment of industry i, which used is to measure the size distribution of enterprises in industry i.
4.2.3. Control Variables
Total factor productivity (TFP). According to the New-New Trade Theory, there are trade barriers, such as transportation costs and marketing costs, in foreign markets; thus, wood-processing enterprises with higher productivity are more likely to choose to export, that is, the self-selection effect. Wood-processing enterprises with high productivity have a better chance of surviving the fierce international rivalry if they can afford to incur the sunk costs of entering the market abroad [63]. According to Melitz’s Heterogeneous Trade Theory, high-productivity enterprises can overcome sunk costs and join the global market, while low-productivity enterprises can only focus on domestic sales or even leave the market altogether [64]. Therefore, wood-processing enterprises with higher productivity are more likely to export [65]. Due to the influence of total factor productivity on export, this paper applies Formula (6) to calculate the total factor productivity according to Li and uses it as one of the control variables [66].
Financing capacity (Finance). The financing ability of an enterprise has a great influence on its export decision. The fixed sunk cost that enterprises need to pay for export is greatly influenced by borrowing capacity, and poor borrowing capacity will restrict the export capacity of wood-processing enterprises [67]. Whether businesses can engage in export depends critically on their capacity for financing [68]. This paper uses the ratio of enterprise interest expenditure to product sales income to measure the borrowing capacity of the wood-processing industry according to Ye et al. [43].
Capital intensity (KAIN). According to the New-New Trade Theory, the factors used by a country’s export enterprises are the main determinants of the factor intensity of export products. Ilmakunnas and Nurmi show that capital-intensive factories may enter the export market early and endure there for a longer period of time [69]. Although the wood-processing industry is labor-intensive, the capital intensity still has a large impact on its exports [70]. Therefore, we select the total number of fixed assets divided by employment in wood-processing enterprises to measure the capital intensity as a control variable.
Enterprise size (Size). According to the New Trade Theory represented by Krugman, the larger the enterprise, the more favorable it is to solve the liquidity and binding problems and various risks, thus making it more likely to participate in the international market [71]. According to the New-New Trade Theory, the size of the wood-processing enterprise has an important influence on its export. Greenaway and Kneller and Delgado et al. studied British and Spanish enterprises, respectively, and verified that the larger the size of the wood-processing enterprise is, the higher the export tendency is [72,73]. Ha et al. also demonstrated a significant positive correlation between enterprise size and export [74]. We use the logarithmic value of fixed assets of wood-processing enterprises to measure enterprise size.
Enterprise age (Age). The business years of enterprises have a positive impact on export. The longer the business life of an wood-processing enterprise, the more familiar it is with the domestic and foreign markets, the more honed its accumulated experience and sales channels [75], and the easier it is to enter the international market. Thus, age is regarded as a control variable.
Regional dummy variable (west, cen). The western region includes Shanxi, Sichuan, Yunnan, Guizhou, Guangxi, Gansu, Qinghai, Ningxia, Tibet, Xinjiang, Inner Mongolia, and Chongqing. The regional dummy variable of these twelve provinces (west) is 1, and others are 0. The central region includes six neighboring provinces: Shanxi, Henan, Anhui, Hubei, Jiangxi, and Hunan. The regional dummy variable of these six provinces (cen) is 1, and the others are 0. The eastern region includes Hebei, Beijing, Tianjin, Shandong, Jiangsu, Shanghai, Zhejiang, Fujian, Guangdong, Hainan, Taiwan, Hong Kong, and Macao.
4.3. Data Selection
This paper uses the data of China’s wood-processing enterprises in the Industrial Enterprise Database from 1999 to 2009, which mainly includes the enterprise’s ID, address, industry classification, registration type, affiliation, opening time, business status, and various economic indicators. The information of specific industries, provinces, and cities where enterprises are registered and the number of employees in China’s wood-processing industry over the years are extracted, and the spatial agglomeration of China’s wood-processing industry is measured by calculating the spatial agglomeration index γ. Because some data in the database are defective, we remove the observed values of duplicate enterprise codes, missing indicators, abnormal business status, and data points where the number of employees is 0. The excluded data are displayed in Table 1. The proportion of excluded samples is relatively small. Here, 1999 had the lowest percentage of the remaining businesses, but it was still as high as 97.59% of the total. In most years, the proportion of rest enterprises is about 99%. Therefore, the influence of removing data on the results is within the tolerance range, and the spatial agglomeration index calculated has a high degree of reliability.

Table 1.
The number and proportion of wood-processing enterprises used in the calculations.
After being first published in 1984, the China National Economic Industry Classification Standard was revised thrice in 1994, 2002, and 2011, separately. Therefore, during the research period, the codes of China’s wood-processing industry are inconsistent. In order to unify the industry code for analysis and measurement, this paper converts the industry code of the data from 2003 to 2009 into the industry code of GB/T4754-1994 [76]. After the conversion, the wood-processing industry includes three 3-digit and eight 4-digit manufacturing industries. China’s Administrative Division Code was also revised in 1995, 1999, 2002, and 2007. We use the area code conversion table of Wen and Xian to convert the administrative division codes from 1999 to 2002 and from 2004 to 2009 into the GB/T2260-2002 version [12,77]; thus, all enterprises have the same standard administrative division codes after conversion.
4.4. Measurement Results of the Spatial Agglomeration of China’s Wood-Processing Industry
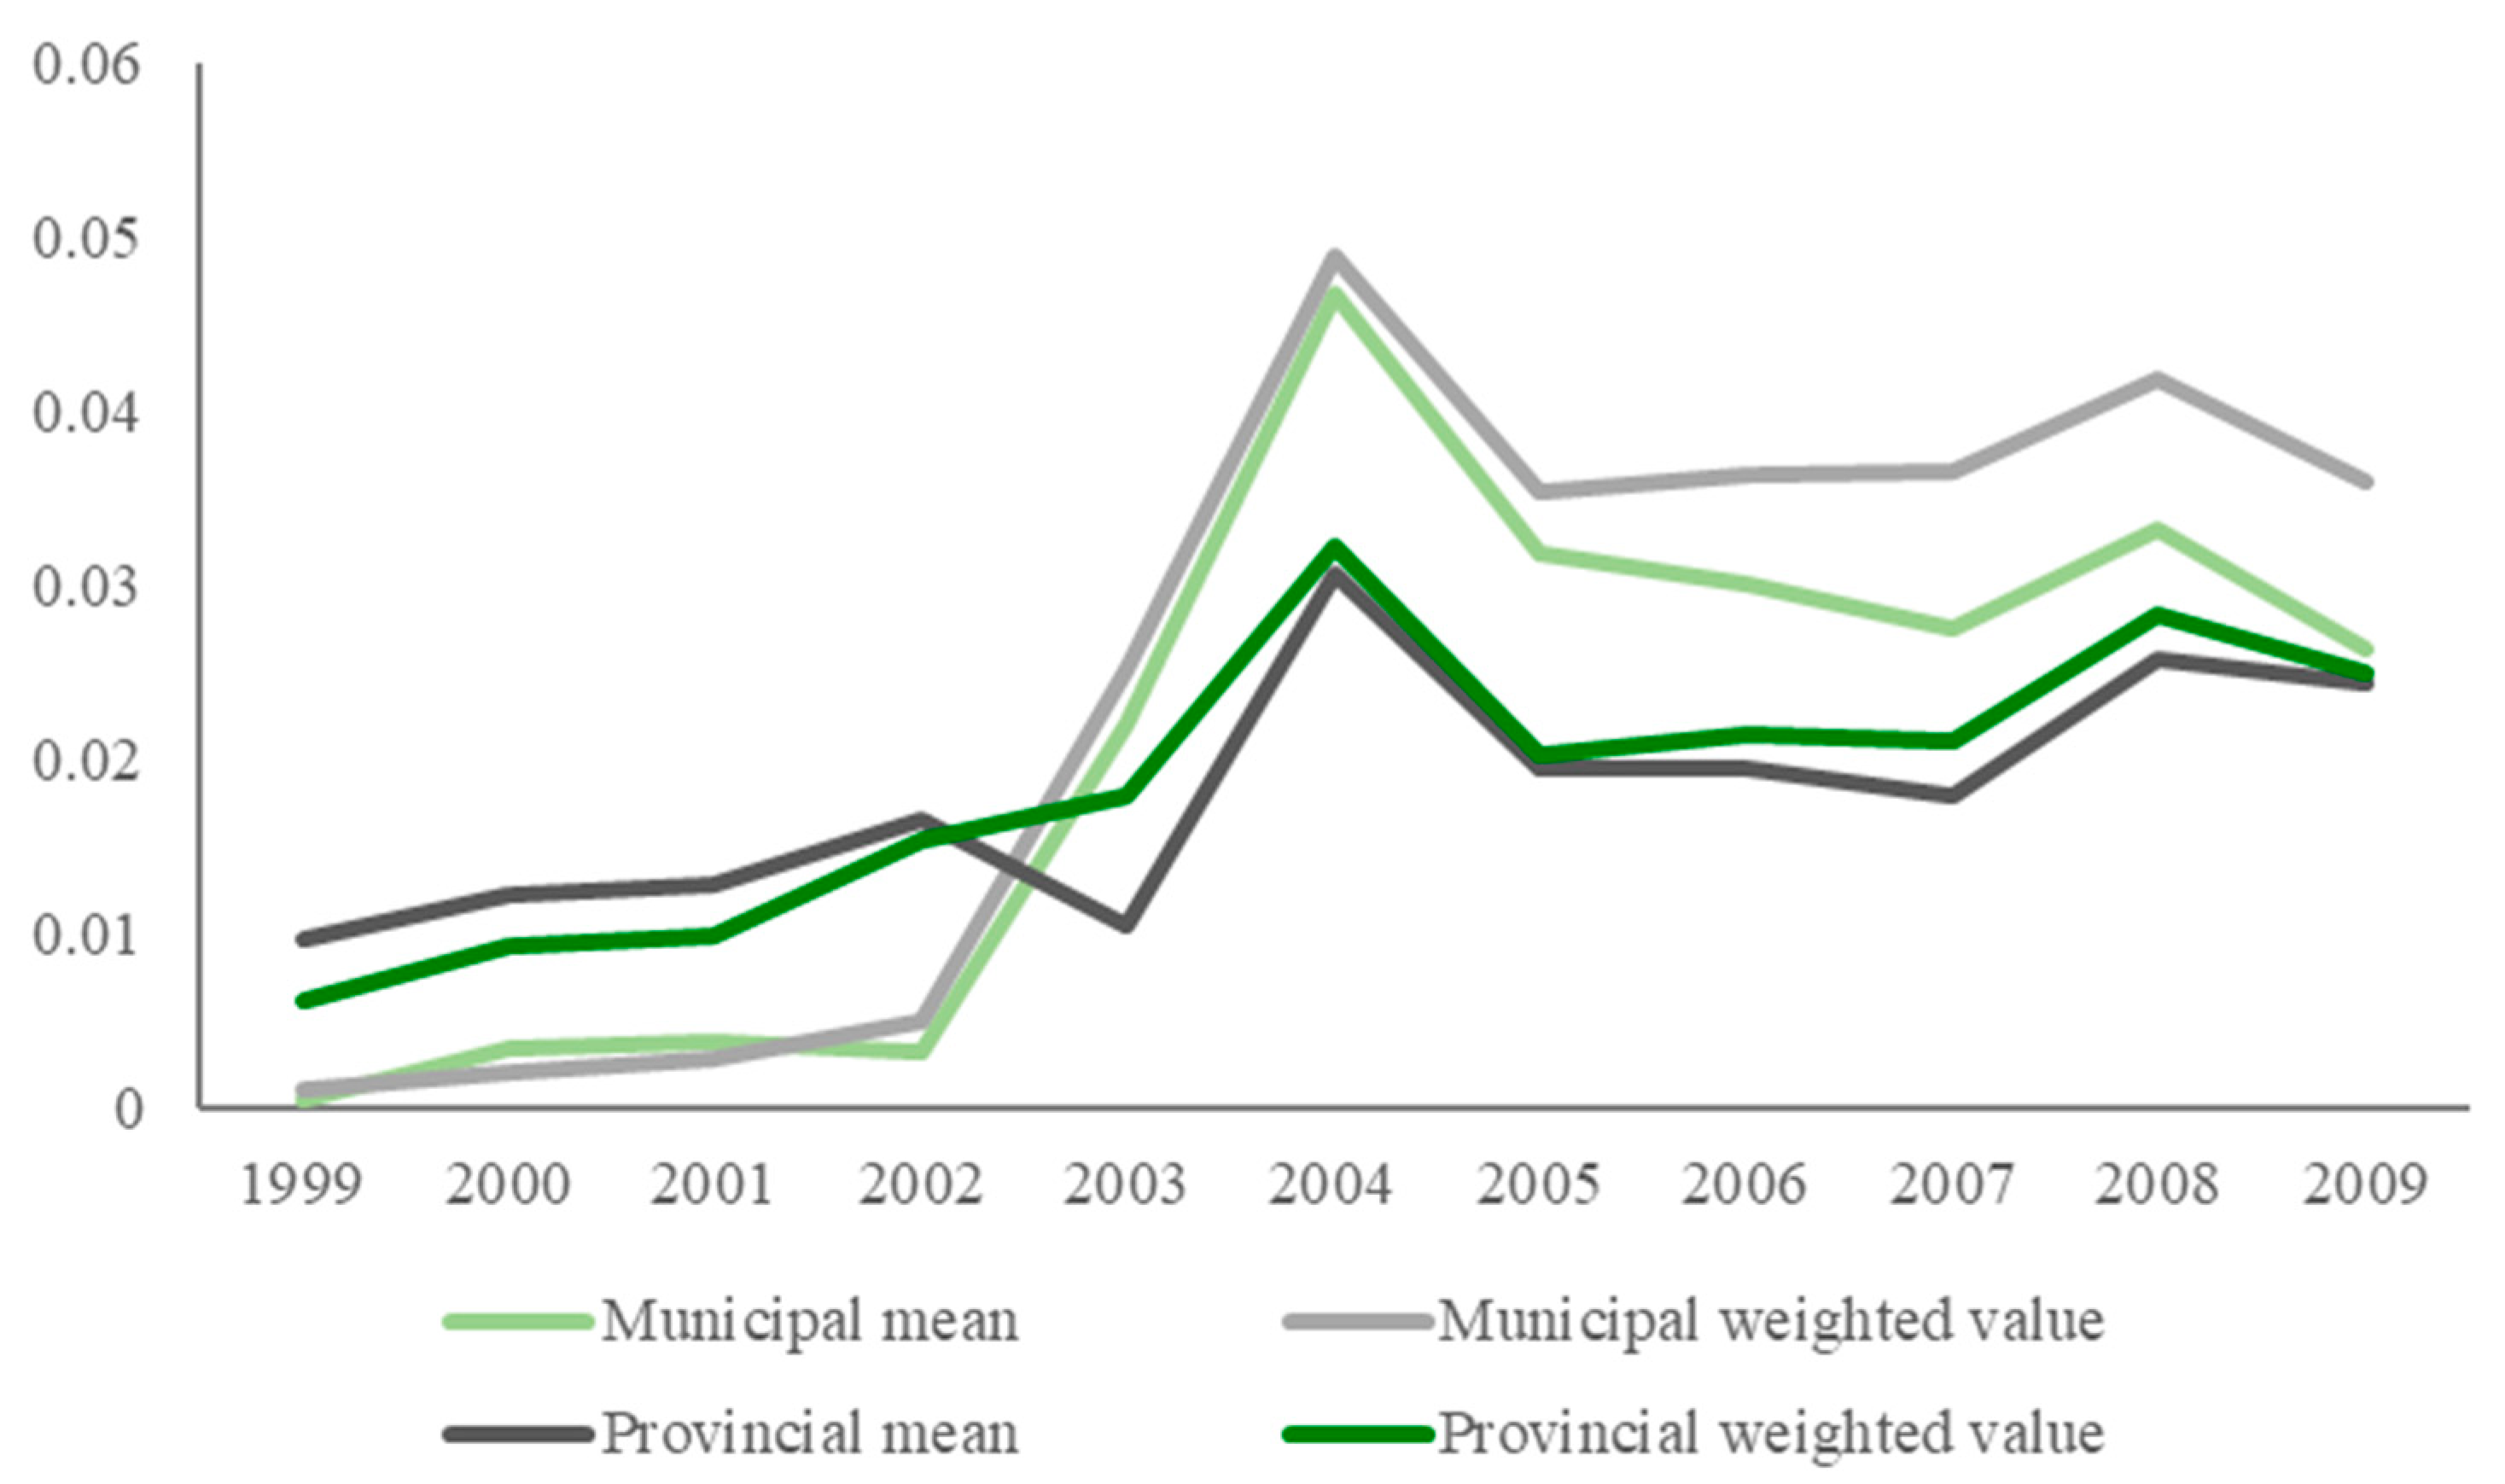
Figure 4 discloses the average of the index γ of the spatial agglomeration of China’s wood-processing industry and the weighted average value weighted by the proportion of employment. First, the spatial agglomeration index rose rapidly from 1999 to 2004, indicating that China’s wood-processing enterprises became more agglomerated from 1999 to 2004. After 2004, the spatial agglomeration index stopped increasing and began to fluctuate around a higher level, or even began to decline. Second, Figure 4 shows that the weighted average weighted by the proportion of employment is basically greater than the average since 2004, which indicates that the industries with a high spatial agglomeration index have a relatively large overall scale and a high share in China’s wood-processing industry after 2004.
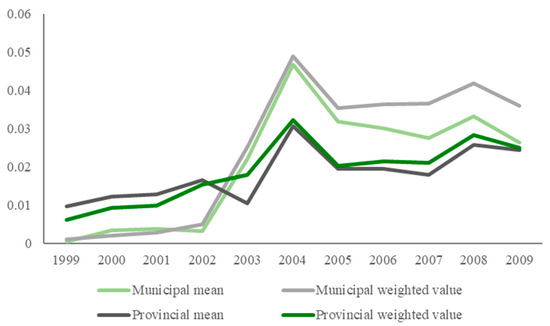
Figure 4.
Spatial agglomeration index of China’s wood-processing industry (average and weighted value). Source: China Industrial Enterprise Database.
Ellison and Glaeser classified the industrial agglomeration level into three categories according to the magnitude of γ: high agglomeration (High, γ > 0.05), moderate agglomeration (Mod, 0.02 ≤ γ ≤ 0.05), and low agglomeration (Low, γ < 0.02) [61]. Table 2 shows that in 1999, the proportion of highly agglomerated wood-processing industries was close to 0. In 2009, the proportion of highly agglomerated wood-processing industries was as high as 12.5%, while the proportion of highly agglomerated industries in the national manufacturing industry was only 10.51% in 2009 [12]. In addition, the wood-processing industry was about 2% above the manufacturing average. However, 37.5% of the four-digit industries in the wood-processing industry have a low agglomeration level, including the plywood manufacturing industry, fiberboard manufacturing industry and particleboard manufacturing. Therefore, most enterprises are still at the primary low agglomeration.
Table 2.
Comparison of China’s wood-processing industry and overall manufacturing distribution.
5. Empirical Results
5.1. Descriptive Statistics and Correlation Test
Descriptive statistics were calculated for the 41,264 data samples. It can be seen that the distribution of the data is reasonable, as shown in Table 3.
Table 3.
Descriptive statistics.
The correlation test aims at testing the degree of correlation between two variables. The greater the correlation coefficient is, the greater the correlation degree between the two variables is. Based on the results of the Pearson test, the correlation coefficient of sample data is within the acceptable range, as shown in Table 4.
Table 4.
Pearson test.
There is no correlation coefficient with an absolute value greater than 0.5, so multiple collinearity is not possible.
5.2. Regression Results
To investigate the influence of the spatial agglomeration of China’s wood-processing enterprises on their exports, the regression is performed based on 41,264 samples from China’s wood-processing industry from 1999 to 2009. Using the Houseman test, the P value is less than 0.01, which rejects the original hypothesis. Thus, we select the fixed effect estimation for regression on Model (1), and the results are shown in the first and second column of Table 5. Although the fixed effect estimation results can overcome the endogenous problem caused by missing variables to some extent, it is difficult to solve the simultaneous endogenous problem caused by the bidirectional causal relationship between the explanatory and explained variables. Theoretically, export may have a reverse effect on the spatial agglomeration of the wood-processing industry, so endogeneity may simultaneously exist. To eliminate the influence of simultaneous endogeneity, we use the GMM method, and the results are shown in the third column of Table 5. The regression on Model (2) is shown in the fourth column of Table 5.
Table 5.
Regression results.
EXIN represents the degree of internationalization of wood-processing enterprises. From the regression results of Model (1) in Table 5, γ has a significantly positive impact on EXIN at the level of 1% after adding the control variables, regardless of the fixed effect estimation in the first and second column of Table 5 or the GMM method in the third column of Table 5. The result verifies the hypothesis and shows that the improvement in spatial agglomeration will promote the export trade of wood-processing enterprises. However, there are two insignificant variables in this regression result, Finance and Age, and there is minimal difference in the regression result after removing these two variables, which shows that it is not necessary to focus on these two insignificant variables. The main raw materials of China’s wood-processing industry are logs and sawn timber, which are large in volume and quality and have high transportation costs. However, due to the scarcity of wood resources in China, logs and sawn timber are in short supply, so most of the raw materials of the wood-processing industry are imported. The improvement in spatial agglomeration can reduce the transportation costs of the raw materials produced by these enterprises to a certain extent, thus improving enterprise efficiency. Wood-processing enterprises invariably choose a certain area to set up factories mainly due to local preferential policies, proximity to ports, or proximity to raw material production places, reducing costs and other regional advantages. The improvement in spatial agglomeration has further deepened the advantages of these areas, so these wood-processing enterprises are more internationally competitive and more amenable to export. The results of this paper are similar to the conclusion on the relationship between the spatial agglomeration and the export of the manufacturing industry provided by Wen [12], indicating that the export trade of the wood-processing industry can be promoted by enhancing the level of spatial agglomeration of wood-processing enterprises.
According to the regression results of Model (2) in the fourth column of Table 5, it can be seen that γ is positively correlated with EXIN at the level of 1% after adding the dummy variables west and cen. Thus, the improvement in the agglomeration level of the wood-processing industry in the eastern region will accelerate the development of the export trade of the wood-processing enterprises. The interaction term γ×west is significantly positive, which means the improvement in the agglomeration level of the wood-processing industry in the western region serves as a greater impetus to the export trade. The interaction term γ×cen is positive, which also verifies the conclusion. The promotion is greater in the west than in the east, which may be because the labor and land cost in the western region is lower than that in the eastern region, which is more conducive to the development of enterprises in a labor-intensive industry.
The regression results in Table 5 show that TFP has a significant negative impact on EXIN at the level of 5%. It means the increase in productivity of wood-processing enterprises will inhibit exports when other conditions remain unchanged. The export status of China’s wood-processing enterprises is inconsistent with the New-New Trade Theory, with a “productivity paradox.” Specifically, enterprises with higher productivity are less likely to export, which indicates that China’s wood-processing enterprises have not utilized the productivity advantage to enter the international market. The following reasons may explain the “productivity paradox” in China’s wood-processing industry. First, because of rent-seeking and other factors, the cost of domestic purchasing and sales may be higher than that of foreign purchasing and sales; thus, some enterprises choose to enter the international market directly. Second, according to the development path of the wood-processing industry, small- and medium-sized enterprises in many industries directly export with the help of the comparative advantage of the low labor cost in China, without competing in the domestic market. Third, in order to ensure employment and solve the poverty problem, some domestic policies tend to protect these low-productivity and labor-intensive enterprises. Due to the implementation of government policies, it is difficult for China to establish a complete domestic market competition mechanism. Enterprises with low capital intensity export less, while enterprises with high capital intensity export more. The effect of Size on EXIN is significantly positive at the level of 1%. Thus, the larger the size of wood-processing enterprises, the higher the export intensity.
5.3. Robustness Test
There are substantial methods available to measure spatial agglomeration, and the principle of spatial Gini coefficient is similar to γ. Therefore, this paper chooses the Gini coefficient Gi as a proxy variable of the spatial agglomeration index to measure the level of spatial agglomeration to verify the robustness of the conclusion in variable selection, and the results are shown in the first column of Table 6. The regression results of the main explanatory variables are consistent with Table 5, so the conclusion is robust. To eliminate the possibility of significant regression results due to the particularity of data, we use the logit model for regression. The explained variable in Model (1) is replaced by the dummy variable EXIN. If the enterprise has no export business, the dummy variable EXIN is 0. Otherwise, it is 1. The regression results shown in the second column of Table 6 are basically the same as those in Table 5, so the regression results of this study are robust. In order to control the endogenous problems, this paper introduces the spatial agglomeration index lagging 1 period for the Robustness test. As shown in the third and fourth column of Table 6, there is a significant positive correlation between γ(t−1) and EXIN at the level of 1%, and a 1% increase in γ(t−1) will lead to a 0.24% increase in EXIN, which is similar to the results in Table 5. The results are robust.
Table 6.
Robustness test results.
6. Conclusions and Policy Implications
Based on Industrial Enterprise Database, we analyze the spatial-temporal evolution pattern of China’s wood-processing enterprises and further study the impact of spatial agglomeration on exports to explore the potential of integrating spatial agglomeration to address the diminishing export growth. The following conclusions are drawn.
First, rational utilization of the agglomeration effect can improve the export of China’s wood-processing industry. The results show that spatial agglomeration significantly promotes the export of China’s wood-processing industry, and the promotion effect brought by agglomeration is greater in the western region than in the eastern region. It can maximize the cost advantage brought by spatial agglomeration, improve the competitiveness of enterprises, and promote the export of the wood-processing industry, especially in the western region. Second, the spatial agglomeration of China’s wood-processing industry holds significant potential for improvement. It is found that the spatial agglomeration of China’s wood-processing industry increased rapidly and substantially from 1999 to 2004. After 2004, the spatial agglomeration remained stable within a small range of fluctuations or even declined. Meanwhile, most sub-sectors of the wood-processing industry are at the primary agglomeration level, indicating significant potential for improvement and further development. Third, the area where China’s wood-processing industry agglomerated gradually shifted from the northeast to the eastern coast from 1999 to 2009. A possible reason is that since half of China’s wood raw material supply comes from imports, joining the WTO further amplifies the port advantages of the eastern coastal areas. The north–south distribution of China’s wood-processing industry was more concentrated than the east–west distribution. Fourth, due to transaction costs, the development path, and policy orientation, the export status of China’s wood-processing enterprises is inconsistent with the New-New Trade Theory, exhibiting a “productivity paradox” whereby enterprises with higher productivity are less likely to export.
According to the results, we put forward the following policy implications. First, the spatial agglomeration effect should be strategically leveraged. Although China is still the world’s largest producer of wood-based panels, attention should be paid to the declining export growth within the wood-processing industry. We found that rational utilization of the agglomeration effect can improve the export of China’s wood-processing industry, and the spatial agglomeration of sub-sectors in the wood-processing industry has not reached the optimal level. Hence, China’s wood-processing industry should utilize the production conditions of industrial parks to further expand existing clusters. This involves consolidating the existing industrial clusters and strategically establishing new industrial parks. Second, agglomeration of wood-processing enterprises in the western region should be stimulated. We found that the current wood-processing industry is mainly agglomerated in the eastern region. However, the agglomeration effect is greater in the western region than in the eastern region. Therefore, entrepreneurs preparing to set up new wood-processing plants should seize the opportunity to find a higher agglomeration effect in the west. Third, the competition of enterprises should be guided. The existence of the ‘productivity paradox’ shows that China’s low-tech manufacturing industry has not fully utilized the advantages of productivity and capital intensity to enter the international market, only with the advantage of low prices. However, price competition cannot enhance enterprise competitiveness, which is difficult to achieve the goal of getting bigger and stronger through the international market. The low-tech manufacturing industry should actively solve the problems, change the status, and finally improve the productivity advantage. Under the gradual loss of labor cost advantage, China should further boost the spatial agglomeration and enterprise productivity of low-tech manufacturing industries and increase the export competitiveness of low-tech industries, such as the wood-processing industry.
This paper focuses on the impact of agglomeration on exports within China’s wood-processing industry. However, faced with increasingly severe export competition, considering the role of spatial agglomeration in promoting exports, we have not made an in-depth empirical analysis on the issues, namely, whether mergers and acquisitions, realizing the scale operation and utilizing the scale economy, can improve the product quality of low-tech manufacturing industries and thus enhance their international competitiveness. These problems have a strong significance for the trend and policy orientation of China’s low-tech manufacturing industry, which deserves further study.
Author Contributions
Conceptualization, S.W.; Data curation, C.T. and Z.W.; Methodology, C.T.; Writing—original draft, C.T., F.C., Q.Z. and S.W.; Formal analysis, L.L.; Visualization, Q.Z.; Writing—review & editing, C.T., B.C., L.L. and C.Y.; Supervision, B.C.; Funding, B.C. and C.Y. All authors have read and agreed to the published version of the manuscript.
Funding
This research was supported by China Postdoctoral Science Foundation (2023M741153), the National Natural Science Foundation of China (72003013), and the Fundamental Research Funds for the Central Universities (2023MS040 and 2023SKY20).
Data Availability Statement
Data are available upon request.
Conflicts of Interest
The authors declare no conflicts of interest.
References
- Barbu, M.C.; Tudor, E.M. State of the art of the Chinese forestry, wood industry and its markets. Wood Mater. Sci. Eng. 2021, 16, 1030–1039. [Google Scholar] [CrossRef]
- Bottelier, P. China, the Financial Crisis, and Sino-American Relations. Asia Policy 2010, 9, 121–130. [Google Scholar] [CrossRef]
- Felzensztein, C.; Gimmon, E.; Carter, S. Geographical Co-Location, Social Networks and Inter-firm Marketing Co-operation: The Case of the Salmon Industry. Long Range Plan. 2010, 43, 675–690. [Google Scholar] [CrossRef]
- Geldes, C.; Felzensztein, C.; Turkina, E.; Durand, A. How does proximity affect interfirm marketing cooperation? A study of an agribusiness cluster. J. Bus. Res. 2015, 68, 263–272. [Google Scholar] [CrossRef]
- Henderson, J.V. Urban Development: Theory, Fact, and Illusion; Oxford University Press: Oxford, UK, 1991. [Google Scholar]
- Li, G.; Yang, Y.; Lou, X.; Wei, Y.; Huang, S. Evaluation and spatial agglomeration analysis of the green competitiveness of China’s manufacturing industry at the provincial level. PLoS ONE 2021, 16, e0246351. [Google Scholar] [CrossRef] [PubMed]
- Chakraborty, S.; Maity, I.; Patel, P.P.; Dadashpoor, H.; Pramanik, S.; Follmann, A.; Novotný, J.; Roy, U. Spatio-temporal patterns of urbanization in the Kolkata Urban Agglomera-tion: A dynamic spatial territory-based approach. Sustain. Cities Soc. 2021, 67, 102715. [Google Scholar] [CrossRef]
- Kies, U.; Mrosek, T.; Schulte, A. Spatial analysis of regional industrial clusters in the German forest sector. Int. For. Rev. 2009, 11, 38–51. [Google Scholar] [CrossRef]
- Koh, L.; Orzes, G.; Jia, F.J. The fourth industrial revolution (Industry 4.0): Technologies disruption on operations and supply chain management. Int. J. Oper. Prod. Manag. 2019, 39, 817–828. [Google Scholar] [CrossRef]
- Bai, C.E.; Du, Y.; Tao, Z.; Tong, S.Y. Local protectionism and regional specialization: Evidence from China’s industries. J. Int. Econ. 2004, 63, 397–417. [Google Scholar] [CrossRef]
- Lu, J.; Tao, Z. Trends and determinants of China’s industrial agglomeration. J. Urban Econ. 2009, 65, 167–180. [Google Scholar] [CrossRef]
- Wen, D.; Xian, G. Spatial agglomeration and export of China’s manufacturing industry: A study based on enterprise level. J. Manag. World 2014, 10, 57–74. [Google Scholar]
- Chen, X.; Qiu, B.; Liu, X. Spatial Agglomeration and Firm Exports: An Empirical Study Based on China Industrial Firms. J. World Econ. 2016, 8, 94–117. [Google Scholar]
- Young, A. The Razor’s Edge: Distortions and Incremental Reform in the People’s Republic of China. Q. J. Econ. 2000, 115, 1091–1135. [Google Scholar] [CrossRef]
- Fan, J.; Feng, M.; Li, F. Industrial agglomeration and total factor productivity of enterprises. J. World Econ. 2014, 5, 51–73. [Google Scholar]
- Luo, Y.; Gu, R. The Pattern and Evolutional Trend of Chinese Manufacturing’s Spatial Agglomeration—An Empirical Analysis Based on Data from 1980 to 2011. Econ. Geogr. 2014, 3407, 82–89. [Google Scholar]
- Liu, M. Spatial Agglomeration and Manufacturing Growth in China—Based on Provincial Data from 2008 to 2013. Inq. Econ. Issues 2017, 5, 182–190. [Google Scholar]
- Cheng, B.; Song, W.; Cao, W. Sustainable Development of Zhejiang Timber Industry. China Population. Resour. Environ. 2008, 18, 203–206. [Google Scholar]
- Zhou, Z.; Xiao, P. The Situation Analysis and Development Outlook on China’s Furniture Manufacturing Cluster. Issues For. Econ. 2009, 29, 274–277. [Google Scholar]
- Li, X.; Nie, H. A Comparative Study of the Factors Affecting Chinese Sawn Timber and Wood Chips Industrial Agglomeration. For. Econ. 2012, 8, 41–43. [Google Scholar]
- Zhao, D. Forestry Industrial Agglomeration Level in China. Guizhou Agric. Sci. 2015, 43, 257–261. [Google Scholar]
- Huang, S.; Wang, G.; Deng, X.; Chen, J. Variation Analysis of Spatial Pattern and Regional Distribution of Forestry Production Efficiency in China. World For. Res. 2016, 29, 80–85. [Google Scholar]
- Wei, S.; Zong, G. Spatial econometric analysis of China’s forestry industry agglomeration. Stat. Decis. 2017, 8, 130–133. [Google Scholar]
- Chen, Z.; Zhu, H.; Zhao, W.; Zhao, M.; Zhang, Y. Spatial agglomeration of China’s forest products manufacturing industry: Measurement, characteristics and determinants. Forests 2021, 12, 1006. [Google Scholar] [CrossRef]
- Ellison, G.; Fudenberg, D. Knife-Edge or Plateau: When Do Market Models Tip? Q. J. Econ. 2003, 118, 1249–1278. [Google Scholar] [CrossRef]
- Glaeser, E.; Gottlied, J. The Wealth of Cities: Agglomeration Economies and Spatial Equilibrium in the United States. J. Econ. Literrature 2009, 47, 983–1028. [Google Scholar] [CrossRef]
- Marshall, A. Principles of Economics; Palgrave Macmillan: London, UK, 1920. [Google Scholar]
- Nicholson, J.; Gimmon, E.; Felzensztein, C. Economic geography and business networks: Creating a dialogue between disciplines. Ind. Mark. Manag. 2017, 61, 4–9. [Google Scholar] [CrossRef]
- Alcácer, J.; Chung, W. Location strategies and knowledge spillovers. Manag. Sci. 2007, 53, 760–776. [Google Scholar] [CrossRef]
- Carlino, G.A.; Chatterjee, S.; Hunt, R.M. Urban density and the rate of invention. J. Urban Econ. 2007, 61, 389–419. [Google Scholar] [CrossRef]
- Harrison, B. Industrial districts: Old wine in new bottles? Reg. Stud. 2007, 26, 469–483. [Google Scholar] [CrossRef]
- Felzensztein, C.; Brodt, S.E.; Gimmon, E. Do strategic marketing and social capital really matter in regional clusters? Lessons from an emerging economy of Latin America. J. Bus. Res. 2014, 67, 498–507. [Google Scholar] [CrossRef]
- Johanson, J.; Vahlne, J.E. The Uppsala internationalization process model revisited: From liability of foreignness to liability of outsidership. J. Int. Bus. Stud. 2009, 40, 1411–1431. [Google Scholar] [CrossRef]
- Fernhaber, S.; Gilbert, B.; Mcdougal, P. International entrepreneurship and geographic location: An empirical examination of new venture internationalization. J. Int. Bus. Stud. 2008, 39, 267–290. [Google Scholar] [CrossRef]
- Pino, C.; Felzensztein, C.; Zwerg-Villegas, A.M.; Arias-Bolzmann, L. Non-technological innovations: Market performance of exporting firms in South America. J. Bus. Res. 2016, 69, 4385–4393. [Google Scholar] [CrossRef]
- Folta, T.B.; Cooper, A.C.; Baik, Y. Geographic cluster size and firm performance. J. Bus. Ventur. 2006, 21, 217–242. [Google Scholar] [CrossRef]
- Tong, J.; Liu, Z. Geographical agglomeration and export choice of enterprises: A study based on the dependence of foreign capital financing. J. World Econ. 2014, 7, 67–85. [Google Scholar]
- Ellison, G.; Glaeser, E.L.; Kerr, W.R. What causes industry agglomeration? Evidence from coagglomeration patterns. Am. Econ. Rev. 2010, 100, 1195–1213. [Google Scholar] [CrossRef]
- Long, C.; Zhang, X. Cluster-based industrialization in China: Financing and performance. Ifpri Discuss. Pap. 2009, 84, 112–123. [Google Scholar] [CrossRef]
- Zhao, H.; Zou, S. The impact of industry concentration and firm location on export propensity and intensity: An empirical analysis of Chinese manufacturing firms. J. Int. Mark. 2002, 10, 52–71. [Google Scholar] [CrossRef]
- Becchetti, L.; Rossi, S.P.S. The positive effect of industrial district on the export performance of Italian firms. Rev. Ind. Organ. 2000, 16, 53–68. [Google Scholar] [CrossRef]
- Cai, F. Demographic Transition, Demographic Dividend, and Lewis Turning Point in China. Econ. Res. J. 2010, 45, 4–13. [Google Scholar] [CrossRef]
- Ye, N.; Bao, Q.; Shao, M. Spatial agglomeration, market congestion and excessive expansion of China’s export enterprises. J. Manag. World 2014, 1, 58–72. [Google Scholar]
- Estrada, I.; Faems, D.; de Faria, P. Coopetition and product innovation performance: The role of internal knowledge sharing mechanisms and formal knowledge protection mechanisms. Ind. Mark. Manag. 2016, 53, 56–65. [Google Scholar] [CrossRef]
- Brache, J.; Felzensztein, C. Geographical co-location on Chilean SME’s export performance. J. Bus. Res. 2019, 105, 310–321. [Google Scholar] [CrossRef]
- Broersma, L.; Oosterhaven, J. Regional Labor Productivity in the Netherlands: Evidence of Agglomeration and Congestion Effects. J. Reg. Sci. 2009, 49, 483–511. [Google Scholar] [CrossRef]
- Rizov, M.; Oskam, A.; Walsh, P. Is There a Limit to Agglomeration? Evidence from Productivity of Dutch Firms. Reg. Sci. Urban Econ. 2012, 42, 595–606. [Google Scholar] [CrossRef]
- Niosi, J.; Bas, T.G. The competencies of regions–Canada’s clusters in biotechnology. Small Bus. Econ. 2001, 17, 31–42. [Google Scholar] [CrossRef]
- Kukalis, S. Agglomeration economies and firm performance: The case of industry clusters. J. Manag. 2010, 36, 453–481. [Google Scholar] [CrossRef]
- Lang, L.; Li, X. Analysis of the Nonlinear Impact of Spatial Agglomeration on Manufacturing Exports and Its Heterogeneity Based on the Perspective of Scale Effect and Crowding Effect. J. Beijing Inst. Technol. (Soc. Sci. Ed.) 2021, 23, 89–98. [Google Scholar]
- Cheng, B.; Song, W. Industrial cluster and the competitiveness of Chinese timber industry. J. Beijing For. Univ. 2006, S2, 149–154. [Google Scholar]
- Lv, L.; Zhang, Z.; Lu, X. Analysis on Four Chinese Large Wood-based Panel Industrial Clusters. For. Econ. 2010, 11, 52–57. [Google Scholar]
- Li, L.; Tao, C.; Cheng, B. Empirical study on spatial agglomeration of paper industry in China. For. Econ. 2017, 39, 40–44. [Google Scholar]
- Ma, A.C. Export Spillovers to Chinese Firms: Evidence from Provincial Data. J. Chin. Econ. Bus. Stud. 2006, 4, 127–149. [Google Scholar] [CrossRef]
- Li, L.; Li, F.; Tao, C.; Cheng, B. The impact of spatial agglomeration on export of forest products manufacturing in China: Evidence from enterprises’ data. J. Sustain. For. 2019, 38, 743–754. [Google Scholar] [CrossRef]
- Boehe, D. Collaborate at home to win abroad: How does access to local network resources influence export behavior? J. Small Bus. Manag. 2013, 51, 167–182. [Google Scholar] [CrossRef]
- Elango, B.; Pattnaik, C. Building capabilities for international operations through networks: A study of Indian firms. J. Int. Bus. Stud. 2007, 38, 541–555. [Google Scholar] [CrossRef]
- Stejskal, J. Analysis of the applicability of selected methods for industrial clusters identifying. Int. J. Syst. Appl. Eng. Dev. 2011, 5, 255–262. [Google Scholar]
- Liu, C. The evaluation methods of the geographic concentration of industries. Econ. Geogr. 2006, 26, 742–747. [Google Scholar]
- Luo, Y.; Zhao, W.; Cheng, B.; Tao, C. The Influence of GVC Participation and Division of Labor Status on the Comparative Advantage of China’s Wood-Based Panel Industry. Forests 2023, 14, 2419. [Google Scholar] [CrossRef]
- Ellison, G.; Glaeser, E.L. Geographic Concentration in U.S. Manufacturing Industries: A Dartboard Approach. Soc. Sci. Electron. Publ. 1997, 105, 889–927. [Google Scholar] [CrossRef]
- Florence, P.S.; Baldamus, W. Investment, location, and size of plant. Rev. Econ. Stat. 1948, 1, 110. [Google Scholar]
- Bernard, A.B.; Jensen, J.B.; Redding, S.J.; Schott, P.K. Firms in International Trade. J. Econ. Perspect. 2007, 21, 105–130. [Google Scholar] [CrossRef]
- Melitz, M.J. The Impact of Trade on Intra-Industry Re-Allocation and Aggregate Industrial Productivity. Econometrica 2003, 71, 1695–1725. [Google Scholar] [CrossRef]
- Roelfsema, H.; Findlay, C.; Ye, X. Decomposing International Trade in Commercial Services. Foreign Trade Rev. 2021, 56, 238–256. [Google Scholar] [CrossRef]
- Li, C. Is there a productivity paradox in China’s export enterprises? A test based on the data of China’s manufacturing enterprises. J. World Econ. 2010, 7, 64–81. [Google Scholar]
- Askenazy, P.; Caldera, A.; Gaulier, G.; Irac, D. Financial constraints and foreign market entries or exits: Firm-level evidence from France. Rev. World Econ. 2015, 151, 231–253. [Google Scholar] [CrossRef]
- Kumarasamy, D.; Singh, P. Access to finance, financial development and firm ability to export: Experience from Asia–Pacific countries. Asian Econ. J. 2018, 32, 15–38. [Google Scholar] [CrossRef]
- Ilmakunnas, P.; Nurmi, S. Dynamics of export market entry and exit. Scand. J. Econ. 2010, 112, 101–126. [Google Scholar] [CrossRef]
- Lin, M. The Conflict between Technology and Scale: Evidence from China’s Wooden Furniture Industry. Sustainability 2022, 15, 230. [Google Scholar] [CrossRef]
- Krugman, P. Increasing Returns and Economic Geography. J. Political Econ. 1991, 99, 483–499. [Google Scholar] [CrossRef]
- Greenaway, D.; Kneller, R. Exporting and Productivity in the United Kingdom. Oxf. Rev. Econ. Policy 2004, 20, 358–371. [Google Scholar] [CrossRef]
- Delgado, M.A.; Farinas, J.C.; Ruano, S. Firm Productivity and Export Markets: A Non-parametic Approach. J. Int. Econ. 2002, 57, 397–422. [Google Scholar] [CrossRef]
- Ha VT, C.; Holmes, M.J.; Le, T.M. Firms and export performance: Does size matter? J. Econ. Stud. 2020, 47, 985–999. [Google Scholar]
- Zou, S.; Stan, S. The determinants of export performance: A review of the empirical literature between 1987 and 1997. Int. Mark. Rev. 1998, 15, 333–356. [Google Scholar] [CrossRef]
- GB/T4754-1994; PRC State Administration of Quality Supervision and Quarantine, Standardization Administration of the People’s Republic of China. Classification and Codes of National Economic Sectors. China Standards Press: Beijing, China, 1994.
- GB/T2260-2002; PRC State Administration of Quality Supervision and Quarantine. Codes for the Administrative Divisions of the People’s Republic of China. China Standards Press: Beijing, China, 2002.
Disclaimer/Publisher’s Note: The statements, opinions and data contained in all publications are solely those of the individual author(s) and contributor(s) and not of MDPI and/or the editor(s). MDPI and/or the editor(s) disclaim responsibility for any injury to people or property resulting from any ideas, methods, instructions or products referred to in the content. |
© 2024 by the authors. Licensee MDPI, Basel, Switzerland. This article is an open access article distributed under the terms and conditions of the Creative Commons Attribution (CC BY) license (https://creativecommons.org/licenses/by/4.0/).